

PROPOSED
ACTUAL
COMMENTS
106 participants, 5
-8 villages
124
participants
Increased number of
participants across 5 villages
20ha
37,2ha
Increase in area planted
11 fodder trials
16 fodder
trials
Lespedeza, tall fescue, turnip,
sorghum, cow peas
Runoff replenishment:
500
000L/ha
240
000L/ha
Lower than expected dee to
flooding
Wateraccess:20households
64
households
More householdsinvolved
Wateraccessquantity:7300kL
3700kL
Lower availability of water
–
still in progress
Waterproductivity
replenishment: 8 million L
7 million L
Slightly lower than expected
–
due to flooding

Outcome
Activities
Progress
(Milestone3)
CA
with
VWB
for
reduced
runoff
and
water
productivity
Development
ofCA
farmer
level
trialsfor a minimum
25
participants
with
measurement
ofrun-
off,
rainfall,
bulk
density,
evapotranspiration
and
water
productivity
for
around
8-12participants.
ü
CAacross5villages:22CMTsplus102
farmer
managedtrials. cropgrowthmonitoring (
124
participantsintotal)
ü
CAtrials(12,4ha),CAtotal(37,2ha),
planned
andplantedforyr2
ü
Runoff andrainfallresultscompiledfor
8
participants,yr1, 5 participantsyr2
ü
Soilsamplesyr1: (17CMTsand5
other
participants)analysed.
ü
BulkdensityandWPundertakenfor
8
participants(SamplinginMay’23)
Inclusion
of arange
of
options
for
cropping
different
varietiesof
maize,
legumes
andcovercrops
.
Measurement
of
cropping
areas,
cropgrowthand
yield
for
aminimumof
75
participants
ü
Rangeoftrialsincludingremedialfenced
and
foddertrialsalongsidestripcroppingand
block
trialsforintercroppingandcroprotation
ü
Yieldmeasurementsfor25CMTSand
50
participants(overall75participants)_May’23
Fodder
supplementation
farmer
level
experiments
undertaken
for a
minimum
of
11participants
with
monitoring
ofgrowth,
yield
and
animal
condition
scoring
ü
Foddersupplementationtrialsplanted
and
monitoredfor 9 participantsyr1 and16foryr2.
ü
Fodderbiomassandfeedqualityanalysis
ü
Foddersupplementationexperimentation–
7
participants
ü
Foddersupplementationw/sforplanning
and
reviewplannedinJune/July
Outcome
Activities
Progress
(Milestone3)
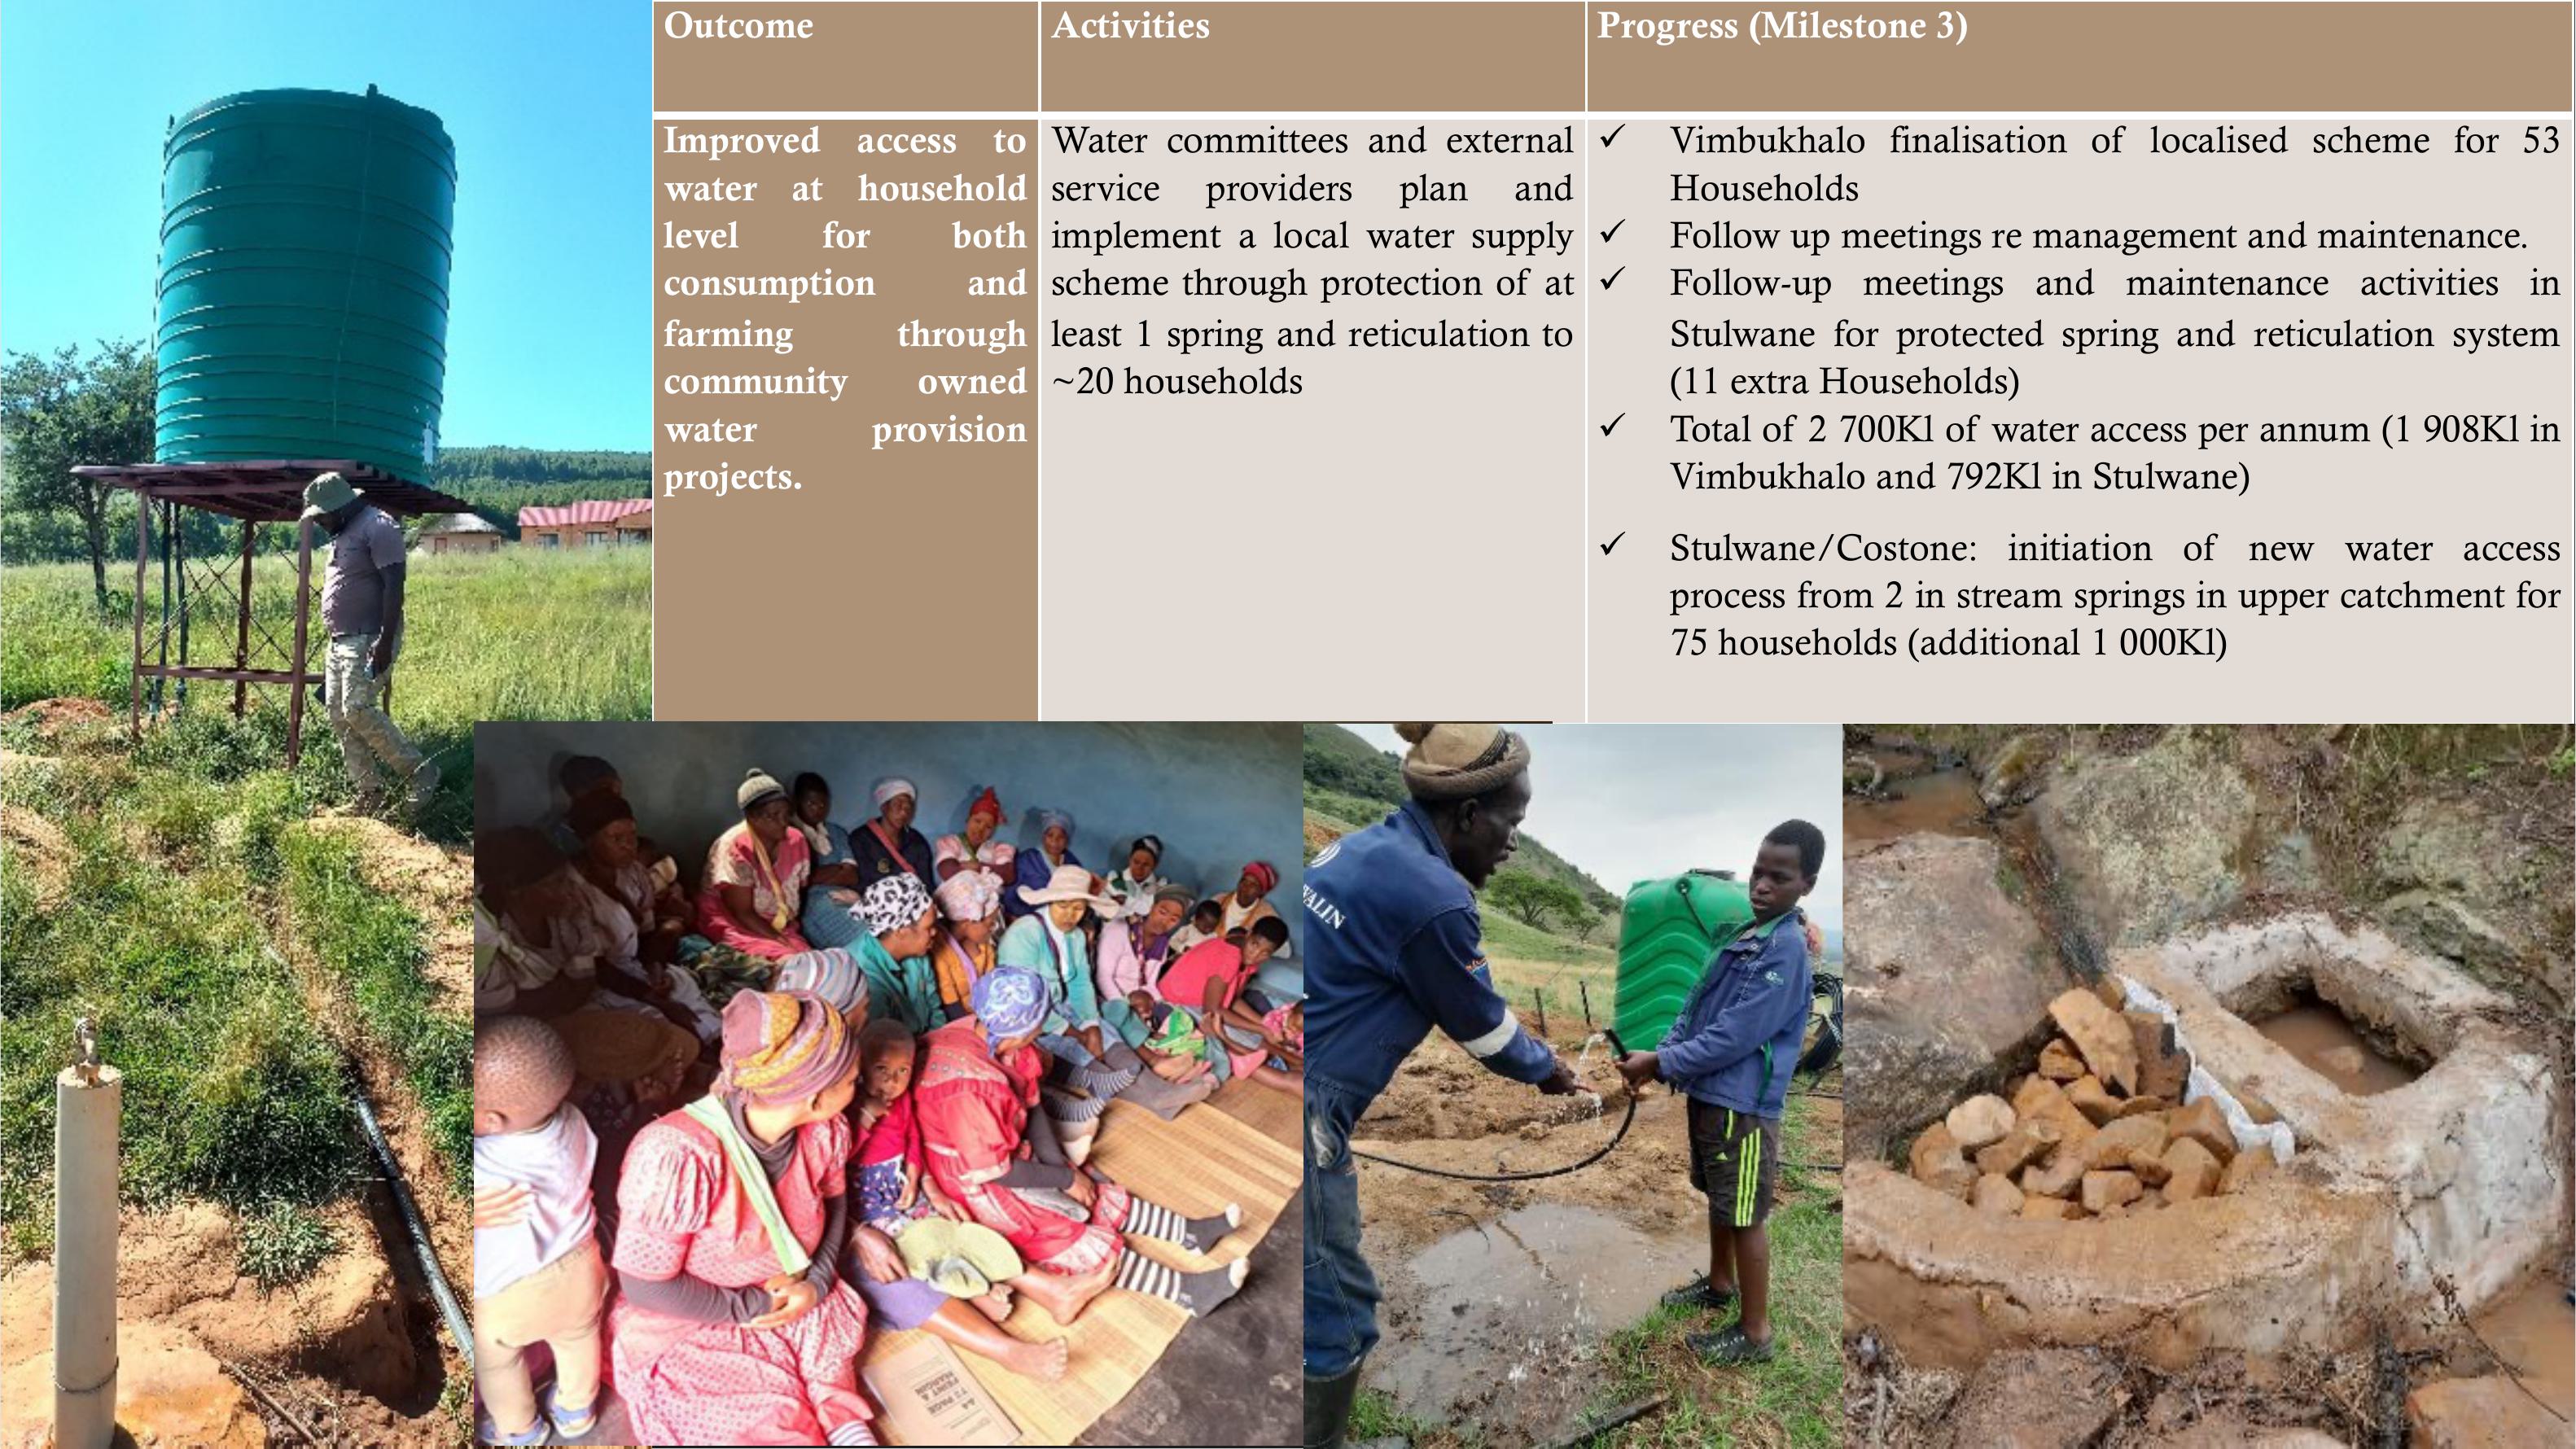
Improved
access
to
water
at
household
level
for
both
consumption
and
farming
through
community
owned
water
provision
projects
.
Water
committeesand
external
service
providersplan
and
implement
a localwater
supply
scheme
throughprotectionof
at
least
1 springandreticulation
to
~
20households
ü
Vimbukhalofinalisationoflocalisedschemefor
53
Households
ü
Followupmeetingsremanagementandmaintenance.
ü
Follow-upmeetingsandmaintenanceactivities
in
Stulwaneforprotectedspringandreticulation
system
(11extraHouseholds)
ü
Totalof 2700Klofwateraccessperannum(1 908Kl
in
Vimbukhaloand792KlinStulwane)
ü
Stulwane/Costone: initiationofnewwater
access
processfrom 2instreamspringsinuppercatchment
for
75households(additional 1 000Kl)
Outcome
Activities
Progress
(Milestone3)
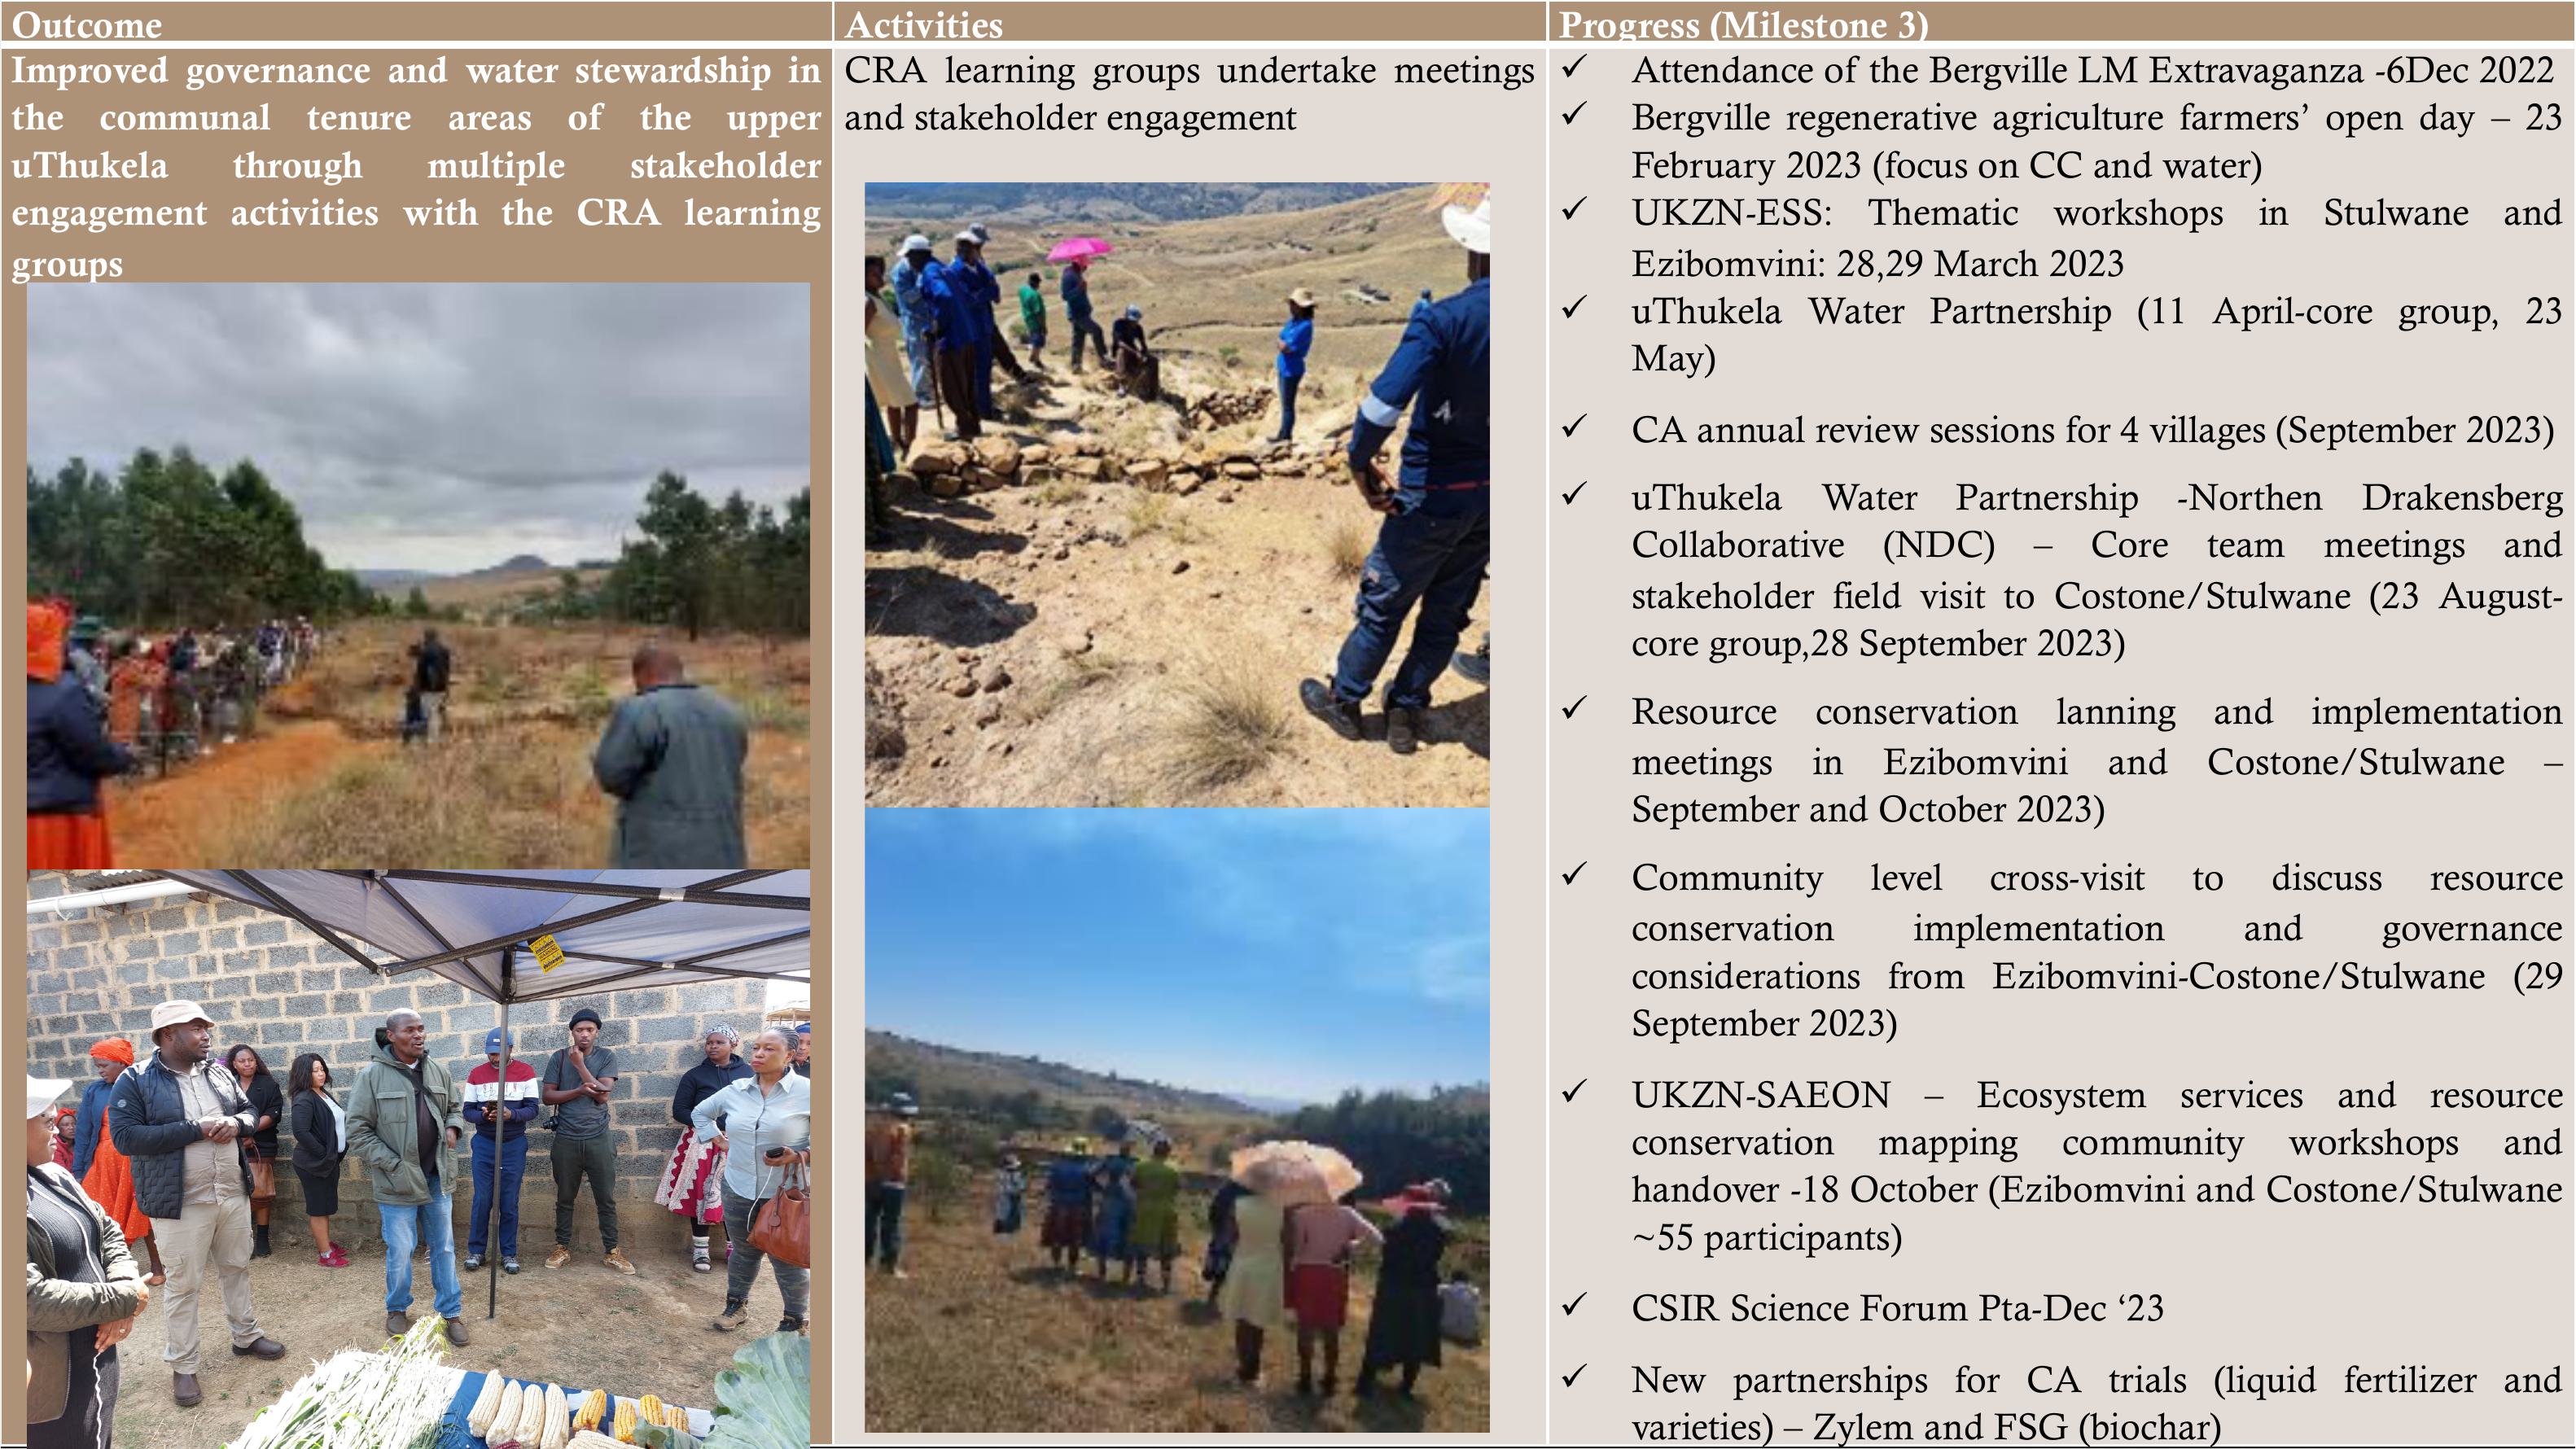
Improved
governanceandwaterstewardship
in
the
communaltenureareasofthe
upper
uThukela
throughmultiple
stakeholder
engagement
activitieswiththeCRA
learning
groups
CRA
learninggroupsundertake
meetings
and
stakeholderengagement
ü
AttendanceoftheBergvilleLMExtravaganza -6Dec
2022
ü
Bergvilleregenerativeagriculturefarmers’openday–
23
February2023(focusonCCandwater)
ü
UKZN-ESS: ThematicworkshopsinStulwane
and
Ezibomvini: 28,29March2023
ü
uThukelaWaterPartnership(11April-coregroup,
23
May)
ü
CAannualreviewsessionsfor 4 villages(September2023
)
ü
uThukelaWaterPartnership-Northen
Drakensberg
Collaborative(NDC)– Coreteammeetings
and
stakeholderfieldvisittoCostone/Stulwane(23August
-
coregroup,28September2023)
ü
Resourceconservationlanningand
implementation
meetingsinEzibomviniandCostone/Stulwane
–
SeptemberandOctober2023)
ü
Communitylevelcross-visittodiscuss
resource
conservationimplementationand
governance
considerationsfromEzibomvini-Costone/Stulwane(
29
September2023)
ü
UKZN-SAEON –Ecosystemservicesand
resource
conservationmappingcommunityworkshops
and
handover-18October (EzibomviniandCostone/
Stulwane
~55participants)
ü
CSIRScienceForumPta-Dec ‘23
ü
NewpartnershipsforCAtrials(liquidfertilizer
and
varieties) – ZylemandFSG(biochar)
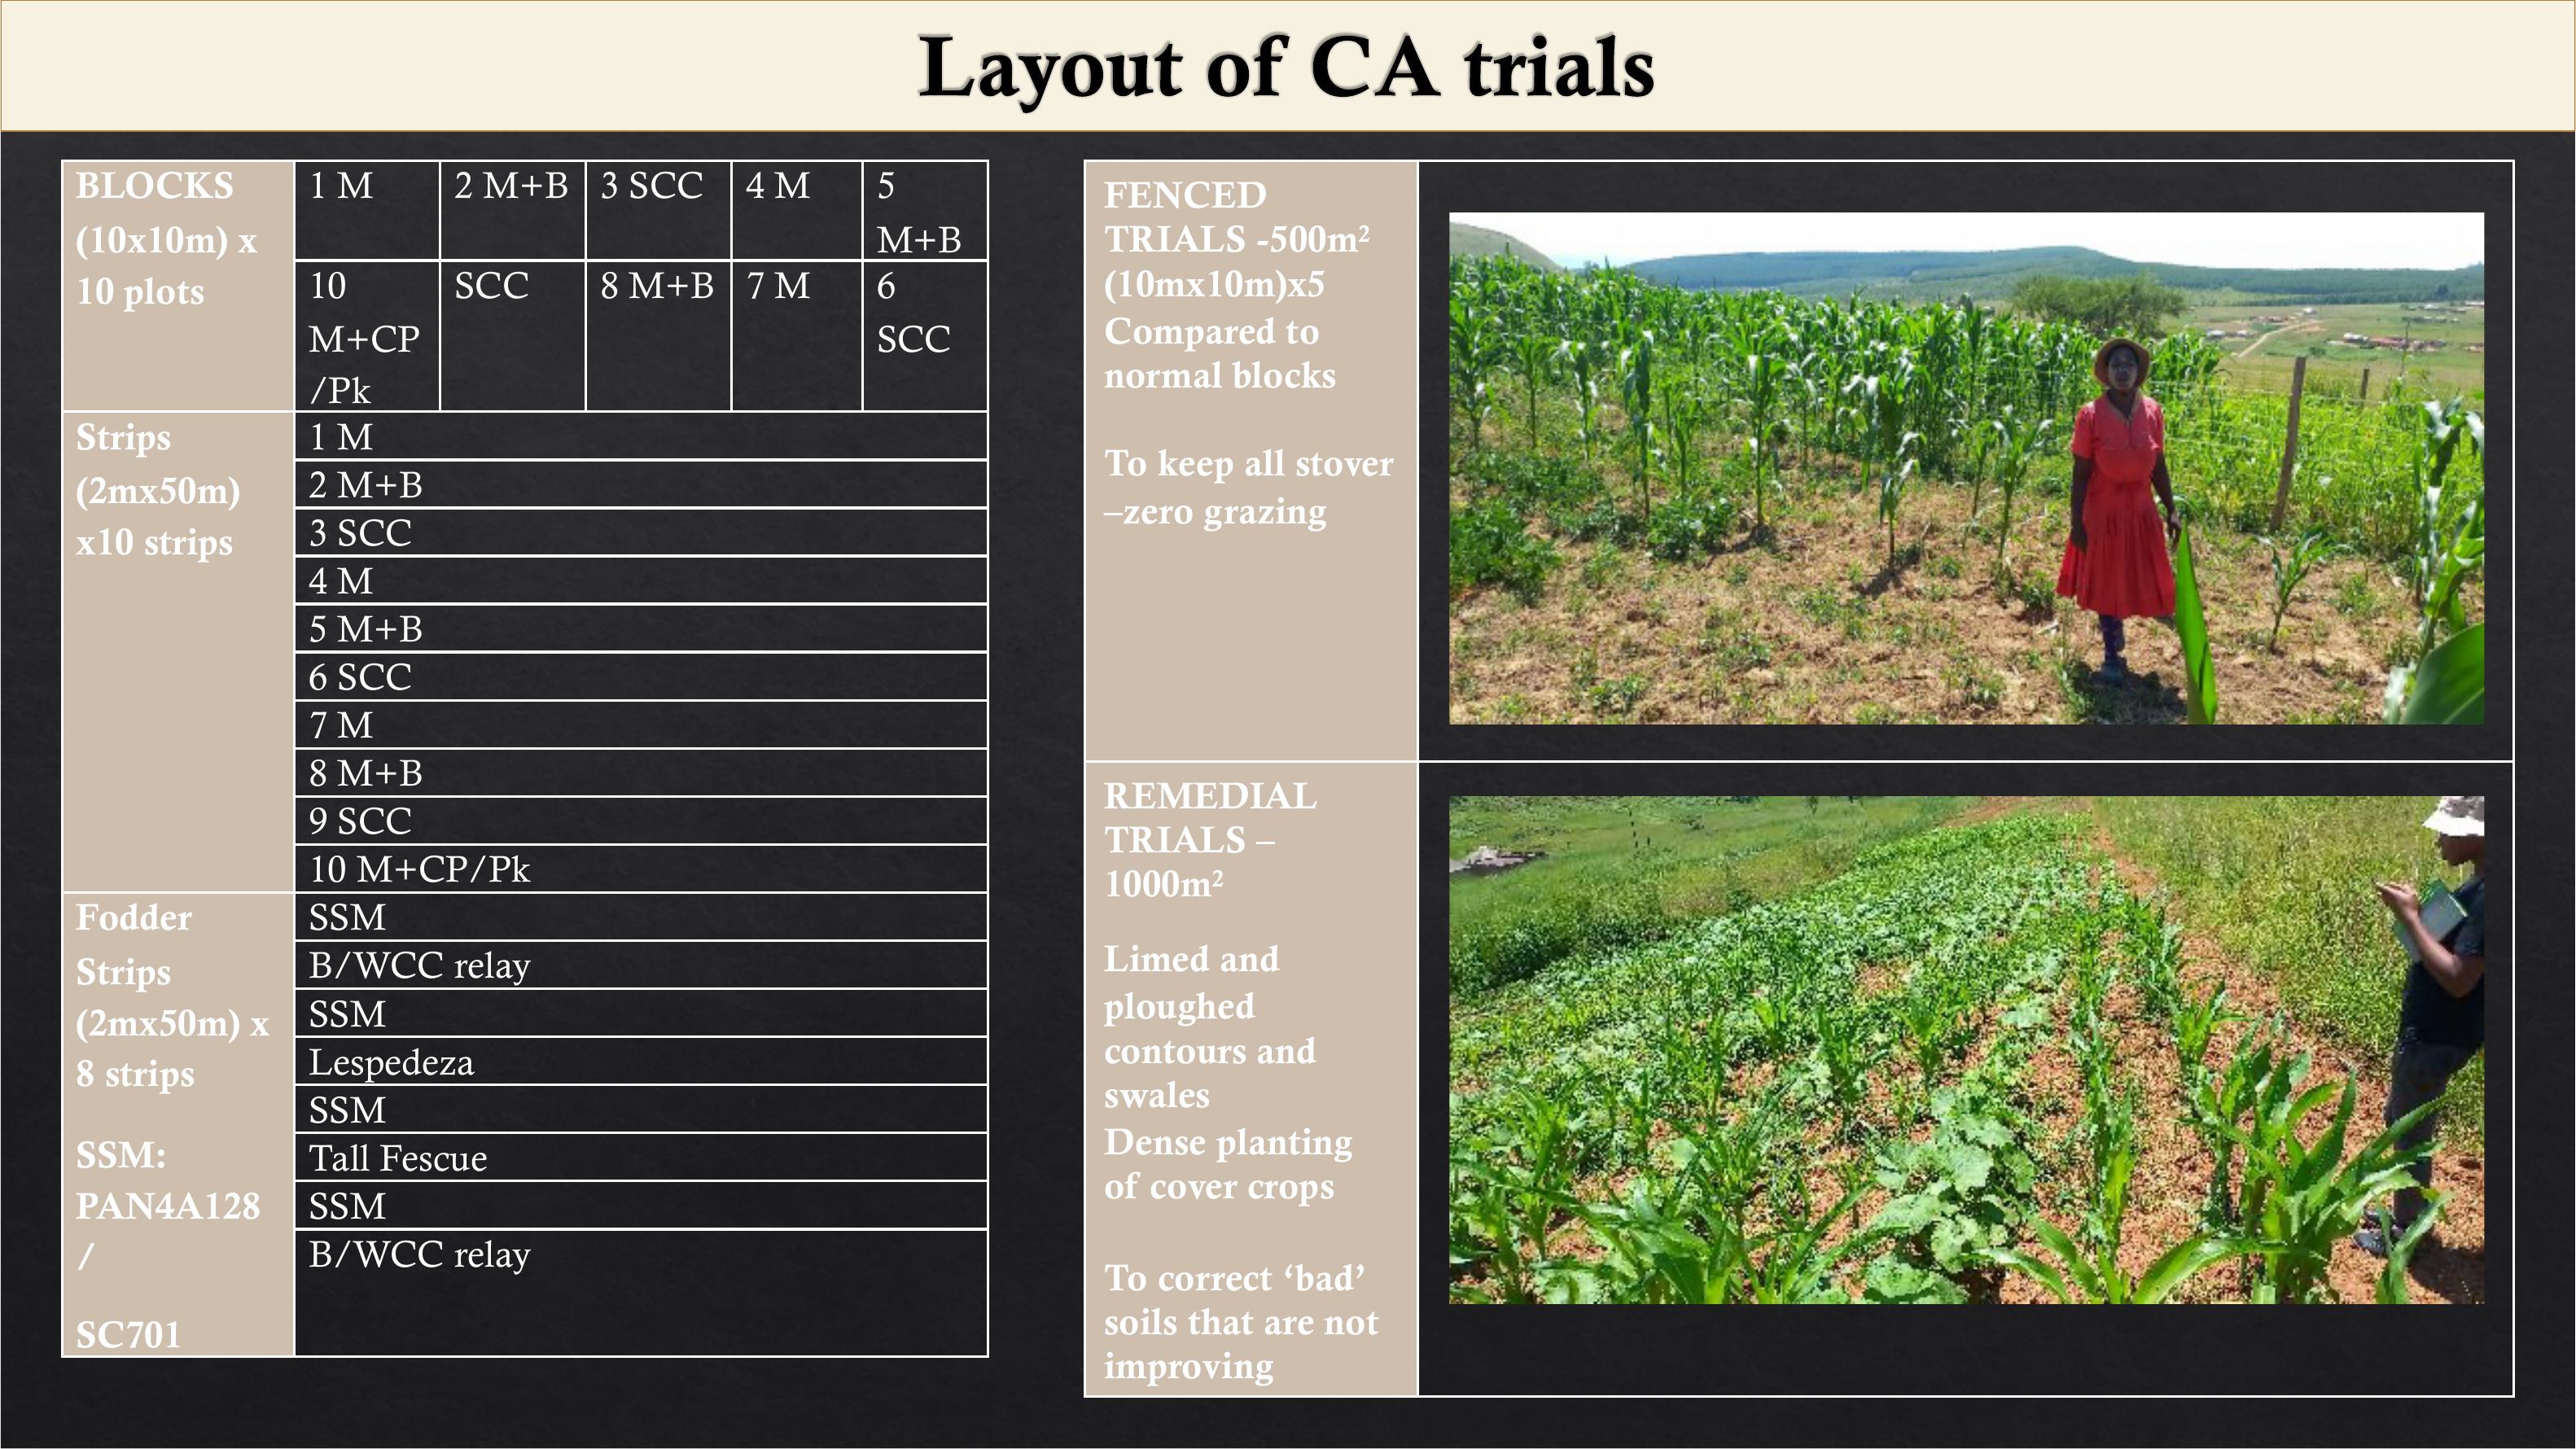
BLOCKS
(10x10m) x
10 plots
1
M
2
M+B
3
SCC
4
M
5
M+B
10
M+CP
/Pk
SCC
8
M+B
7
M
6
SCC
Strips
(2mx50m)
x10 strips
1
M
2
M+B
3
SCC
4
M
5
M+B
6
SCC
7
M
8
M+B
9
SCC
10
M+CP/Pk
Fodder
Strips
(2mx50m) x
8 strips
SSM:
PAN4A128
/
SC701
SSM
B/WCC
relay
SSM
Lespedeza
SSM
Tall
Fescue
SSM
B/WCC
relay
FENCED
TRIALS
-500m2
(10mx10m)x5
Compared to
normal blocks
Tokeepallstover
–
zero grazing
REMEDIAL
TRIALS
–
1000m
2
Limed and
ploughed
contours and
swales
Dense planting
of cover crops
Tocorrect‘bad’
soils that are not
improving

CA controlCA trial
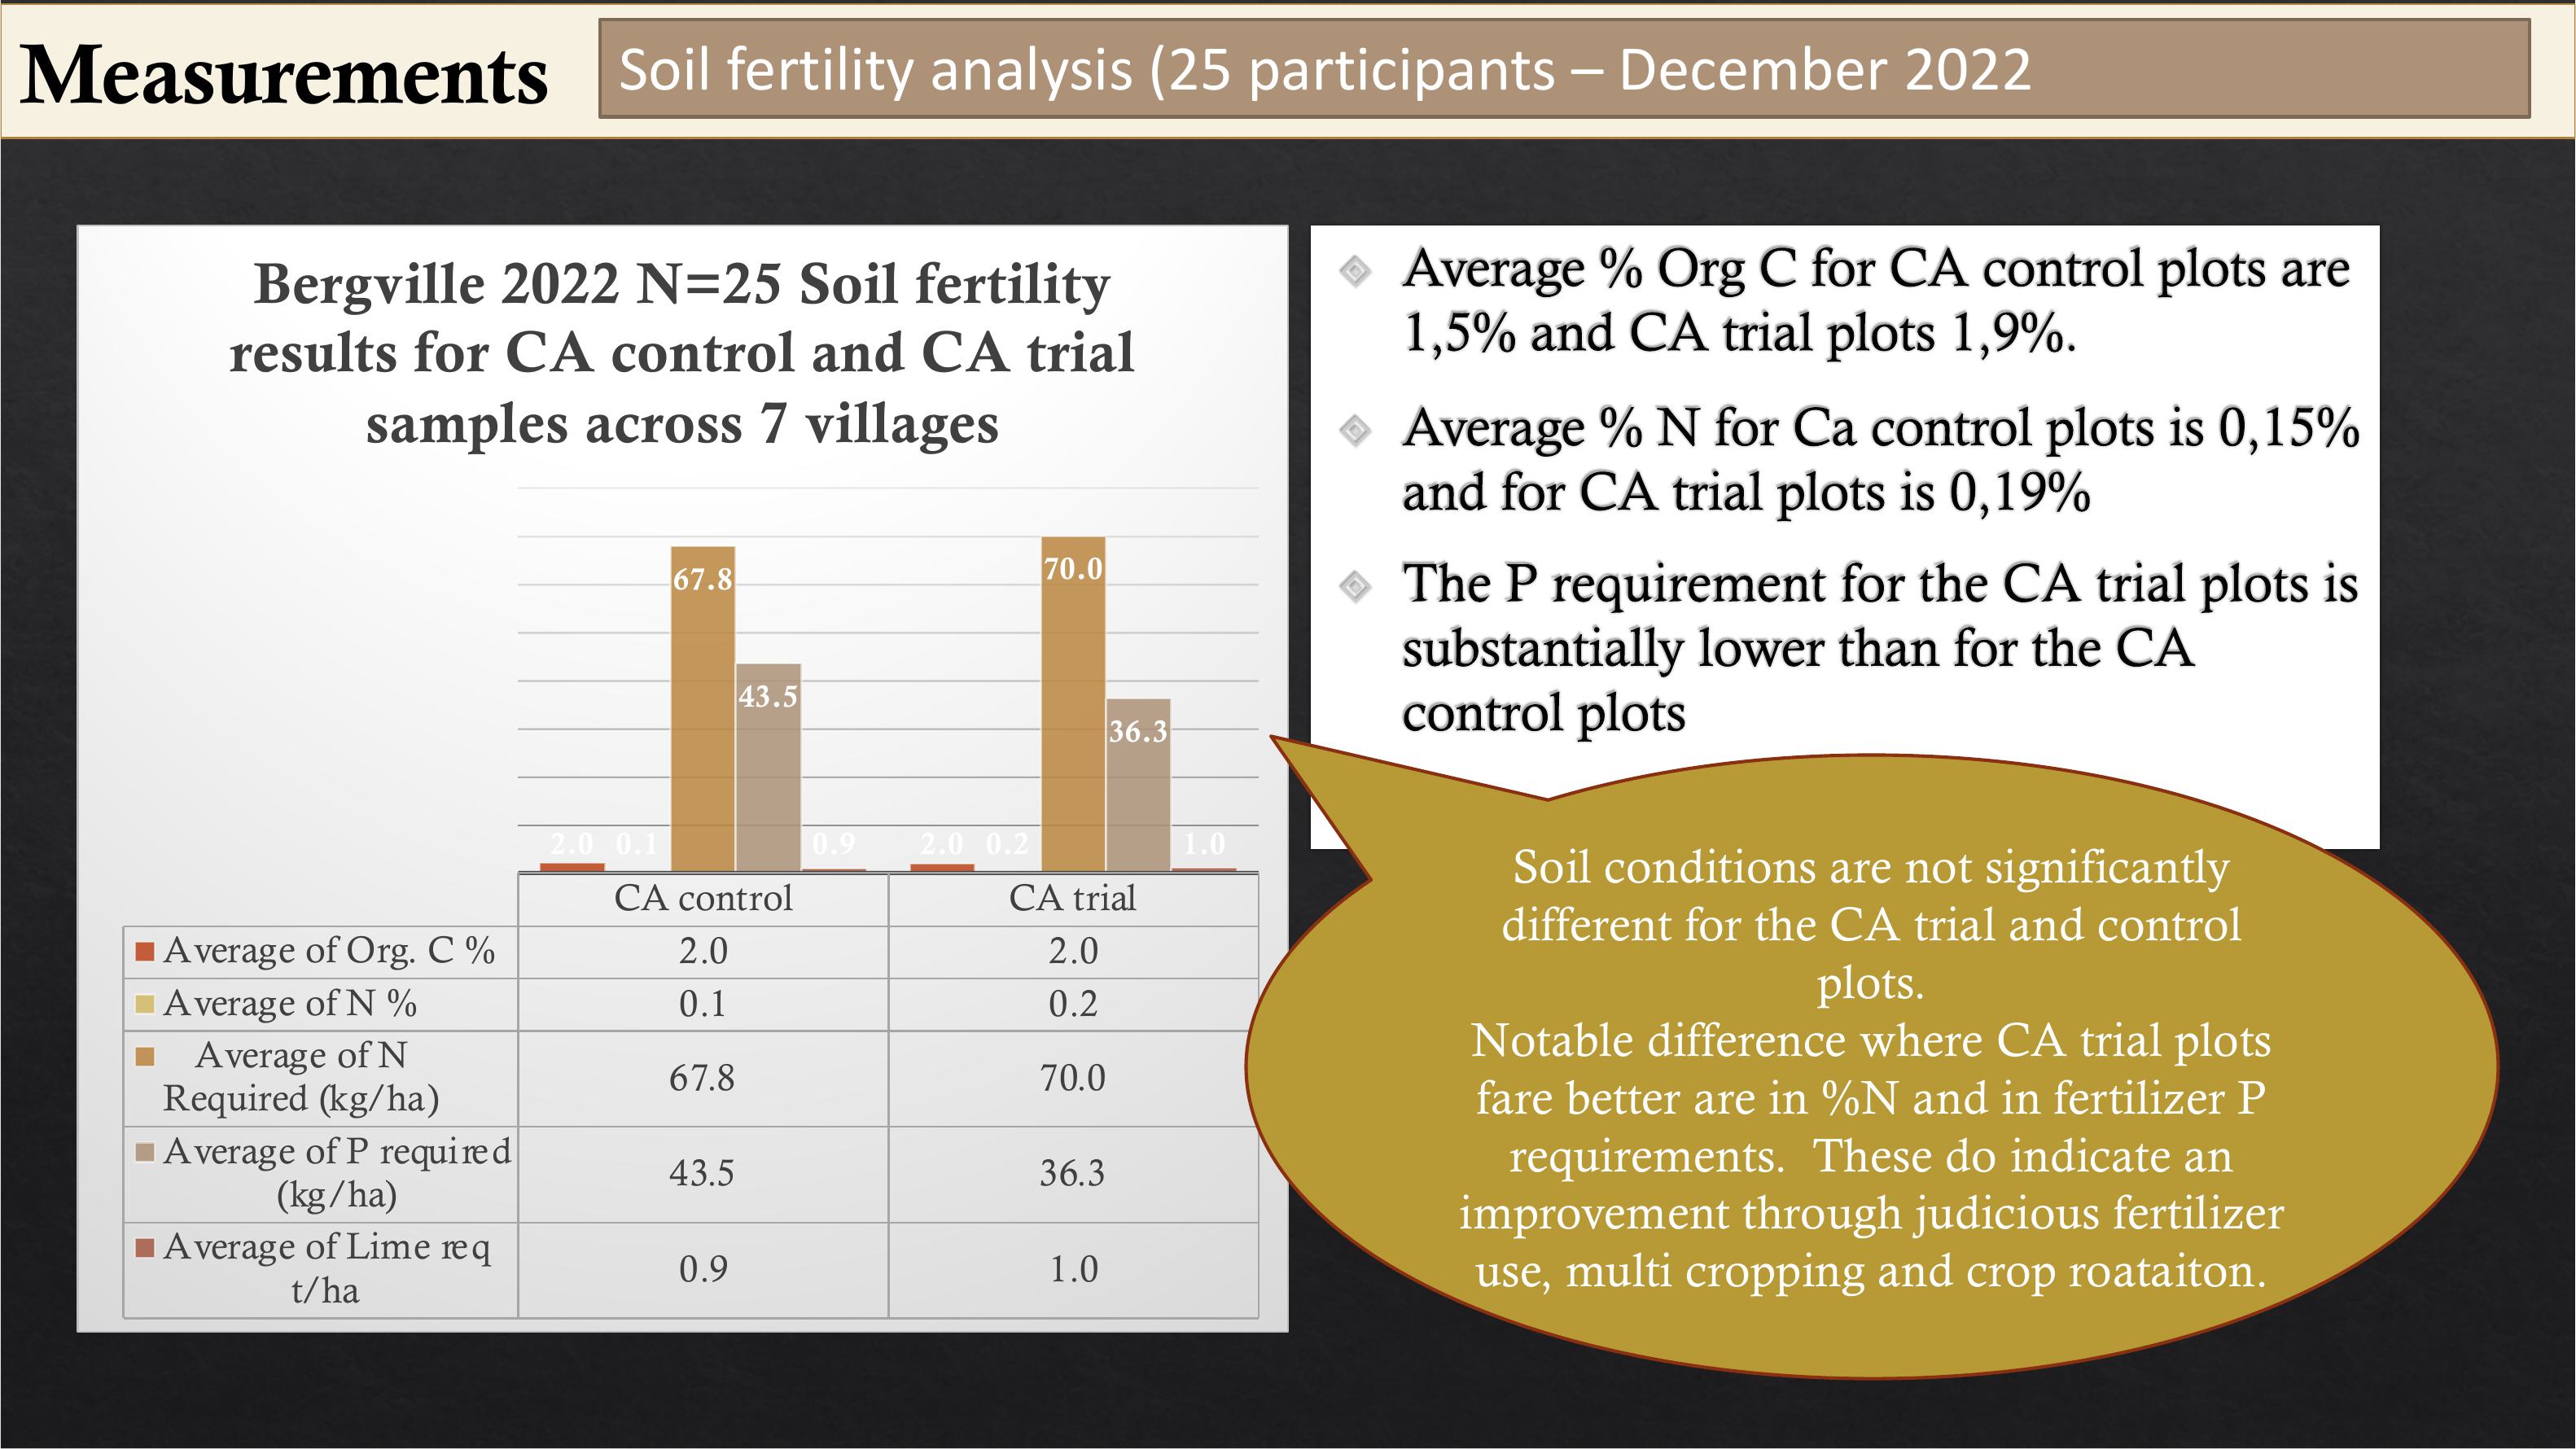
Average ofOrg.C %2.0 2.0
Average ofN%0.1 0.2
Average ofN
Required (kg/ha)67.8 70.0
Average ofP required
(kg/ha) 43.5 36.3
Average ofLime req
t/ha 0.9 1.0
2.0 2.00.1 0.2
67.8 70.0
43.5
36.3
0.9 1.0
Bergville 2022 N=25 Soil fertility
results for CA control and CA trial
samples across 7 villages
Measurements Soil fertility analysis (25 participants – December 2022
Soil conditions are not significantly
different for the CA trial and control
plots.
Notable difference where CA trial plots
fare better are in %N and in fertilizer P
requirements. These do indicate an
improvement through judicious fertilizer
use, multi cropping and crop roataiton.
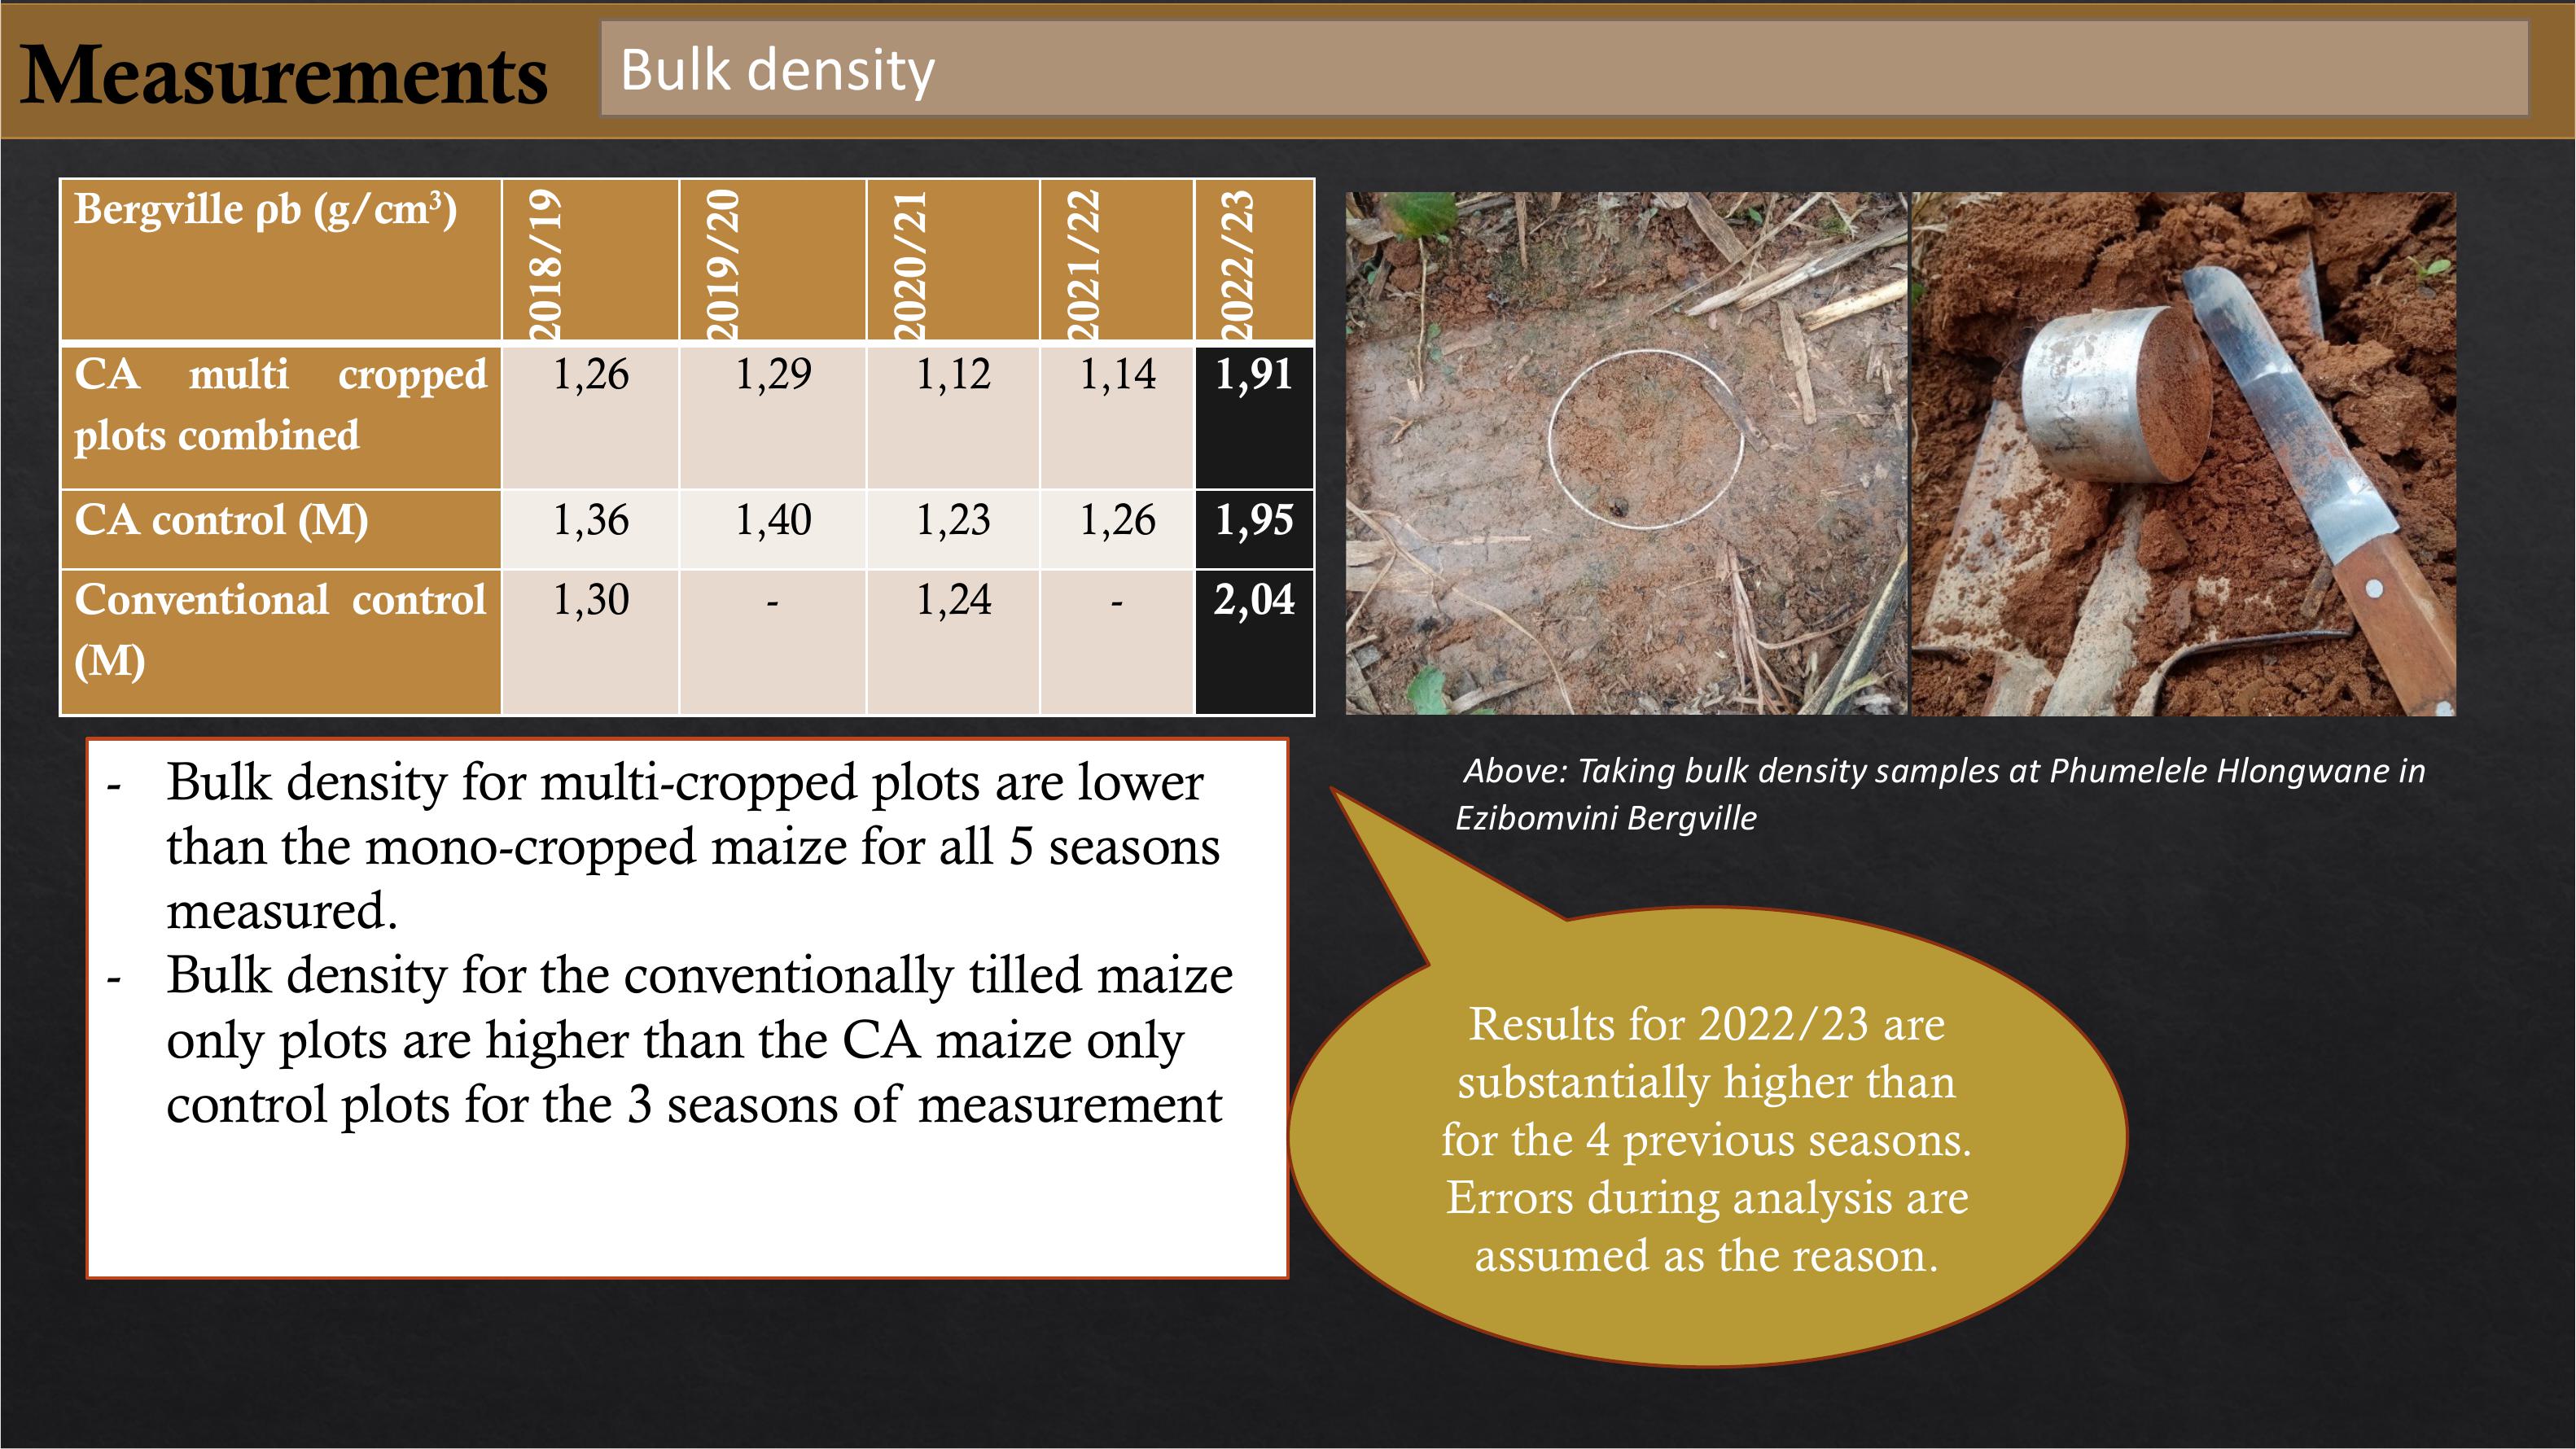
-Bulk density for multi-cropped plots are lower
than the mono-cropped maize for all 5 seasons
measured.
-Bulk density for the conventionally tilled maize
only plots are higher than the CA maize only
control plots for the 3 seasons of measurement
Above: Taking bulk density samples at PhumeleleHlongwane in
EzibomviniBergville
Measurements Bulk density
Results for 2022/23 are
substantially higher than
for the 4 previous seasons.
Errors during analysis are
assumed as the reason.
Bergville
ρb(g/cm3)
2018
/
19
2019
/
20
2020
/
21
2021
/
22
2022
/
23
CA
multi
cropped
plots
combined
1,261,291,12 1,14
1,91
CA
control(M) 1,361,401,23 1,26
1,95
Conventional
control
(M)
1,30 -1,24 -
2,04
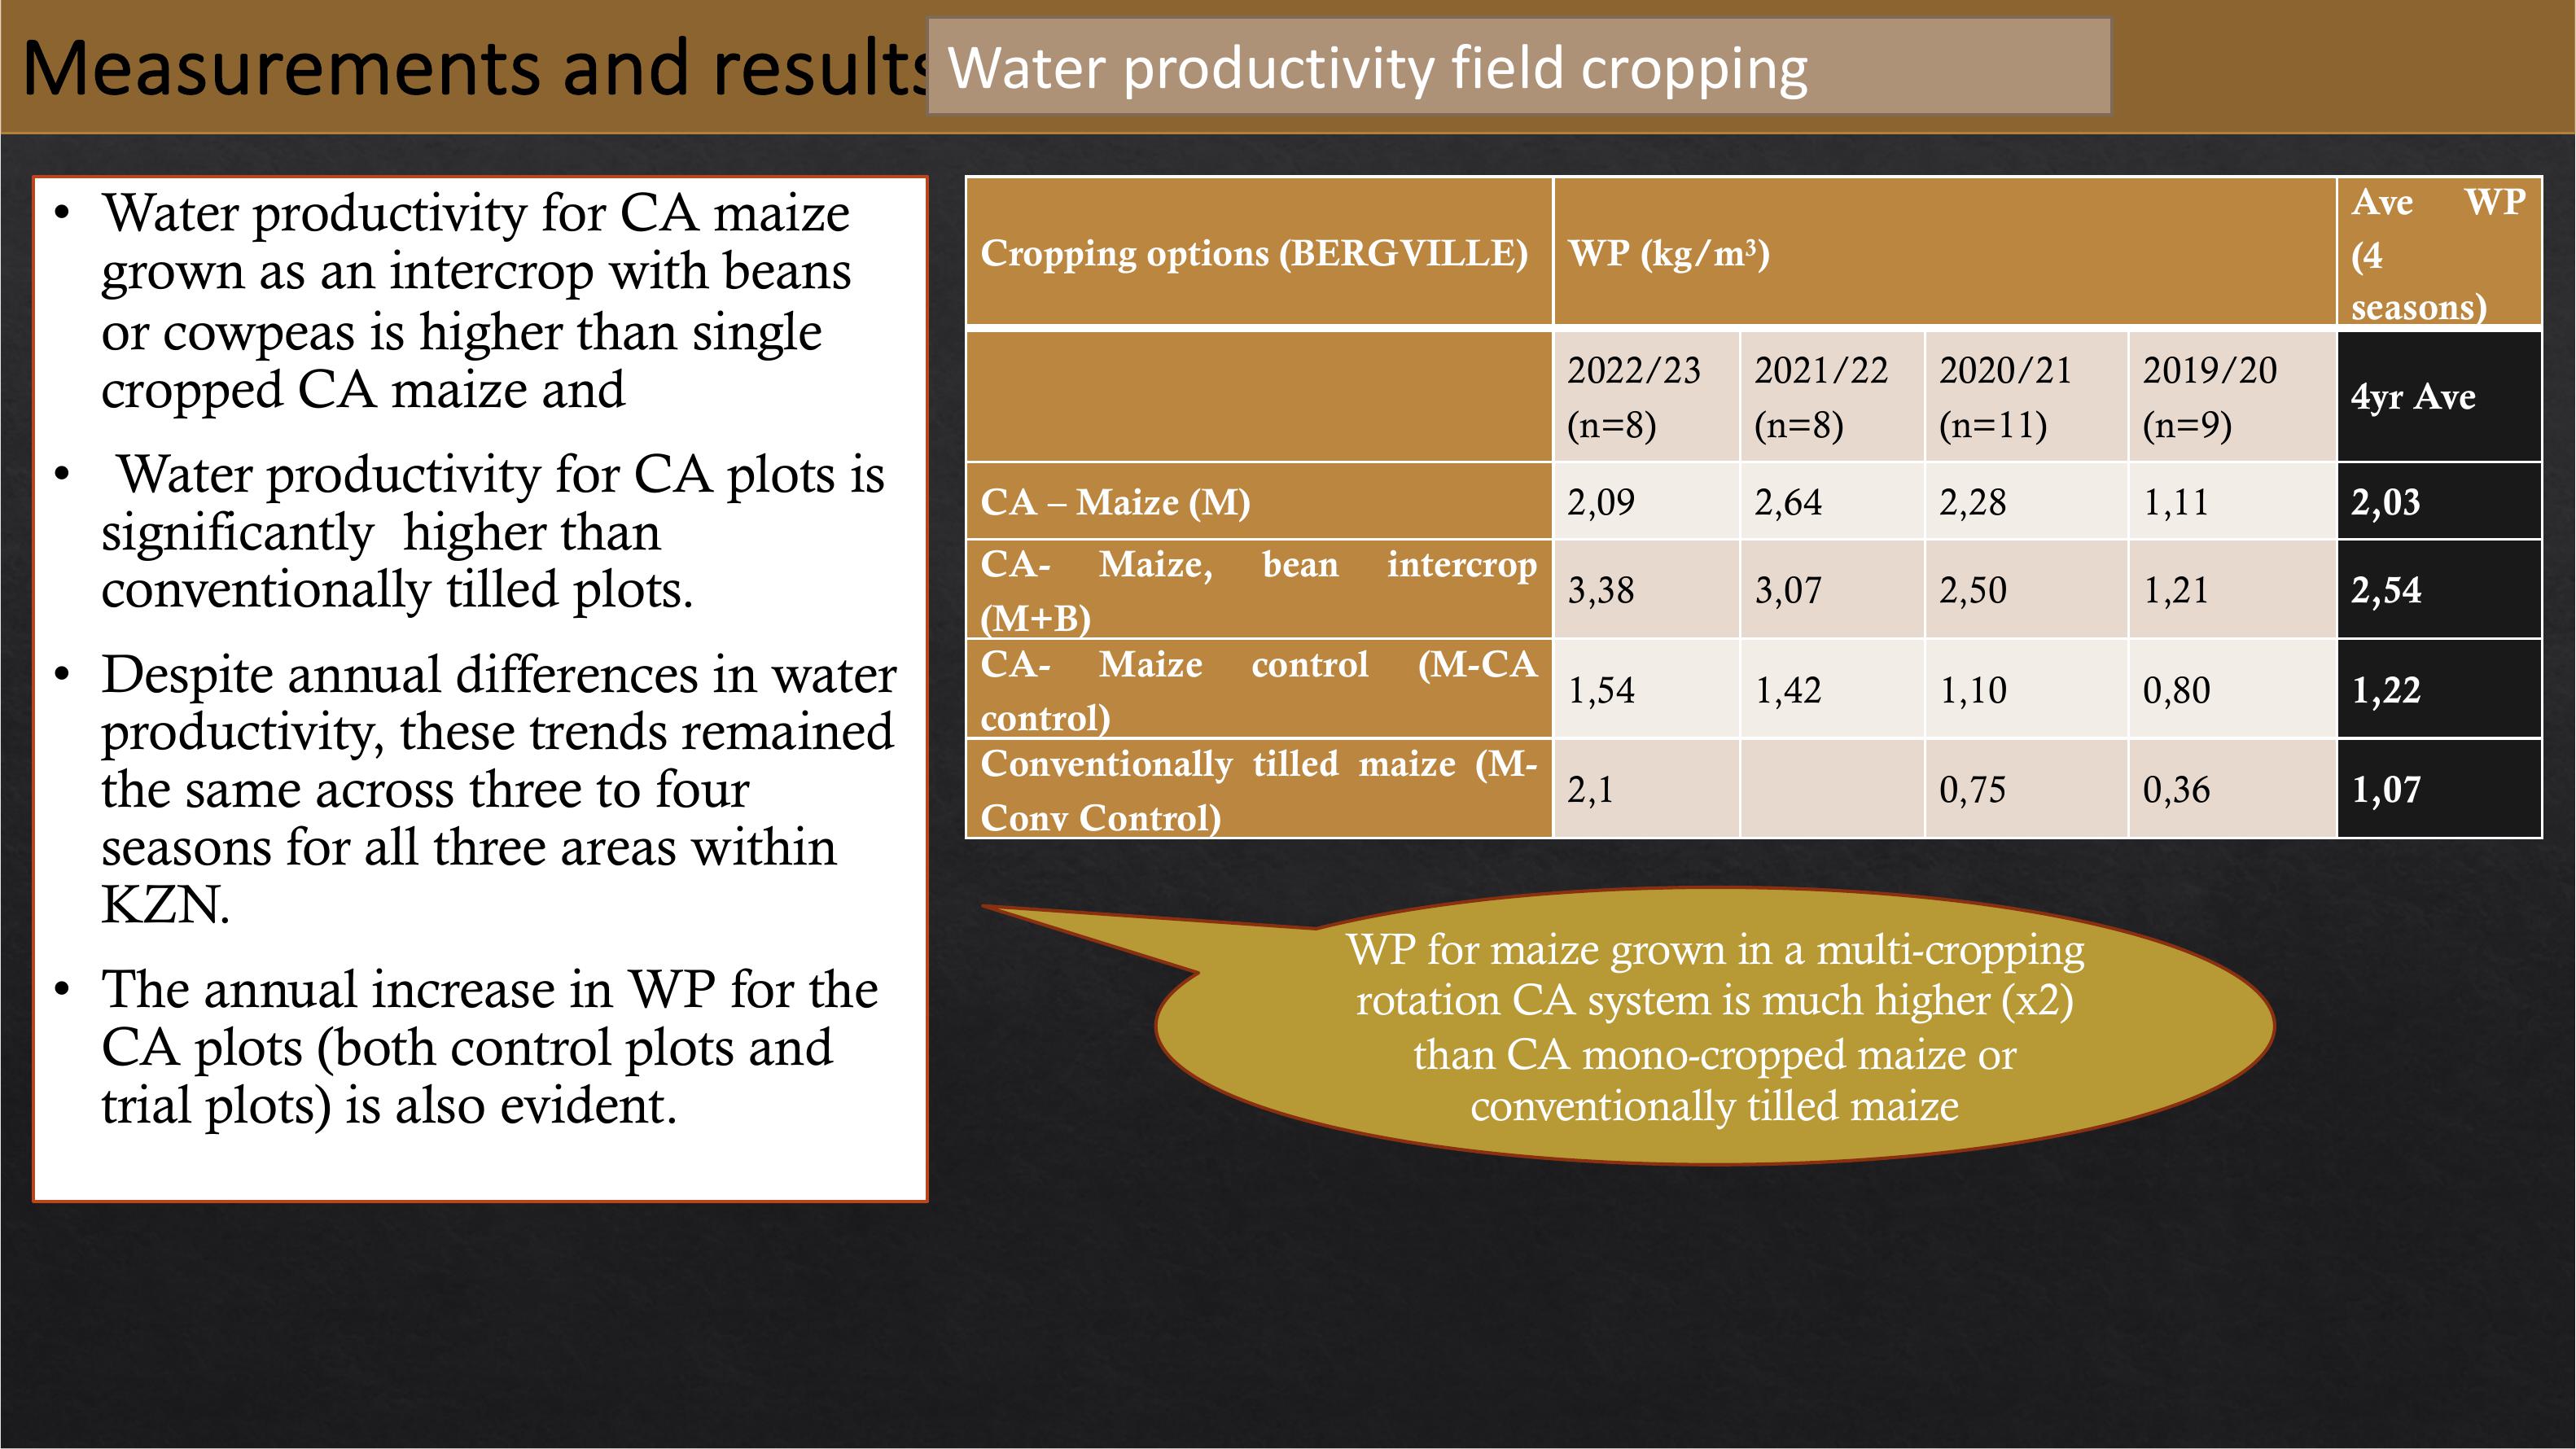
Measurements and results
Waterproductivityfieldcropping
•WaterproductivityforCAmaize
grown as an intercrop with beans
or cowpeas is higher than single
cropped CA maize and
•WaterproductivityforCAplotsis
significantly higher than
conventionally tilled plots.
•Despite annual differences in water
productivity, these trends remained
the same across three to four
seasons for all three areas within
KZN.
•The annual increase in WP for the
CA plots (both control plots and
trial plots) is also evident.
WP formaizegrowninamulti-cropping
rotation CA system is much higher (x2)
than CA mono-cropped maize or
conventionally tilled maize
Cropping
options(BERGVILLE)
WP
(kg/m3)
Ave
WP
(
4
seasons)
2022
/23
(n=
8)
2021
/22
(n=
8)
2020
/21
(n=
11)
2019
/20
(n=
9)
4
yrAve
CA
– Maize(M)
2
,09
2
,64
2
,28
1
,11
2
,03
CA
- Maize,bean
intercrop
(M+B)
3
,38
3
,07
2
,50
1
,21
2
,54
CA
- Maizecontrol(M-
CA
control)
1
,54
1
,42
1
,10
0
,80
1
,22
Conventionally
tilledmaize(M
-
Conv
Control)
2
,1
0
,75
0
,36
1
,07

Measurements and results
Volumetricwaterbenefitfieldcropping
CA trial (inter
cropping)
CA control
(mono cropped
M)
Conv control
(mono cropped
M)
kg/m3 (WP)
2,54 1,221,07
Difference (CA trial
-CA
control
- Conv control)
1,32 0,15
Volumetricwater
difference (l/kg)
1 320150
Yield(t/ha)
5,30 1,8
VWB(l/ha) 2022/23
6996 000270 000
VWB (l/ha) 2021/22
8840 300344 400
Volumetricwaterbenefitforintercropped
and rotated CA plots is ~7 million
litres/ha more than conventional tillage
and for mono-cropped CA plots is ~0,3
million litres/ha more than
conventionally tilled plots.
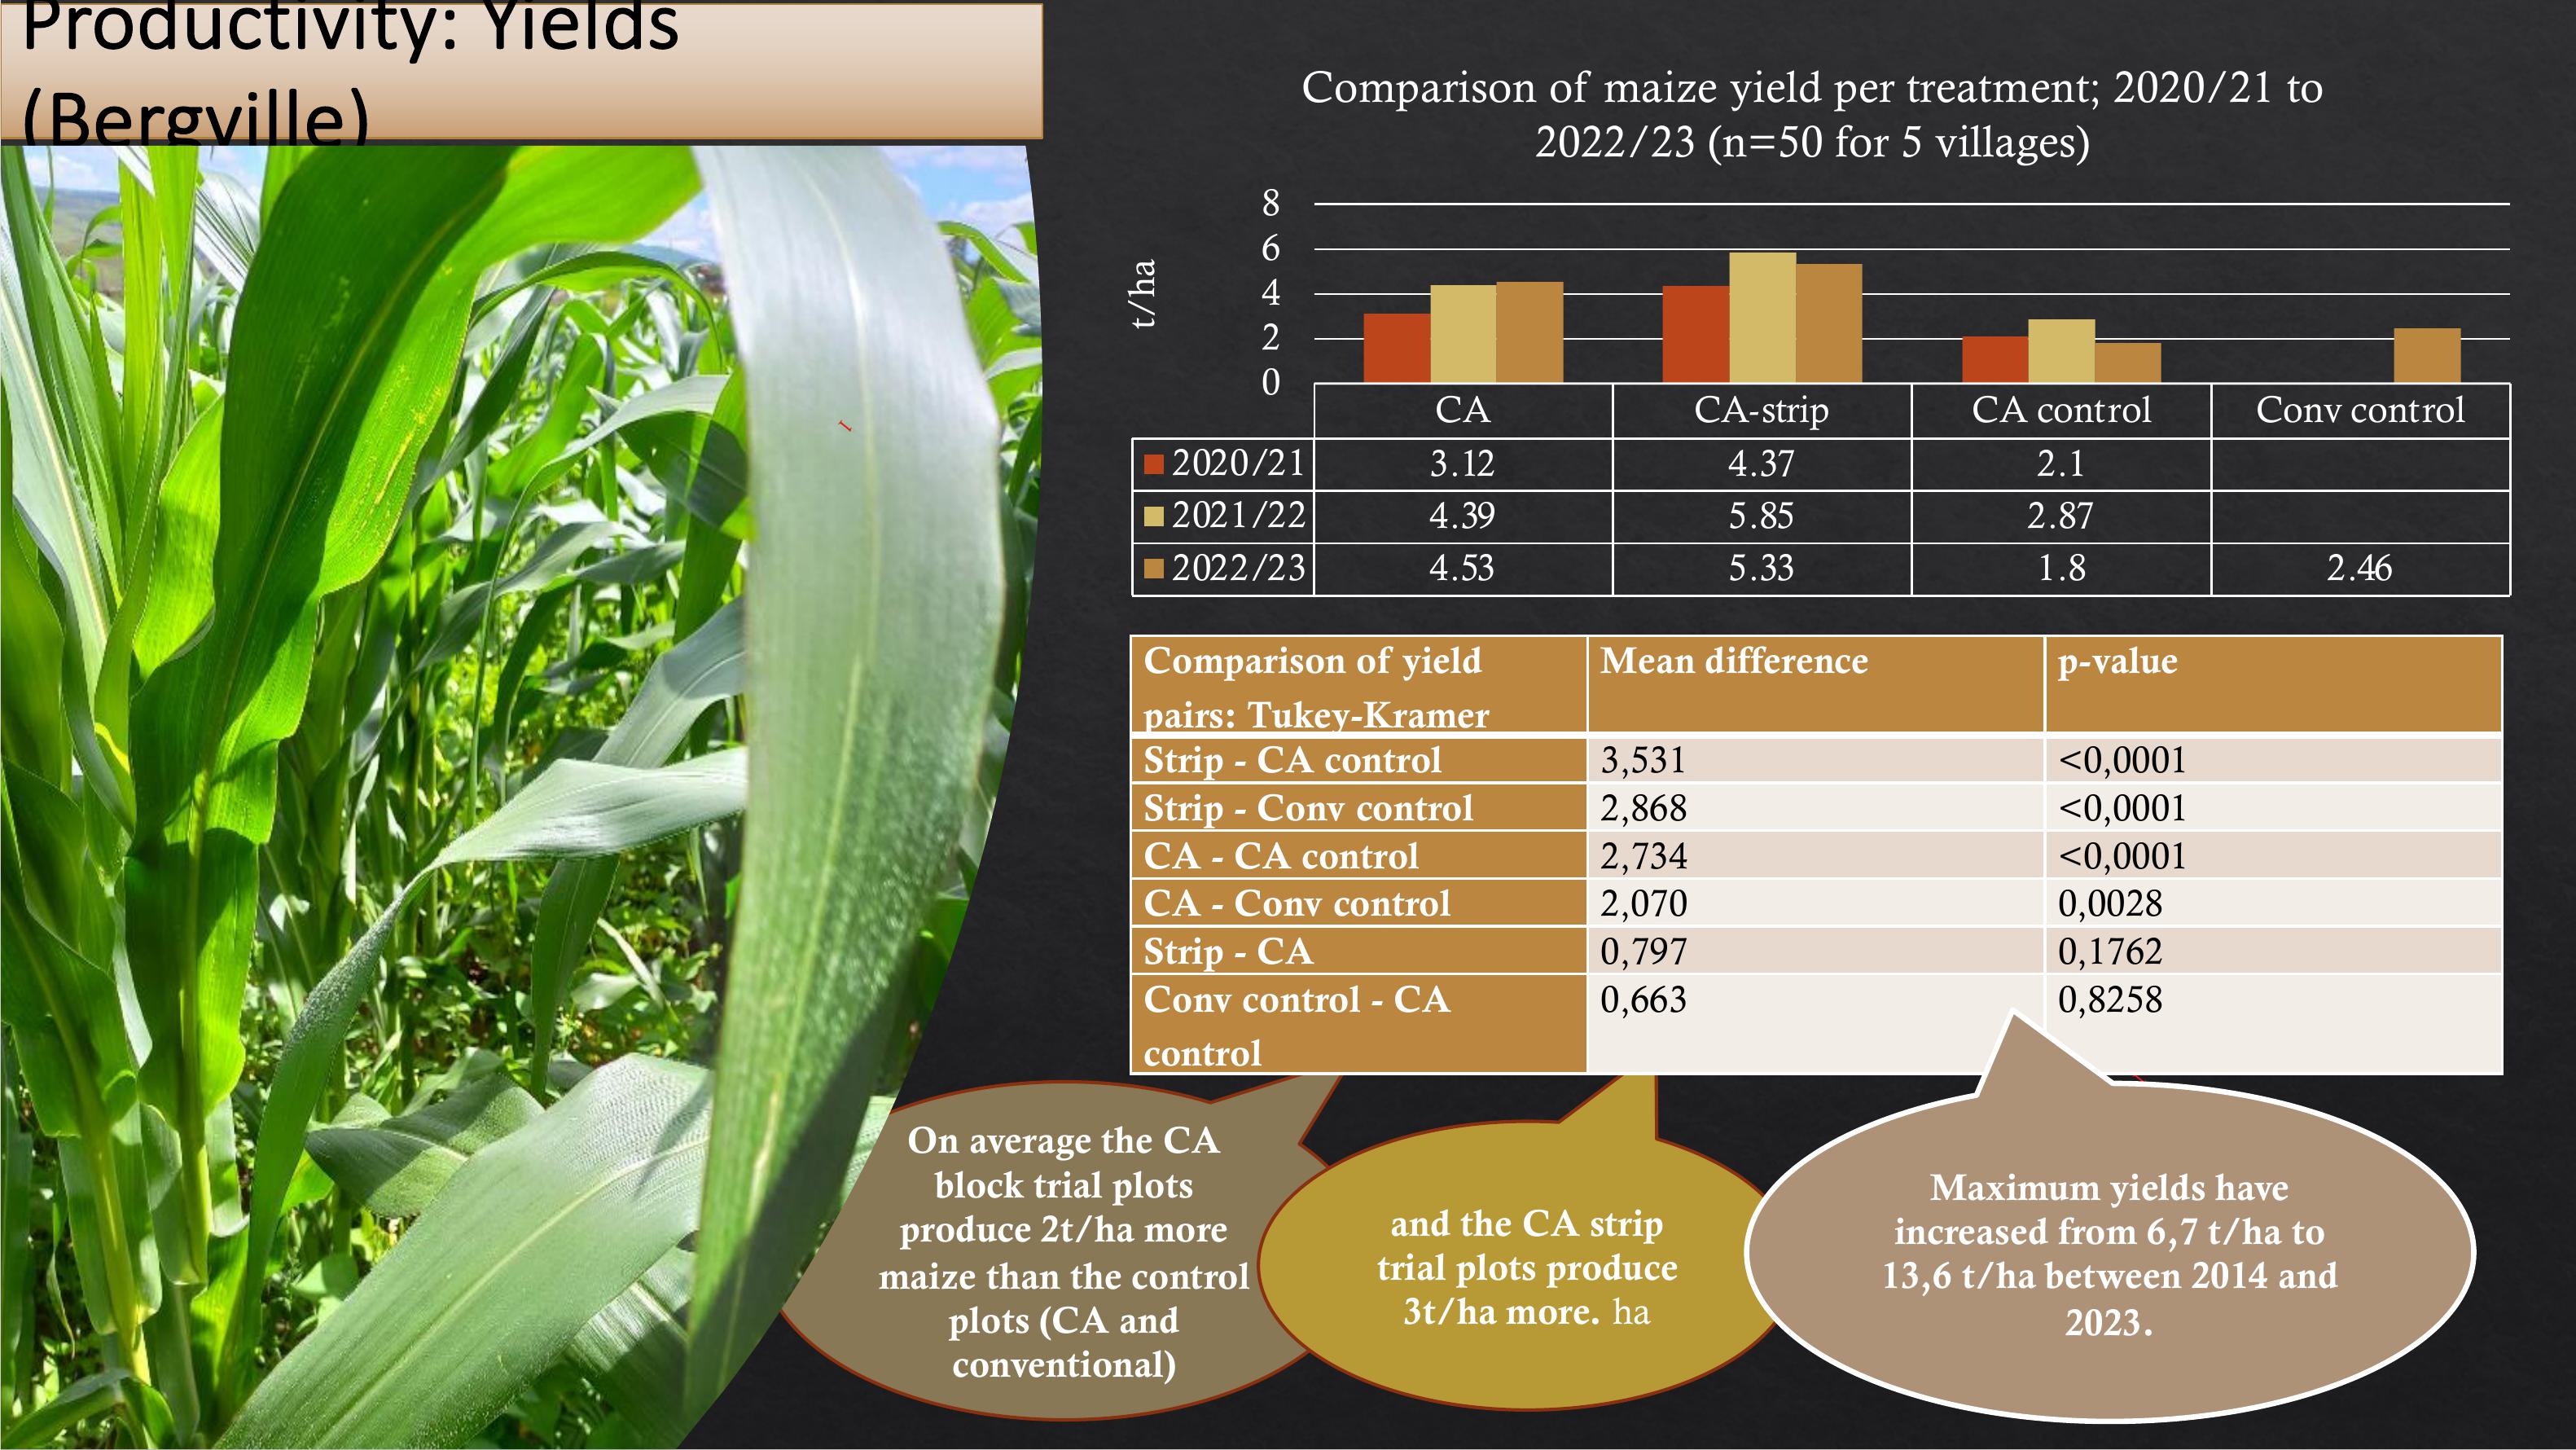
Productivity: Yields
(Bergville)
On average the CA
block trial plots
produce 2t/ha more
maize than the control
plots (CA and
conventional)
and the CA strip
trial plots produce
3t/ha more. ha
CACA-stripCA controlConvcontrol
2020/21 3.12 4.372.1
2021/22 4.39 5.85 2.87
2022/23 4.535.331.82.46
0
2
4
6
8
t/ha
Comparison of maize yield per treatment; 2020/21 to
2022/23 (n=50 for 5 villages)
1
1
1
1
2
2
Comparison of yield
pairs: Tukey
-Kramer
Mean difference
p
-value
Strip
- CA control
3,531
<0,0001
Strip
- Conv control
2,868
<0,0001
CA
- CA control
2,734
<0,0001
CA
- Conv control
2,070
0,0028
Strip
- CA
0,797
0,1762
Conv control
- CA
control
0,663
0,8258
Maximum yields have
increased from 6,7 t/ha to
13,6 t/ha between 2014 and
2023.
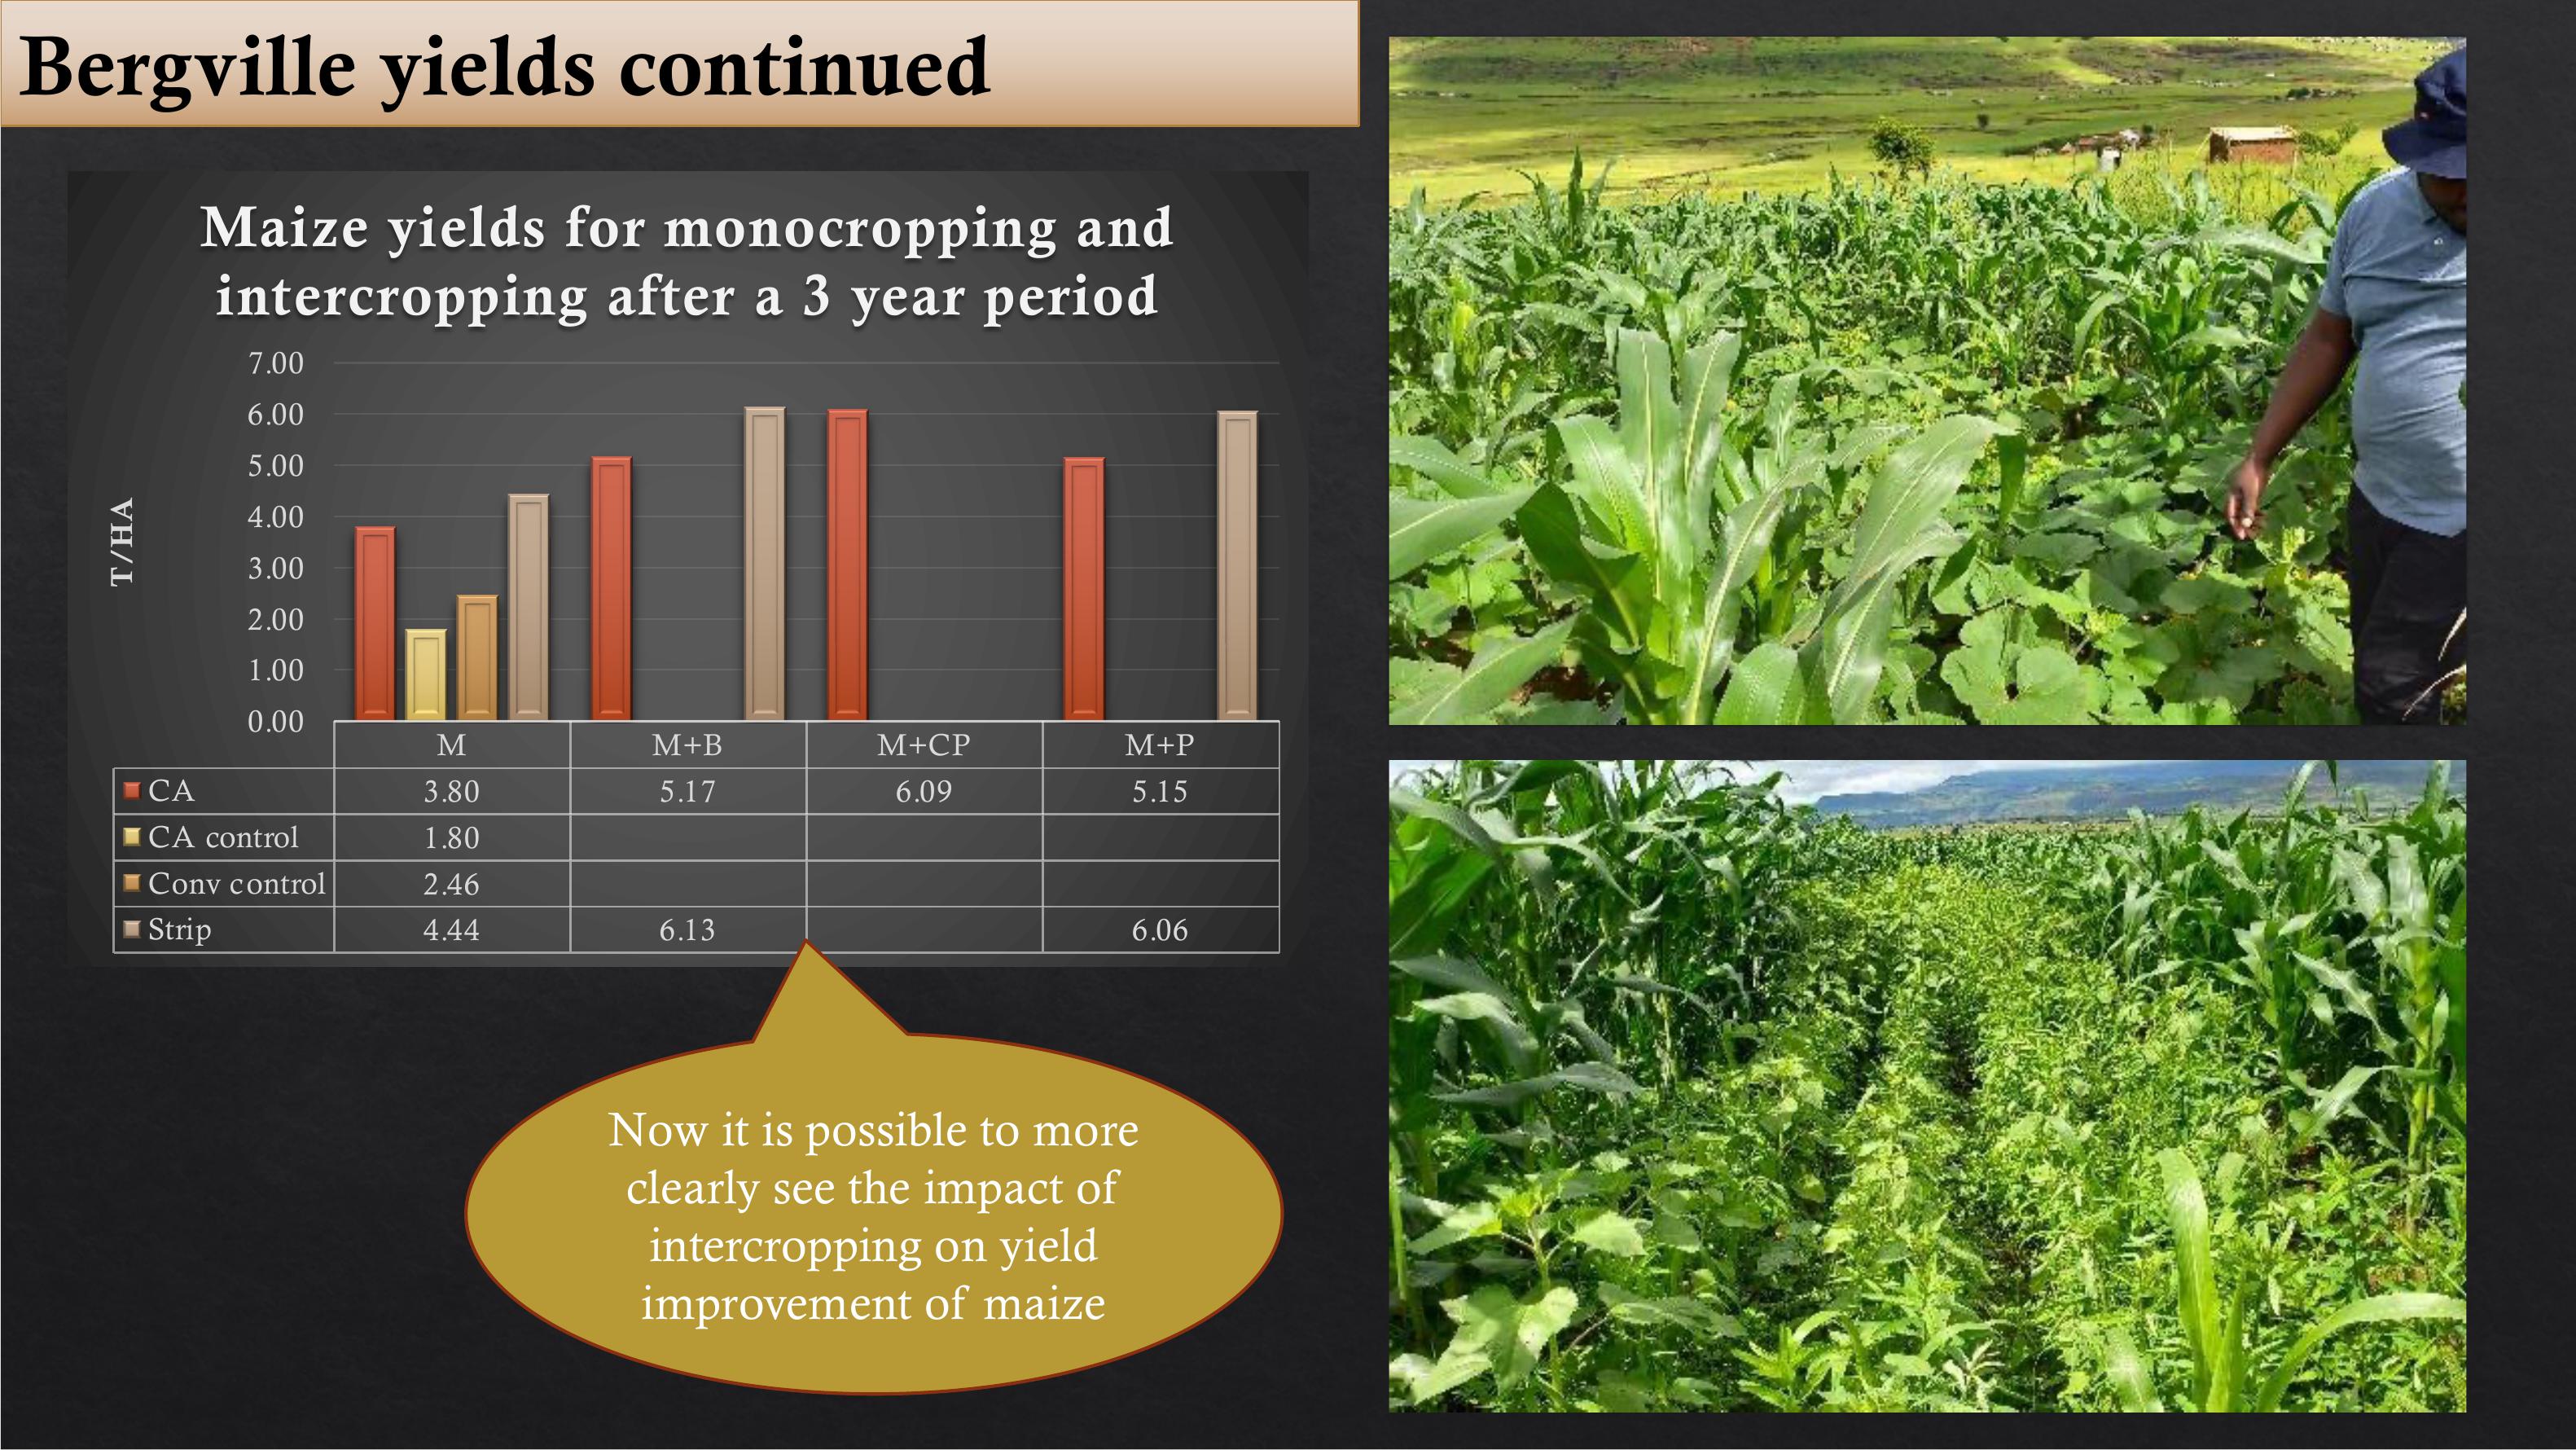
Bergville yields continued
MM+B M+CP M+P
CA 3.80 5.17 6.09 5.15
CAcontrol1.80
Conv control2.46
Strip 4.44 6.136.06
0.00
1.00
2.00
3.00
4.00
5.00
6.00
7.00
T/HA
Maize yields formonocropping and
intercropping after a 3 year period
Now it is possible to more
clearly see the impact of
intercropping on yield
improvement of maize
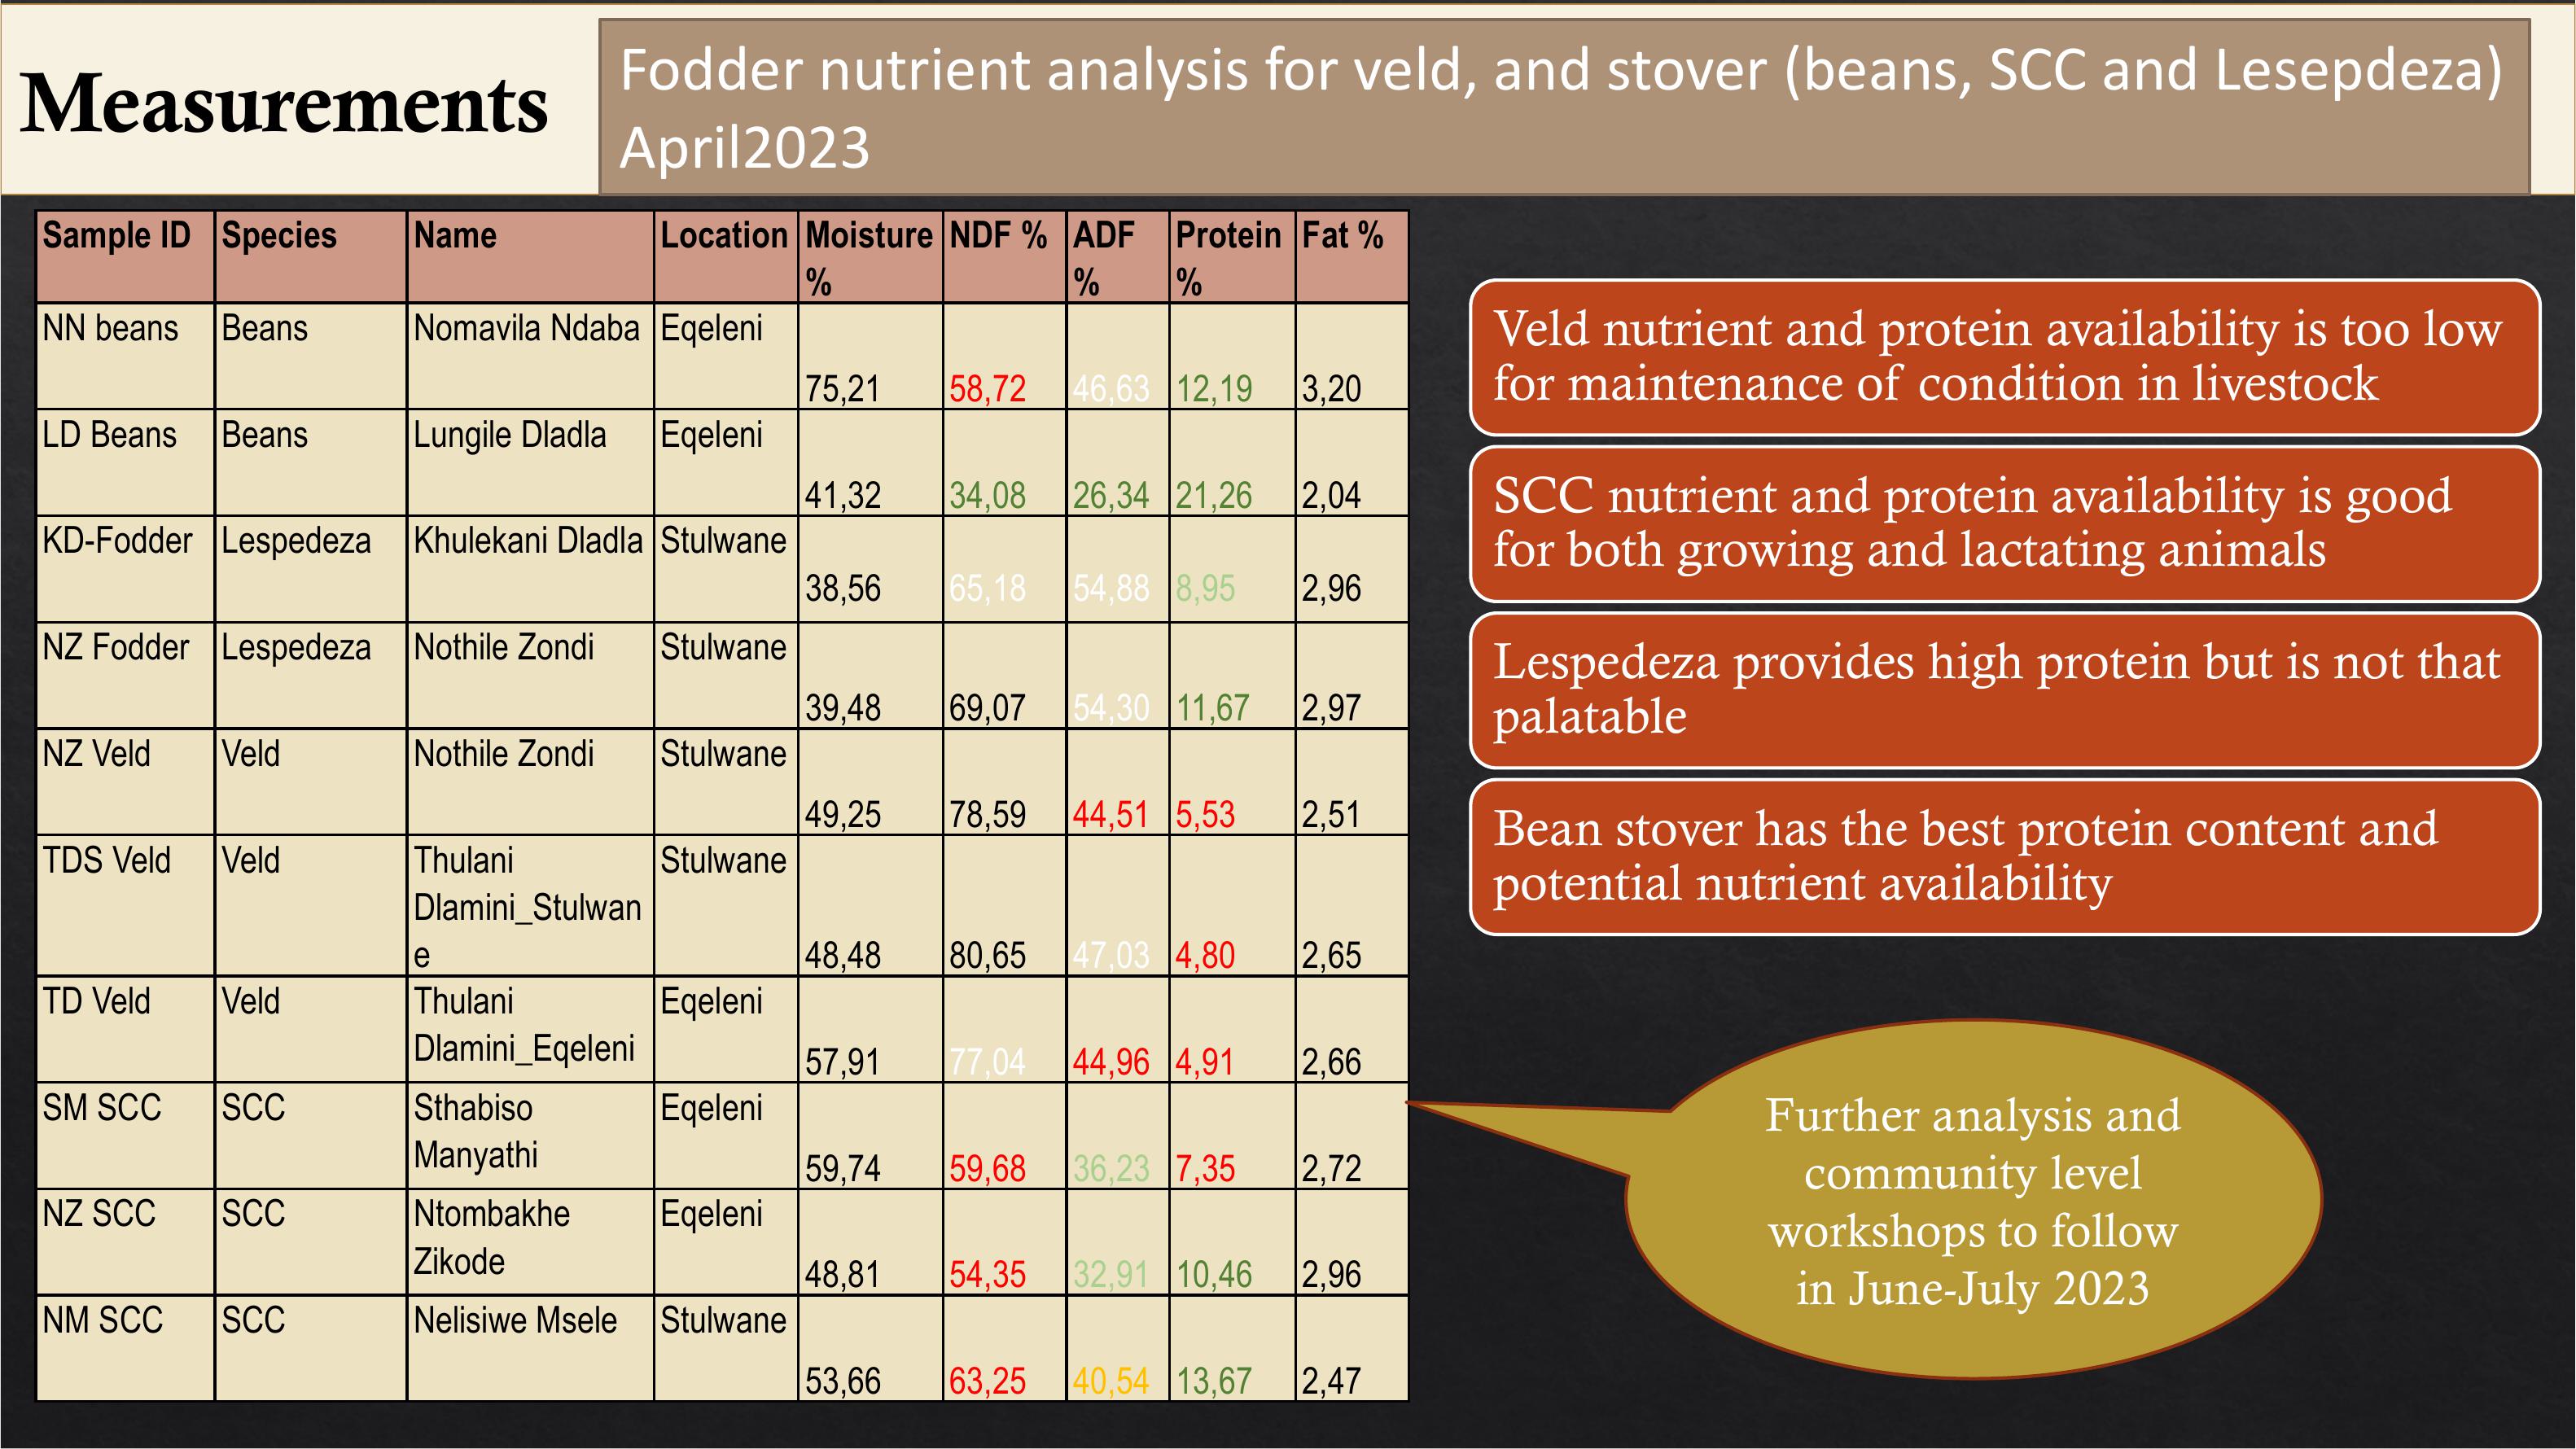
Sample ID
Species
Name
Location
Moisture
%
NDF %
ADF
%
Protein
%
Fat %
NN beans
Beans
Nomavila Ndaba
Eqeleni
75,21
58,72
46,63
12,19
3,20
LD Beans
Beans
Lungile Dladla
Eqeleni
41,32
34,08
26,34
21,26
2,04
KD
-
Fodder
Lespedeza
Khulekani Dladla
Stulwane
38,56
65,18
54,88
8,95
2,96
NZ Fodder
Lespedeza
Nothile Zondi
Stulwane
39,48
69,07
54,30
11,67
2,97
NZ Veld
Veld
Nothile Zondi
Stulwane
49,25
78,59
44,51
5,53
2,51
TDS Veld
Veld
Thulani
Dlamini_Stulwan
e
Stulwane
48,48
80,65
47,03
4,80
2,65
TD Veld
Veld
Thulani
Dlamini_Eqeleni
Eqeleni
57,91
77,04
44,96
4,91
2,66
SM SCC
SCC
Sthabiso
Manyathi
Eqeleni
59,74
59,68
36,23
7,35
2,72
NZ SCC
SCC
Ntombakhe
Zikode
Eqeleni
48,81
54,35
32,91
10,46
2,96
NM SCC
SCC
Nelisiwe Msele
Stulwane
53,66
63,25
40,54
13,67
2,47
Veld nutrient and protein availability is too low
for maintenance of condition in livestock
SCC nutrient and protein availability is good
for both growing and lactating animals
Lespedeza provides high protein but is not that
palatable
Bean stover has the best protein content and
potential nutrient availability
Measurements Foddernutrientanalysisforveld, andstover (beans,SCC andLesepdeza)
April2023
Further analysis and
community level
workshops to follow
in June-July 2023
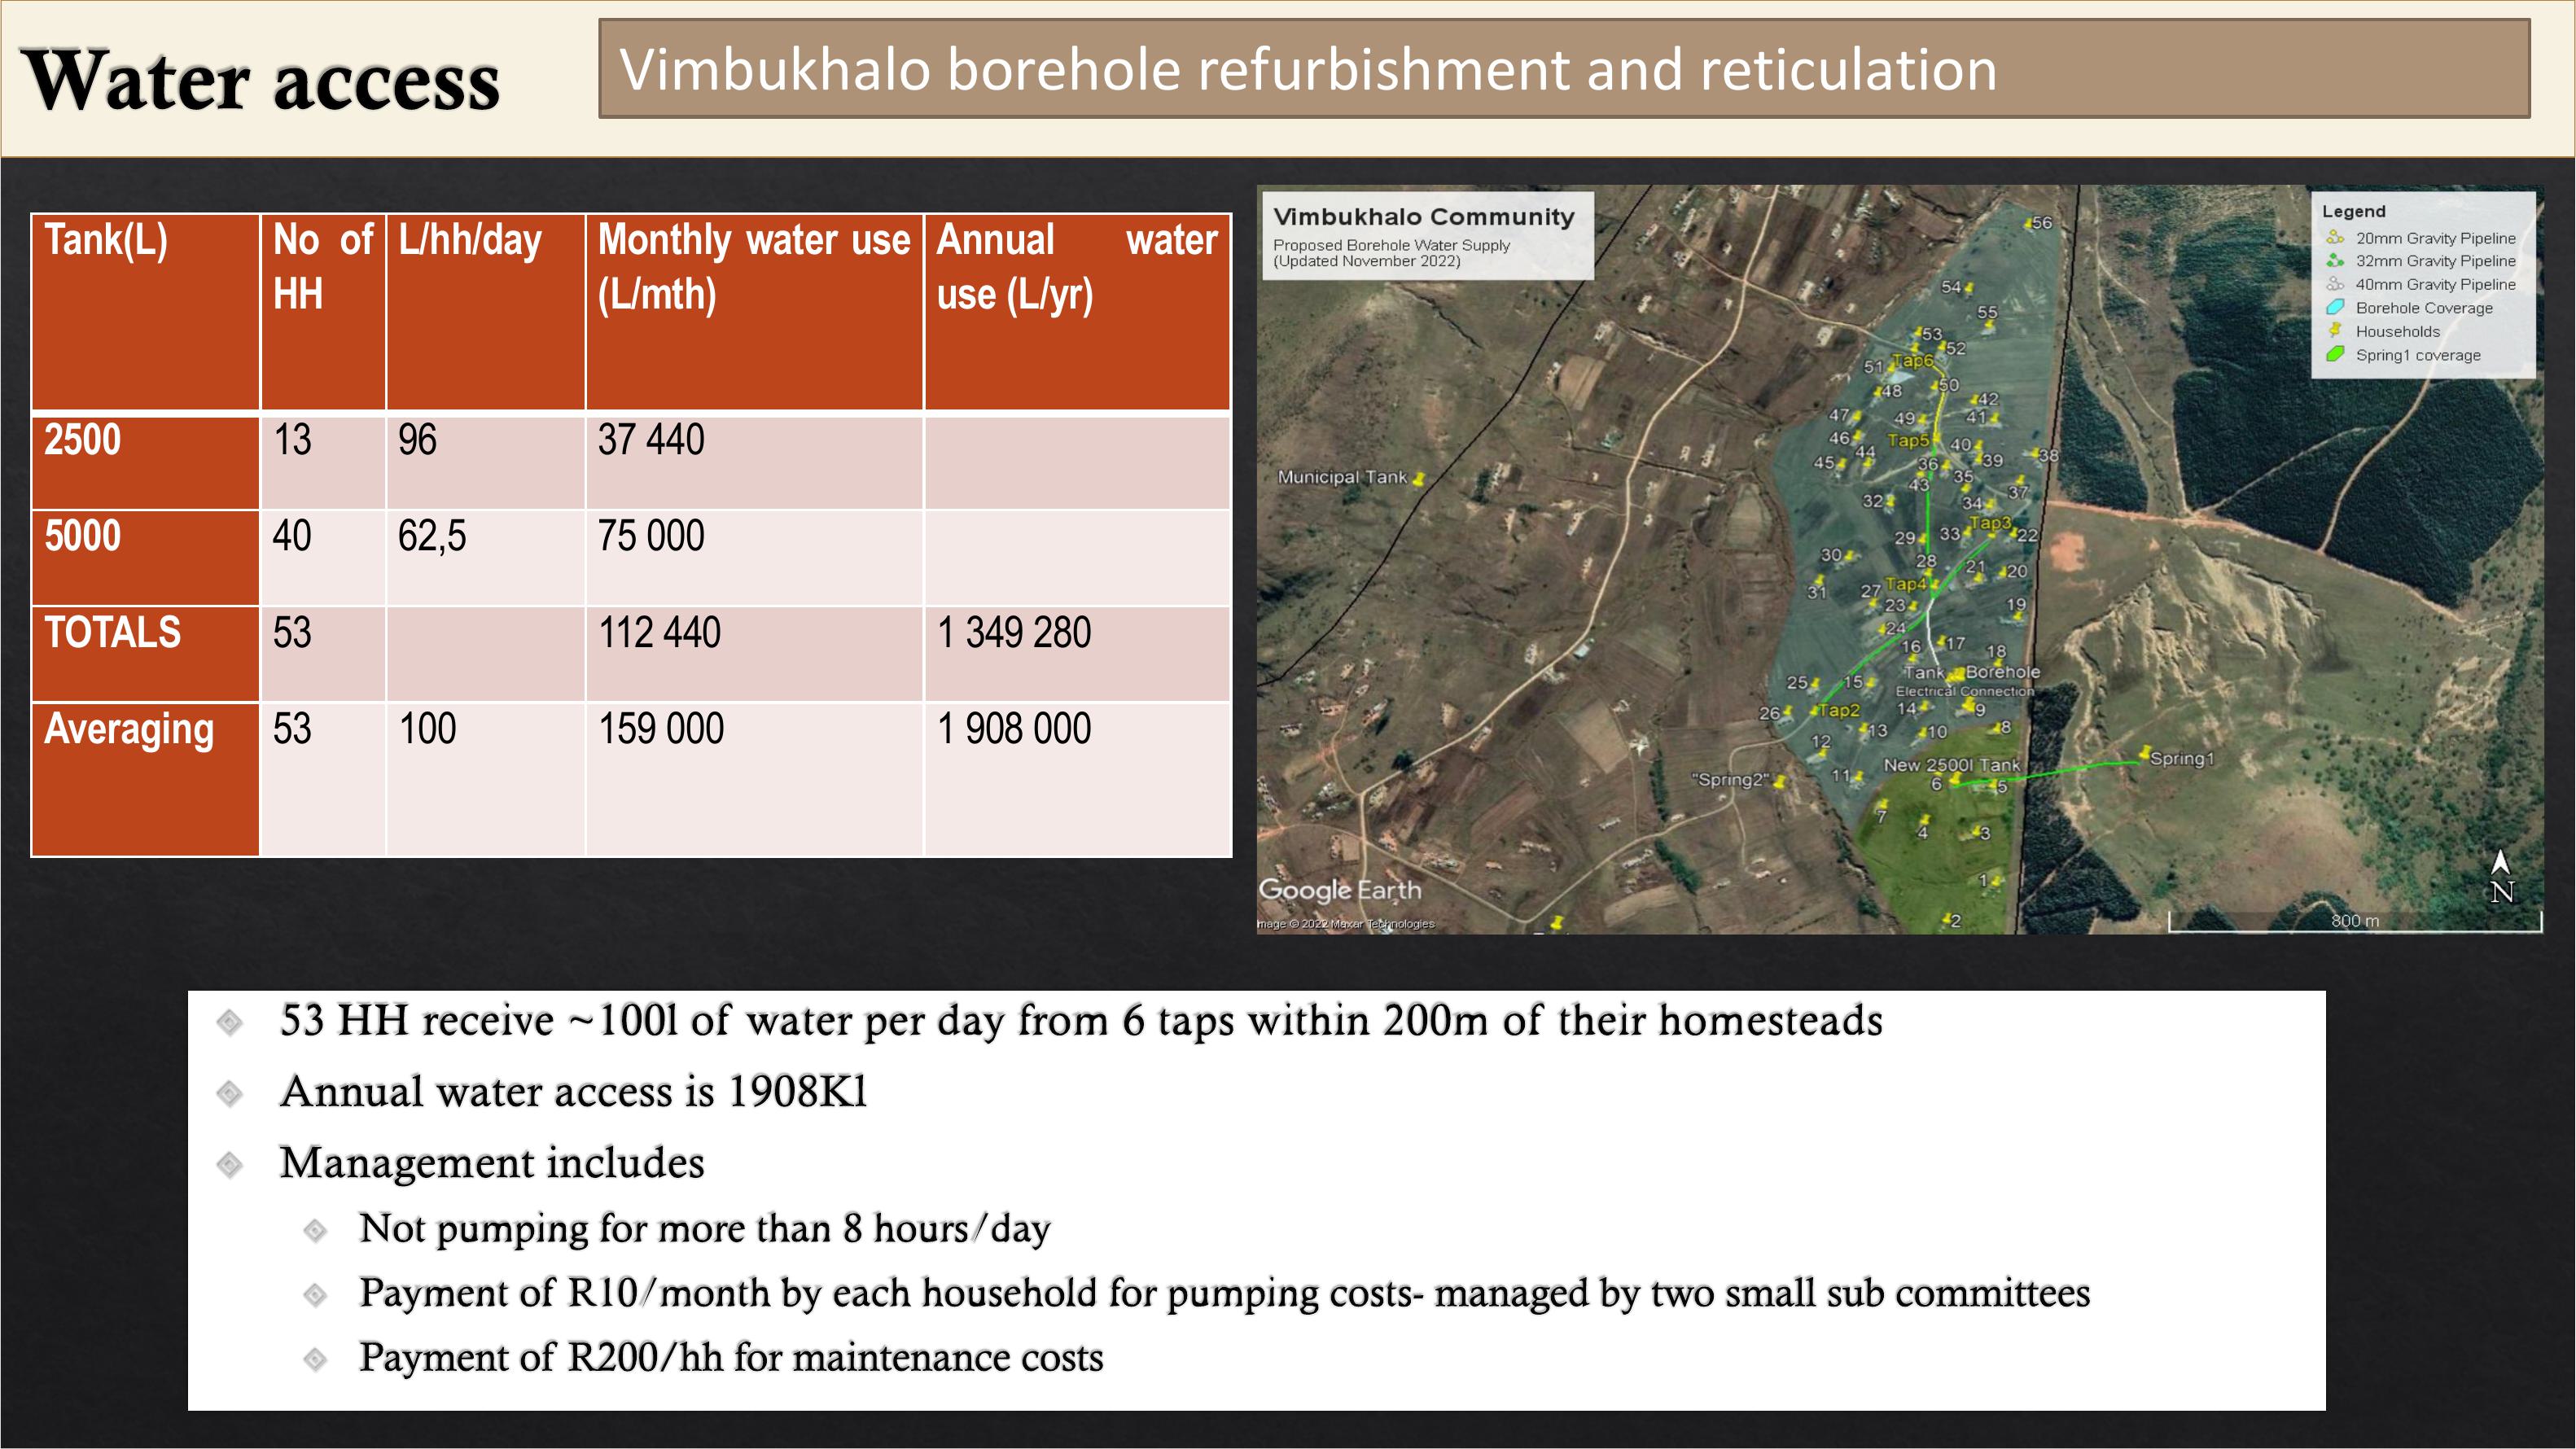
Tank(L)
No
of
HH
L/hh/day
Monthly
water
use
(L/mth)
Annual
water
use
(L/yr)
2500
13
96
37
440
5000
40
62
,5
75
000
TOTALS
53
112
440
1
349280
Averaging
53
100
159
000
1
908000
Vimbukhalo borehole refurbishment and reticulation
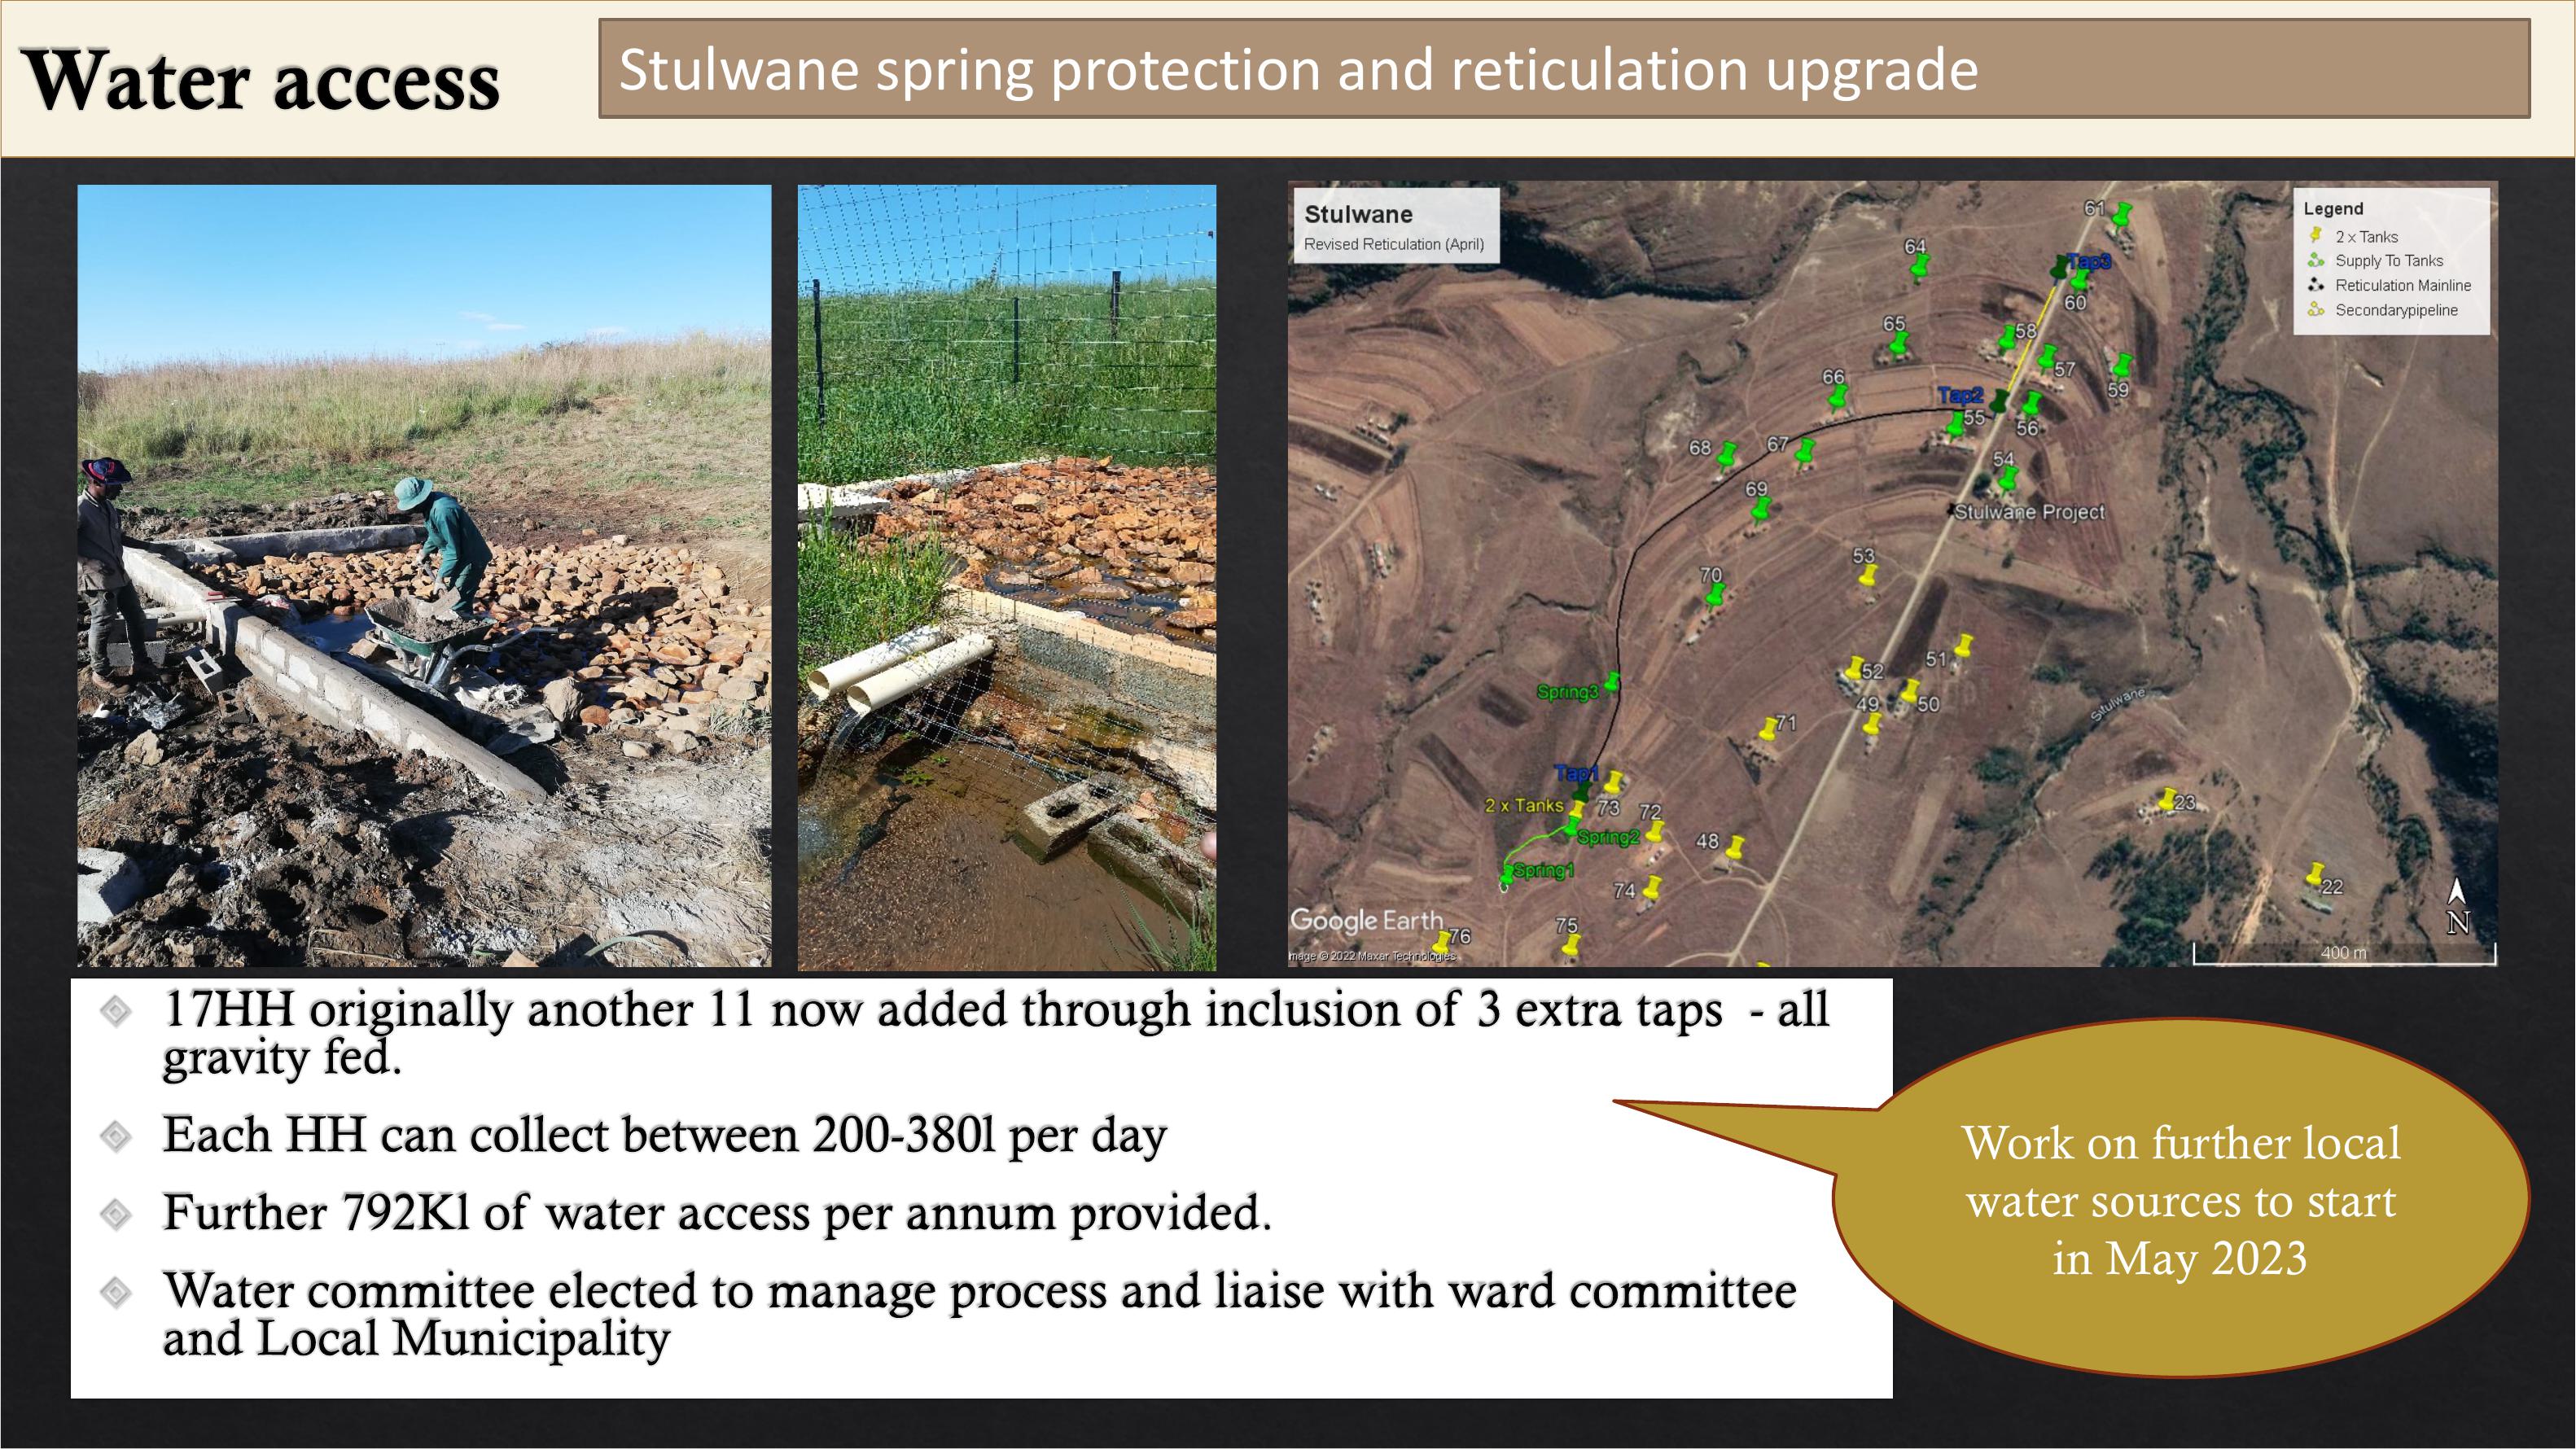
Stulwanespring protection and reticulation upgrade
Workonfurtherlocal
watersources tostart
in May 2023

Stulwane2x in stream abstraction and reticulation
Many more
participants, but
lower overall water-
as sources aren’t that
strong
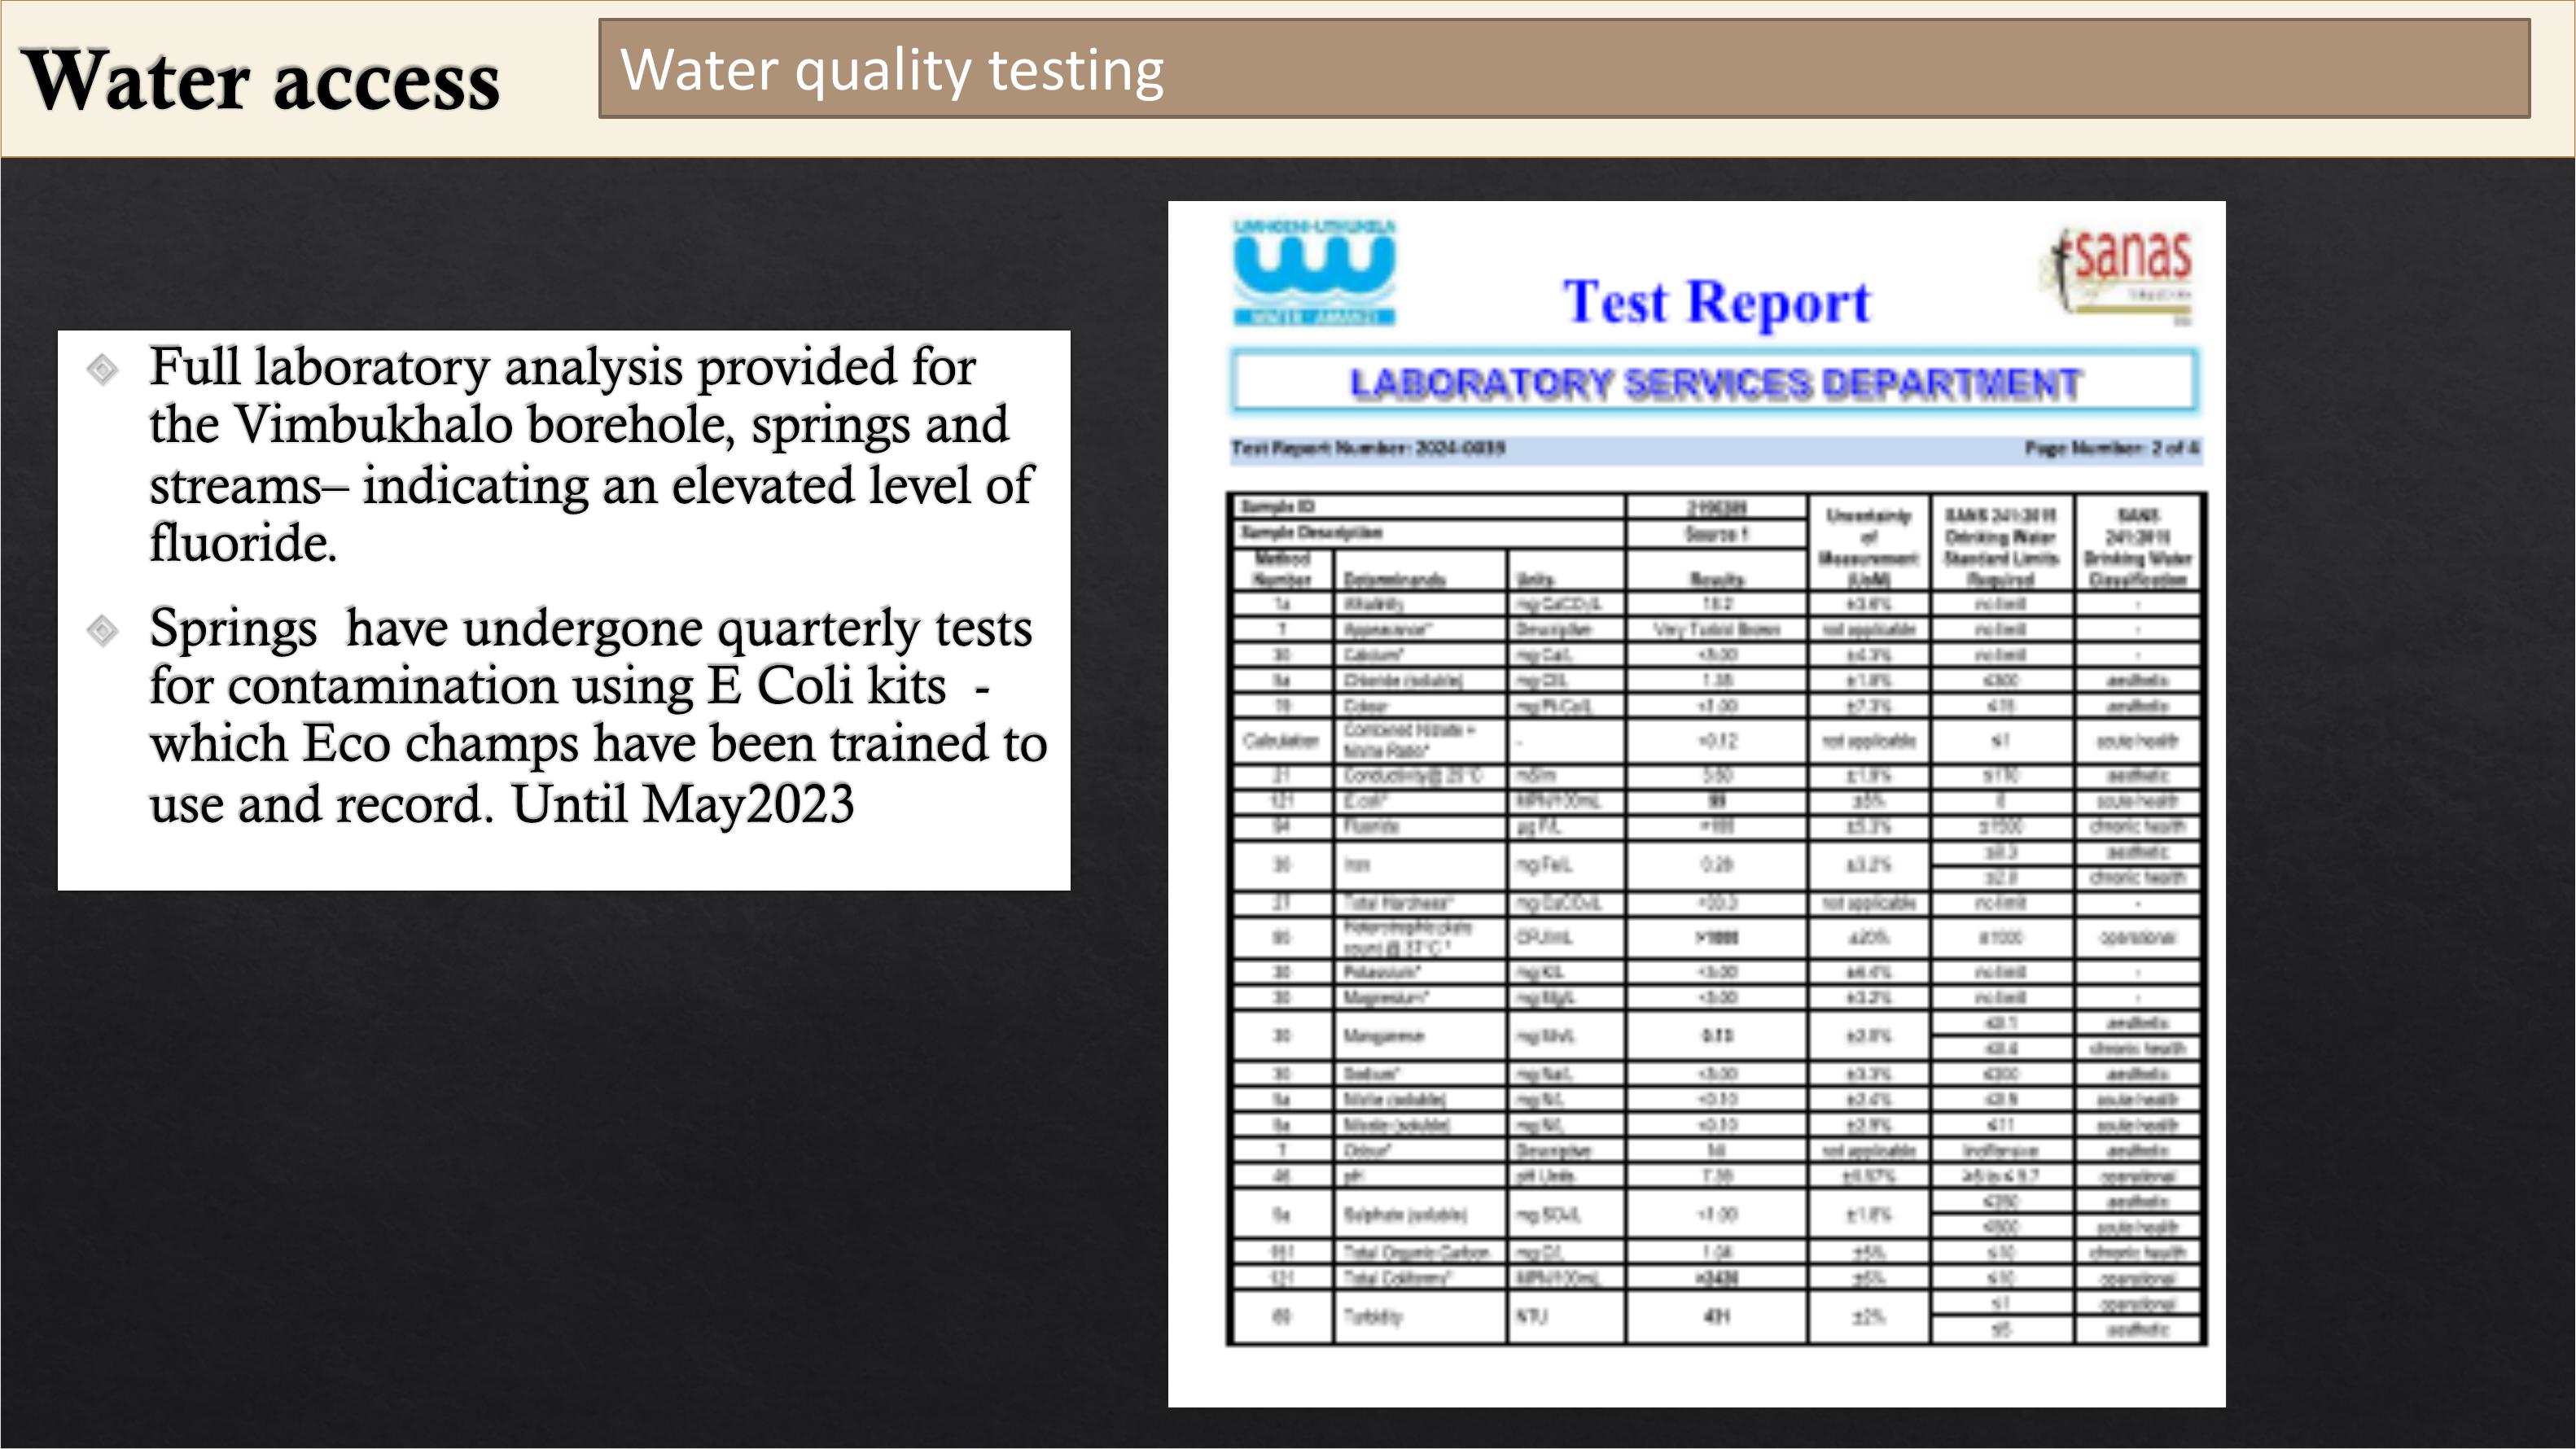
Waterqualitytesting
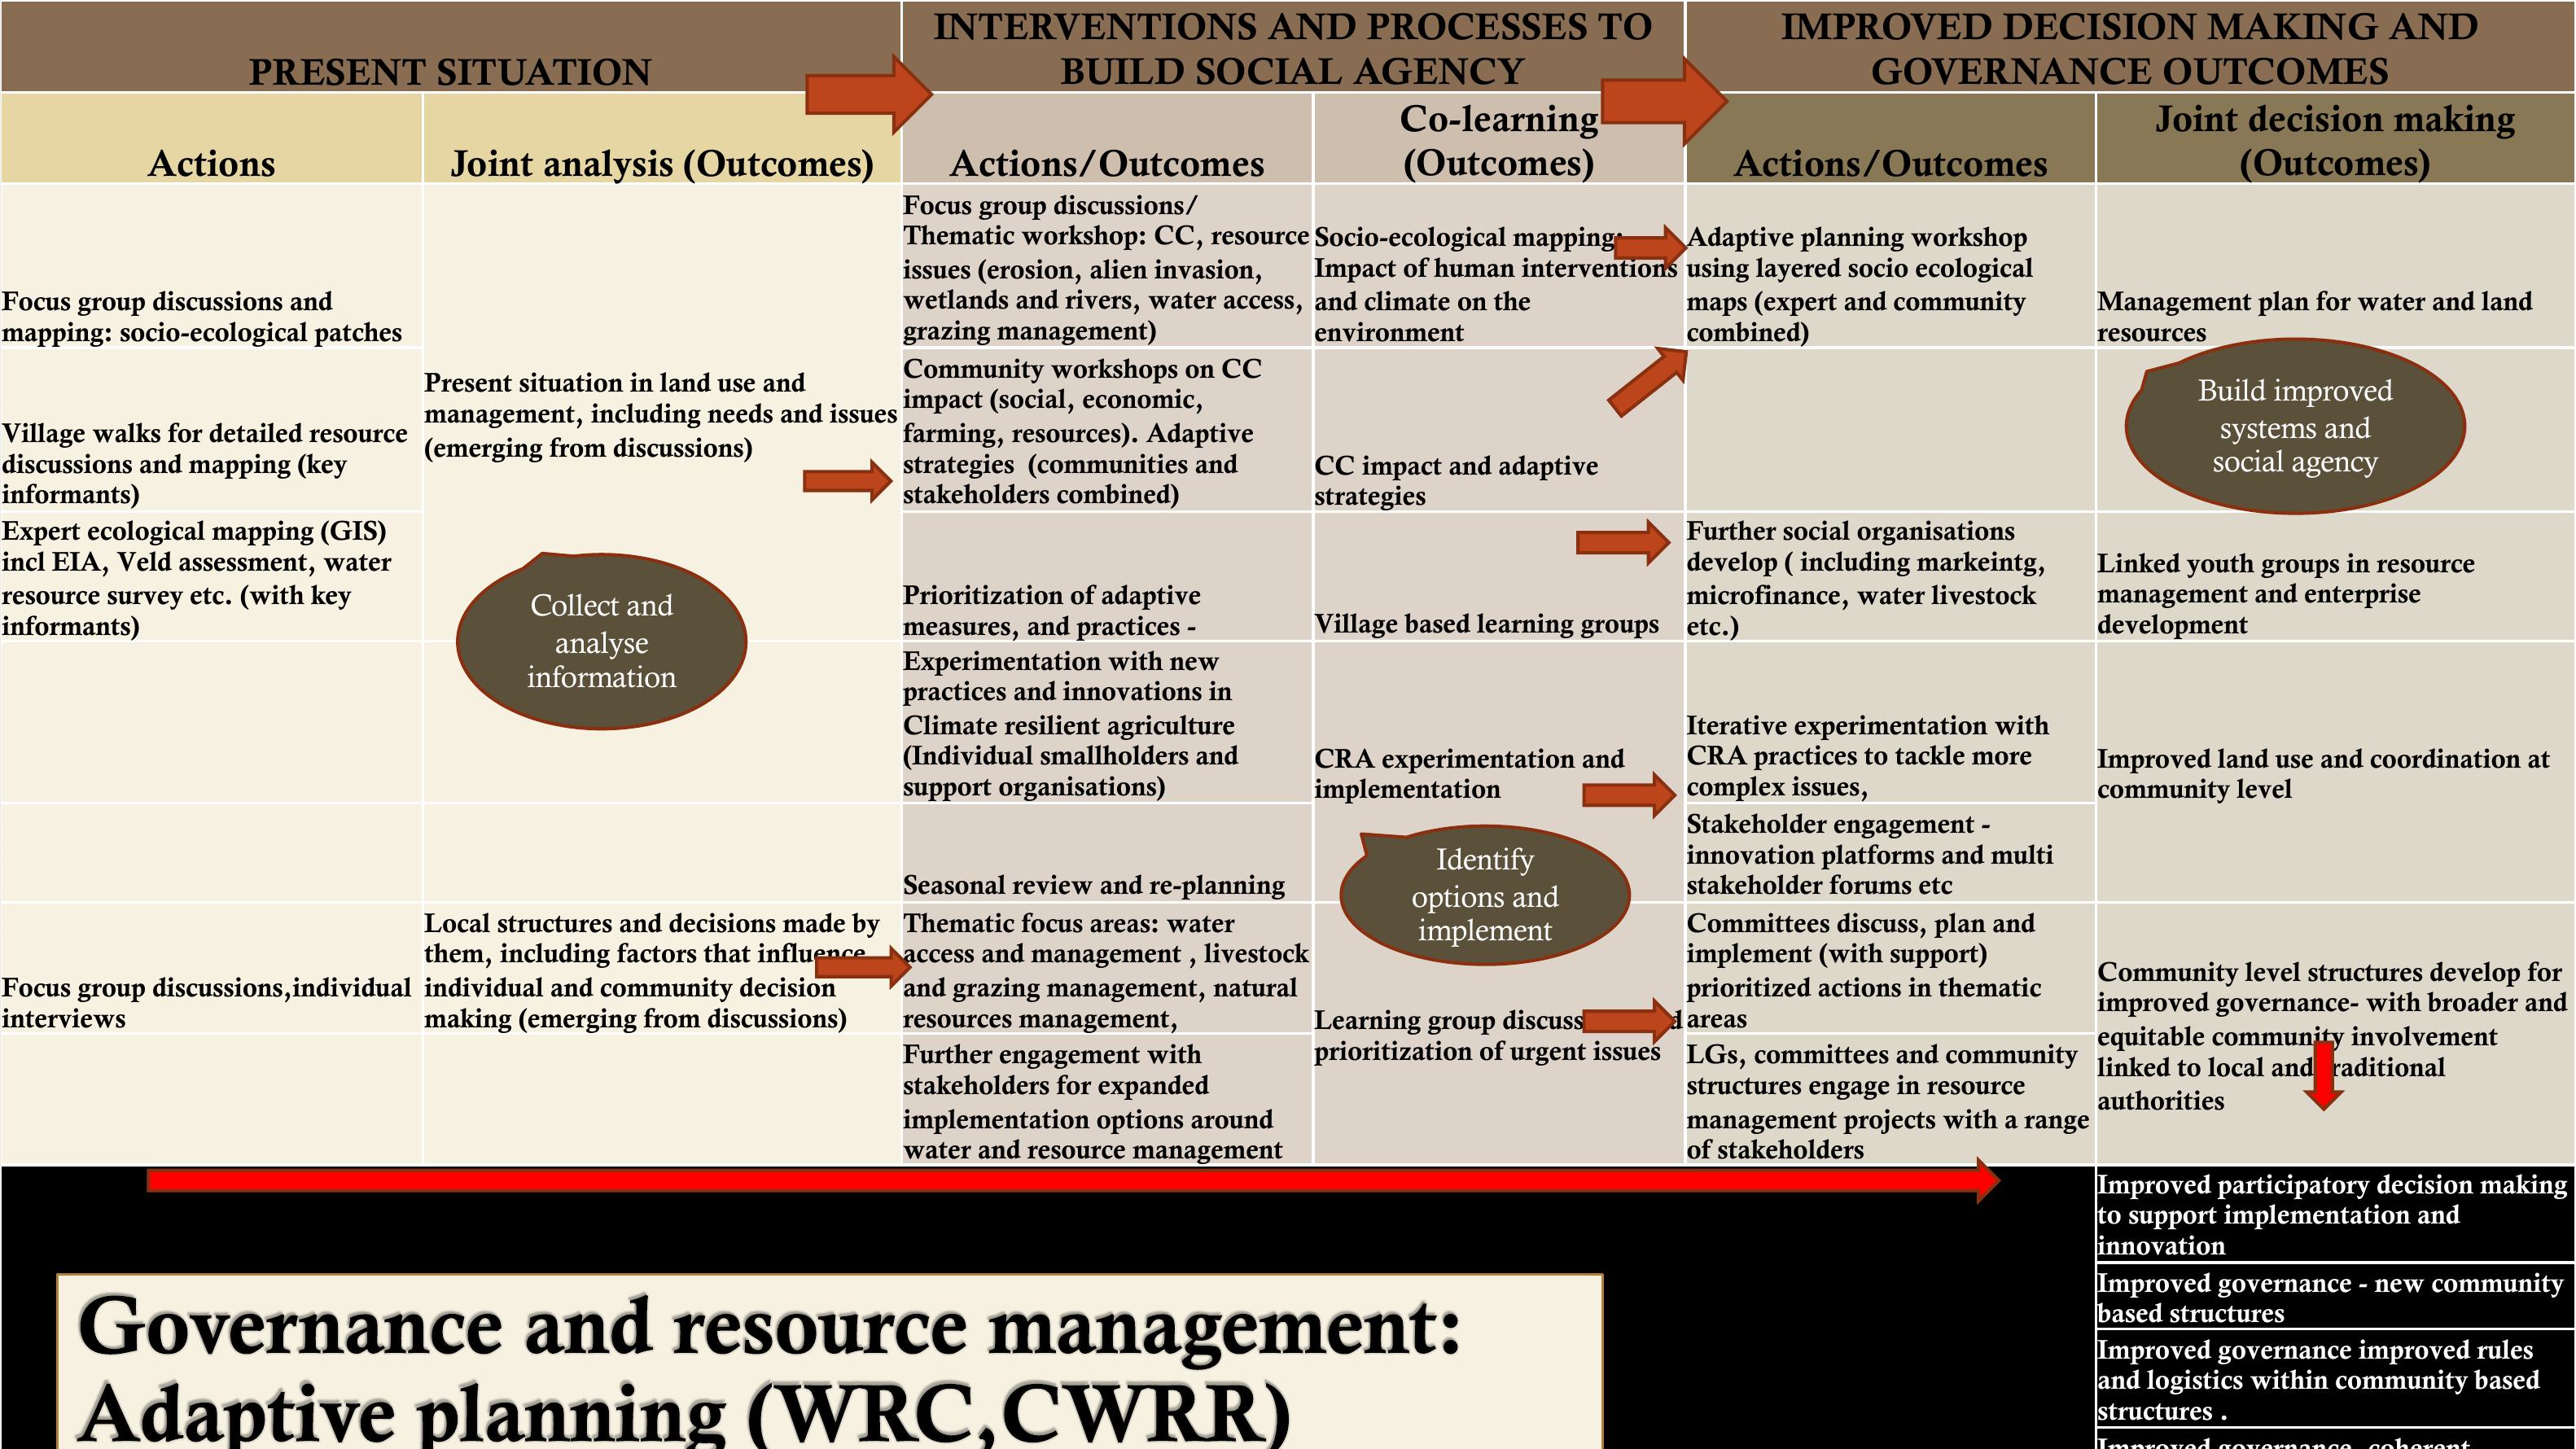
PRESENT SITUATION
INTERVENTIONS AND PROCESSES TO
BUILD SOCIAL AGENCY
IMPROVED DECISION MAKING AND
GOVERNANCE OUTCOMES
Actions Jointanalysis(Outcomes)Actions/Outcomes
Co-learning
(Outcomes) Actions/Outcomes
Joint decisionmaking
(Outcomes)
Focus group discussions and
mapping: socio
-ecological patches
Present situation in land use and
management, including needs and issues
(emerging from discussions)
Focus group discussions/
Thematic workshop: CC, resource
issues (erosion, alien invasion,
wetlands and rivers, water access,
grazing management)
Socio
-ecological mapping:
Impact of human interventions
and climate on the
environment
Adaptive planning workshop
using layered socio ecological
maps (expert and community
combined)
Management plan for water and land
resources
Village walks for detailed resource
discussions and mapping (key
informants)
Community workshops on CC
impact (social, economic,
farming, resources). Adaptive
strategies (communities and
stakeholders combined)
CC impact and adaptive
strategies
Expert ecological mapping (GIS)
incl
EIA, Veld assessment, water
resource survey etc. (with key
informants)
Prioritization of adaptive
measures, and practices
-
Village based learning groups
Further social organisations
develop ( including markeintg,
microfinance, water livestock
etc.)
Linked youth groups in resource
management and enterprise
development
Experimentation with new
practices and innovations in
Climate resilient agriculture
(Individual smallholders and
support organisations)
CRA experimentation and
implementation
Iterative experimentation with
CRA practices to tackle more
complex issues,
Improved land use and coordination at
community level
Seasonal review and re
-planning
Stakeholder engagement
-
innovation platforms and multi
stakeholder forums etc
Focus group discussions,individual
interviews
Local structures and decisions made by
them, including factors that influence
individual and community decision
making (emerging from discussions)
Thematic focus areas: water
access and management , livestock
and grazing management, natural
resources management,
Learning group discussions and
prioritization of urgent issues
Committees discuss, plan and
implement (with support)
prioritized actions in thematic
areas
Community level structures develop for
improved governance
-
with broader and
equitable community involvement
linked to local and traditional
authorities
Further engagement with
stakeholders for expanded
implementation options around
water and resource management
LGs, committees and community
structures engage in resource
management projects with a range
of stakeholders
OUTCOMES
Improved participatory decision making
to support implementation and
innovation
Improved governance
-
new community
based structures
Improved governance improved rules
and logistics within community based
structures .
Improved governance
- coherent
collaboration with stakeholders and role
players.
Collect and
analyse
information
Identify
options and
implement
Build improved
systems and
social agency
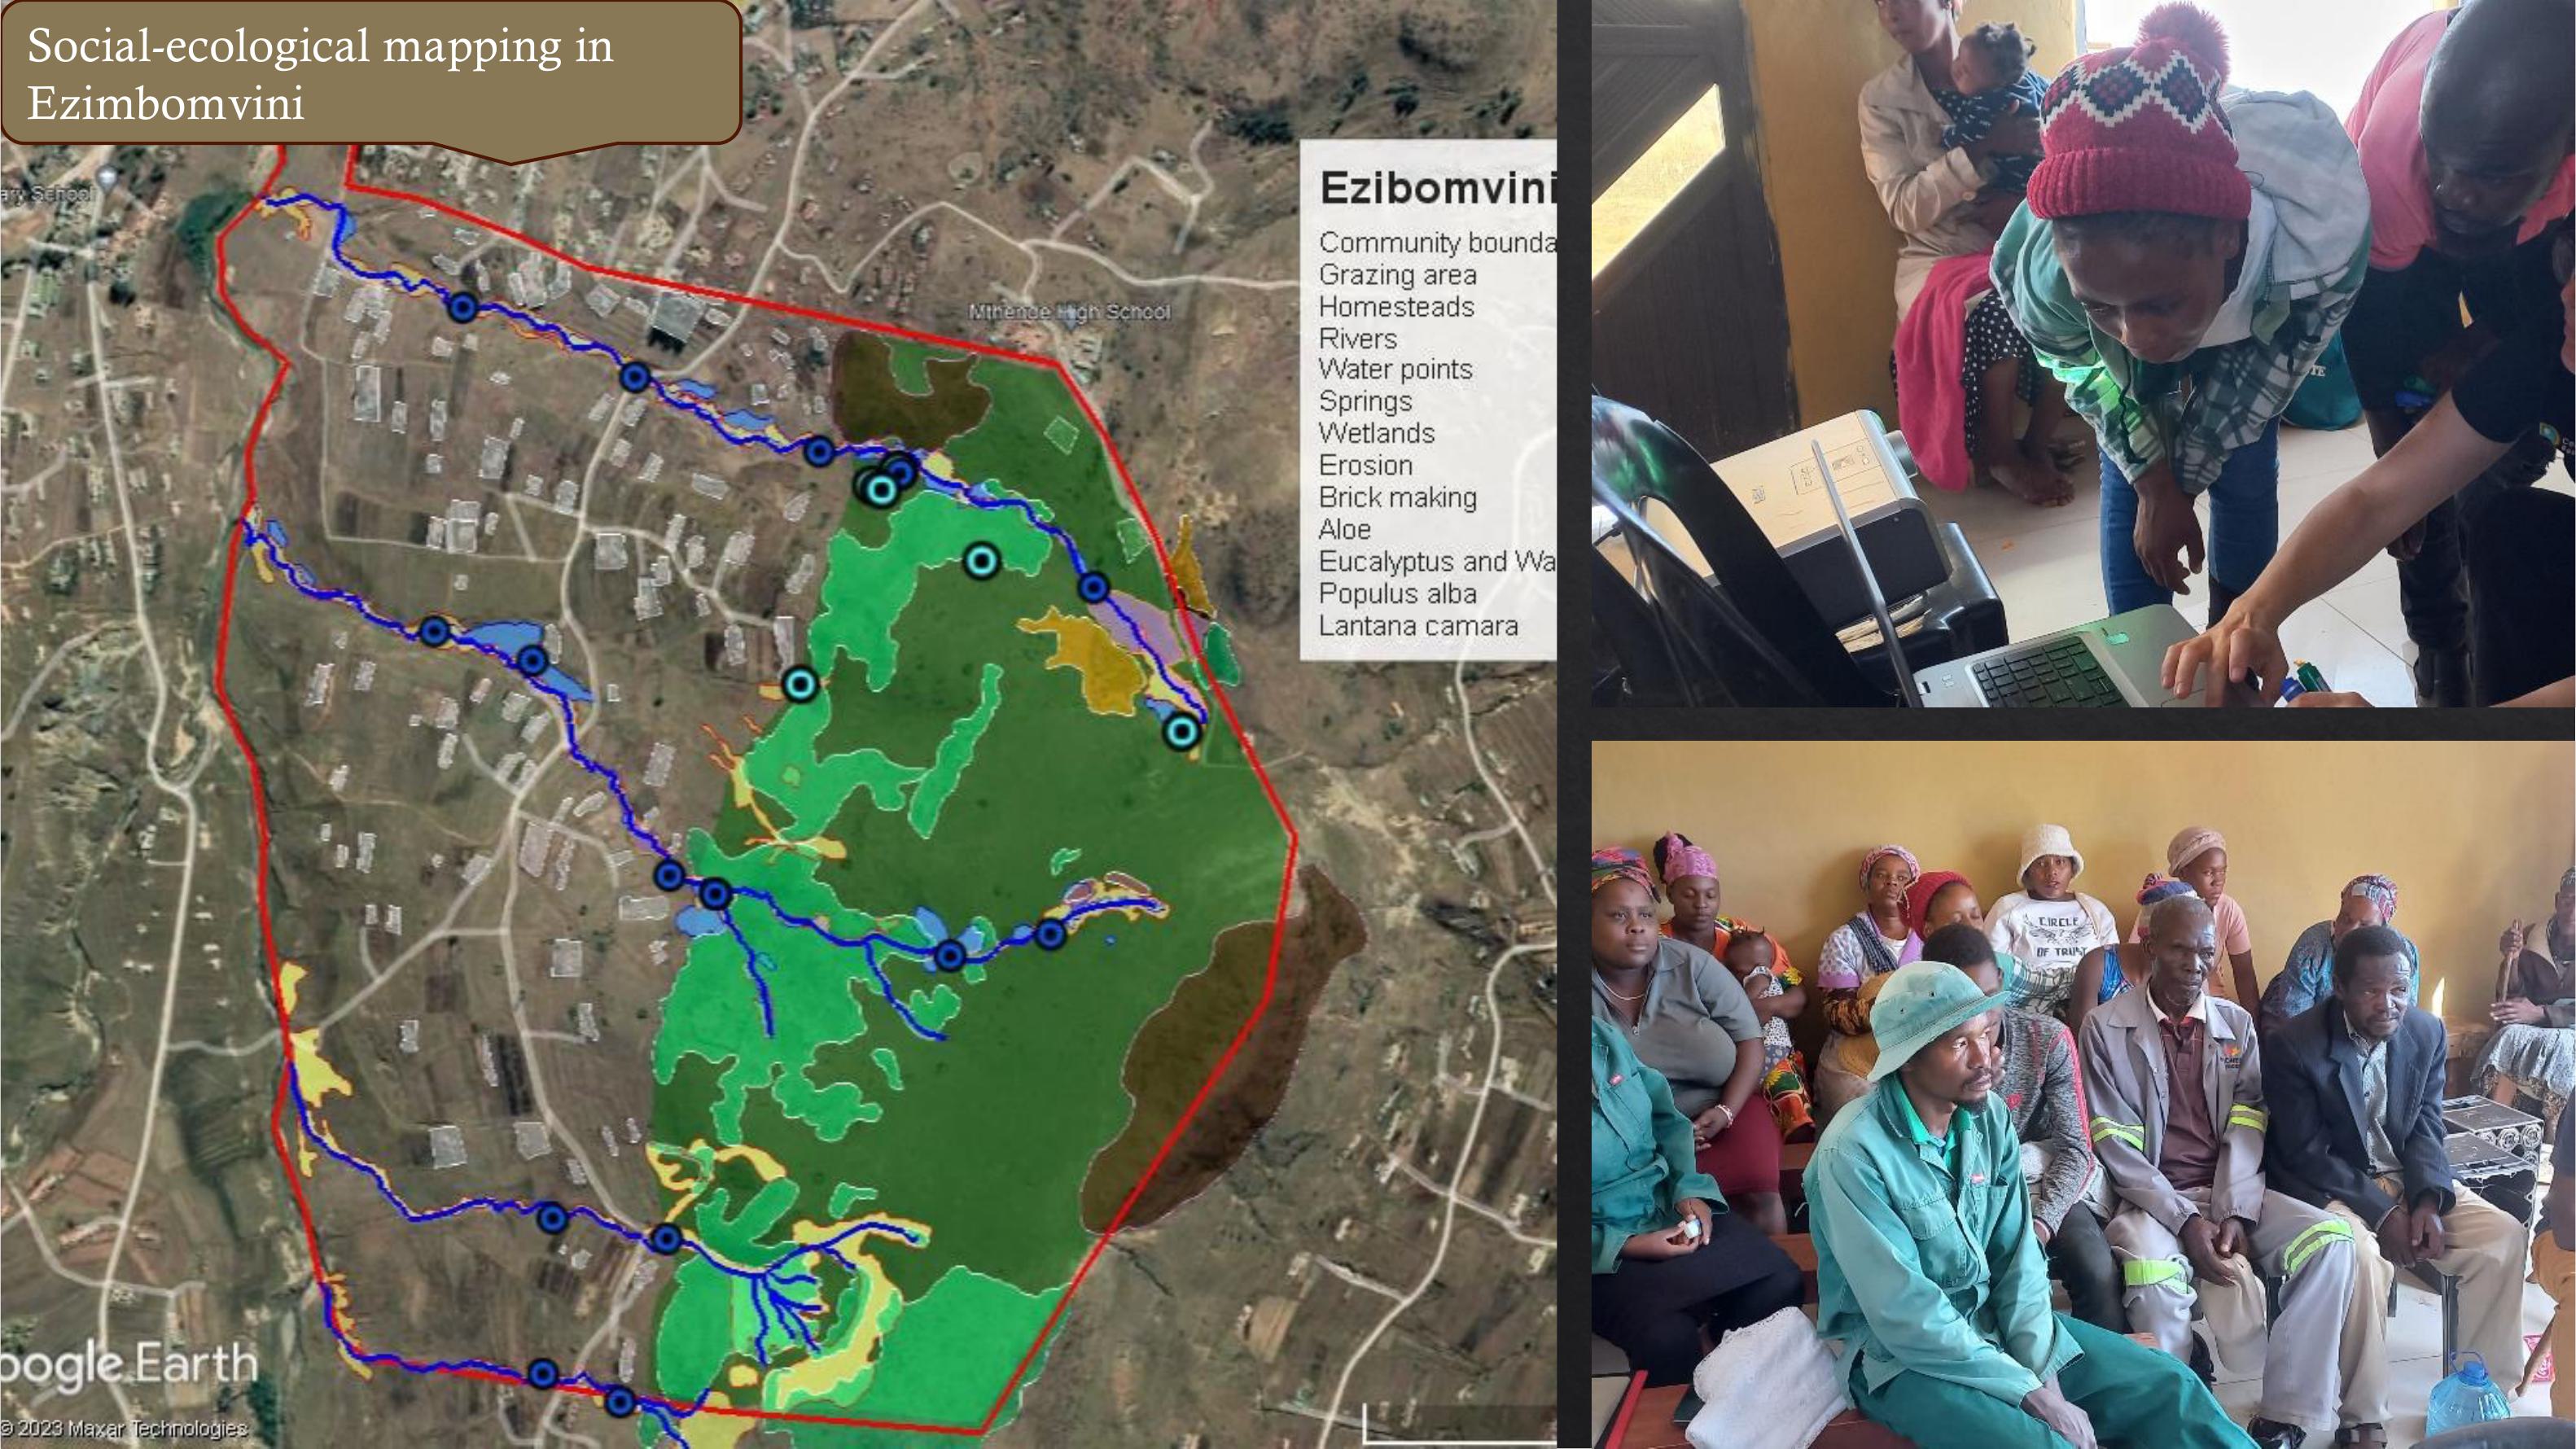
Social-ecological mapping in
Ezimbomvini

Social-ecological mapping in Costone

Local resource management areas for improved eco system services
- Community defined
Key Area
Management required
Notes
Grazing areas
(Amadlelo)
-
Livestock feed and water,
firewood, medicinal plants,
Restoration and management
.
-
Clear Lantana and use poison after cutting to stop regrowth
-
Rotational grazing
-
Control wildfires and make firebreaks. Storage drums for emergencies with fire one can
use
-
Explore financial benefit – grant/incentive mechanisms
-
Monitor and manage nutrition of veld (erosion control, overgrazing control, removal of
poisonous weeds, re
-seed of palatable species)
-
Awareness raising inthe communityand for livestock owners.
-
Eco-champs to do clearing
-
Dip tank committees and livestock associations
-
Better community collaboration with dip tank committee
as well as TA and councillors
-
Community workdays
- Clearing of Lantana in Ezibomviniand Costone.
- Moving gates and fixing fences in Costone
grazing area
- WorkshoppresentedbyWorkingonFireteamin
the uThukela area- re firebreaks and fire
management

Erosion control
-Toensureavailabilityand
quality of water and soil
resources
Restoration
-
Awareness raising and outline of responsible actions to enforce
-
Avoid expanding of minor erosion into dongas.
-
Prevent siltation and pollution.
-
Allow re-vegetation, naturally or through re-seeding
-
Prevent run-off
-
Check dams, brush packs, stone packs,
-
Prevent livestock from causing further damage
-
Control wildfire- make fire breaks
Storage drums for emergencies with fire one can use
-
TA andlivestockcommitteestoundertakesome
actions
-
Eco champs to assist
-
Some actions and contributions from community as a
whole (e.g. loan of tractors, small financial
contributions
-
External support
-
Continued support from UKZN and MDF in mapping,
planning, proposal development, community structures
and management
Alien trees
-
Eucalyptus, poplar, and
wattle plantations, and
patches
Small changes
-
Promote better management by ‘owners’
-
Cut down and poison lantana and encroaching poplars
-
Ensure management of wattle patches
-
Remove trees from water sources and streams in all cases
-
TA,Nkosiand‘owners”encouragedtoundertake
management activities as trees are useful in the
community and cannot just be cleared.
Local resource management areas for improved eco system services
- Community defined
Key Area
Management required
Notes

Stone packs and stone lines by eco champs in
Ezibomviniand Community inCosotone
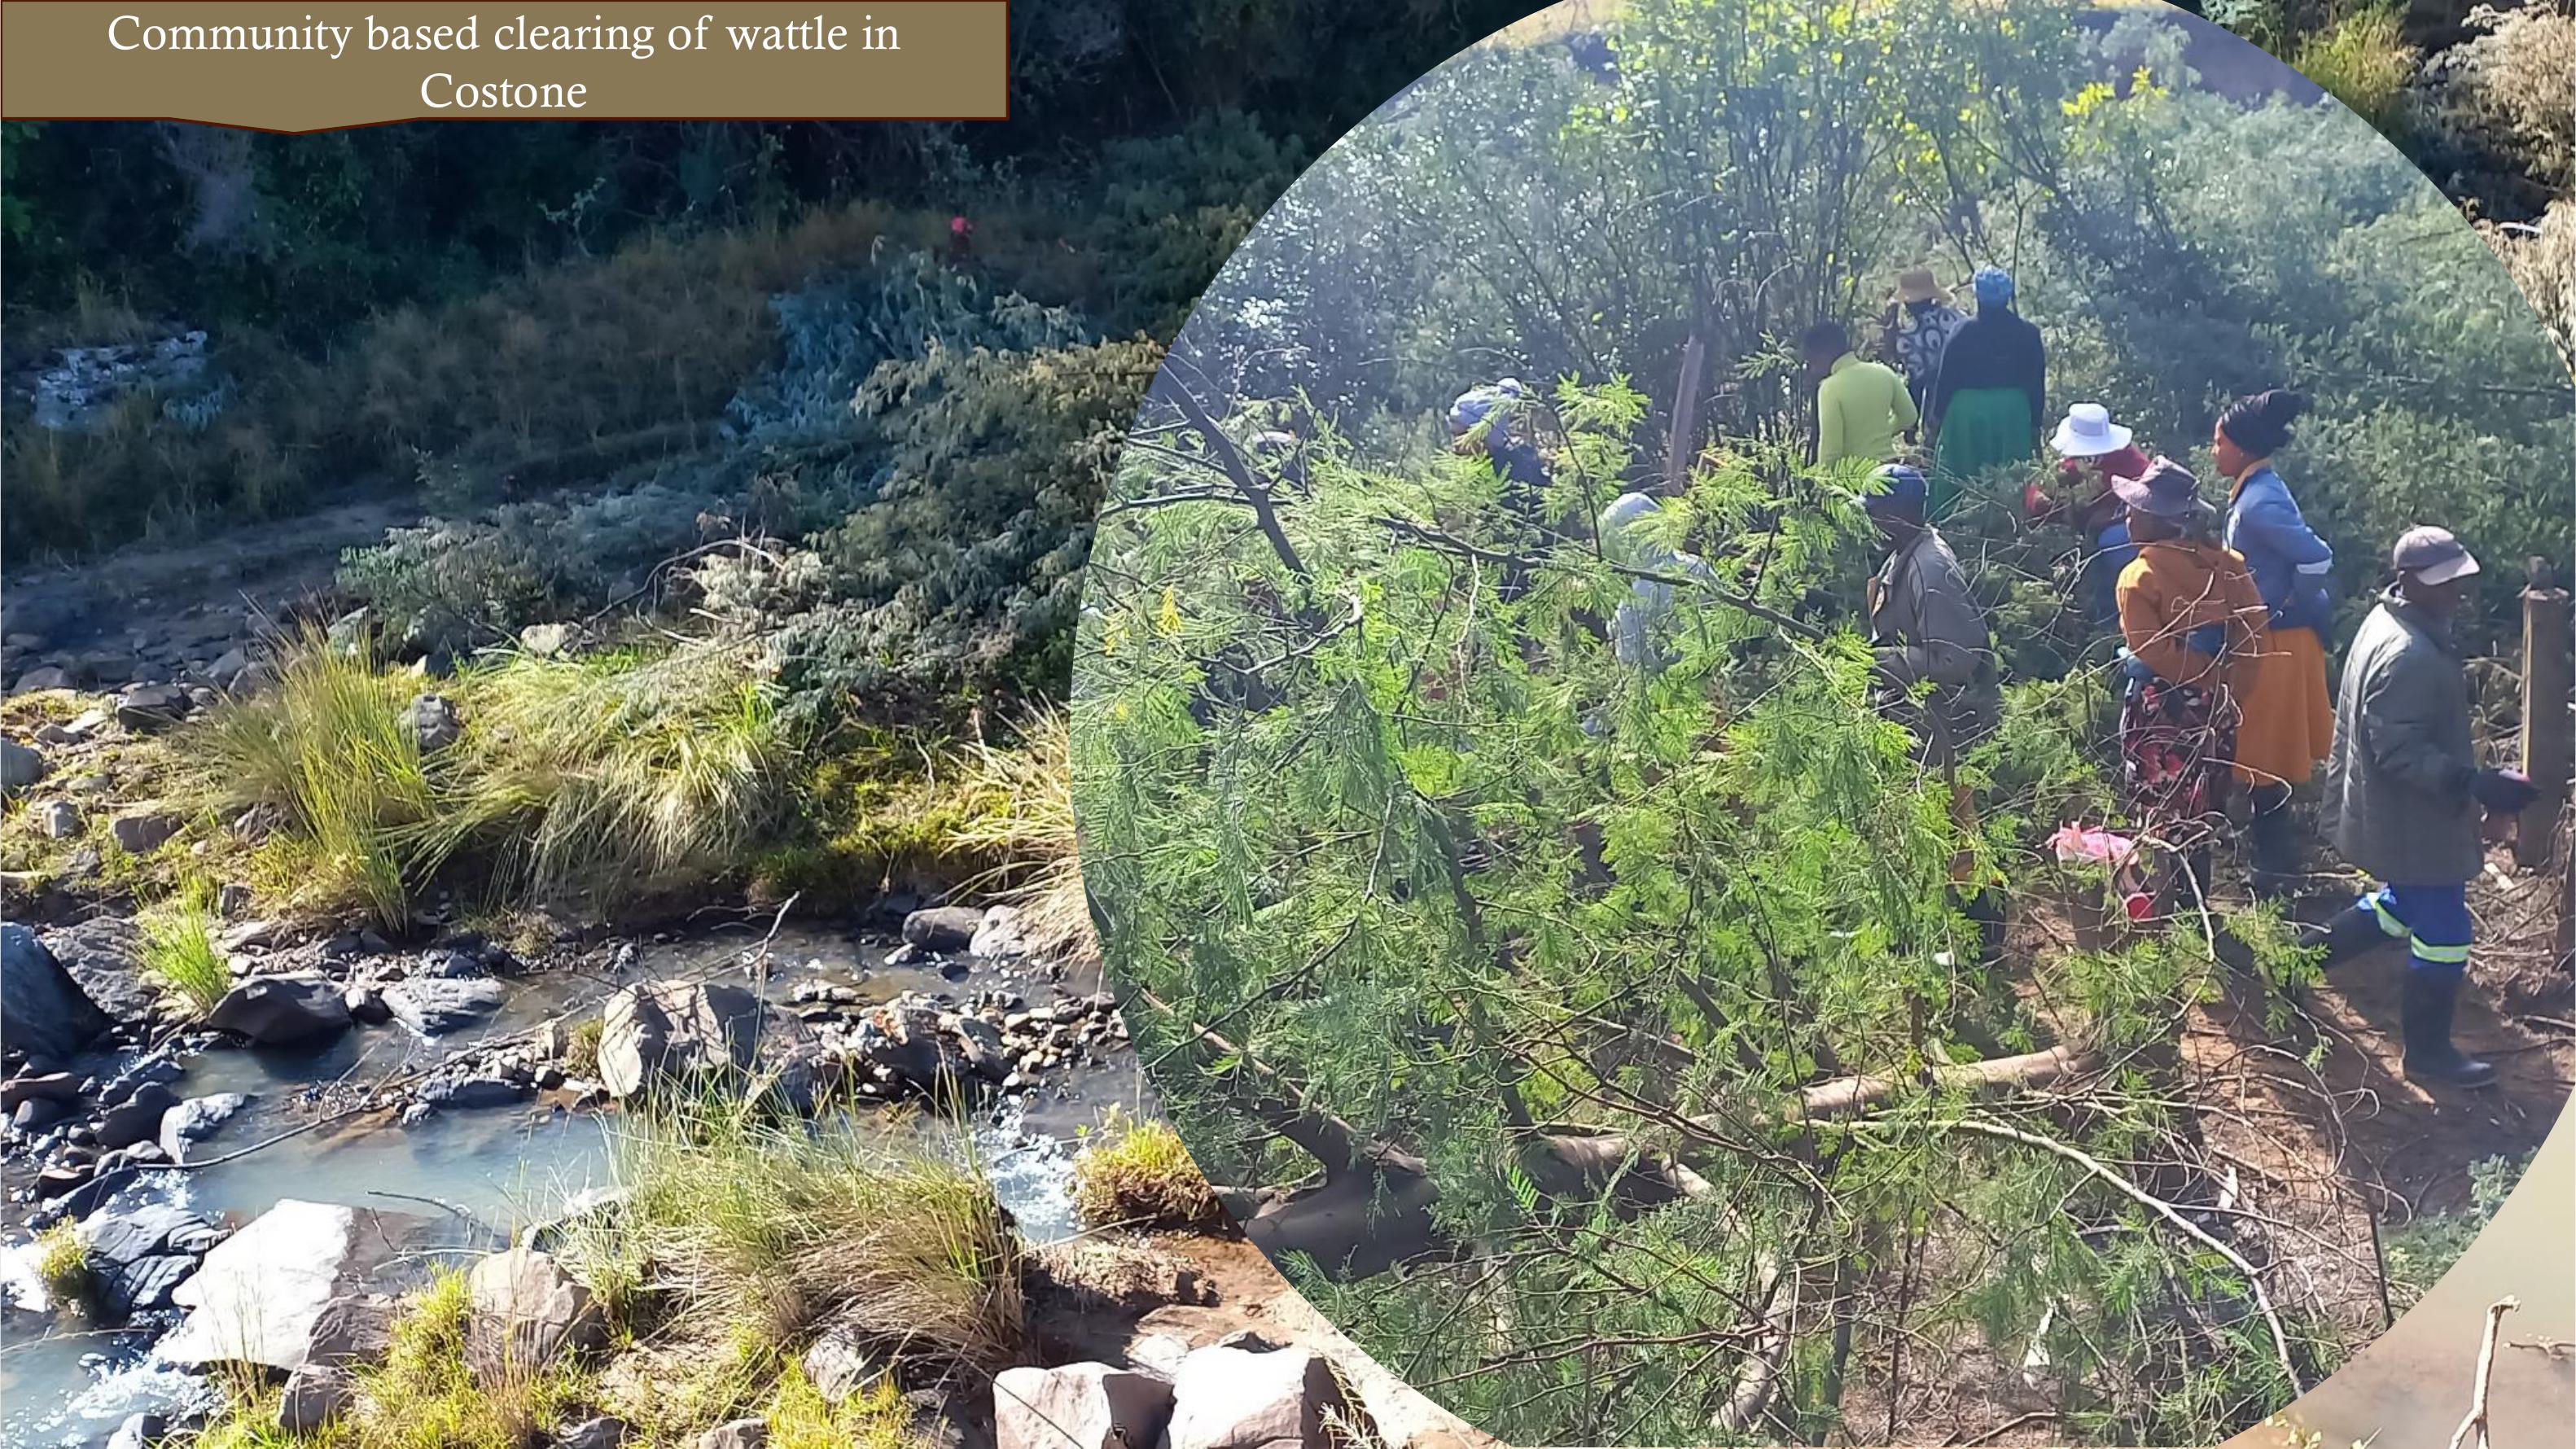
Community based clearing of wattle in
Costone

WaterqualitytestinginEzibomviniandCostone, including mini SASS and
E.coli. Cleaning of streambeds by community in Costone
