
WORKING PAPER | August 2019 | 1
WORKING PAPER
VOLUMETRIC WATER BENEFIT ACCOUNTING VWBA:
A METHOD FOR IMPLEMENTING AND VALUING
WATER STEWARDSHIP ACTIVITIES
PAUL REIG, WENDY LARSON, SAMUEL VIONNET, AND JEAN-BAPTISTE BAYART
CONTENTS
Executive Summary .......................................1
Abbreviations .............................................6
Introduction ................................................7
Approach ..................................................11
Method ....................................................14
Communication and Aggregation ......................25
Discussion ................................................ 26
Appendix A: Calculation Methods
and Illustrative Examples ...............................26
Glossary ..................................................45
References ...............................................46
Acknowledgments ....................................... 48
About the Authors .......................................50
Working Papers contain preliminary research, analysis,
ndings, and recommendations. They are circulated to
stimulate timely discussion and critical feedback, and to
inuence ongoing debate on emerging issues. Working
papers may eventually be published in another form and
their content may be revised.
Suggested Citation: Reig, P., W. Larson, S. Vionnet, and J.B.
Bayart. 2019. “Volumetric Water Benet Accounting (VWBA):
A Method for Implementing and Valuing Water Stewardship
Activities.” Working Paper. Washington, DC: World Resources
Institute. Available online at www.wri.org/publication/volumetric-
water-benet-accounting.
EXECUTIVE SUMMARY
Highlights
▪Volumetric water benets (VWBs) are the volume
of water resulting from water stewardship activities,
relative to a unit of time, that modify the hydrology
in a benecial way and/or help reduce shared water
challenges, improve water stewardship outcomes, and
meet the targets of Sustainable Development Goal 6.
▪Volumetric water benet accounting (VWBA) pro-
vides corporate water stewardship practitioners with a
standardized approach and set of indicators to quan-
tify and communicate the volumetric water benets,
complementary indicators to measure nonvolumetric
outputs, and elements of eective water stewardship
activities that increase the likelihood of generating
social, economic, and environmental benets and
solving shared water challenges.
▪The method we propose includes recommended
indicators and calculation methods for each water
stewardship activity, communication guidelines, and
a three-step process for implementation: (1) identify
shared water challenges and understand local context;
(2) dene water stewardship project activities and
partners; and (3) gather data and calculate volumetric
water benets.
▪The limitations of VWBA include the lack of calcula-
tion methods for sanitation and hygiene, agrochemical
management, and in-stream channel rehabilitation
activities, as well as the need for additional assurance
to guarantee the associated social, economic, and
environmental benets.

2 |
▪The methods proposed can be enhanced with lessons
learned from pilot testing; monitoring, data collec-
tion, and analysis to strengthen hydrological models
and validate assumptions; and guidance to link water
stewardship activity outputs to social, economic, and
environmental outcomes and impacts.
The shared nature of water challenges is driving
companies to commit billions of dollars to alle-
viating exposure to water risk and to balancing a
volume of water equal to what they use, through
investments in watersheds and communities outside fac-
tory walls. Methods exist to estimate net benets of these
investments, but the growing demand from companies
calls for a common and unied method that drives invest-
ments to address shared water challenges and contribute
to public policy priorities.
Volumetric water benefit accounting (VWBA)
provides corporate water stewardship practi-
tioners with a standardized approach and set
of indicators to estimate and communicate the
volumetric water benefits of water stewardship
activities. Prior to using the methods proposed, compa-
nies will require a deep understanding of their water use
and exposure to risk and catchment conditions, as well as
clear and well-dened corporate water stewardship goals
and targets.
Volumetric water benefits (VWBs)are the volume
of water resulting from water stewardship activi-
ties, relative to a unit of time, that modify the
hydrology in a beneficial way and/or contribute
toward reducing shared water challenges (Figure
ES-1). Because providing a volume of water alone does
not guarantee that shared water challenges are reduced,
users of VWBA should also use elements of eective
water stewardship activities that increase the likelihood of
generating social, economic, and environmental benets
and solving shared water challenges in the catchment,
and complementary indicators to measure nonvolumetric
outputs of investments.
VWBA helps calculate and communicate volumet-
ric water benefits of activities that contribute to
meeting water stewardship outcomes and SDG
targets and help solve shared water challenges
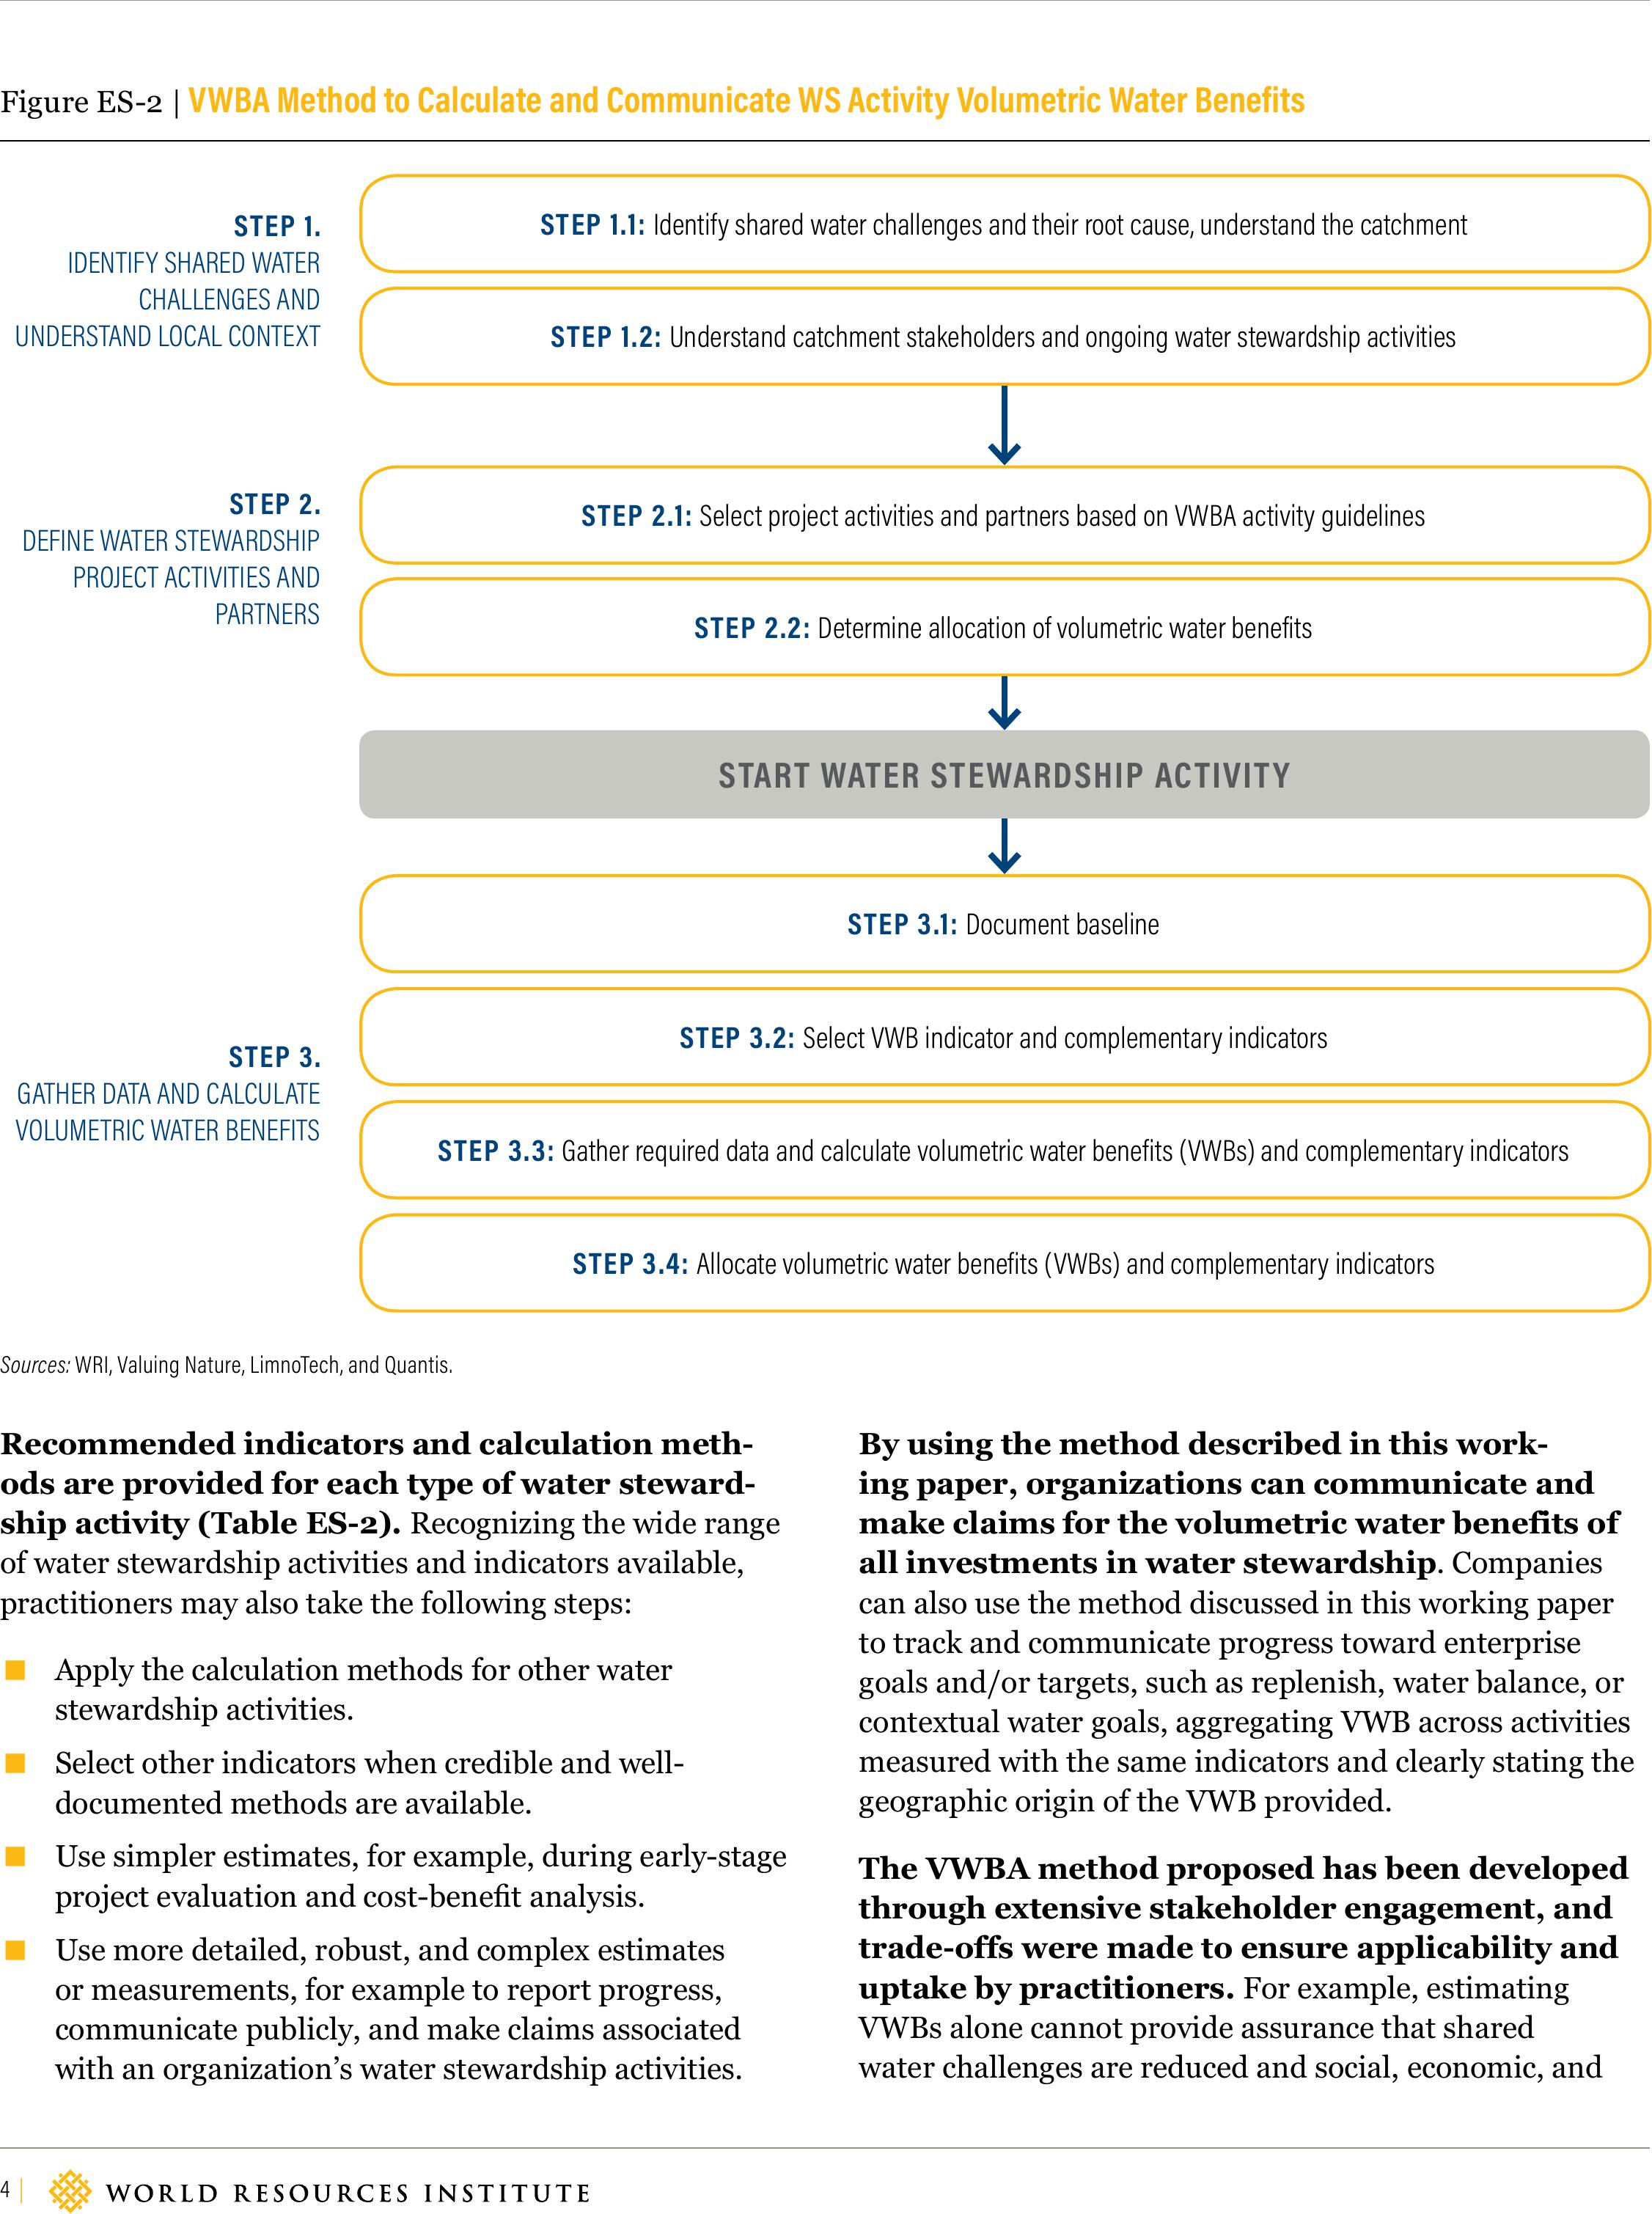
(Table ES-1), following a three-step method (Fig-
ure ES-2).
Figure ES-1 | Water Stewardship Activity Impact Pathway Modified from the Social and Human Capital Protocol
Source: Based on information from WBCSD (2019), modified by WRI, Valuing Nature, LimnoTech, and Quantis.
INPUTSACTIVITIES OUTPUTS OUTCOMES IMPACTS
Investment in water
stewardship
$150,000 to address local
groundwater table decline
Water stewardship activity
and activity requirements
Establishment of infiltration
wells for artificial aquifier
recharge of rainwater
Volumetric water benefits
and complementary
indicators
462 million liters
recharged per year
230 smallholder farmers
Social, economic, and environmental benefits
SOCIAL BENEFIT: increased drought resilience of
local farming community
ENVIRONMENTAL BENEFIT: improved wetland biodiversity
FOR EXAMPLEIMPACT PATHWAYWATER STEWARDSHIP

WORKING PAPER | August 2019 | 3
Volumetric Water Benefit Accounting (VWBA): A Method for Implementing and Valuing Water Stewardship Activities
Table ES-1 |Contributions to Water Stewardship Outcomes, Shared Water Challenges, and SDG Targets per Water
Stewardship Activity Category
Water Stewardship
Outcomesa
(1) Sustainable
Water Balance
(2) Good Water
Quality Status
(3) Good Water
Governance
(4) Important
Water-Related
Areas (IWRAs)
(5) Safe Water,
Sanitation, and
Hygiene for All
(WASH)
N/A
Shared Water
Challenge Water quantityWater qualityWater governance
Important
water-related
ecosystems
Water, sanitation,
and hygiene
(WASH)
Extreme weather
events
SDG Target(s)b6.1, 6.46.2, 6.36.5, 6A, 6B6.6., 136.1, 6.211.5, 13.1
WS ACTIVITY CATEGORY
Land
conservation
and restoration
Water supply
reliability
Water access
Water quality
Aquatic habitat
restoration
Water
governance
Catalytic
activities
Sources:WRI, Valuing Nature, LimnoTech, and Quantis.
Notes: Categories as defined in the VWBA water stewardship activity classification.
a AWS (2019).
b UN (2015).
4 |
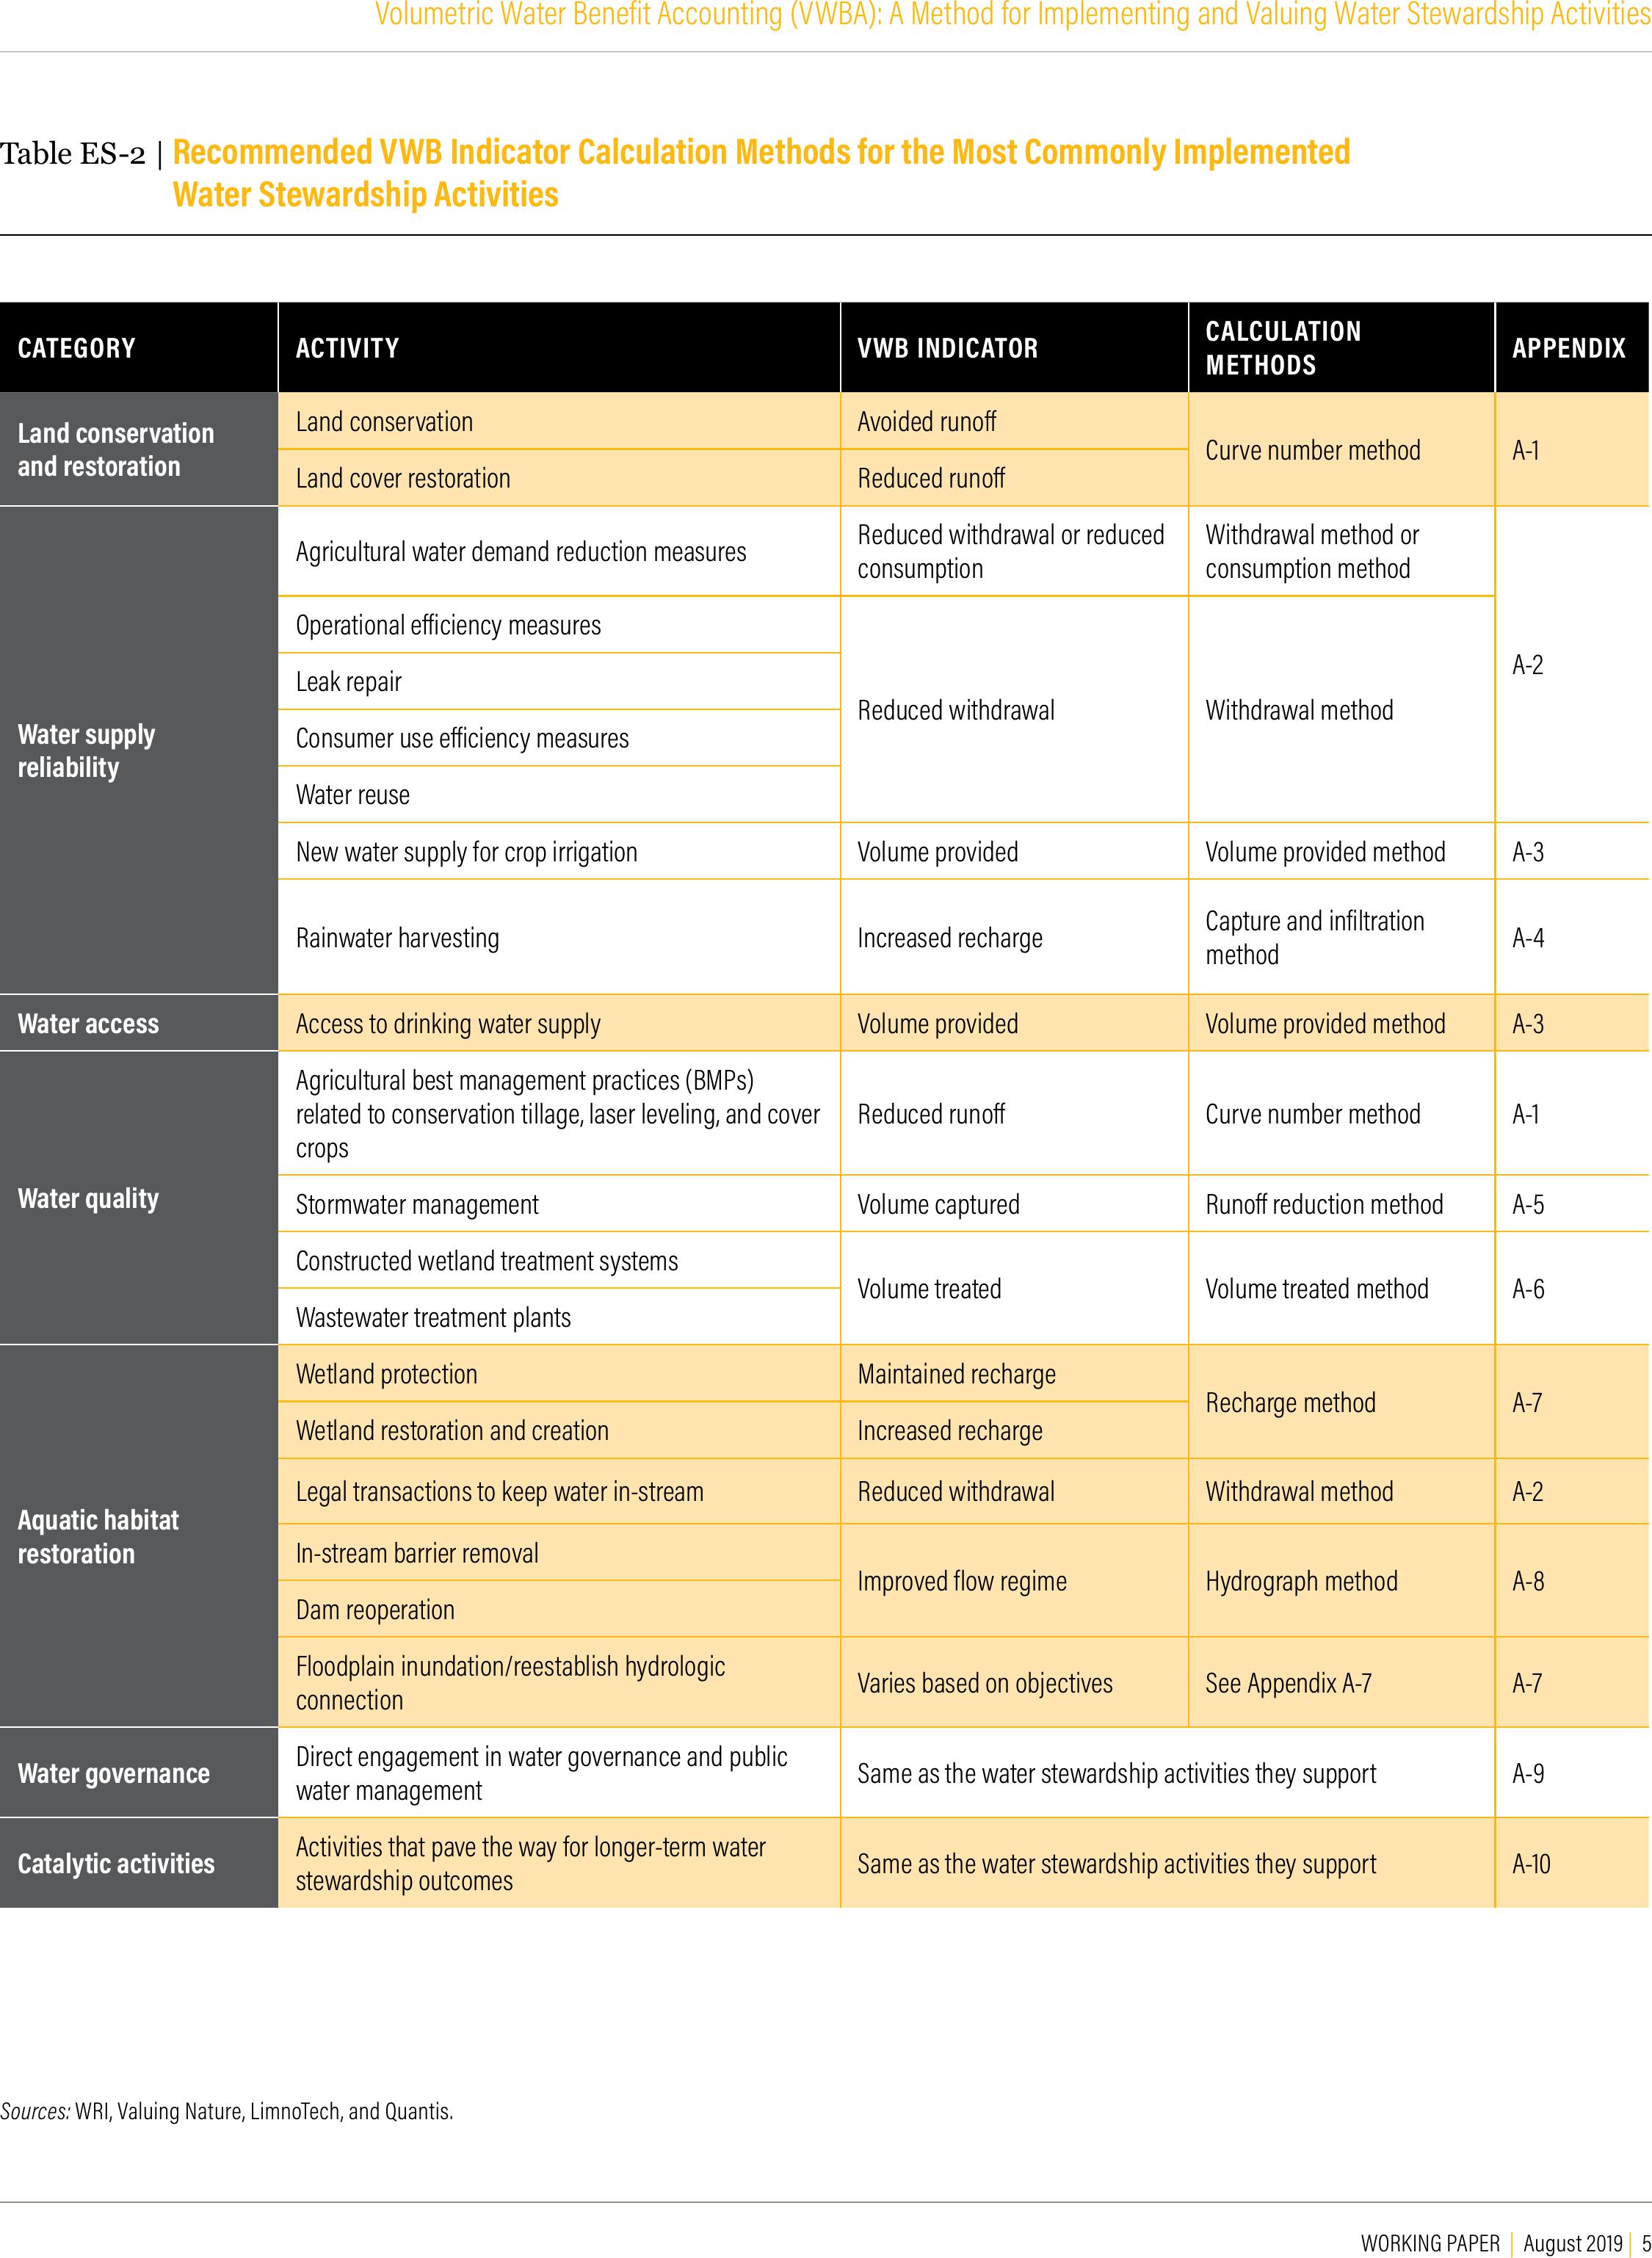
Recommended indicators and calculation meth-
ods are provided for each type of water steward-
ship activity (Table ES-2). Recognizing the wide range
of water stewardship activities and indicators available,
practitioners may also take the following steps:
▪Apply the calculation methods for other water
stewardship activities.
▪Select other indicators when credible and well-
documented methods are available.
▪Use simpler estimates, for example, during early-stage
project evaluation and cost-benet analysis.
▪Use more detailed, robust, and complex estimates
or measurements, for example to report progress,
communicate publicly, and make claims associated
with an organization’s water stewardship activities.
Figure ES-2 |VWBA Method to Calculate and Communicate WS Activity Volumetric Water Benefits
Sources:WRI, Valuing Nature, LimnoTech, and Quantis.
By using the method described in this work-
ing paper, organizations can communicate and
make claimsfor the volumetric water benefits of
all investments in water stewardship. Companies
can also use the method discussed in this working paper
to track and communicate progress toward enterprise
goals and/or targets, such as replenish, water balance, or
contextual water goals, aggregating VWB across activities
measured with the same indicators and clearly stating the
geographic origin of the VWB provided.
The VWBA method proposed has been developed
through extensive stakeholder engagement, and
trade-offs were made to ensure applicability and
uptake by practitioners. For example, estimating
VWBs alone cannot provide assurance that shared
water challenges are reduced and social, economic, and
STEP 1.
IDENTIFY SHARED WATER
CHALLENGES AND
UNDERSTAND LOCAL CONTEXT
STEP 2.
DEFINE WATER STEWARDSHIP
PROJECT ACTIVITIES AND
PARTNERS
STEP 3.
GATHER DATA AND CALCULATE
VOLUMETRIC WATER BENEFITS
STEP .: Identify shared water challenges and their root cause, understand the catchment
STEP .: Understand catchment stakeholders and ongoing water stewardship activities
STEP .: Select project activities and partners based on VWBA activity guidelines
STEP .: Determine allocation of volumetric water benefits
STEP .: Document baseline
STEP .: Select VWB indicator and complementary indicators
STEP .: Gather required data and calculate volumetric water benefits (VWBs) and complementary indicators
STEP .: Allocate volumetric water benefits (VWBs) and complementary indicators
START WATER STEWARDSHIP ACTIVITY
WORKING PAPER | August 2019 | 5
Volumetric Water Benefit Accounting (VWBA): A Method for Implementing and Valuing Water Stewardship Activities
Table ES-2 |Recommended VWB Indicator Calculation Methods for the Most Commonly Implemented
Water Stewardship Activities
CATEGORY ACTIVITY VWB INDICATORCALCULATION
METHODS APPENDIX
Land conservation
and restoration
Land conservationAvoided runoCurve number methodA-1
Land cover restorationReduced runo
Water supply
reliability
Agricultural water demand reduction measuresReduced withdrawal or reduced
consumption
Withdrawal method or
consumption method
A-2
Operational eiciency measures
Reduced withdrawalWithdrawal method
Leak repair
Consumer use eiciency measures
Water reuse
New water supply for crop irrigationVolume providedVolume provided methodA-3
Rainwater harvesting Increased rechargeCapture and infiltration
method A-4
Water accessAccess to drinking water supply Volume providedVolume provided methodA-3
Water quality
Agricultural best management practices (BMPs)
related to conservation tillage, laser leveling, and cover
crops
Reduced runoCurve number methodA-1
Stormwater managementVolume capturedRuno reduction methodA-5
Constructed wetland treatment systemsVolume treatedVolume treated methodA-6
Wastewater treatment plants
Aquatic habitat
restoration
Wetland protectionMaintained rechargeRecharge methodA-7
Wetland restoration and creationIncreased recharge
Legal transactions to keep water in-streamReduced withdrawalWithdrawal methodA-2
In-stream barrier removalImproved flow regimeHydrograph methodA-8
Dam reoperation
Floodplain inundation/reestablish hydrologic
connection Varies based on objectivesSee Appendix A-7A-7
Water governanceDirect engagement in water governance and public
water management Same as the water stewardship activities they supportA-9
Catalytic activitiesActivities that pave the way for longer-term water
stewardship outcomesSame as the water stewardship activities they supportA-10
Sources:WRI, Valuing Nature, LimnoTech, and Quantis.

6 |
environmental benets are provided. Solving shared
water challenges requires the maintenance of hydrology
improvements over time. Therefore, unless additional
assurance is provided, delivering volumetric water
benets does not guarantee that the activity will result
in the associated social, economic, and environmental
benets. Additionally, sanitation and hygiene, agricultural
best management practices related to agrochemical
management, and in-stream channel rehabilitation
activities are excluded because they do not yield volumes
of water that modify the hydrology and therefore cannot
be quantied using the methods we describe.
Moving forward, there are opportunities to
improve and enhance VWBA. This can be achieved,
for example, by incorporating activities currently excluded
or building a web-based tool to facilitate large-scale adop-
tion. VWBA can also be enhanced with lessons learned
from piloting the methods, monitoring, data collection,
and analysis to strengthen hydrological models and vali-
date assumptions, and developing guidance to link water
stewardship activity outputs to social, economic, and
environmental outcomes and impacts.
ABBREVIATIONS
AWS Alliance for Water Stewardship
BEF Bonneville Environmental Foundation
BIER Beverage Industry Environmental Roundtable
BMP best management practices
cfs cubic feet per second
FAO Food and Agriculture Organization
GRI Global Reporting Initiative
ha hectare
HEC-RAS Hydrologic Engineering Center’s River Analysis System
ISO International Organization for Standardization
IUCN International Union for Conservation of Nature
LCA life-cycle assessment
MCL maximum contaminant level
ML megaliter
mg milligram
Nnitrogen
NGO nongovernmental organization
SDG Sustainable Development Goal
SWMM Stormwater Management Model
TNC The Nature Conservancy
UNEP United Nations Environment Programme
UNICEF United Nations International Children’s Emergency Fund
US EPAUnited States Environmental Protection Agency
VWB volumetric water benefit
VWBA volumetric water benefit accounting
WASH water access, sanitation, and hygiene
WBCSD World Business Council on Sustainable Development
WHO World Health Organization
WRC Water Restoration Certificates
WRI World Resources Institute
WS water stewardship
WWF World Wildlife Fund
WORKING PAPER | August 2019 | 7
Volumetric Water Benefit Accounting (VWBA): A Method for Implementing and Valuing Water Stewardship Activities
INTRODUCTION
Background
Water is increasingly reported as a nancially material
risk to organizations in both the private and public sectors
(World Economic Forum 2019), and the shared nature of
water challenges will require solutions at the catchment
scale if these are to meaningfully reduce risk (Pegram et
al. 2009). By addressing shared water challenges within
a catchment, organizations across sectors can contribute
to improving catchment conditions while lessening their
exposure to physical, regulatory, and reputational water-
related risks.
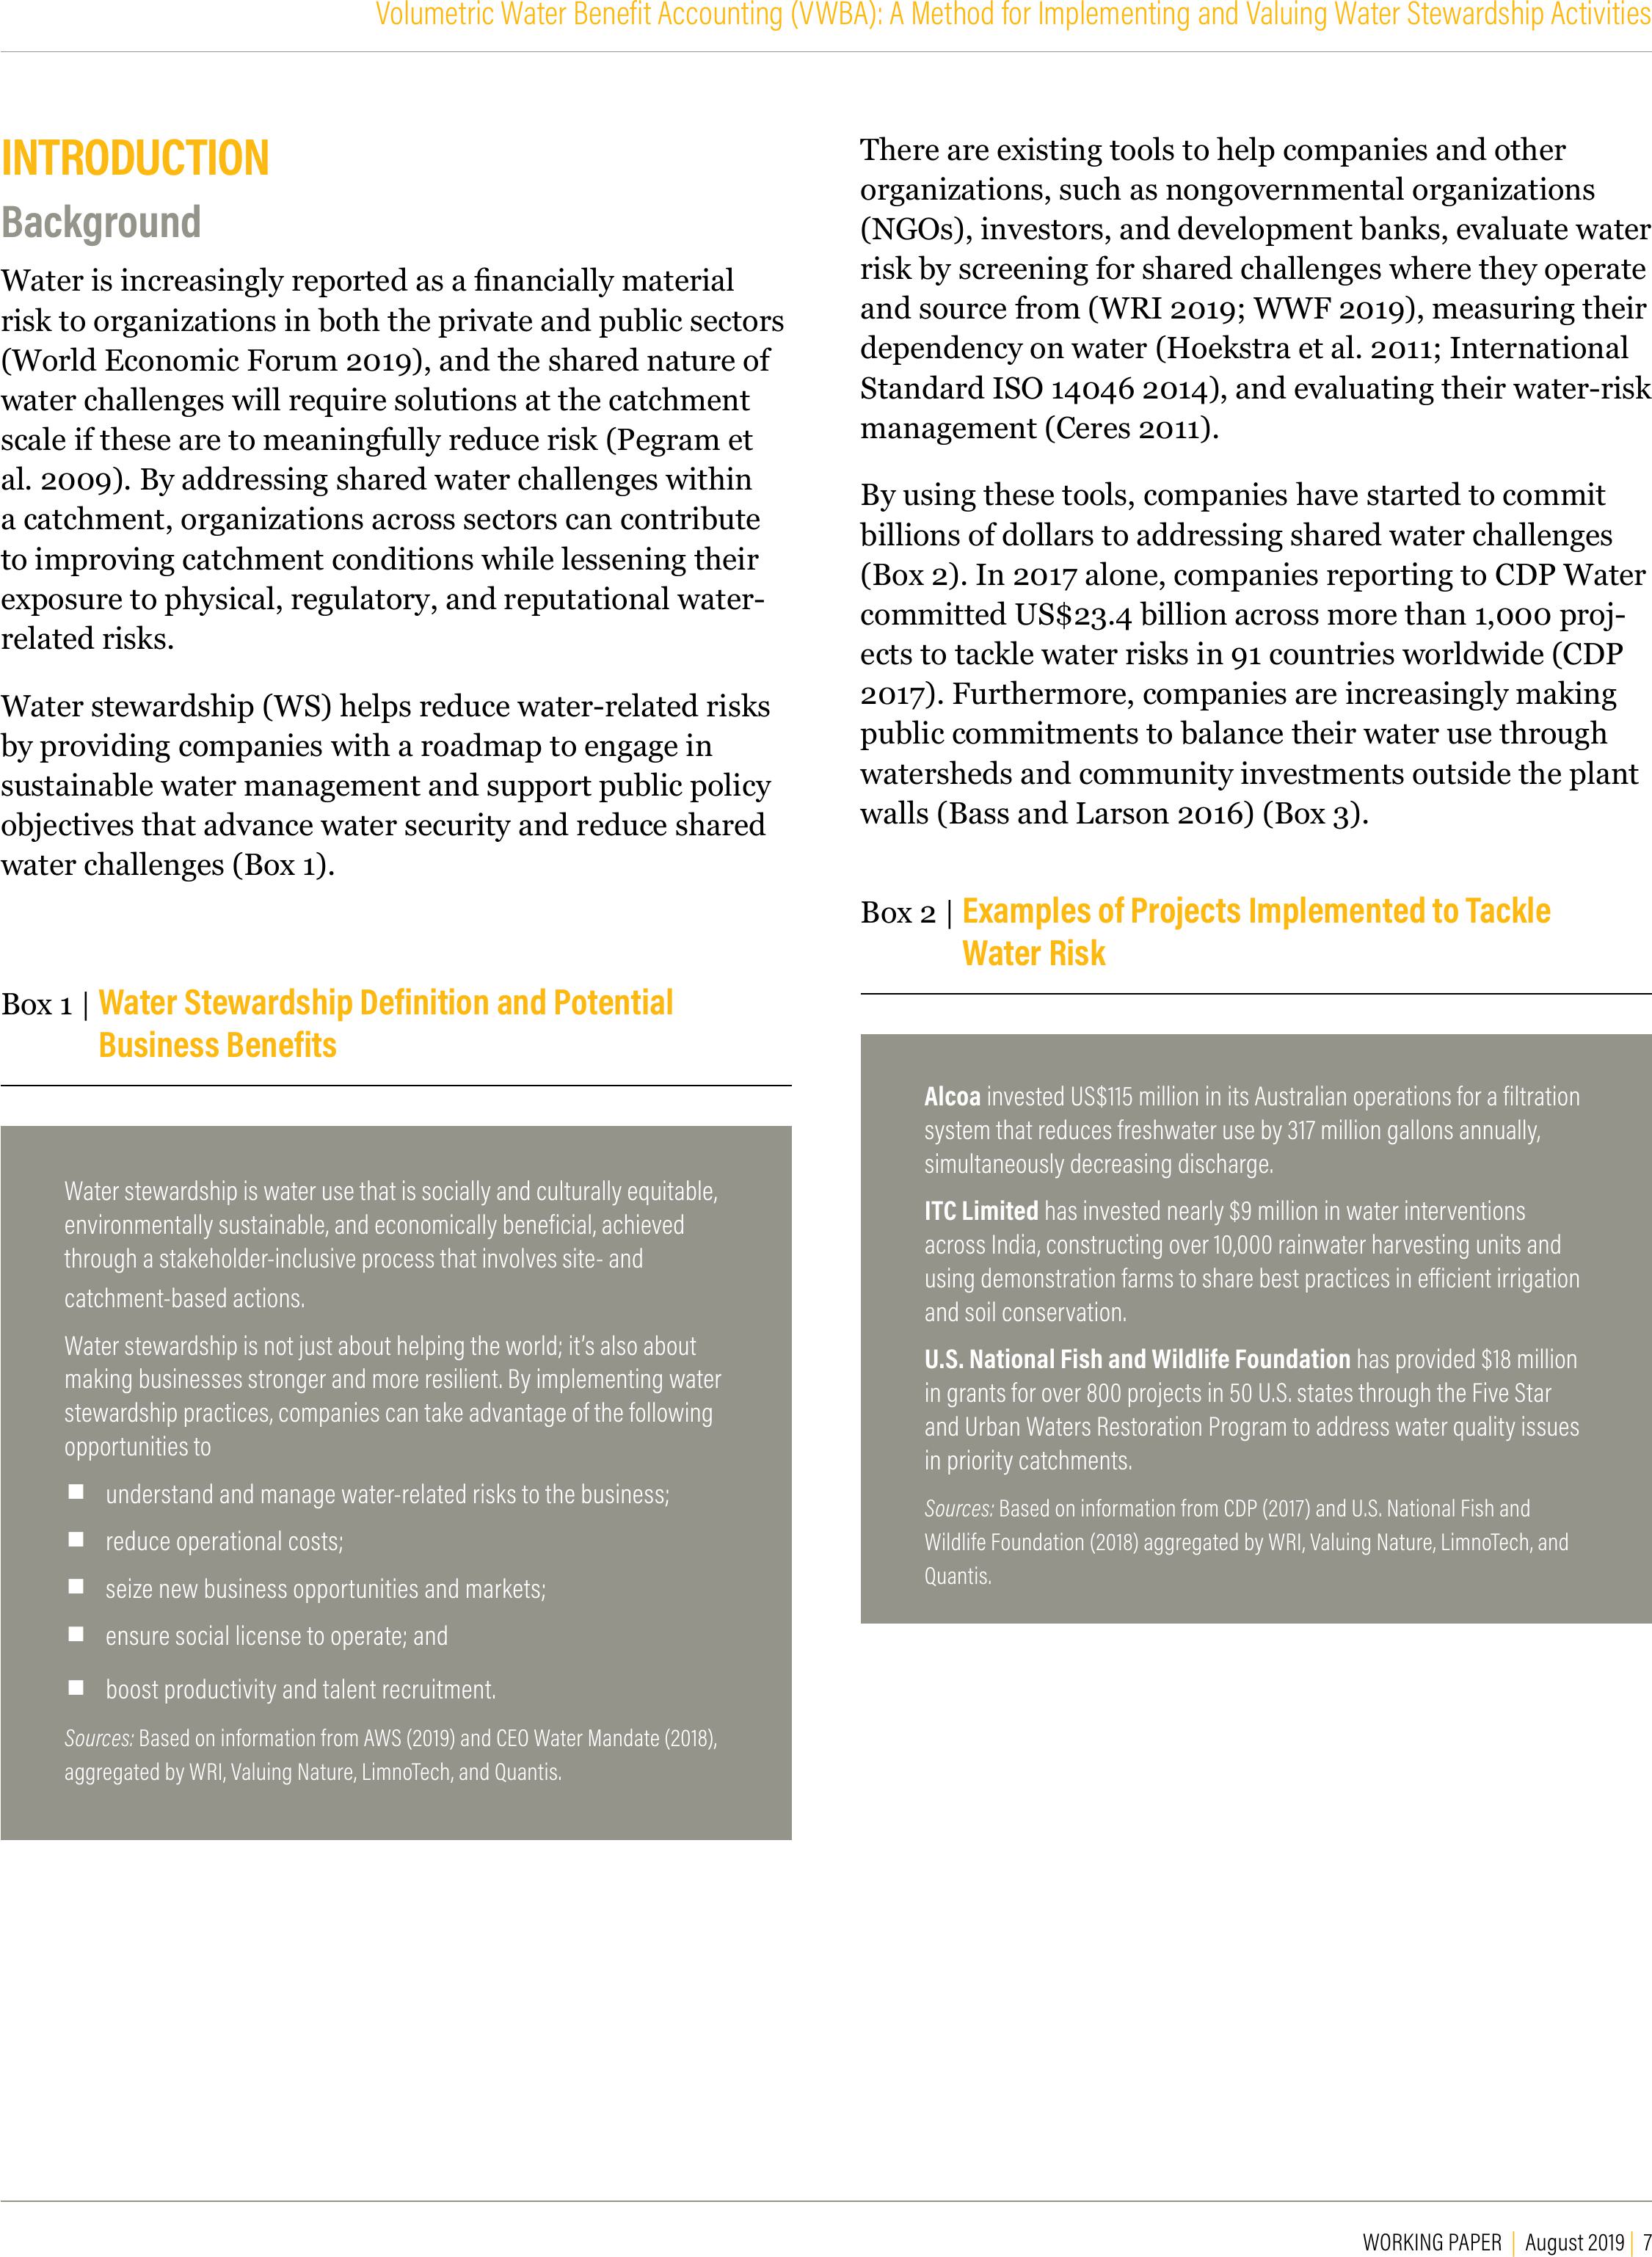
Water stewardship (WS) helps reduce water-related risks
by providing companies with a roadmap to engage in
sustainable water management and support public policy
objectives that advance water security and reduce shared
water challenges (Box 1).
There are existing tools to help companies and other
organizations, such as nongovernmental organizations
(NGOs), investors, and development banks, evaluate water
risk by screening for shared challenges where they operate
and source from (WRI 2019; WWF 2019), measuring their
dependency on water (Hoekstra et al. 2011; International
Standard ISO 14046 2014), and evaluating their water-risk
management (Ceres 2011).
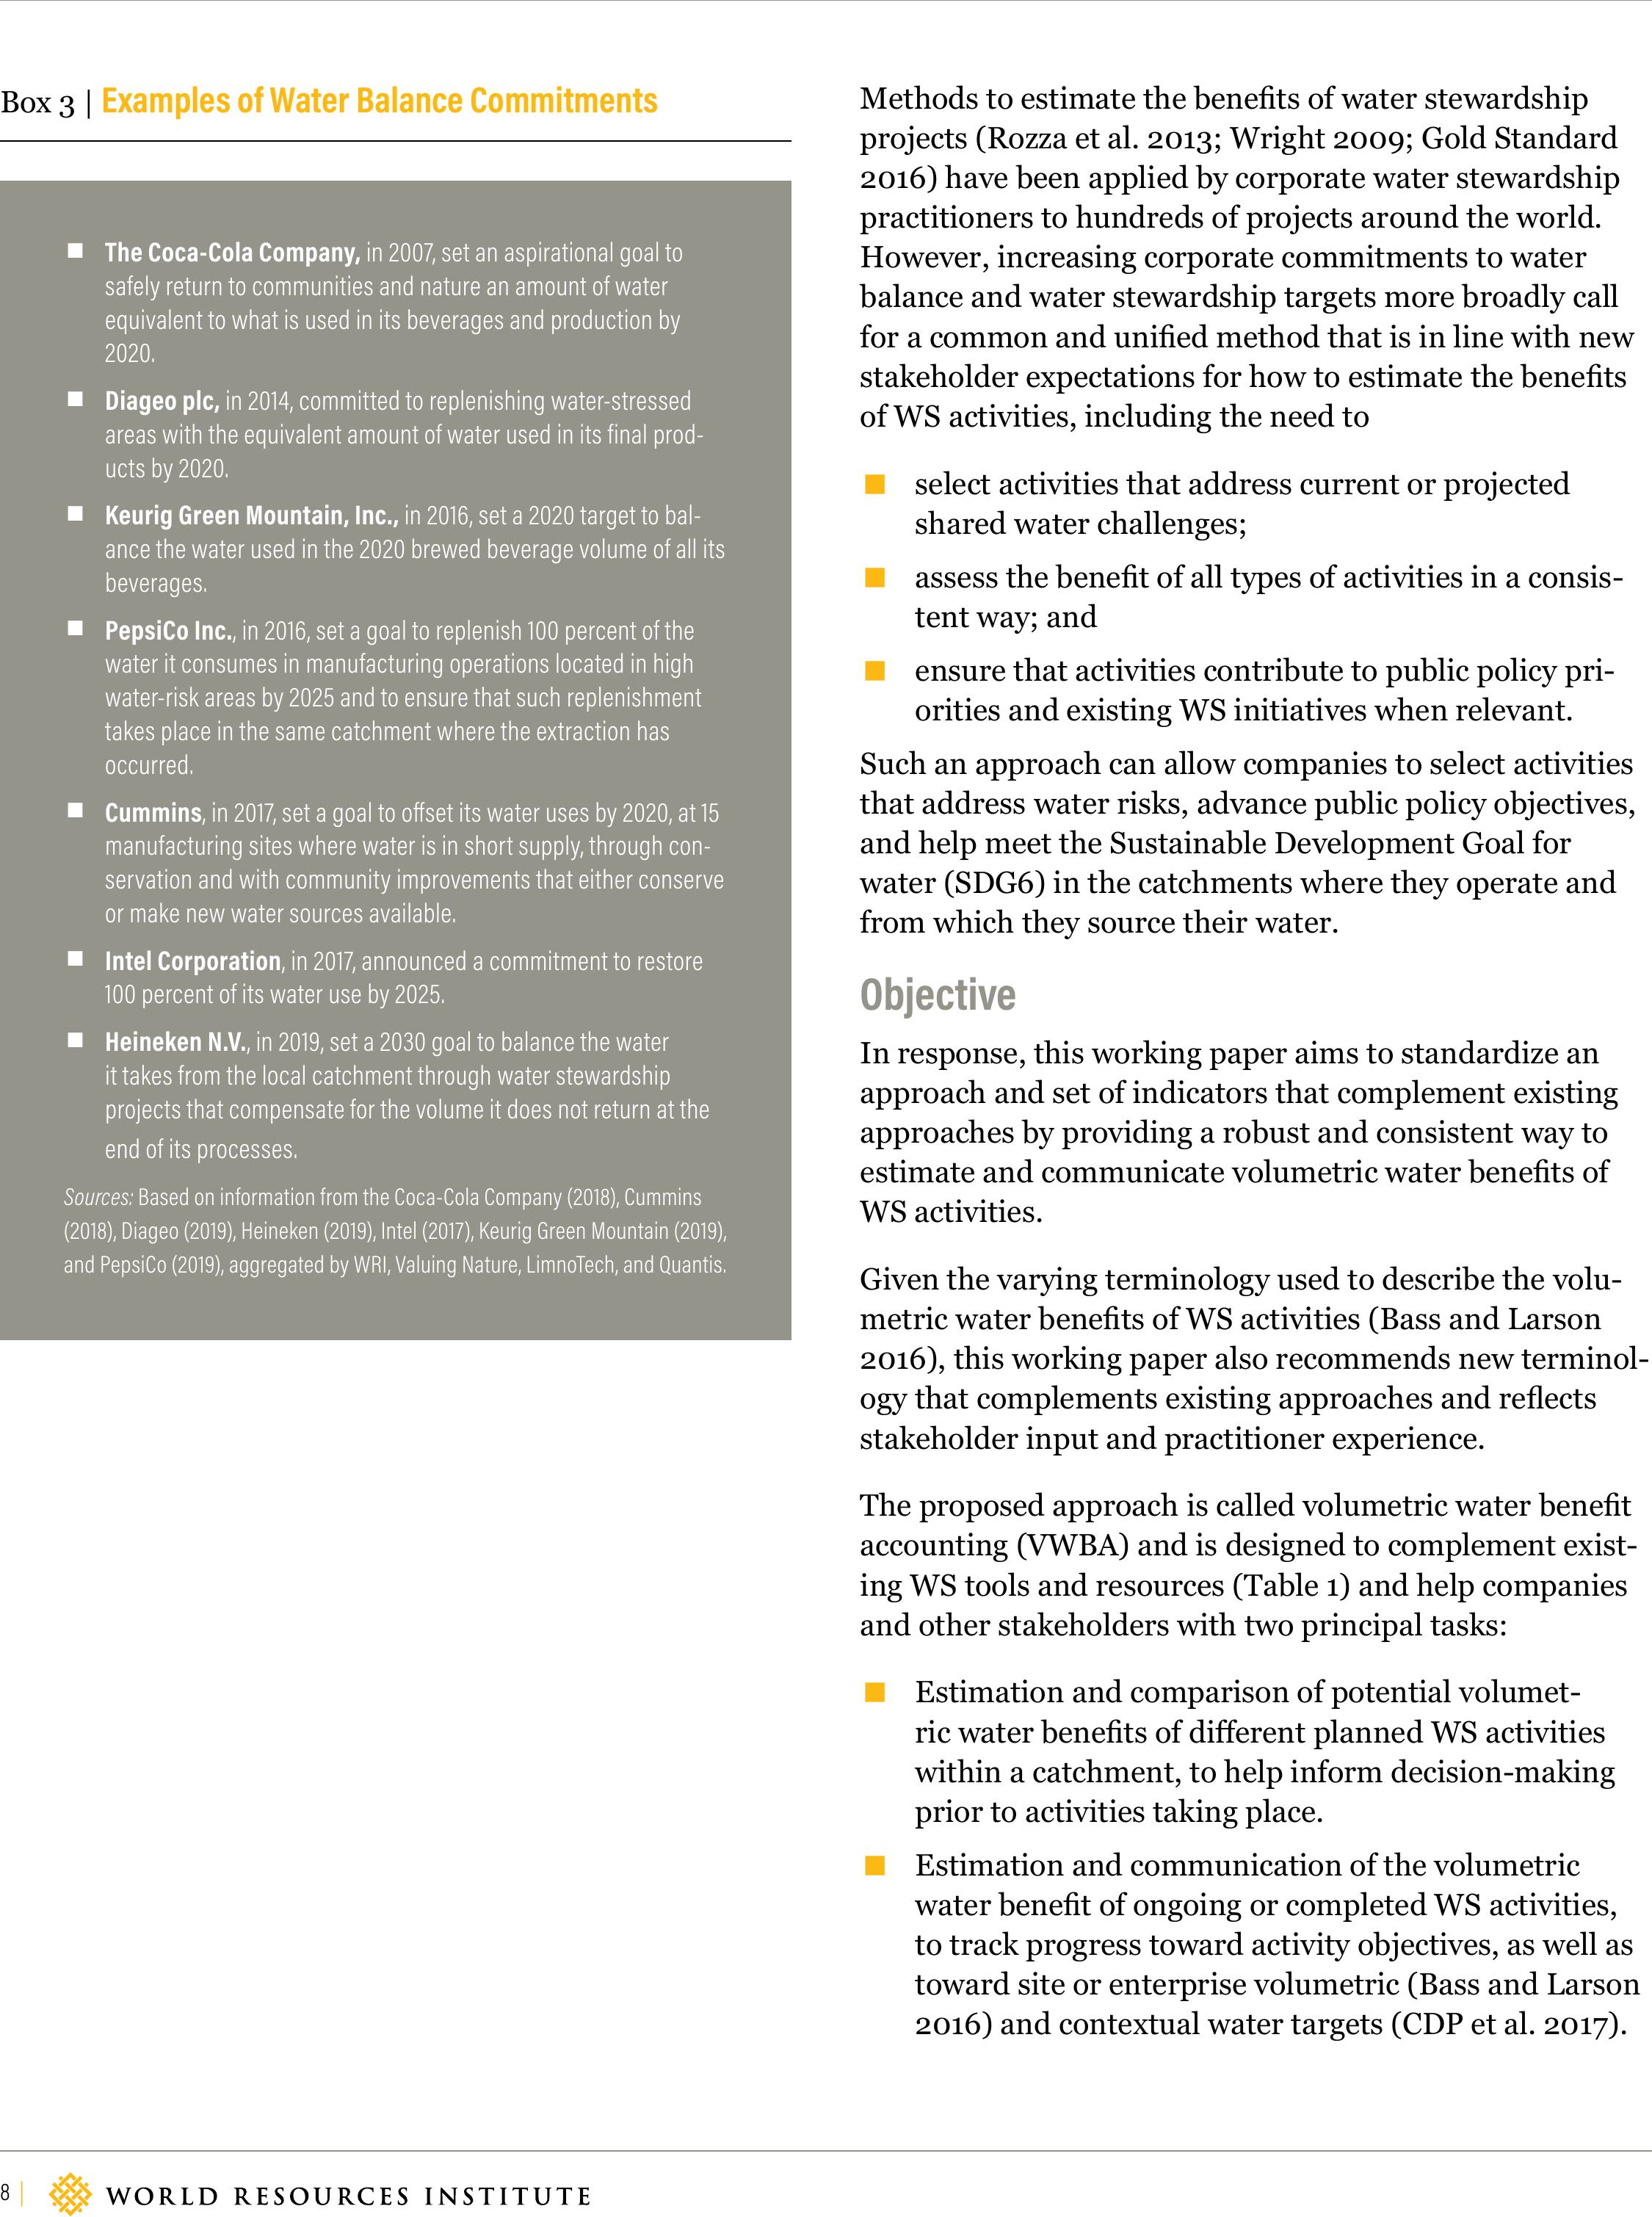
By using these tools, companies have started to commit
billions of dollars to addressing shared water challenges
(Box 2). In 2017 alone, companies reporting to CDP Water
committed US$23.4 billion across more than 1,000 proj-
ects to tackle water risks in 91 countries worldwide (CDP
2017). Furthermore, companies are increasingly making
public commitments to balance their water use through
watersheds and community investments outside the plant
walls (Bass and Larson 2016) (Box 3).
Water stewardship is water use that is socially and culturally equitable,
environmentally sustainable, and economically beneficial, achieved
through a stakeholder-inclusive process that involves site- and
catchment-based actions.
Water stewardship is not just about helping the world; it’s also about
making businesses stronger and more resilient. By implementing water
stewardship practices, companies can take advantage of the following
opportunities to
▪understand and manage water-related risks to the business;
▪reduce operational costs;
▪seize new business opportunities and markets;
▪ensure social license to operate; and
▪boost productivity and talent recruitment.
Sources: Based on information from AWS (2019) and CEO Water Mandate (2018),
aggregated by WRI, Valuing Nature, LimnoTech, and Quantis.
Alcoa invested US$115 million in its Australian operations for a filtration
system that reduces freshwater use by 317 million gallons annually,
simultaneously decreasing discharge.
ITC Limited has invested nearly $9 million in water interventions
across India, constructing over 10,000 rainwater harvesting units and
using demonstration farms to share best practices in eicient irrigation
and soil conservation.
U.S. National Fish and Wildlife Foundationhas provided $18 million
in grants for over 800 projects in 50 U.S. states through the Five Star
and Urban Waters Restoration Program to address water quality issues
in priority catchments.
Sources: Based on information from CDP (2017) and U.S. National Fish and
Wildlife Foundation (2018) aggregated by WRI, Valuing Nature, LimnoTech, and
Quantis.
Box 1 |Water Stewardship Definition and Potential
Business Benefits
Box 2 |Examples of Projects Implemented to Tackle
Water Risk
8 |
Methods to estimate the benets of water stewardship
projects (Rozza et al. 2013; Wright 2009; Gold Standard
2016) have been applied by corporate water stewardship
practitioners to hundreds of projects around the world.
However, increasing corporate commitments to water
balance and water stewardship targets more broadly call
for a common and unied method that is in line with new
stakeholder expectations for how to estimate the benets
of WS activities, including the need to
▪select activities that address current or projected
shared water challenges;
▪assess the benet of all types of activities in a consis-
tent way; and
▪ensure that activities contribute to public policy pri-
orities and existing WS initiatives when relevant.
Such an approach can allow companies to select activities
that address water risks, advance public policy objectives,
and help meet the Sustainable Development Goal for
water (SDG6) in the catchments where they operate and
from which they source their water.
Objective
In response, this working paper aims to standardize an
approach and set of indicators that complement existing
approaches by providing a robust and consistent way to
estimate and communicate volumetric water benets of
WS activities.
Given the varying terminology used to describe the volu-
metric water benets of WS activities (Bass and Larson
2016), this working paper also recommends new terminol-
ogy that complements existing approaches and reects
stakeholder input and practitioner experience.
The proposed approach is called volumetric water benet
accounting (VWBA) and is designed to complement exist-
ing WS tools and resources (Table 1) and help companies
and other stakeholders with two principal tasks:
▪Estimation and comparison of potential volumet-
ric water benets of dierent planned WS activities
within a catchment, to help inform decision-making
prior to activities taking place.
▪Estimation and communication of the volumetric
water benet of ongoing or completed WS activities,
to track progress toward activity objectives, as well as
toward site or enterprise volumetric (Bass and Larson
2016) and contextual water targets (CDP et al. 2017).
▪The Coca-Cola Company, in 2007, set an aspirational goal to
safely return to communities and nature an amount of water
equivalent to what is used in its beverages and production by
2020.
▪Diageo plc, in 2014, committed to replenishing water-stressed
areas with the equivalent amount of water used in its final prod-
ucts by 2020.
▪Keurig Green Mountain, Inc., in 2016, set a 2020 target to bal-
ance the water used in the 2020 brewed beverage volume of all its
beverages.
▪PepsiCo Inc., in 2016, set a goal to replenish 100 percent of the
water it consumes in manufacturing operations located in high
water-risk areas by 2025 and to ensure that such replenishment
takes place in the same catchment where the extraction has
occurred.
▪Cummins, in 2017, set a goal to oset its water uses by 2020, at 15
manufacturing sites where water is in short supply, through con-
servation and with community improvements that either conserve
or make new water sources available.
▪Intel Corporation, in 2017, announced a commitment to restore
100 percent of its wateruse by 2025.
▪Heineken N.V., in 2019, set a 2030 goal to balance the water
it takes from the local catchment through water stewardship
projects that compensate for the volume it does not return at the
end of its processes.
Sources: Based on information from the Coca-Cola Company (2018), Cummins
(2018), Diageo (2019), Heineken (2019), Intel (2017), Keurig Green Mountain (2019),
and PepsiCo (2019), aggregated by WRI, Valuing Nature, LimnoTech, and Quantis.
Box 3 |Examples of Water Balance Commitments

WORKING PAPER | August 2019 | 9
Volumetric Water Benefit Accounting (VWBA): A Method for Implementing and Valuing Water Stewardship Activities
Table 1 |Complementarity of VWBA and Existing Corporate Water Stewardship Resources and Tools
CORPORATE WATER STEWARDSHIP RESOURCES AND TOOLS
COMPLEMENTARITY OF VWBA
CATEGORY EXAMPLE
Global water risk
assessment tools
WRI Aqueduct
WWF Water Risk Filter
Water Risk Monetizer
VWBA helps identify activities that respond to water risks and estimate the contribution
of each activity to solving specific shared water challenges within the catchment.
Impact valuationNatural Capital Protocol
Social and Human Capital Protocol
VWBA helps estimate WS activity volumetric outputs that can be used to inform
outcome, impact, and dependency valuation.
Site- and project-level
water stewardship
certifications
AWS
Gold Standard
BEF’s Water Restoration Certificates®(WRCs)
VWBA helps track WS activities in a consistent way, to monitor progress, and enables
stakeholders to understand an organization’s commitment and contribution to WS.
Water target settingContextual water targets VWBA provides a method and indicators to track progress toward a desired end state,
target, or goal.
Water reporting and
disclosure standards
CDP Water
GRI303
SASB
VWBA provides a consistent approach to report volumetric water benefits and progress
toward a desired end state, target, or goal.
Sources:WRI, Valuing Nature, LimnoTech, and Quantis.
10 |
Develop a comprehensive
water stewardship plan
and set targets/goals
Understand water risk and
impacts
Work with stakeholders
to advance water
stewardship
Volumetric Water Benefit Accounting and
Corporate Water Stewardship
VWBA does not replace the need for companies to mea-
sure, understand, and address water-related risks and
impacts; improve water use eciency and stormwater and
wastewater management; pursue water opportunities;
engage in collective action; or advance public water policy
objectives across their value chain.
Furthermore, because solving shared water challenges
may call for activities that do not yield a volumetric benet
and requires that improvements in hydrology be main-
tained over time, delivering volumetric water benets
alone cannot reduce business risks or guarantee social,
economic, and environmental benets.
Because of this, companies will require a deep under-
standing of their water use and exposure to risk and
catchment conditions, as well as clear and well-dened
corporate water stewardship goals and targets, prior to
using the method we propose.
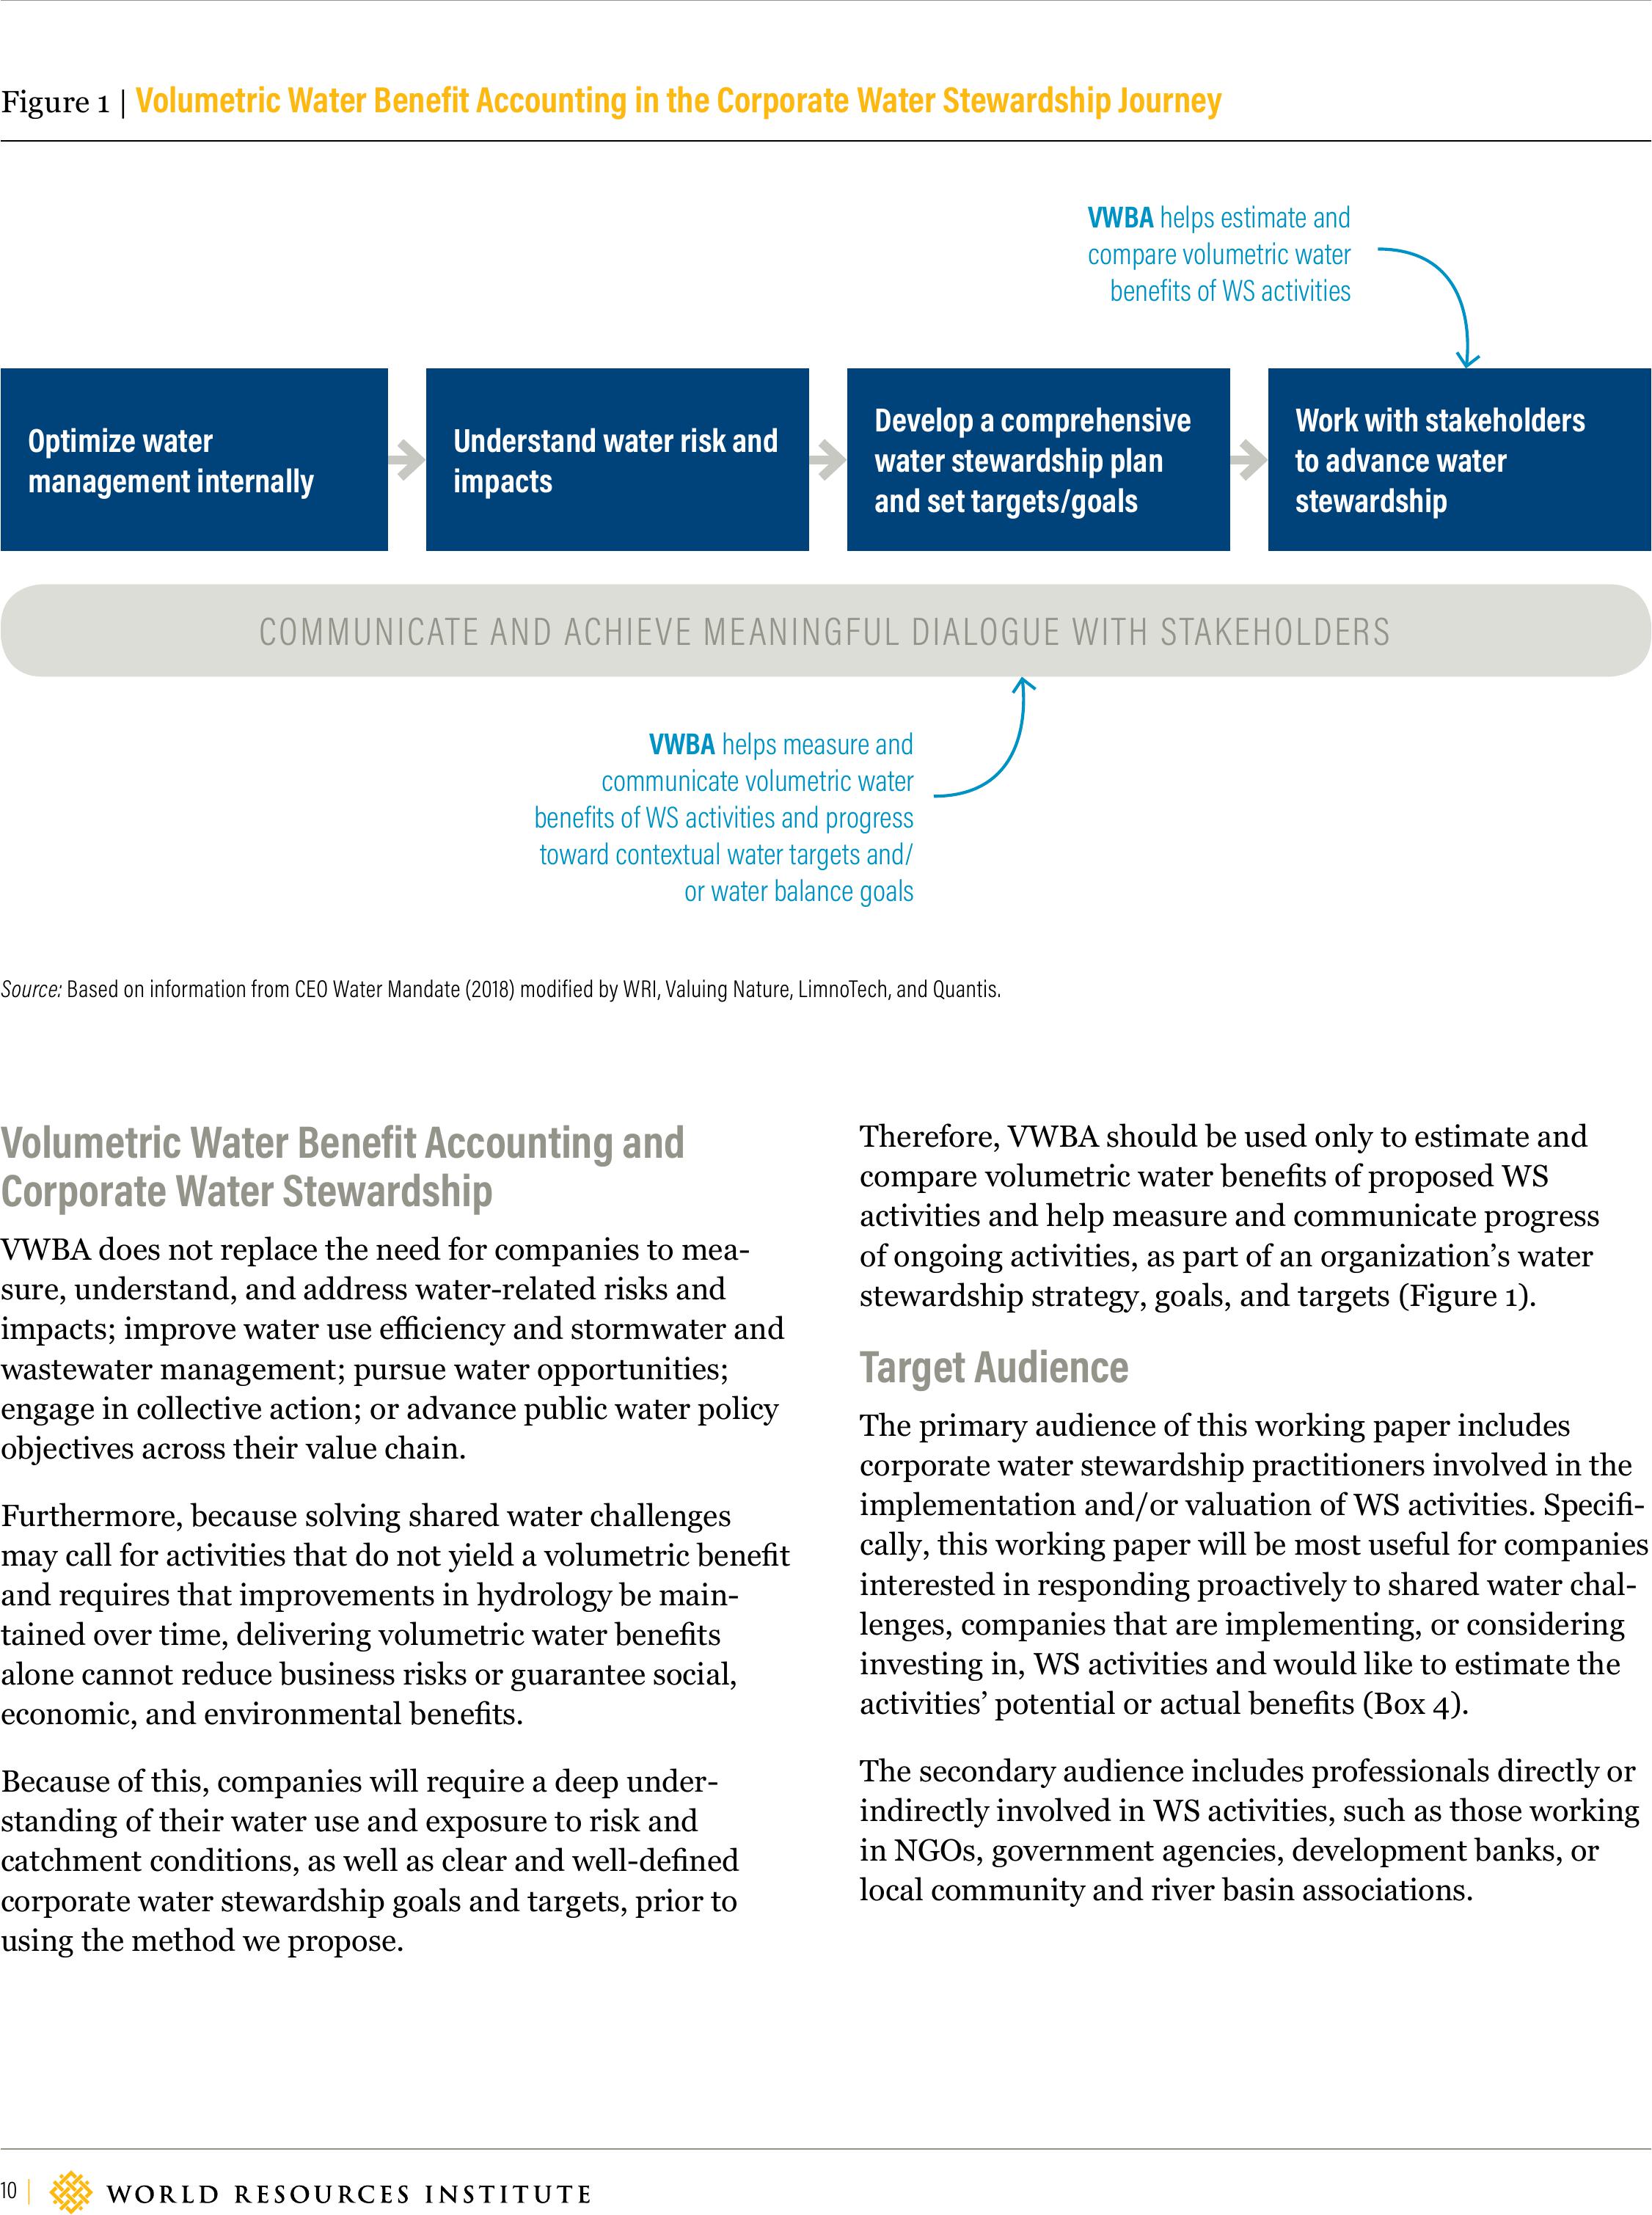
Therefore, VWBA should be used only to estimate and
compare volumetric water benets of proposed WS
activities and help measure and communicate progress
of ongoing activities, as part of an organization’s water
stewardship strategy, goals, and targets (Figure 1).
Target Audience
The primary audience of this working paper includes
corporate water stewardship practitioners involved in the
implementation and/or valuation of WS activities. Speci-
cally, this working paper will be most useful for companies
interested in responding proactively to shared water chal-
lenges, companies that are implementing, or considering
investing in, WS activities and would like to estimate the
activities’ potential or actual benets (Box 4).
The secondary audience includes professionals directly or
indirectly involved in WS activities, such as those working
in NGOs, government agencies, development banks, or
local community and river basin associations.
Figure 1 |Volumetric Water Benefit Accounting in the Corporate Water Stewardship Journey
Source:Based on information from CEO Water Mandate (2018) modified by WRI, Valuing Nature, LimnoTech, and Quantis.
Optimize water
management internally
COMMUNICATE AND ACHIEVE MEANINGFUL DIALOGUE WITH STAKEHOLDERS
VWBA helps measure and
communicate volumetric water
benefits of WS activities and progress
toward contextual water targets and/
or water balance goals
VWBA helps estimate and
compare volumetric water
benefits of WS activities
WORKING PAPER | August 2019 | 11
Volumetric Water Benefit Accounting (VWBA): A Method for Implementing and Valuing Water Stewardship Activities
Guiding criteria
Based on the objective and audience, VWBA has been
developed following three guiding criteria:
▪VWBA should be applicable within the context of
corporate decision-making and was therefore de-
veloped in close consultation with key stakeholder
groups across businesses, NGOs, reporting programs,
government agencies, and academic institutions from
around the world to ensure that it meets the needs of
our target audience.
▪VWBA should yield results that are trusted by key
stakeholder groups working on water stewardship. We
thus recommend a standardized approach and set of
indicators, informed by a multistakeholder process,
that can be applied equally by all stakeholder groups.
▪VWBA should be informed by published scientic
methods, practitioner experience, and leading prac-
tice, as documented in Appendix A.
The rest of this working paper outlines the proposed
approach and method for VWBA and provides guidance
on how to apply VWBA, including detailed information for
estimating the VWBs of the most commonly implemented
WS activities.
Support decision-making related to WS investments when evaluating
dierent WS activities and the associated contribution to addressing
shared water challenges.
Advance public water policy objectives through WS activities by align-
ing activities with local shared water challenges, public policy objec-
tives, and desired water stewardship outcomes.
Monitor progress toward WS targets and goals by providing consistent
metrics and guidance to measure the benefits of any WS activity over
time.
Sources: WRI, Valuing Nature, LimnoTech, and Quantis.
VWBA was developed by LimnoTech, Quantis, Valuing Nature, and World
Resources Institute (WRI), building on published literature and practitio-
ner experience, most notably experience from the Coca-Cola Company
in developing and implementing the world’s first water replenishment
strategy, as well as support from Nestlé S.A. and Danone to produce the
first iteration of the VWBA.
LimnoTech, Quantis, Valuing Nature, and WRI consulted key stakeholder
groups representing businesses, NGOs, reporting programs, govern-
ment agencies, and academic institutions from around the world and
convened multiple stakeholder groups as part of this process.
▪Expert Advisory Group, formed in the fall of 2017, contributed
by providing early input and guidance during workshops held in
Washington, DC, in March 2018 and in Paris in April 2018, as well
as by reviewing the proposed approach to ensure the applicability
and feasibility of the VWBA method.
▪Project Funders contributed by providingfinancial support and
industry insights during workshops held in Washington, DC, in
March 2018 and in Paris in April 2018, as well as by reviewing the
proposed approach to ensure the applicability and feasibility of the
VWBA method.
▪Open Consultation allowed anyone interested to review and
provide feedback on the VWBA method prior to completion.
▪World Water Week 2018, convened by the Stockholm Interna-
tional Water Institute in August, hosted a session to showcase
the proposed approach and collect feedback from conference
attendees.
▪Alliance for Water Stewardship Forum 2017 hosted a session
to showcase the proposed approach and collect feedback from
conference attendees.
Sources: WRI, Valuing Nature, LimnoTech, and Quantis.
Box 4 |Sample Applications
Box 5 |How Was VWBA Developed?
APPROACH
Building on the principles of the Natural Capital Protocol
(Natural Capital Coalition 2019) and practitioner experi-
ence (Box 5), VWBA provides a consistent and quantita-
tive approach and set of indicators to estimate the volu-
metric water benets of WS activities (Figure 2).
12 |
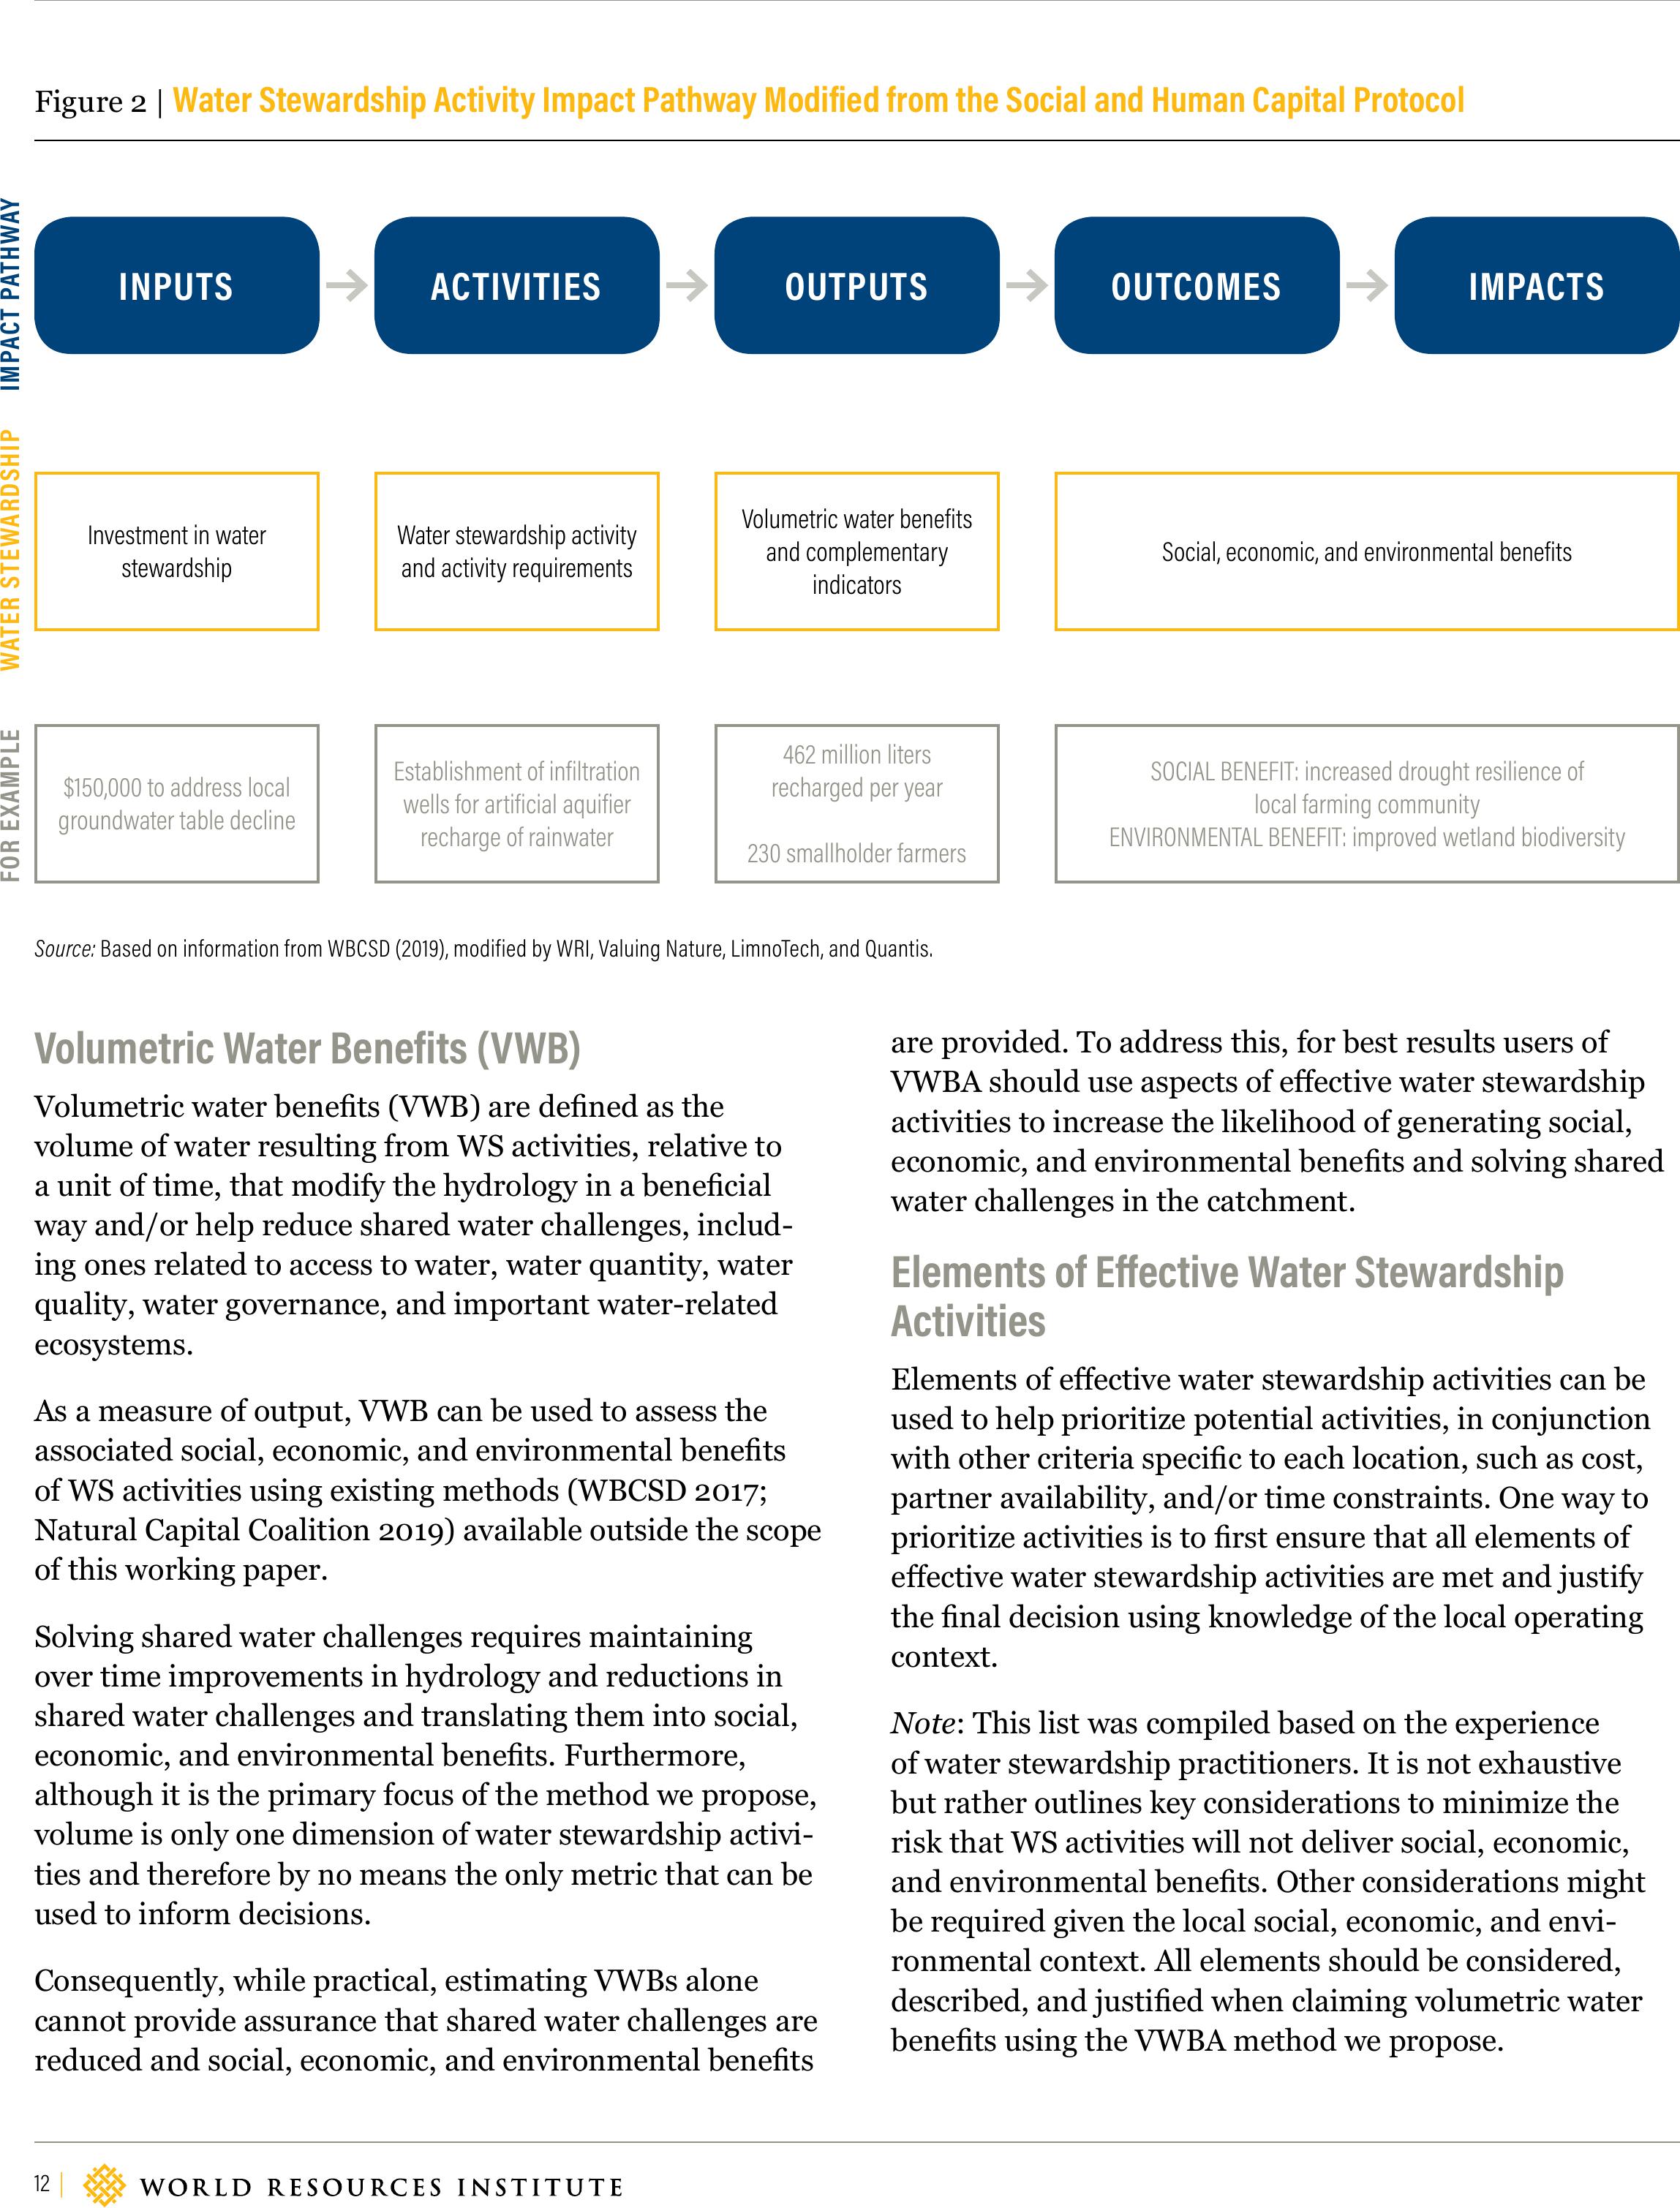
Volumetric Water Benefits (VWB)
Volumetric water benets (VWB) are dened as the
volume of water resulting from WS activities, relative to
a unit of time, that modify the hydrology in a benecial
way and/or help reduce shared water challenges, includ-
ing ones related to access to water, water quantity, water
quality, water governance, and important water-related
ecosystems.
As a measure of output, VWB can be used to assess the
associated social, economic, and environmental benets
of WS activities using existing methods (WBCSD 2017;
Natural Capital Coalition 2019) available outside the scope
of this working paper.
Solving shared water challenges requires maintaining
over time improvements in hydrology and reductions in
shared water challenges and translating them into social,
economic, and environmental benets. Furthermore,
although it is the primary focus of the method we propose,
volume is only one dimension of water stewardship activi-
ties and therefore by no means the only metric that can be
used to inform decisions.
Consequently, while practical, estimating VWBs alone
cannot provide assurance that shared water challenges are
reduced and social, economic, and environmental benets
are provided. To address this, for best results users of
VWBA should use aspects of eective water stewardship
activities to increase the likelihood of generating social,
economic, and environmental benets and solving shared
water challenges in the catchment.
Elements of Eective Water Stewardship
Activities
Elements of eective water stewardship activities can be
used to help prioritize potential activities, in conjunction
with other criteria specic to each location, such as cost,
partner availability, and/or time constraints. One way to
prioritize activities is to rst ensure that all elements of
eective water stewardship activities are met and justify
the nal decision using knowledge of the local operating
context.
Note: This list was compiled based on the experience
of water stewardship practitioners. It is not exhaustive
but rather outlines key considerations to minimize the
risk that WS activities will not deliver social, economic,
and environmental benets. Other considerations might
be required given the local social, economic, and envi-
ronmental context. All elements should be considered,
described, and justied when claiming volumetric water
benets using the VWBA method we propose.
Source: Based on information from WBCSD (2019), modified by WRI, Valuing Nature, LimnoTech, and Quantis.
Figure 2 |Water Stewardship Activity Impact Pathway Modified from the Social and Human Capital Protocol
INPUTSACTIVITIES OUTPUTS OUTCOMES IMPACTS
Investment in water
stewardship
$150,000 to address local
groundwater table decline
Water stewardship activity
and activity requirements
Establishment of infiltration
wells for artificial aquifier
recharge of rainwater
Volumetric water benefits
and complementary
indicators
462 million liters
recharged per year
230 smallholder farmers
Social, economic, and environmental benefits
SOCIAL BENEFIT: increased drought resilience of
local farming community
ENVIRONMENTAL BENEFIT: improved wetland biodiversity
FOR EXAMPLEIMPACT PATHWAYWATER STEWARDSHIP
WORKING PAPER | August 2019 | 13
Volumetric Water Benefit Accounting (VWBA): A Method for Implementing and Valuing Water Stewardship Activities
▪Water challenges. WS activities should address one
or more shared water challenges present at the activity
location and, when relevant, help improve water
governance and drive collective action.
▪Human rights. WS activities should respect and
protect all human rights, including the human right to
water.
▪Partners. Practitioners should work with reputable
and experienced partners who will
□consider, identify, and address any potential
trade-os or casualties of the WS activities; and
□minimize the likelihood of unintended deleterious
environmental, social, and economic impacts.
▪Stakeholders. Practitioners should select WS
activities that are relevant to local stakeholder needs
and priorities.
▪Technology. When WS activities require
technological solutions, practitioners should apply the
ecient and feasible technology available.
▪Planning and communicating. Practitioners
should have well-dened and clearly communicated
□the targeted recipient of the estimated VWBs
generated;
□the desired social, economic, and environmental
benets to which the VWBs will contribute;
□the baseline year and timeline during which the
activity will yield VWBs;
□a resourcing plan to ensure that maintenance
costs are provided for the desired activity
duration; and
□water quality requirements, based on the intended
use of the VWBs, that meet or exceed local and/or
international standards.
▪Activity-specific considerations.
□For any activity, interventions delivering VWBs
must comply with applicable regulations (e.g.,
water quality standards).
□For water access, sanitation and hygiene activities
must
□ensure that drinking water at the point of
collection meets international drinking quality
standards, comes from an improved water
source, and complies with WHO/UNICEF
WASH Guidance; and
□include adequate training for beneciaries
to eciently store, transport, and use the
drinking water provided and maintain
adequate sanitation and hygiene over time.
▪For activities involving water transactions,
□ensure that the proposed transaction
agreement is consistent with basin plans, local
land use restrictions, water quality standards,
and state and federal rules; and
□ensure that the proposed transaction
agreement does not cause injury to existing
water rights. Injury occurs when a change in
the use of a water right would prevent another
water user from using the water to which they
are legally entitled.
▪For agriculture-related activities,
□ensure that improved irrigation eciency
measures are not used to support a change in
cropping pattern to a more water-intensive
crop, an increase in cropping area, or irrigation
of previously unirrigated land; and
□when relevant, encourage the adoption
of best practice standards for agricultural
sustainability.
14 |
Complementary Indicators
For best results, users of VWBA should employ comple-
mentary indicators to measure nonvolumetric outputs
associated with the WS activity and VWB. Complementary
indicators provide additional insight into the implica-
tions of the VWB and help decision-makers interpret the
volumetric water benets achieved beyond the volume
of water provided. For example, the VWB of investing in
a wastewater treatment plant can also be measured in
pollutant load reduced (i.e., a complementary indicator)
to help stakeholders better understand the improvements
associated with the volume of water treated.
Application
VWBA allows organizations to quantify VWBs using dif-
ferent indicators, depending on the type of WS activity,
while maintaining results in a consistent unit (i.e., volume
of water over time). Although the volume of water pro-
vided might not always be comparable across WS activities
(e.g., some volumes will be provided to the catchment,
others will be conserved and maintained in the catchment,
others will be used to protect the human right to water),
it does oer a consistent unit of measurement to aid in
tracking and communicating progress toward commit-
ments, targets, and goals.
By using a consistent unit, VWBA allows practitioners
to estimate volumetric water benets of past, current,
or future commercial and noncommercial WS activi-
ties, anywhere across a value chain, inside or outside an
organization’s four walls, provided the activity responds to
shared water challenges and is designed to provide social,
economic, and/or environmental benets in the catch-
ment and community.
Limitations
Estimating environmental, social, or economic benets
is preferable in order to ensure that WS activities deliver
long-term value. However, our extensive stakeholder
engagement suggests that estimating VWBs is preferable
for certain applications, not as an alternative to measuring
environmental, social, or economic benets, but rather as
an intermediate and practical step that can yield a consis-
tent and standardized output measurement. Organizations
interested in measuring environmental, social, or eco-
nomic benets can do so using existing methods (WBCSD
2017; WBCSD 2019; Natural Capital Coalition 2019).
Additionally, limiting VWBA to measuring activity out-
puts poses a challenge in sustainable water management,
where solving shared water challenges requires that
improvements in hydrology be maintained over time.
Therefore, unless additional assurance is provided, deliv-
ering volumetric water benets does not guarantee that
the activity will deliver the associated social, economic,
and environmental benets.
Finally, three types of meaningful and relevant WS activi-
ties do not yield volumes of water that modify the hydrol-
ogy and therefore cannot be quantied using the methods
we describe: (1) sanitation and hygiene activities, (2)
agricultural best management practices (BMPs) related to
agrochemical management activities, and (3) in-stream
channel rehabilitation activities (e.g., streambank sta-
bilization). However, the benets of these three types of
WS activities can be measured with the complementary
indicators described in the VWBA.
METHOD
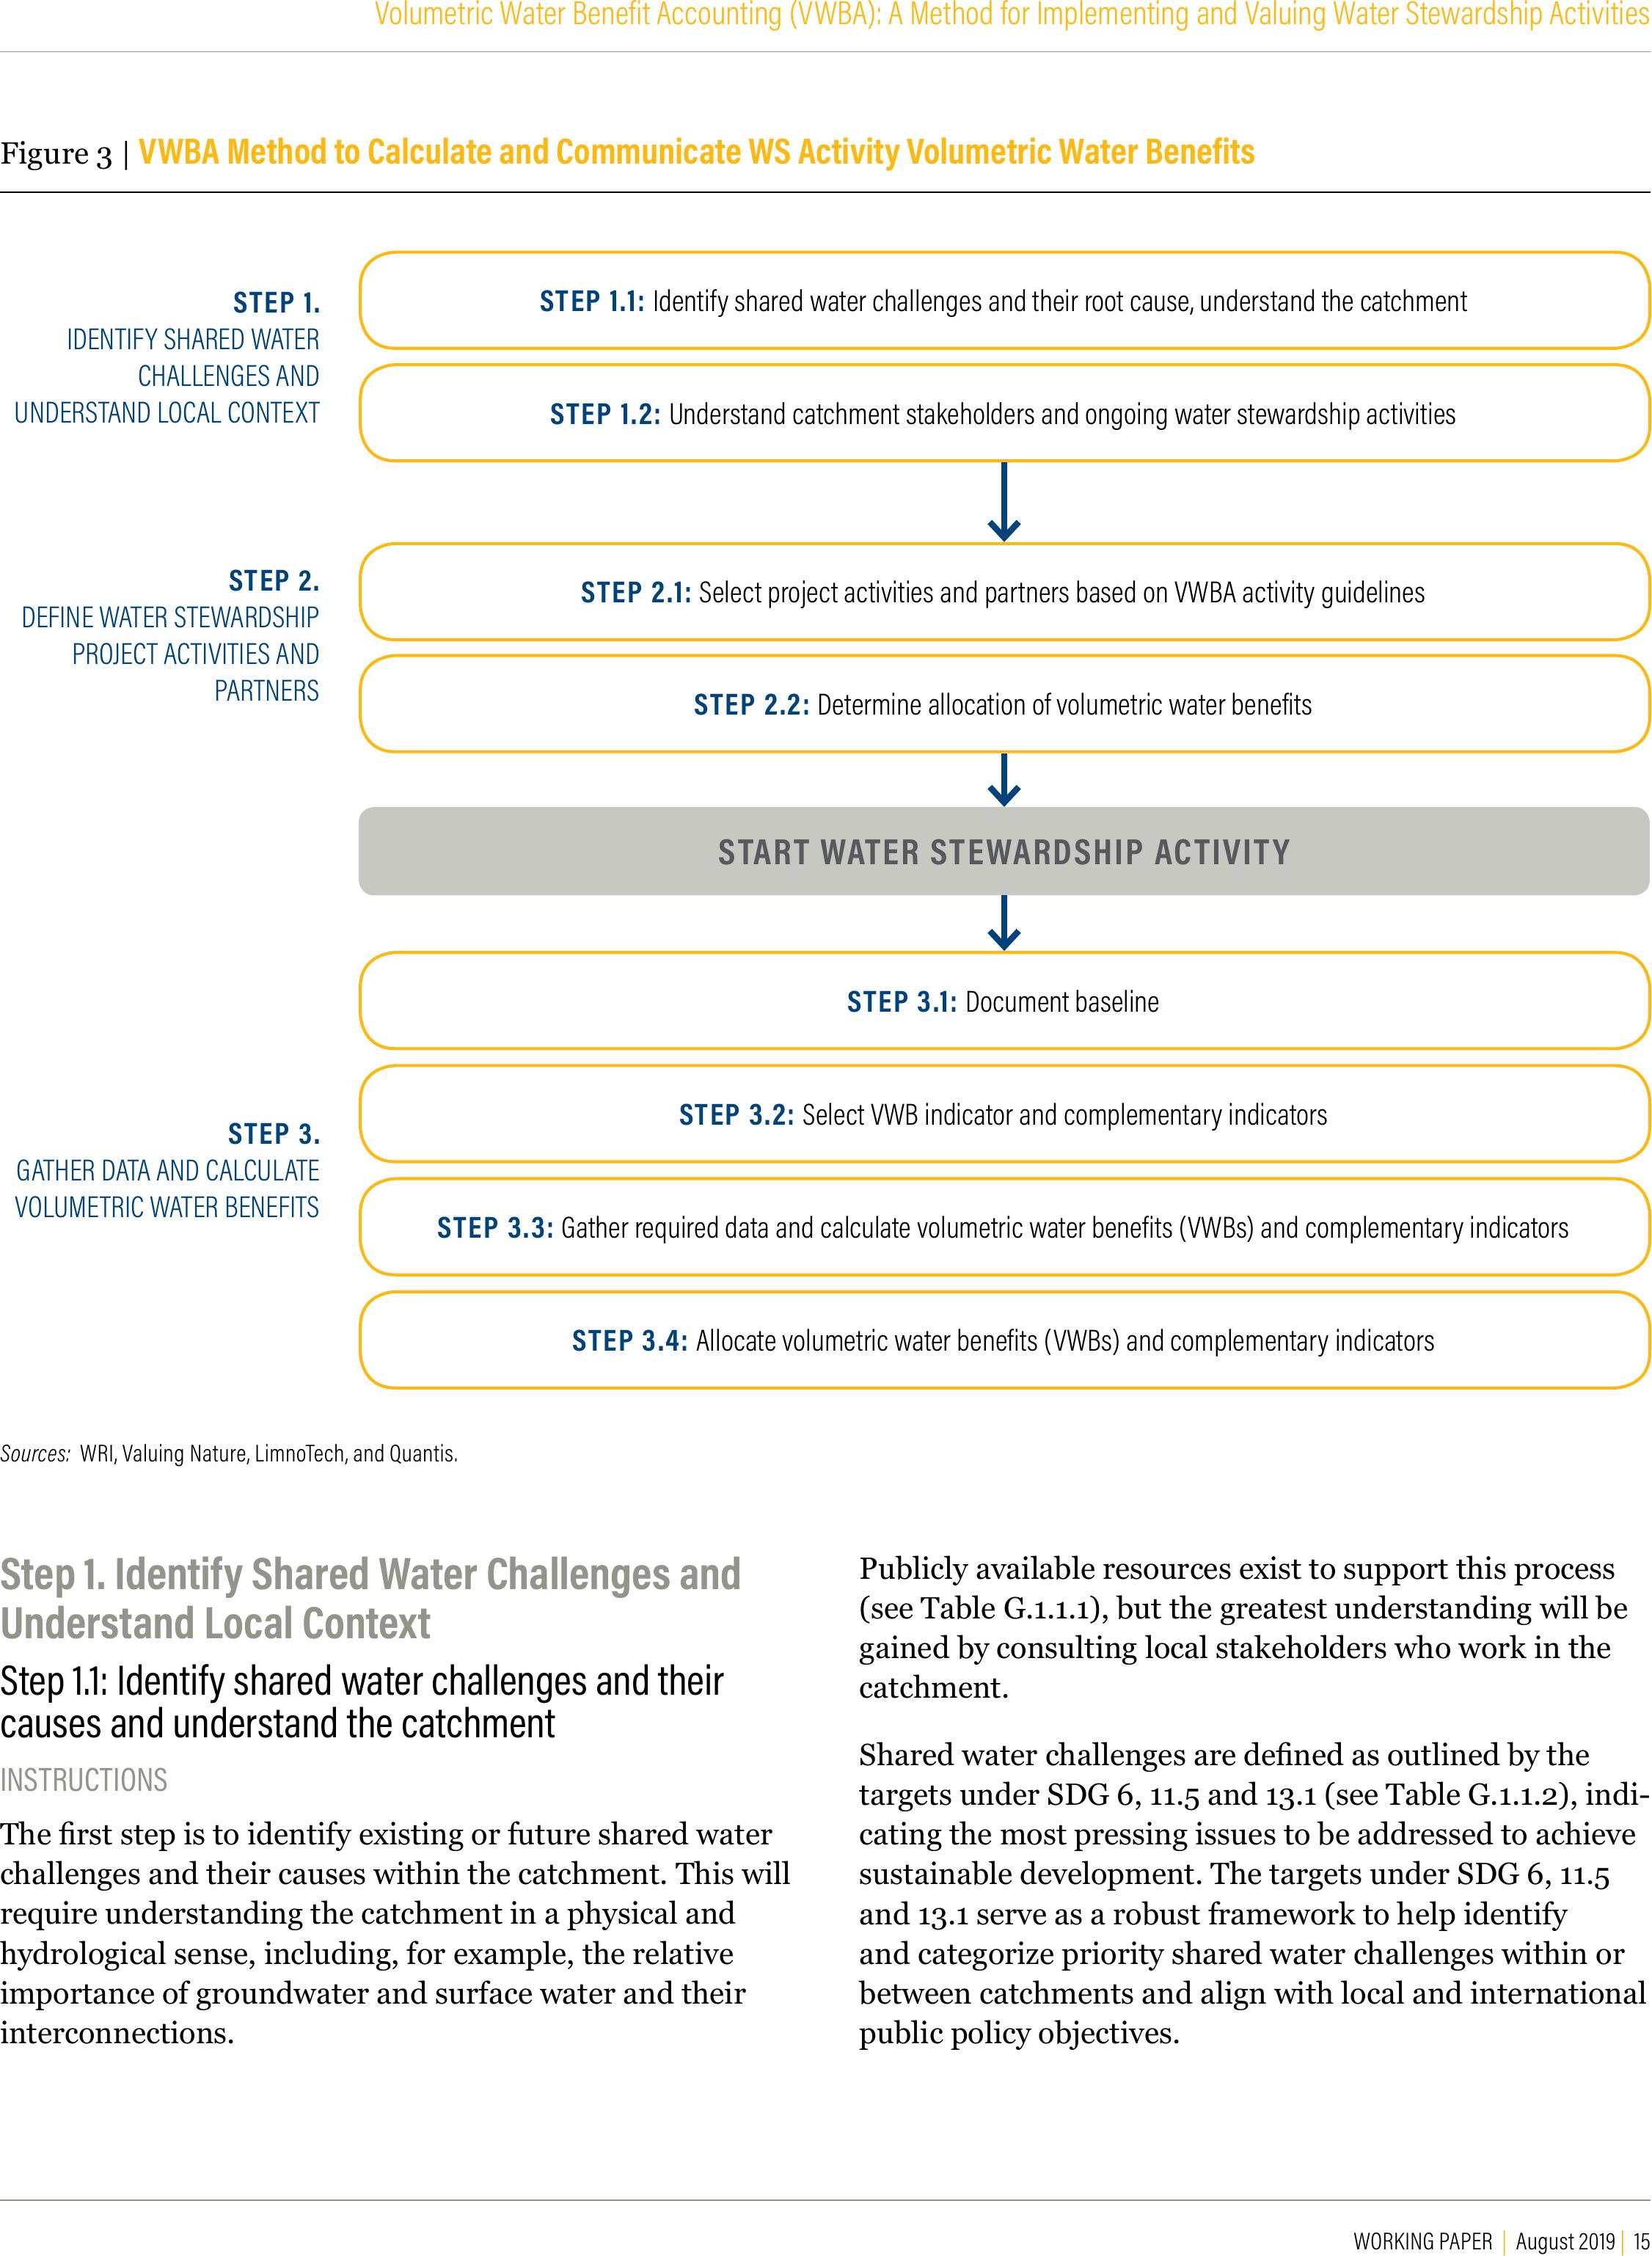
VWBA oers a three-step method (Figure 3), accompanied
by detailed guidance and recommended resources, to
estimate the volumetric water benets of WS activities.
VWBA does not help identify social or environmental
externalities or threats to business continuity that may
inform where to prioritize WS activities. Instead, VWBA
can be applied to activities in any location where a com-
pany operates, sources from, invests in, supplies from, or
discharges to, and it gives an organization exibility to
decide how to dene cost share for allocation purposes if
the project has multiple funders (e.g., in-kind, or mainte-
nance and monitoring); when to begin estimating benets
based on the type of activity and implementation timelines
(e.g., when funded, when fully implemented, or the year
after fully implemented); the requirements for conrming
benets after the project is complete (e.g., who, how, with
what frequency); and how long benets are counted after a
project is complete.
Therefore, prior to applying the method we propose, orga-
nizations should identify priority locations for implement-
ing WS activities based on where water is most material
using publicly available resources from national and/or
local water agencies, international organizations, and/or
local assessment (i.e., catchments, sphere of inuence, or
physical scope of water stewardship activities as dened
in AWS 2019, Guidance Step 1.1). Organizations should
also dene internal guidance for allocation of benet,
reporting, and project sustainability to ensure consistent
application across activities and communicate the VWBs
of all WS activities.
WORKING PAPER | August 2019 | 15
Volumetric Water Benefit Accounting (VWBA): A Method for Implementing and Valuing Water Stewardship Activities
Figure 3 |VWBA Method to Calculate and Communicate WS Activity Volumetric Water Benefits
Sources: WRI, Valuing Nature, LimnoTech, and Quantis.
Step 1. Identify Shared Water Challenges and
Understand Local Context
Step 1.1: Identify shared water challenges and their
causes and understand the catchment
INSTRUCTIONS
The rst step is to identify existing or future shared water
challenges and their causes within the catchment. This will
require understanding the catchment in a physical and
hydrological sense, including, for example, the relative
importance of groundwater and surface water and their
interconnections.
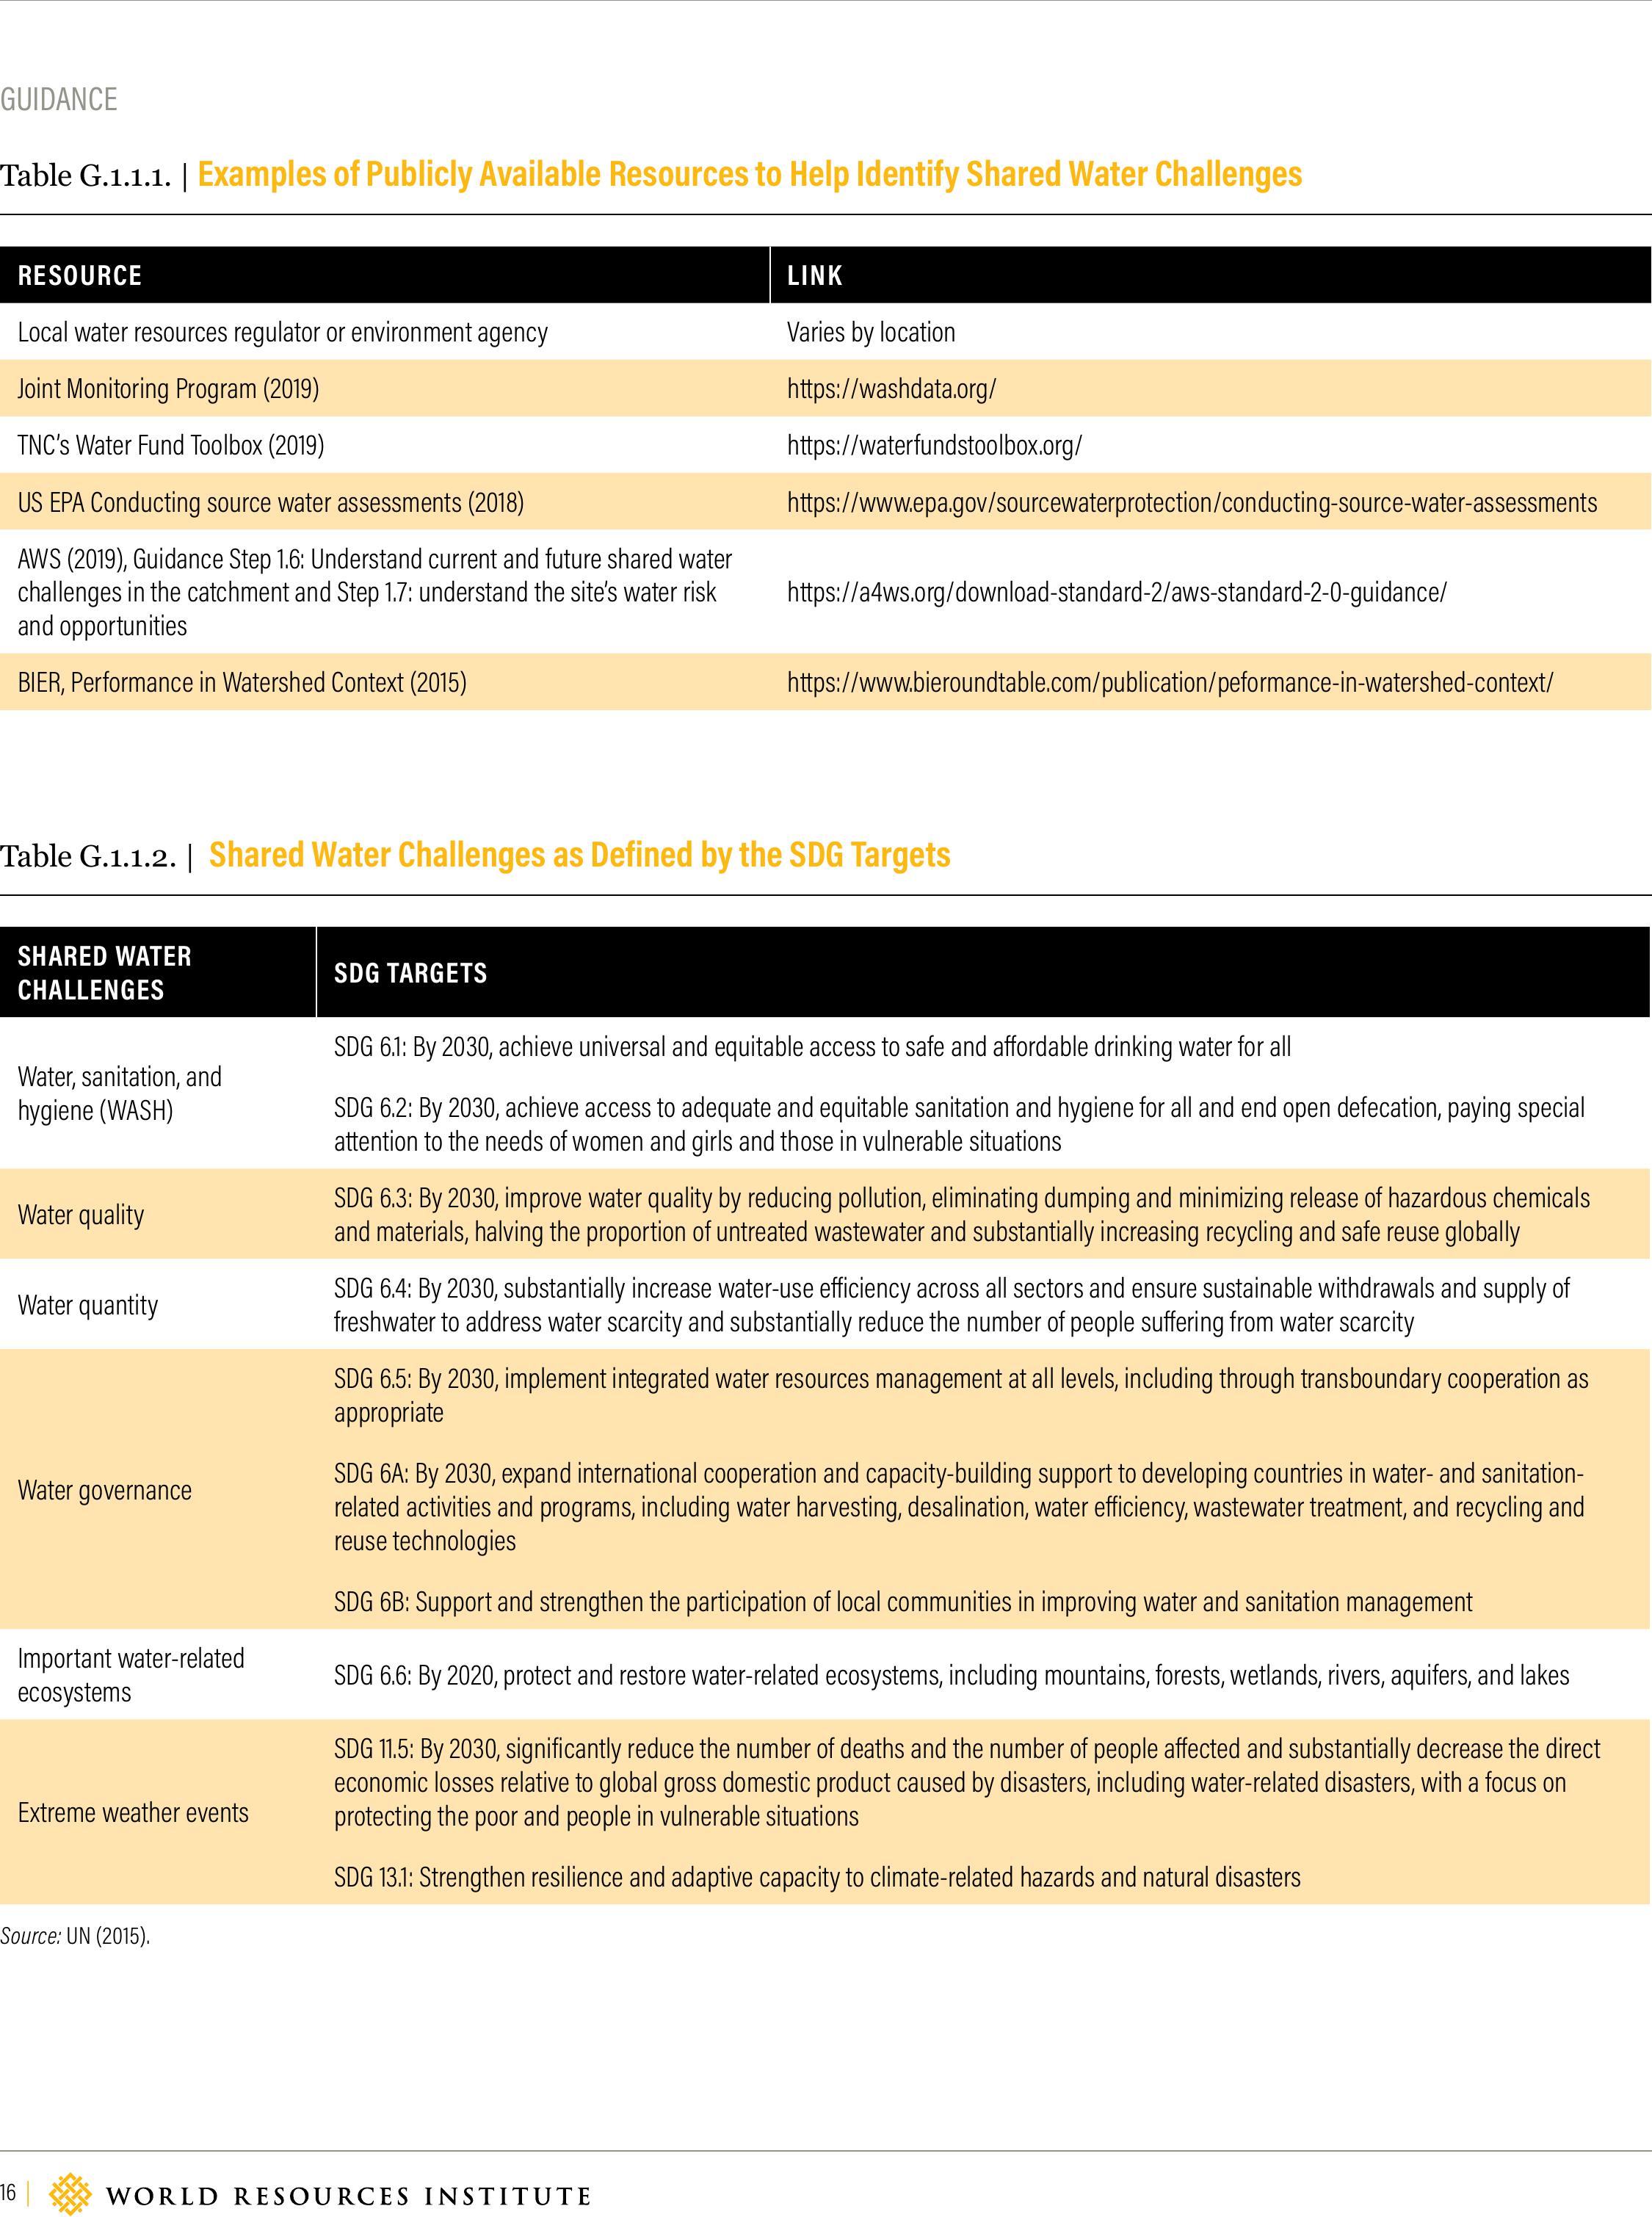
Publicly available resources exist to support this process
(see Table G.1.1.1), but the greatest understanding will be
gained by consulting local stakeholders who work in the
catchment.
Shared water challenges are dened as outlined by the
targets under SDG 6, 11.5 and 13.1 (see Table G.1.1.2), indi-
cating the most pressing issues to be addressed to achieve
sustainable development. The targets under SDG 6, 11.5
and 13.1 serve as a robust framework to help identify
and categorize priority shared water challenges within or
between catchments and align with local and international
public policy objectives.
STEP 1.
IDENTIFY SHARED WATER
CHALLENGES AND
UNDERSTAND LOCAL CONTEXT
STEP 2.
DEFINE WATER STEWARDSHIP
PROJECT ACTIVITIES AND
PARTNERS
STEP 3.
GATHER DATA AND CALCULATE
VOLUMETRIC WATER BENEFITS
STEP .: Identify shared water challenges and their root cause, understand the catchment
STEP .: Understand catchment stakeholders and ongoing water stewardship activities
STEP .: Select project activities and partners based on VWBA activity guidelines
STEP .: Determine allocation of volumetric water benefits
STEP .: Document baseline
STEP .: Select VWB indicator and complementary indicators
STEP .: Gather required data and calculate volumetric water benefits (VWBs) and complementary indicators
STEP .: Allocate volumetric water benefits (VWBs) and complementary indicators
START WATER STEWARDSHIP ACTIVITY
16 |
GUIDANCE
Table G.1.1.1. |Examples of Publicly Available Resources to Help Identify Shared Water Challenges
Table G.1.1.2. | Shared Water Challenges as Defined by the SDG Targets
RESOURCE LINK
Local water resources regulator or environment agencyVaries by location
Joint Monitoring Program (2019)https://washdata.org/
TNC’s Water Fund Toolbox (2019)https://waterfundstoolbox.org/
US EPA Conducting source water assessments (2018)https://www.epa.gov/sourcewaterprotection/conducting-source-water-assessments
AWS (2019), Guidance Step 1.6: Understand current and future shared water
challenges in the catchment and Step 1.7: understand the site’s water risk
and opportunities
https://a4ws.org/download-standard-2/aws-standard-2-0-guidance/
BIER, Performance in Watershed Context (2015) https://www.bieroundtable.com/publication/peformance-in-watershed-context/
SHARED WATER
CHALLENGES SDG TARGETS
Water, sanitation, and
hygiene (WASH)
SDG 6.1: By 2030, achieve universal and equitable access to safe and aordable drinking water for all
SDG 6.2: By 2030, achieve access to adequate and equitable sanitation and hygiene for all and end open defecation, paying special
attention to the needs of women and girls and those in vulnerable situations
Water quality SDG 6.3: By 2030, improve water quality by reducing pollution, eliminating dumping and minimizing release of hazardous chemicals
and materials, halving the proportion of untreated wastewater and substantially increasing recycling and safe reuse globally
Water quantitySDG 6.4: By 2030, substantially increase water-use eiciency across all sectors and ensure sustainable withdrawals and supply of
freshwater to address water scarcity and substantially reduce the number of people suering from water scarcity
Water governance
SDG 6.5: By 2030, implement integrated water resources management at all levels, including through transboundary cooperation as
appropriate
SDG 6A: By 2030, expand international cooperation and capacity-building support to developing countries in water- and sanitation-
related activities and programs, including water harvesting, desalination, water eiciency, wastewater treatment, and recycling and
reuse technologies
SDG 6B: Support and strengthen the participation of local communities in improving water and sanitation management
Important water-related
ecosystems SDG 6.6: By 2020, protect and restore water-related ecosystems, including mountains, forests, wetlands, rivers, aquifers, and lakes
Extreme weather events
SDG 11.5: By 2030, significantly reduce the number of deaths and the number of people aected and substantially decrease the direct
economic losses relative to global gross domestic product caused by disasters, including water-related disasters, with a focus on
protecting the poor and people in vulnerable situations
SDG 13.1: Strengthen resilience and adaptive capacity to climate-related hazards and natural disasters
Source: UN (2015).
WORKING PAPER | August 2019 | 17
Volumetric Water Benefit Accounting (VWBA): A Method for Implementing and Valuing Water Stewardship Activities
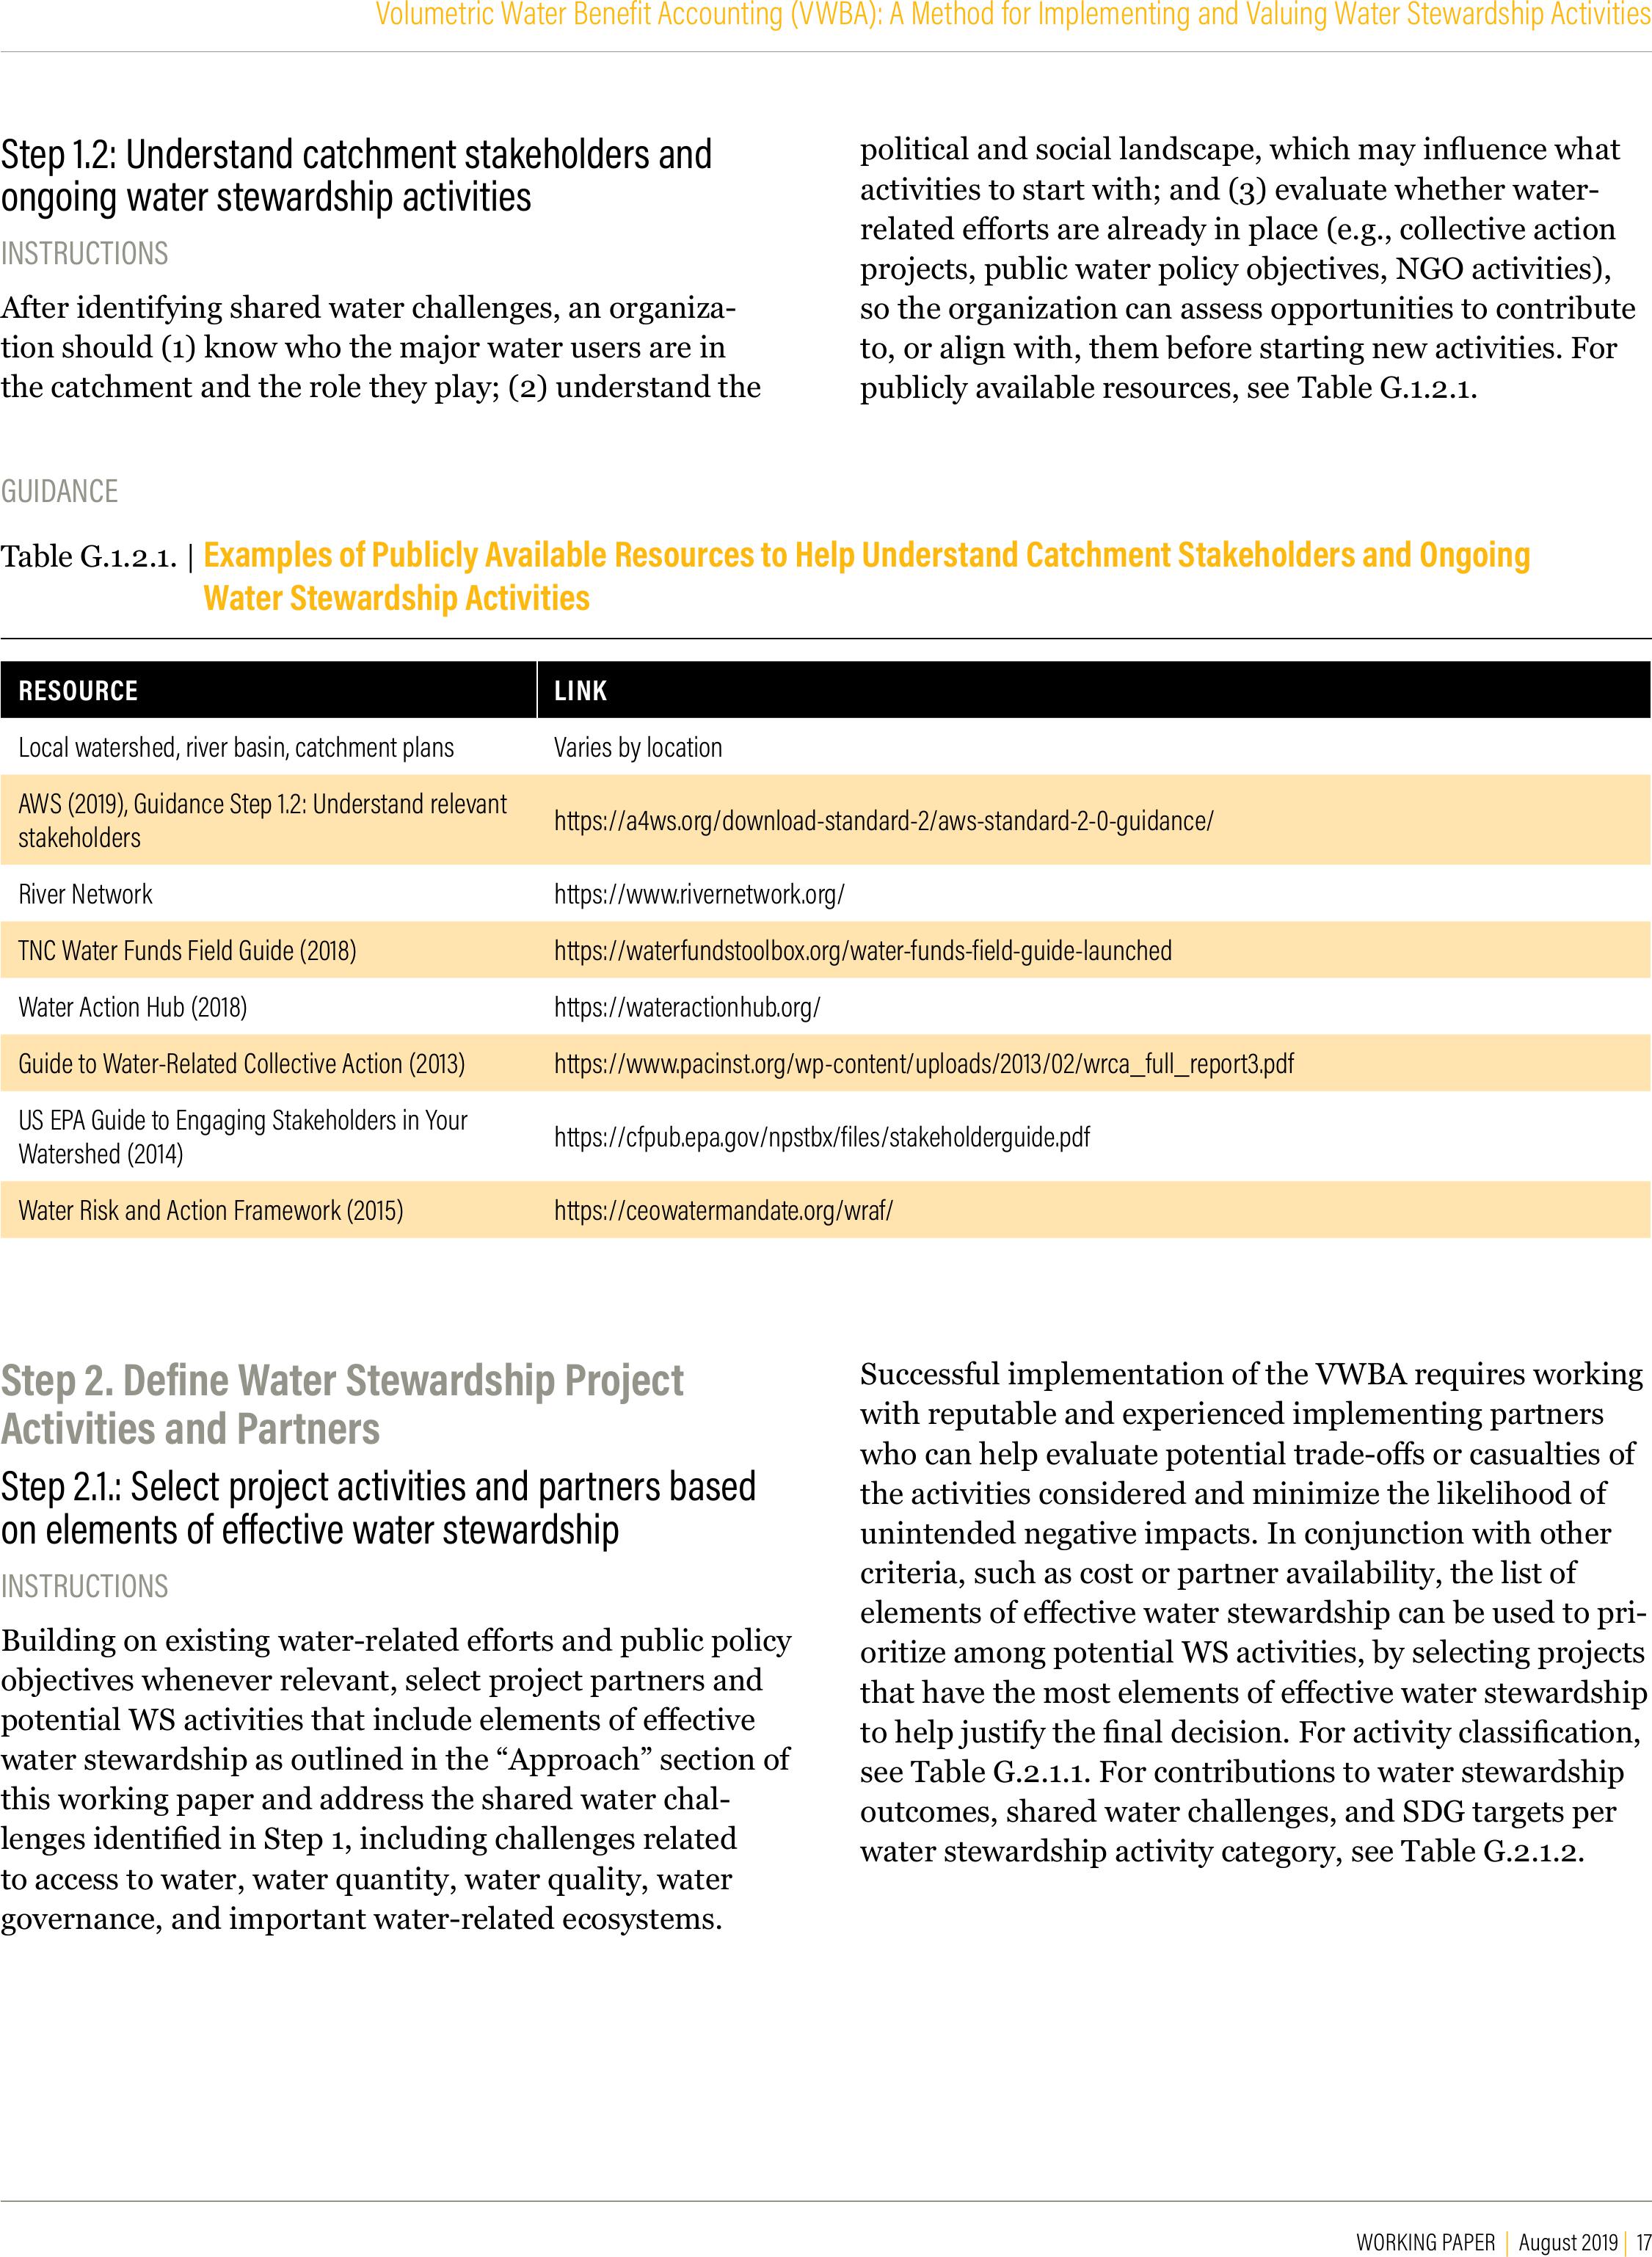
Step 1.2: Understand catchment stakeholders and
ongoing water stewardship activities
INSTRUCTIONS
After identifying shared water challenges, an organiza-
tion should (1) know who the major water users are in
the catchment and the role they play; (2) understand the
political and social landscape, which may inuence what
activities to start with; and (3) evaluate whether water-
related eorts are already in place (e.g., collective action
projects, public water policy objectives, NGO activities),
so the organization can assess opportunities to contribute
to, or align with, them before starting new activities. For
publicly available resources, see Table G.1.2.1.
Table G.1.2.1. |Examples of Publicly Available Resources to Help Understand Catchment Stakeholders and Ongoing
Water Stewardship Activities
GUIDANCE
RESOURCE LINK
Local watershed, river basin, catchment plansVaries by location
AWS (2019), Guidance Step 1.2: Understand relevant
stakeholders https://a4ws.org/download-standard-2/aws-standard-2-0-guidance/
River Networkhttps://www.rivernetwork.org/
TNC Water Funds Field Guide (2018)https://waterfundstoolbox.org/water-funds-field-guide-launched
Water Action Hub (2018) https://wateractionhub.org/
Guide to Water-Related Collective Action (2013)https://www.pacinst.org/wp-content/uploads/2013/02/wrca_full_report3.pdf
US EPA Guide to Engaging Stakeholders in Your
Watershed (2014)https://cfpub.epa.gov/npstbx/files/stakeholderguide.pdf
Water Risk and Action Framework (2015)https://ceowatermandate.org/wraf/
Step 2. Define Water Stewardship Project
Activities and Partners
Step 2.1.: Select project activities and partners based
on elements of eective water stewardship
INSTRUCTIONS
Building on existing water-related eorts and public policy
objectives whenever relevant, select project partners and
potential WS activities that include elements of eective
water stewardship as outlined in the “Approach” section of
this working paper and address the shared water chal-
lenges identied in Step 1, including challenges related
to access to water, water quantity, water quality, water
governance, and important water-related ecosystems.
Successful implementation of the VWBA requires working
with reputable and experienced implementing partners
who can help evaluate potential trade-os or casualties of
the activities considered and minimize the likelihood of
unintended negative impacts. In conjunction with other
criteria, such as cost or partner availability, the list of
elements of eective water stewardship can be used to pri-
oritize among potential WS activities, by selecting projects
that have the most elements of eective water stewardship
to help justify the nal decision. For activity classication,
see Table G.2.1.1. For contributions to water stewardship
outcomes, shared water challenges, and SDG targets per
water stewardship activity category, see Table G.2.1.2.

18 |
GUIDANCE
Table G.2.1.1. | Water Stewardship Activity Classification
CATEGORY ACTIVITYDESCRIPTION
Land conservation and
restoration
Land conservation (protection and preservation)
Legal mechanisms to protect land from development or conversion to a more
degraded use.
Development and diversification of sustainable livelihoods.
Land cover restoration
Restoration to improve vegetative health and cover, including reforestation (tree
planting in large deforested areas and riparian buers, thinning of monoculture
forests, agroforestry, rotational grazing, prairie and other grassland restoration,
invasive species removal, fencing.
Water supply reliability
Agricultural water demand reduction measures
Conversion from flood to drip irrigation, variable rate irrigation, advanced irrigation
scheduling, soil improvements, crop conversion and fallowing to reduce irrigation
need.
Operational eiciency measuresReduced direct water use.
Leak repair Detection and repair of leaks in distribution systems or buildings.
Consumer use eiciency measuresReduced water uses in homes and businesses associated with product use,
appliances, and fixtures.
Water reuseBeneficial reuse to replace supply of fresh water with reused water, or provision of a
new water source that supports economic development or benefits the environment.
New water supply for crop irrigationPipes, canals, and other infrastructure to deliver water, including reused water.
Rainwater harvesting
Infrastructure designed to capture and retain water during the wet season and
enhance water availability.
Water accessAccess to drinking water supplyWell construction or rehabilitation, water distribution, water treatment, rainwater
harvesting.
Water quality
Agricultural best management practices (BMPs)Conservation tillage, laser leveling, cover crops.
Agrochemical management (4Rs).
Stormwater managementGreen infrastructure including detention ponds, bio-swales, permeable pavement,
rain gardens, other measures that reduce impervious area.
Constructed wetland treatment systems Systems placed on agricultural landscapes and in urban areas.
Wastewater treatment plants Facilities designed to remove pollutants from wastewater discharge.
WORKING PAPER | August 2019 | 19
Volumetric Water Benefit Accounting (VWBA): A Method for Implementing and Valuing Water Stewardship Activities
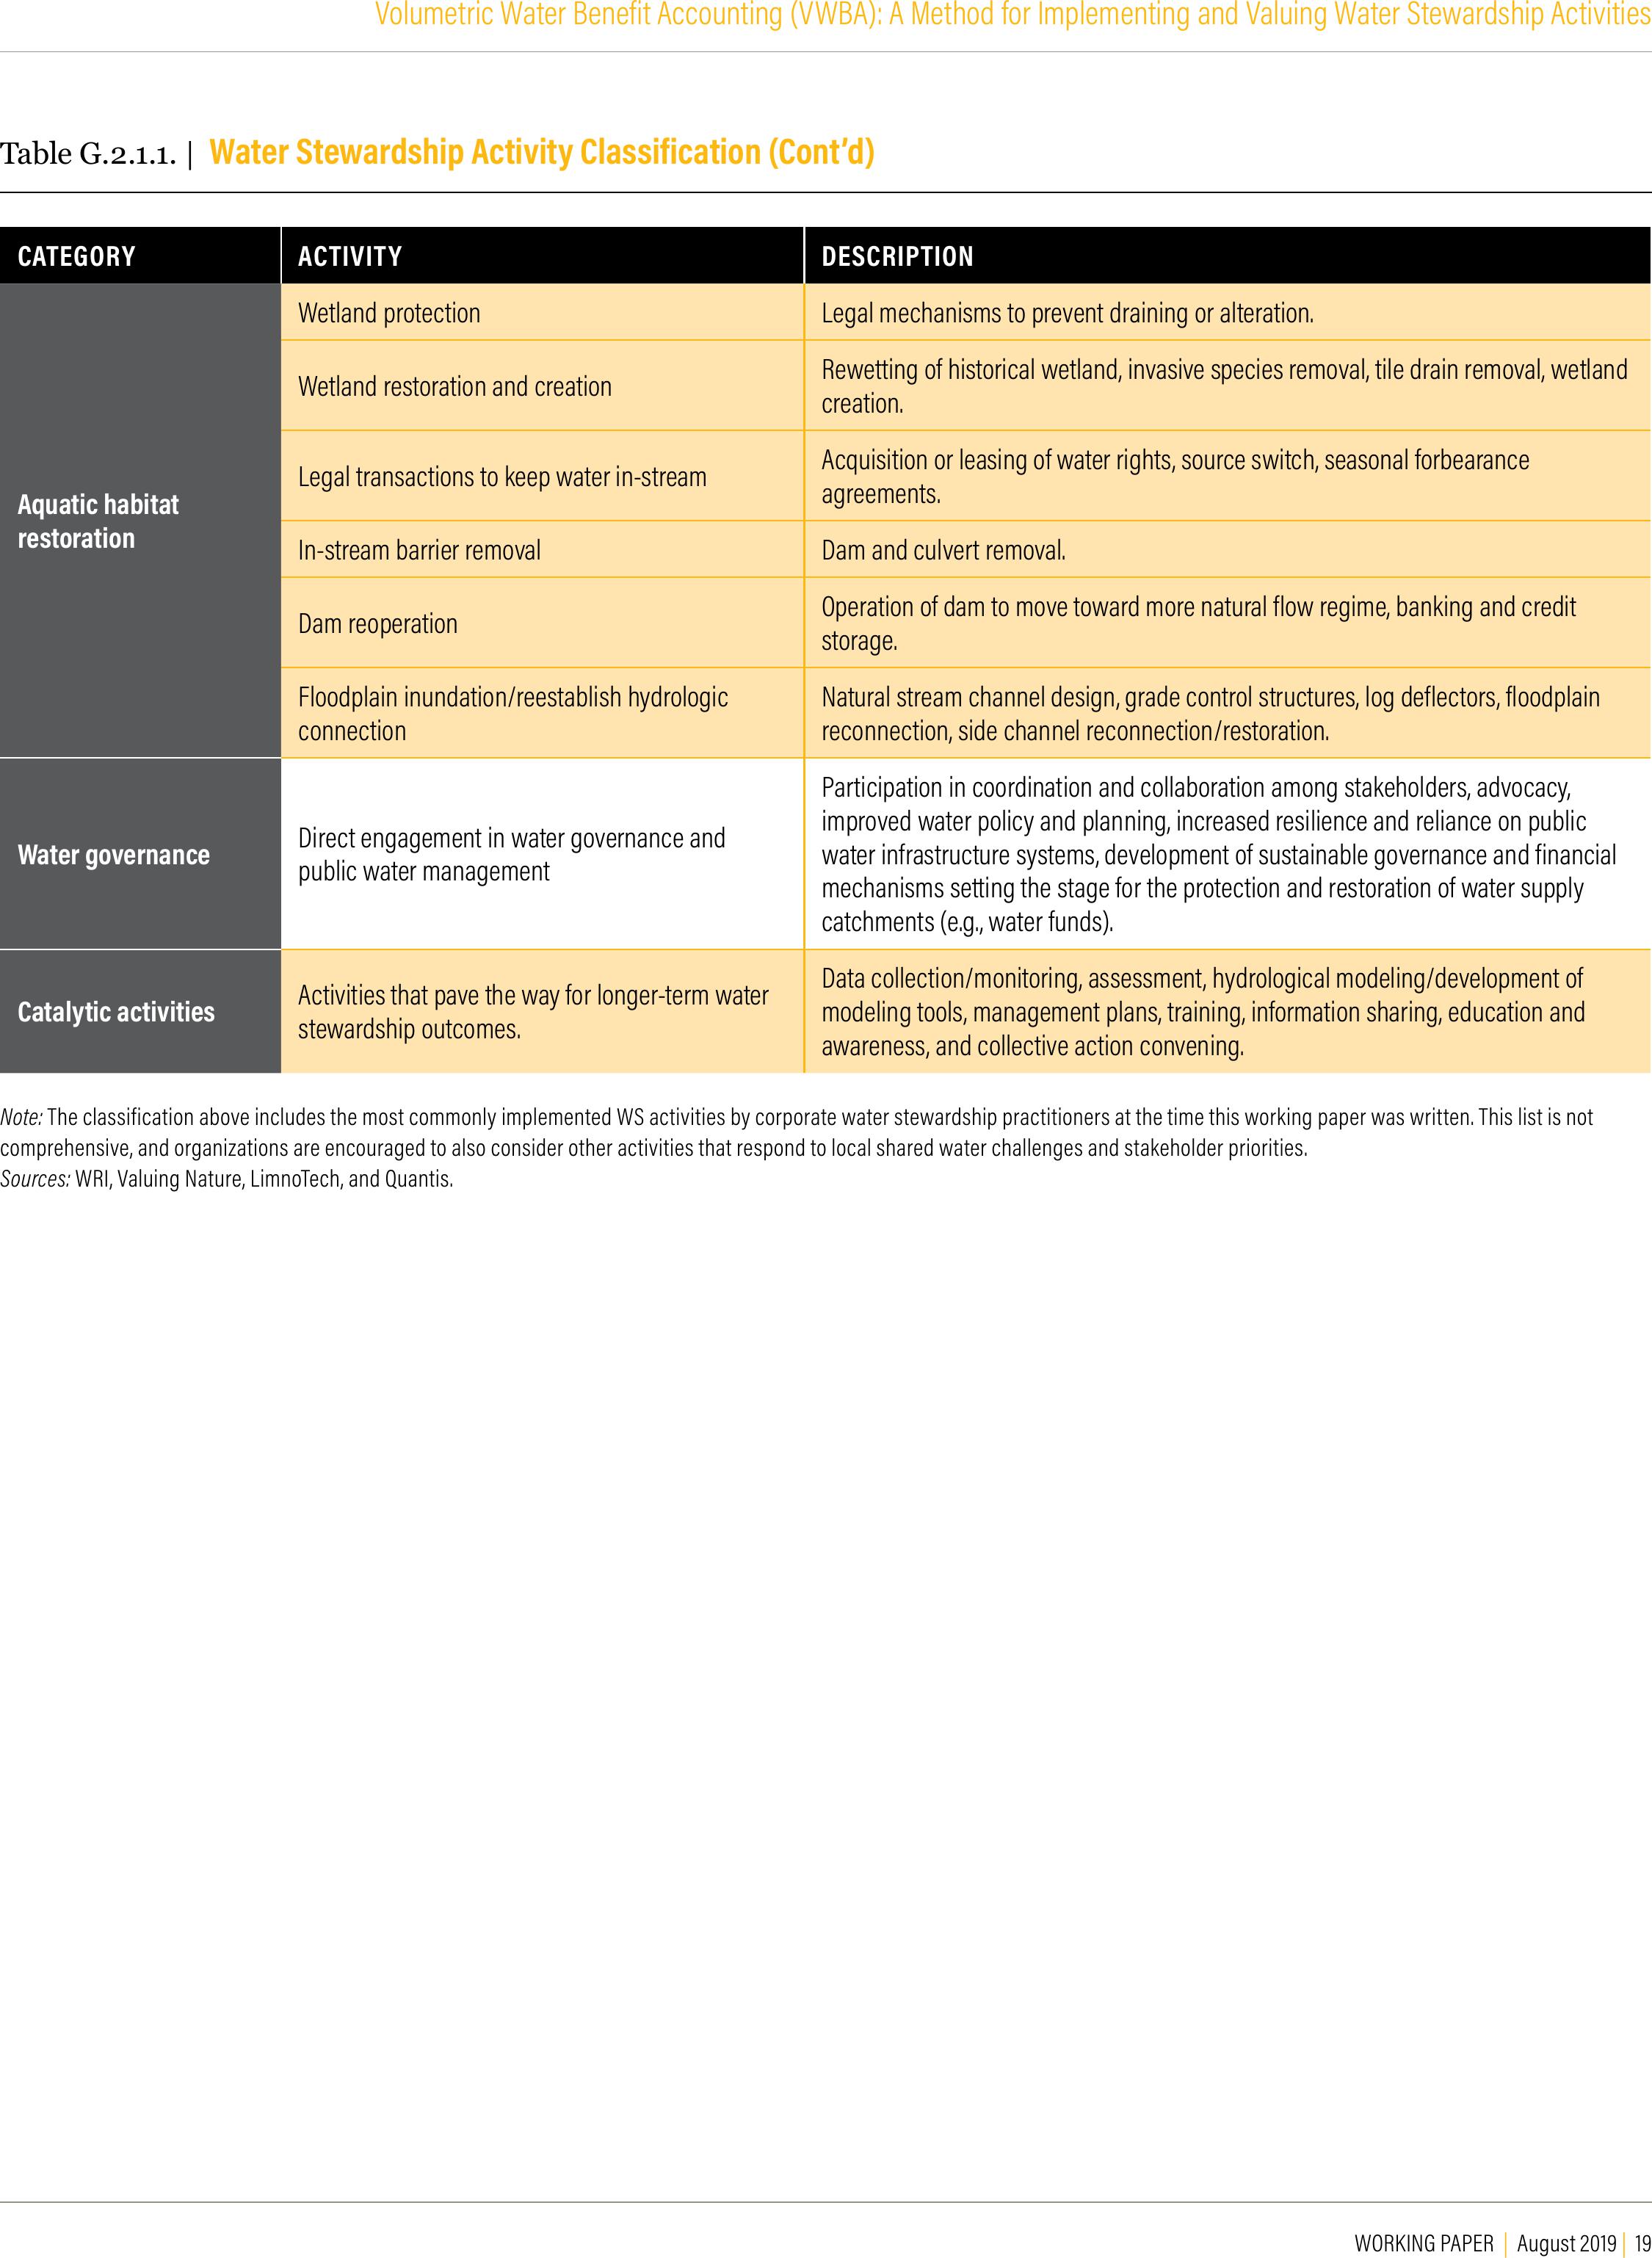
Table G.2.1.1. | Water Stewardship Activity Classification (Cont’d)
CATEGORY ACTIVITYDESCRIPTION
Aquatic habitat
restoration
Wetland protectionLegal mechanisms to prevent draining or alteration.
Wetland restoration and creationRewetting of historical wetland, invasive species removal, tile drain removal, wetland
creation.
Legal transactions to keep water in-streamAcquisition or leasing of water rights, source switch, seasonal forbearance
agreements.
In-stream barrier removalDam and culvert removal.
Dam reoperationOperation of dam to move toward more natural flow regime, banking and credit
storage.
Floodplain inundation/reestablish hydrologic
connection
Natural stream channel design, grade control structures, log deflectors, floodplain
reconnection, side channel reconnection/restoration.
Water governanceDirect engagement in water governance and
public water management
Participation in coordination and collaboration among stakeholders, advocacy,
improved water policy and planning, increased resilience and reliance on public
water infrastructure systems, development of sustainable governance and financial
mechanisms setting the stage for the protection and restoration of water supply
catchments (e.g., water funds).
Catalytic activitiesActivities that pave the way for longer-term water
stewardship outcomes.
Data collection/monitoring, assessment, hydrological modeling/development of
modeling tools, management plans, training, information sharing, education and
awareness, and collective action convening.
Note: The classification above includes the most commonly implemented WS activities by corporate water stewardship practitioners at the time this working paper was written. This list is not
comprehensive, and organizations are encouraged to also consider other activities that respond to local shared water challenges and stakeholder priorities.
Sources: WRI, Valuing Nature, LimnoTech, and Quantis.
20 |
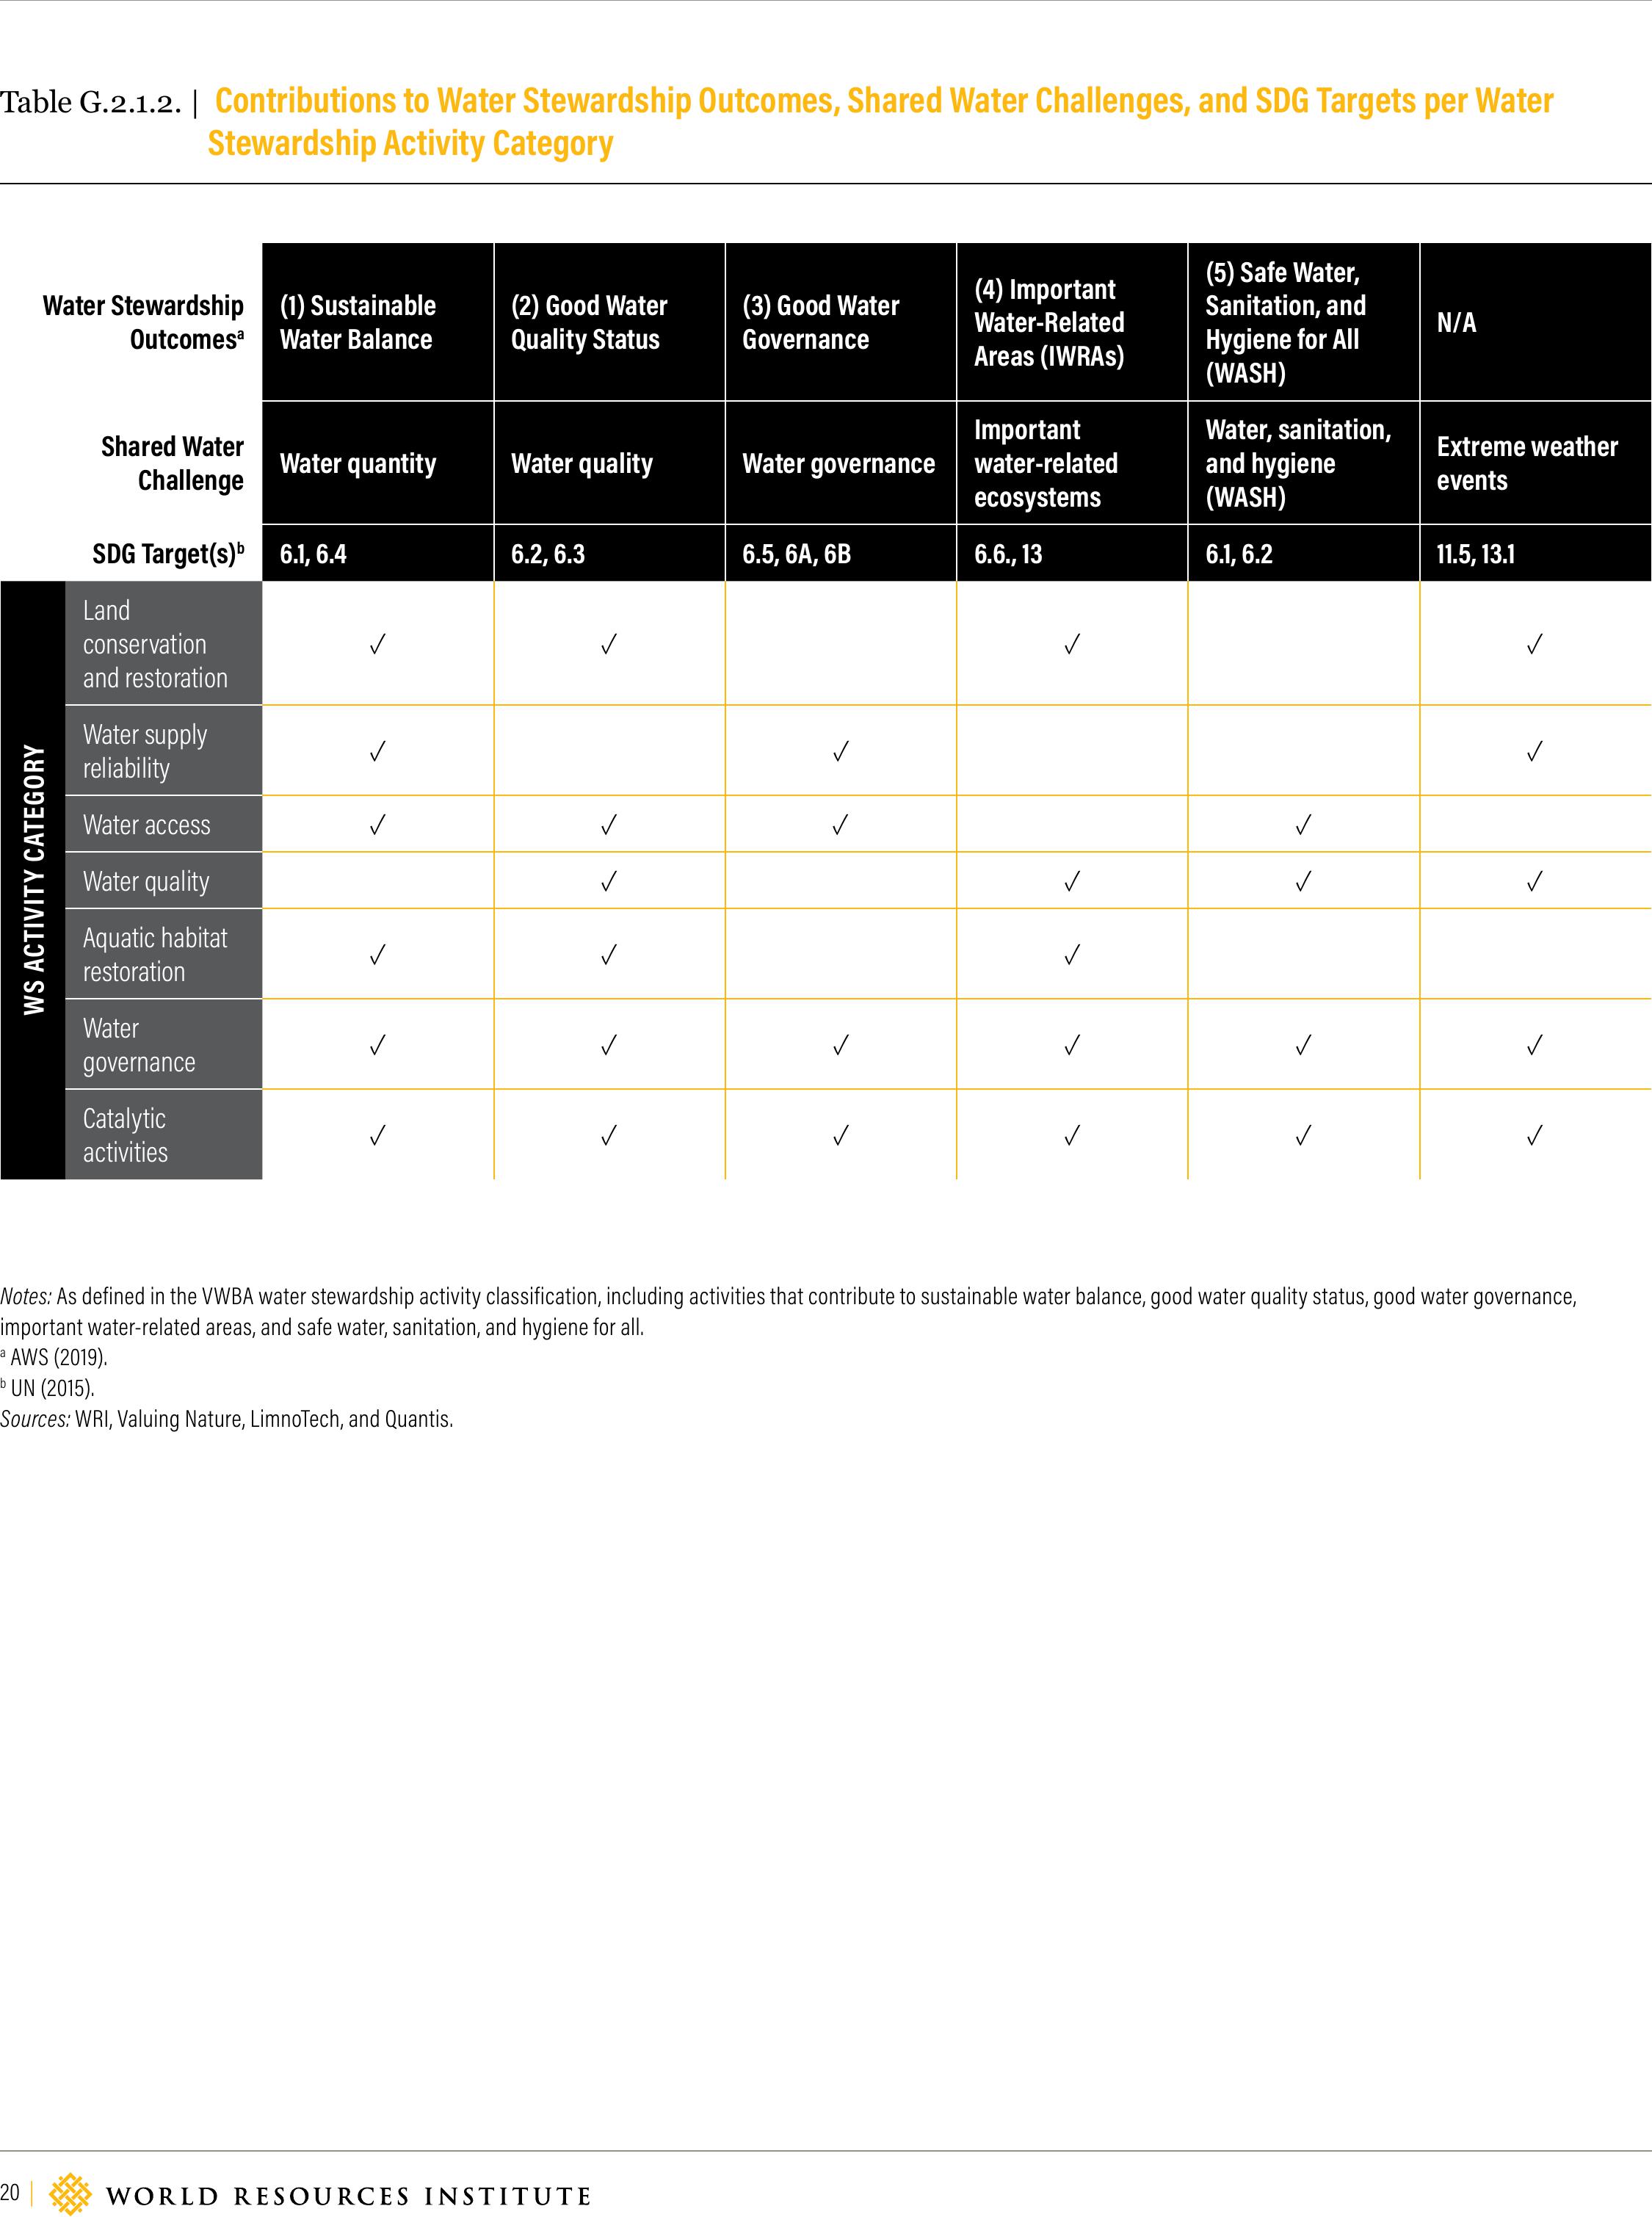
Table G.2.1.2. | Contributions to Water Stewardship Outcomes, Shared Water Challenges, and SDG Targets per Water
Stewardship Activity Category
Notes: As defined in the VWBA water stewardship activity classification, including activities that contribute to sustainable water balance, good water quality status, good water governance,
important water-related areas, and safe water, sanitation, and hygiene for all.
a AWS (2019).
b UN (2015).
Sources:WRI, Valuing Nature, LimnoTech, and Quantis.
Water Stewardship
Outcomesa
(1) Sustainable
Water Balance
(2) Good Water
Quality Status
(3) Good Water
Governance
(4) Important
Water-Related
Areas (IWRAs)
(5) Safe Water,
Sanitation, and
Hygiene for All
(WASH)
N/A
Shared Water
Challenge Water quantityWater qualityWater governance
Important
water-related
ecosystems
Water, sanitation,
and hygiene
(WASH)
Extreme weather
events
SDG Target(s)b6.1, 6.46.2, 6.36.5, 6A, 6B6.6., 136.1, 6.211.5, 13.1
WS ACTIVITY CATEGORY
Land
conservation
and restoration
Water supply
reliability
Water access
Water quality
Aquatic habitat
restoration
Water
governance
Catalytic
activities
WORKING PAPER | August 2019 | 21
Volumetric Water Benefit Accounting (VWBA): A Method for Implementing and Valuing Water Stewardship Activities
Step 2.2.: Determine allocation of volumetric
water benefits
INSTRUCTIONS
When relevant, allocation of VWBs is required to deter-
mine the VWBs associated with the contribution of each
project partner and to avoid double counting and over-
claiming of VWBs by the partners involved.
If VWBs require allocation among activity partners, the
approach and principles for allocation should be deter-
mined and agreed upon with all WS activity partners
before implementing the WS activity. For example, if the
total benets are allocated to three dierent companies
based on cost contribution, there should be agreement on
what is included in the total cost used for the cost-share
calculation (e.g., planning, design, maintenance, monitor-
ing, reporting). For some very large projects (e.g., water
funds, projects that are expanding over time, or projects
with many funders), it may be dicult to determine total
costs. In these cases, it may be possible to work with the
activity partners to dene a portion of the project that can
be 100 percent funded, eliminating the need to determine
a total project cost for the entire large project. For exam-
ple, for a 10,000-hectare restoration project the cost share
could be viewed as either 1 percent cost share of the entire
10,000-hectare project, or 100 percent cost share of 100
hectares. Both approaches would credit the funder with a
volume associated with 100 hectares restored. See also the
example in Table G.2.2.1.
Note: It is the sole responsibility of WS activity partners
to ensure that VWBs are claimed exclusively by those
partners involved in the WS activity. This is particularly
relevant for organizations providing goods and services
associated with the WS activity to more than one organiza-
tion (e.g., VWBs achieved by farmers working with buyer
A should not allow buyer B to claim the VWBs achieved by
working with buyer A).
GUIDANCE
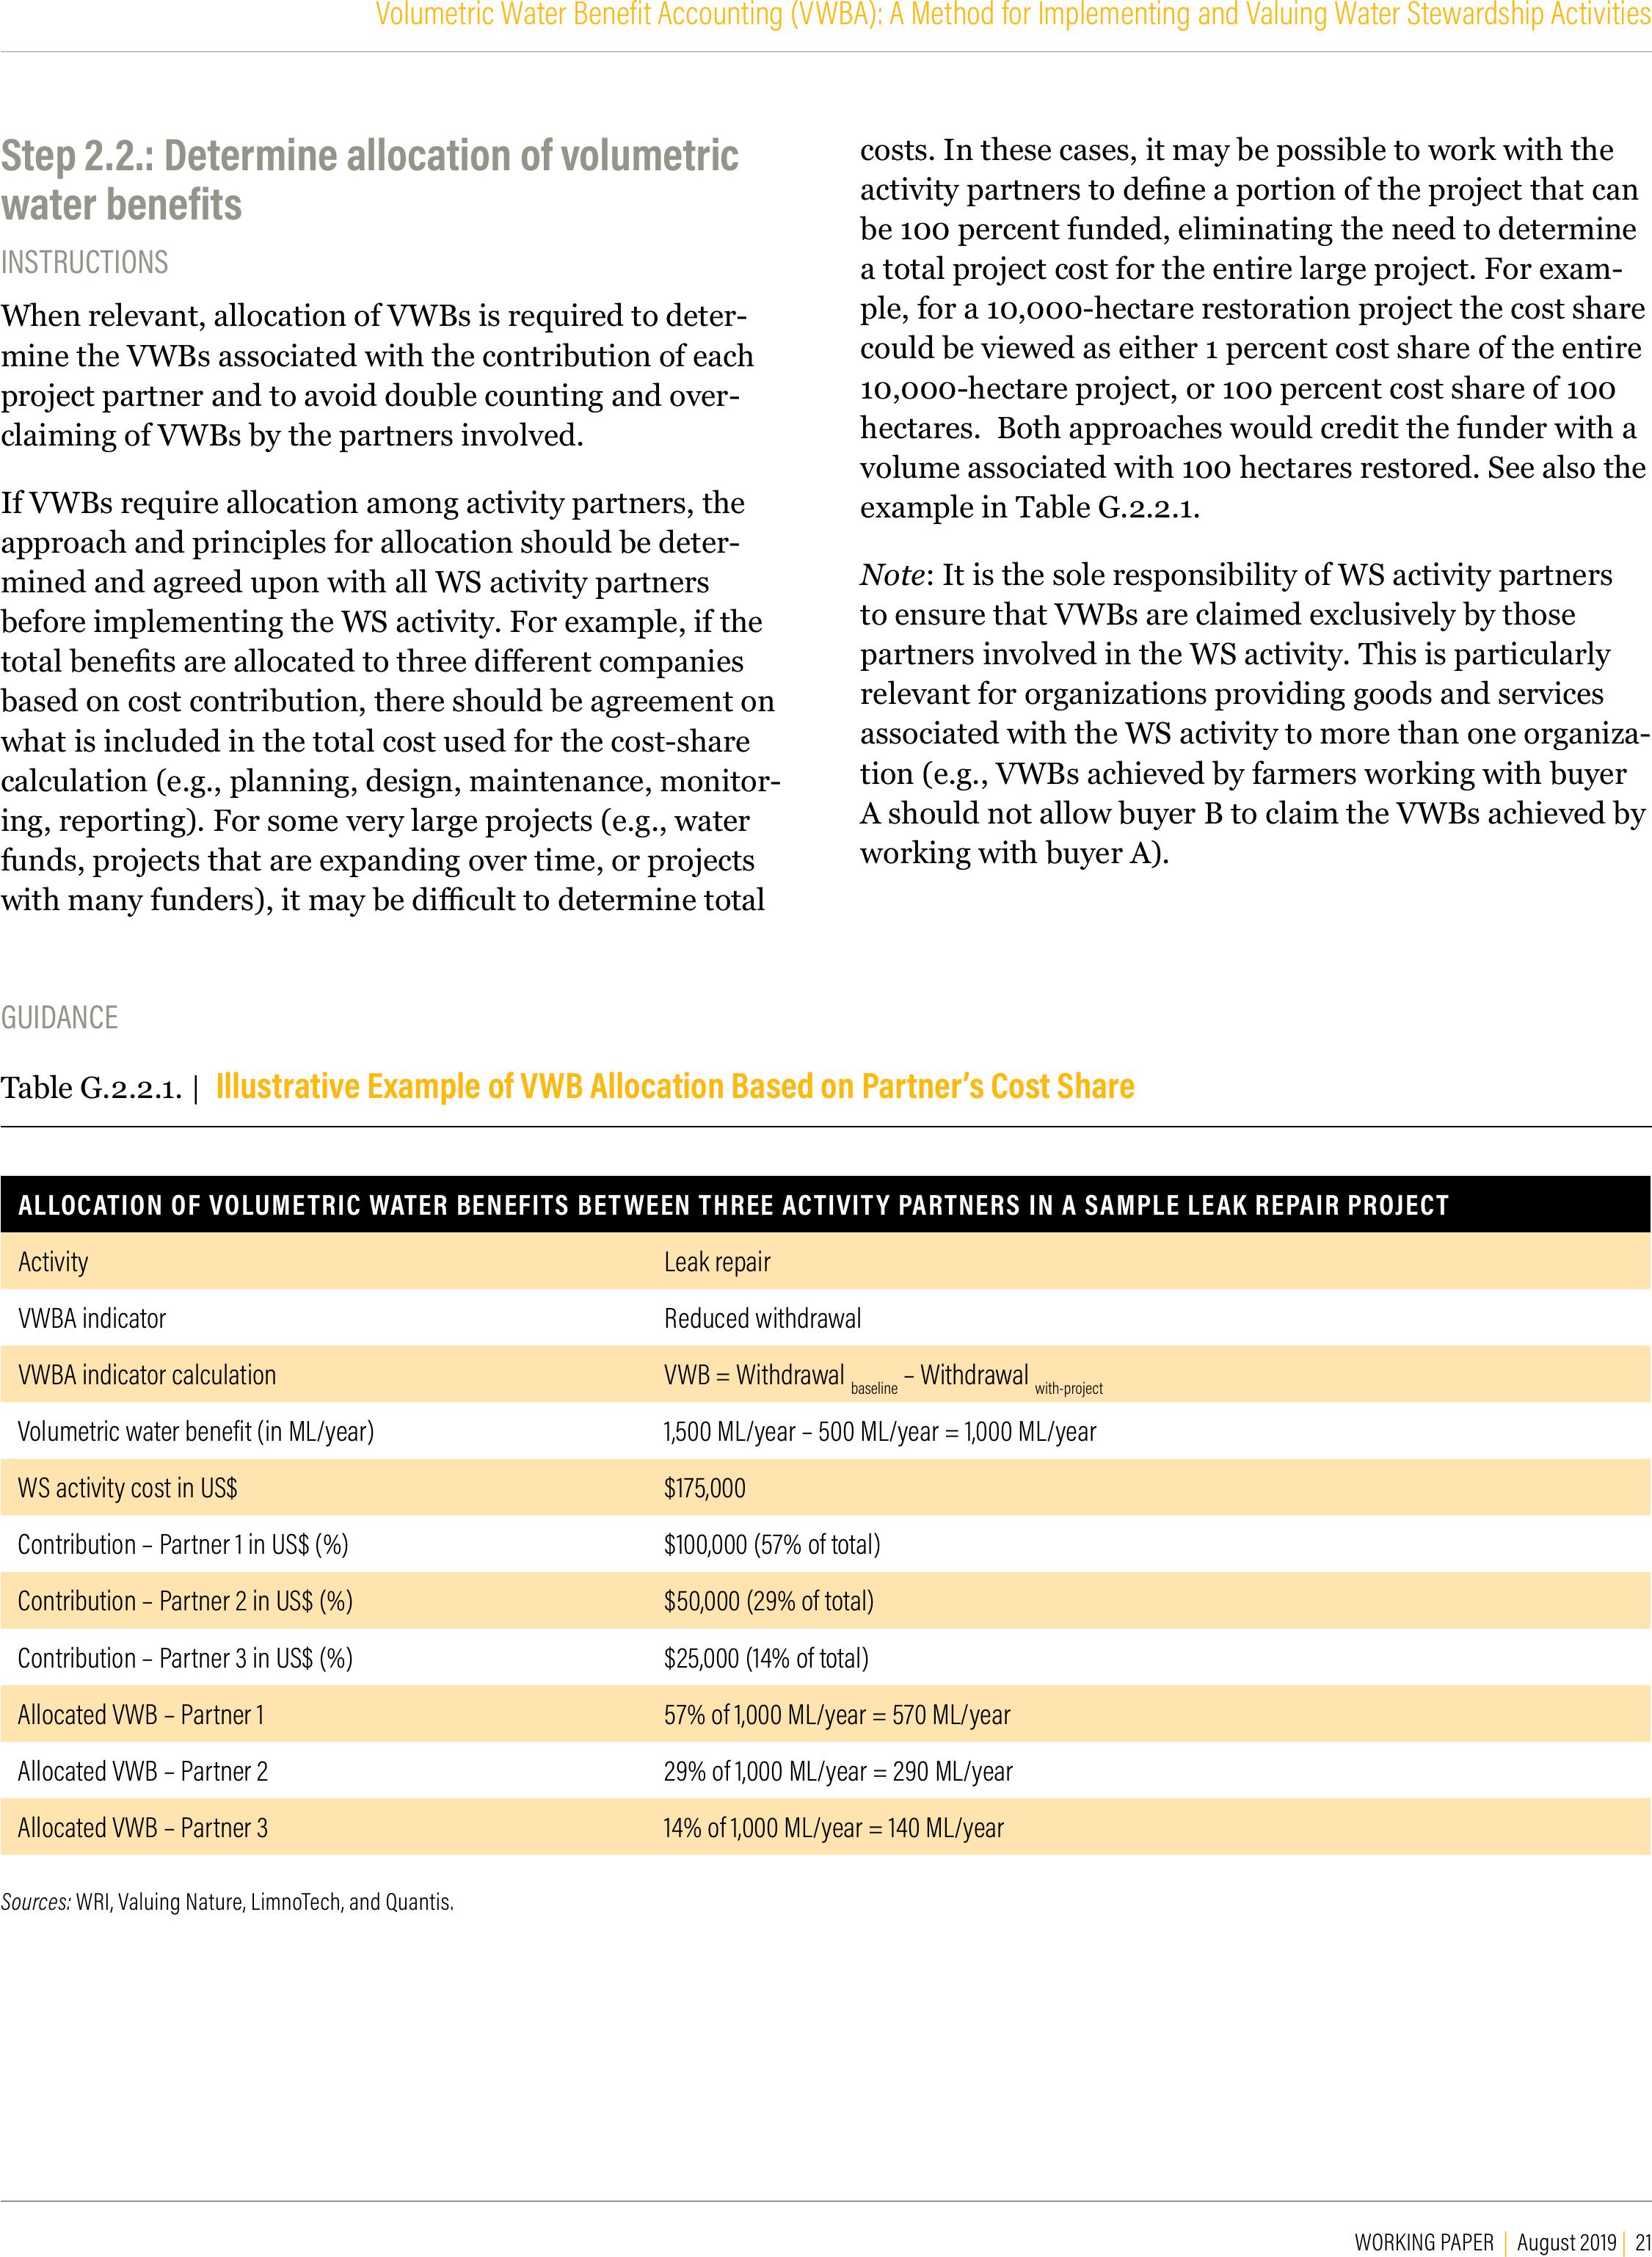
Table G.2.2.1. | Illustrative Example of VWB Allocation Based on Partner’s Cost Share
ALLOCATION OF VOLUMETRIC WATER BENEFITS BETWEEN THREE ACTIVITY PARTNERS IN A SAMPLE LEAK REPAIR PROJECT
ActivityLeak repair
VWBA indicatorReduced withdrawal
VWBA indicator calculationVWB = Withdrawal baseline – Withdrawal with-project
Volumetric water benefit (in ML/year)1,500 ML/year – 500 ML/year = 1,000 ML/year
WS activity cost in US$$175,000
Contribution – Partner 1 in US$ (%)$100,000 (57% of total)
Contribution – Partner 2 in US$ (%)$50,000 (29% of total)
Contribution – Partner 3 in US$ (%)$25,000 (14% of total)
Allocated VWB – Partner 157% of 1,000 ML/year = 570 ML/year
Allocated VWB – Partner 229% of 1,000 ML/year = 290 ML/year
Allocated VWB – Partner 314% of 1,000 ML/year = 140 ML/year
Sources: WRI, Valuing Nature, LimnoTech, and Quantis.
22 |
Step 3. Gather Data and Calculate Volumetric
Water Benefits
Step 3.1. Document baseline
INSTRUCTIONS
The next step is to document the baseline conditions
for the shared water challenge (or challenges) being
addressed by the WS activities. Baseline conditions refer
to the beginning point at which the variable measured by
the VWB indicator will be monitored and against which
progress can be assessed or comparisons made. Baseline
conditions can be thought of as the “without project” con-
ditions. In the context of VWBA, baseline conditions refer
to the VWB and complementary indicator values prior to
the WS activity’s taking place.
Note: If warranted by expected changes in “without proj-
ect” conditions, practitioners may choose to review and
update baseline values over time, using expert judgment.
GUIDANCE
Baseline conditions can be estimated using existing
empirical information available in the public domain
(from government agencies, regulators, or other third-
party estimates), as well as local knowledge.
Step 3.2. Select VWB indicator and
complementary indicators
INSTRUCTIONS
Based on the water stewardship activity carried out, prac-
titioners should select an appropriate VWB indicator and
complementary indicators:
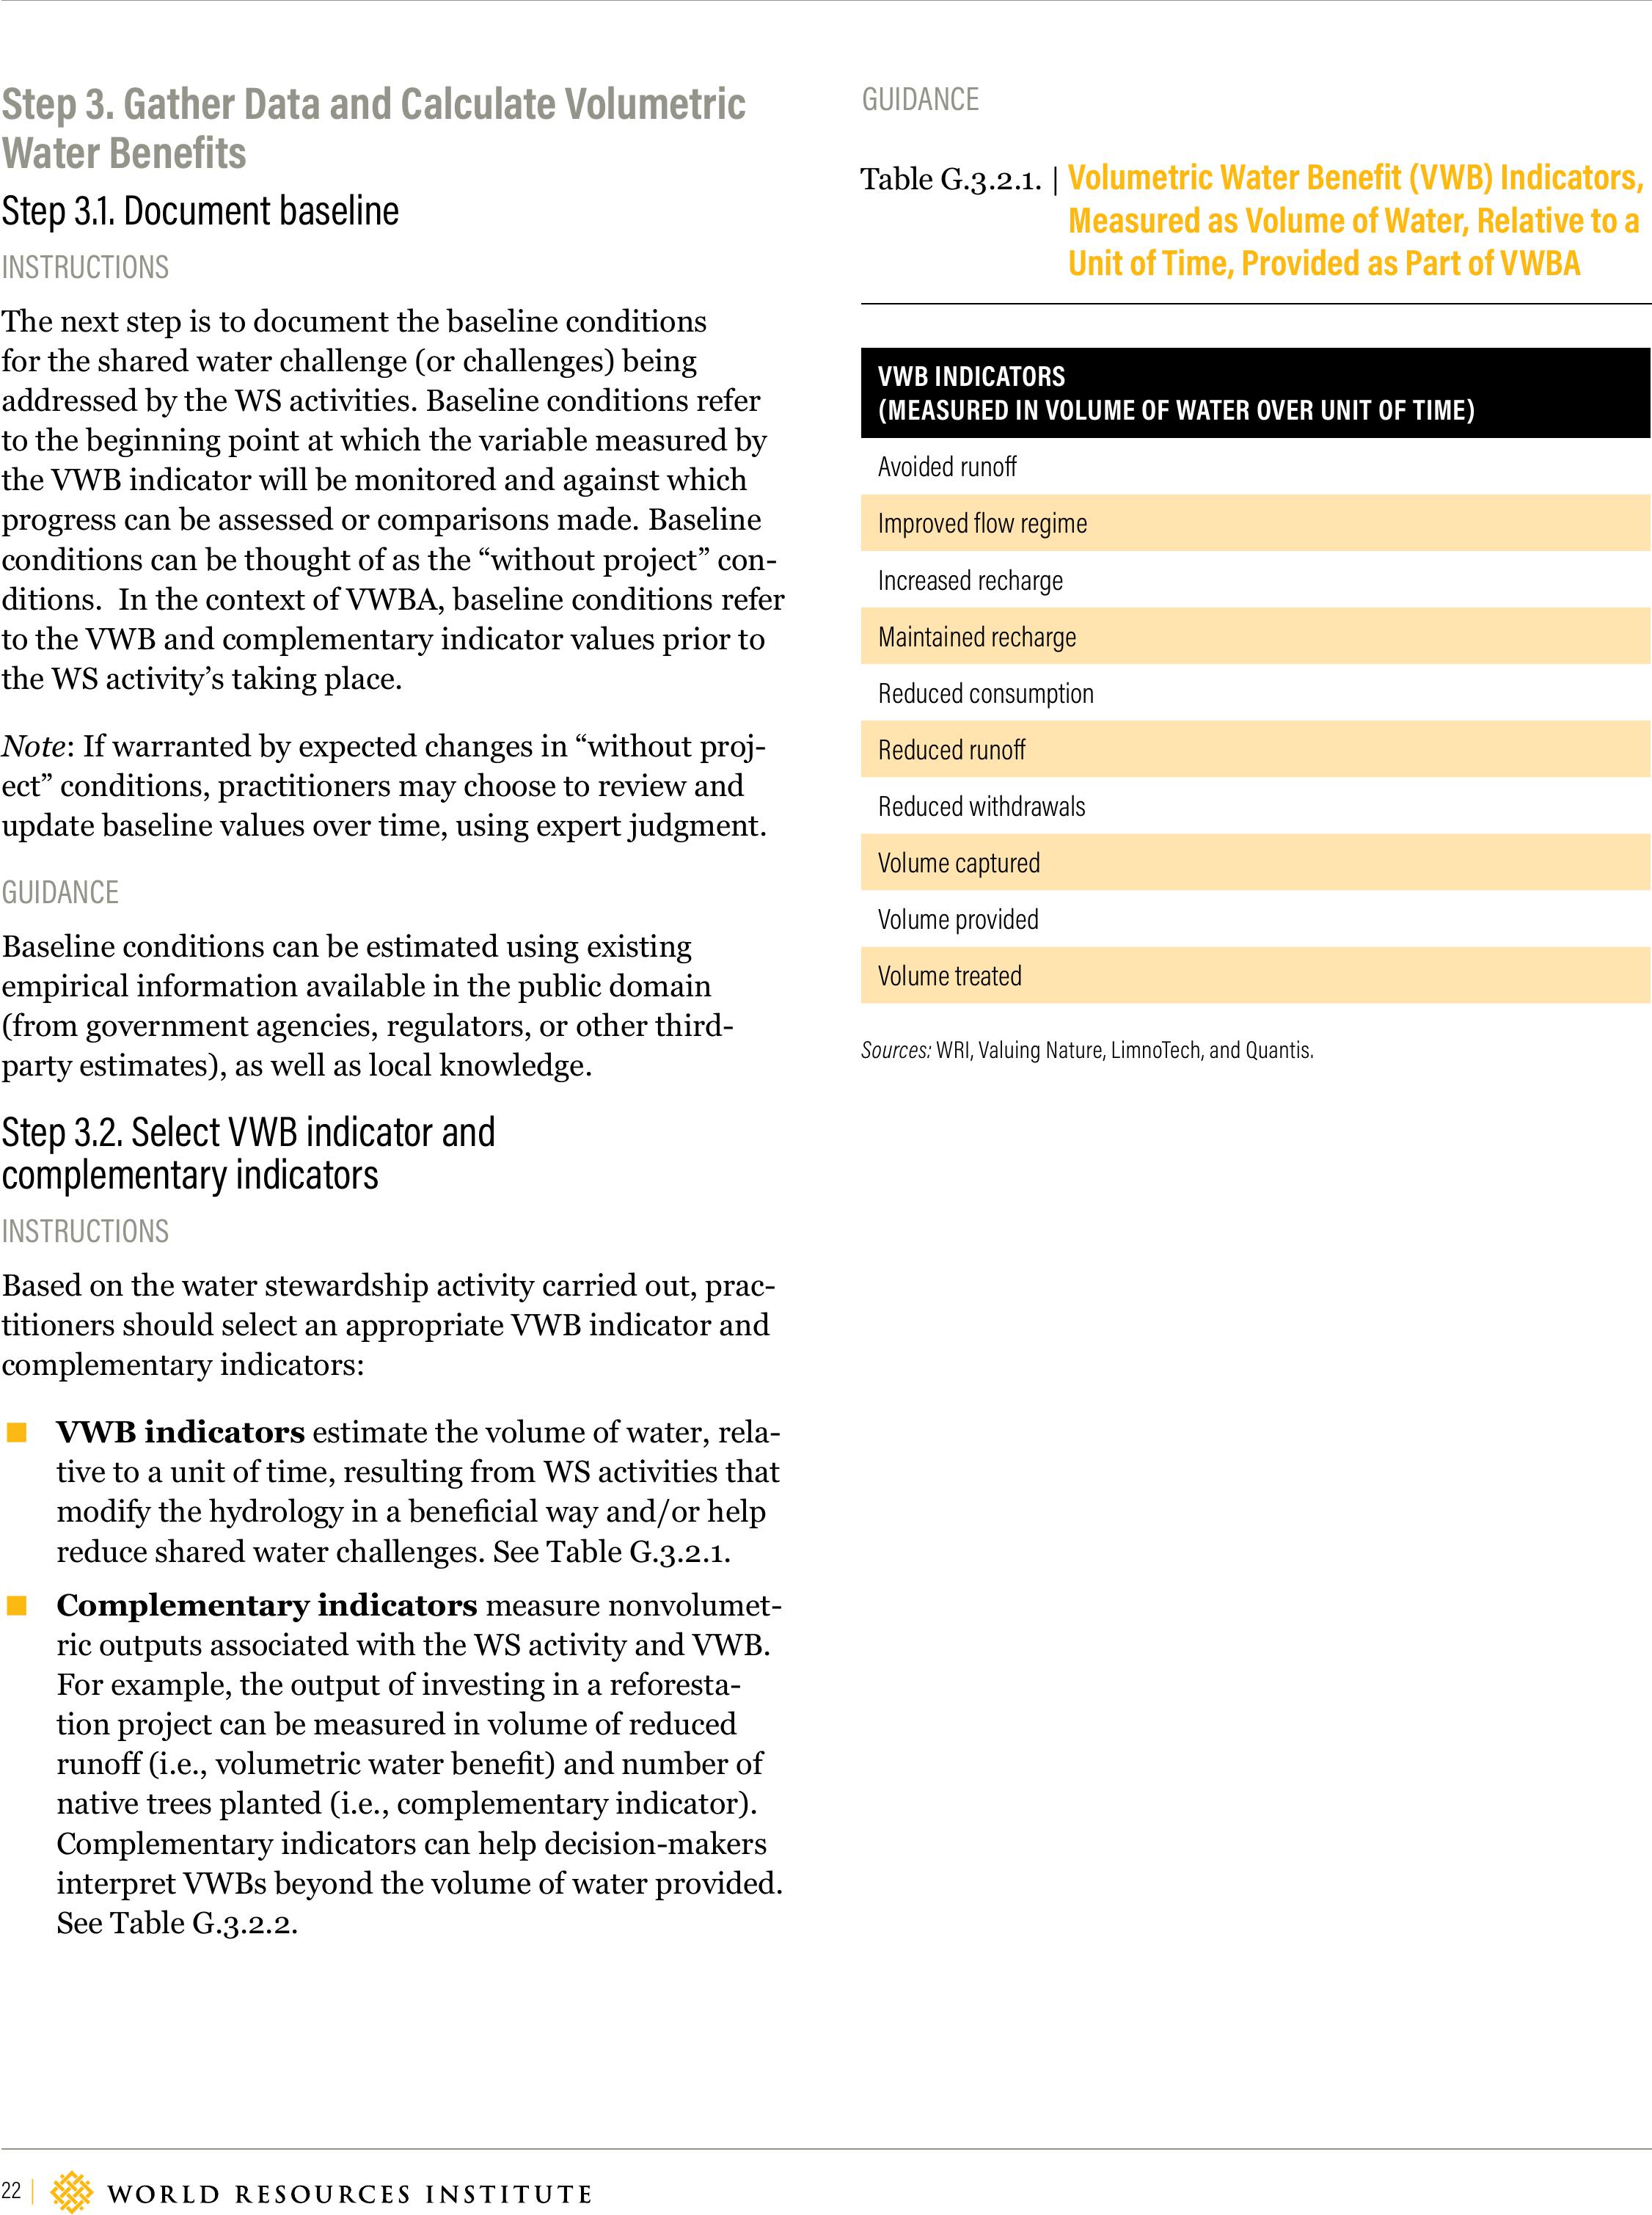
▪VWB indicators estimate the volume of water, rela-
tive to a unit of time, resulting from WS activities that
modify the hydrology in a benecial way and/or help
reduce shared water challenges. See Table G.3.2.1.
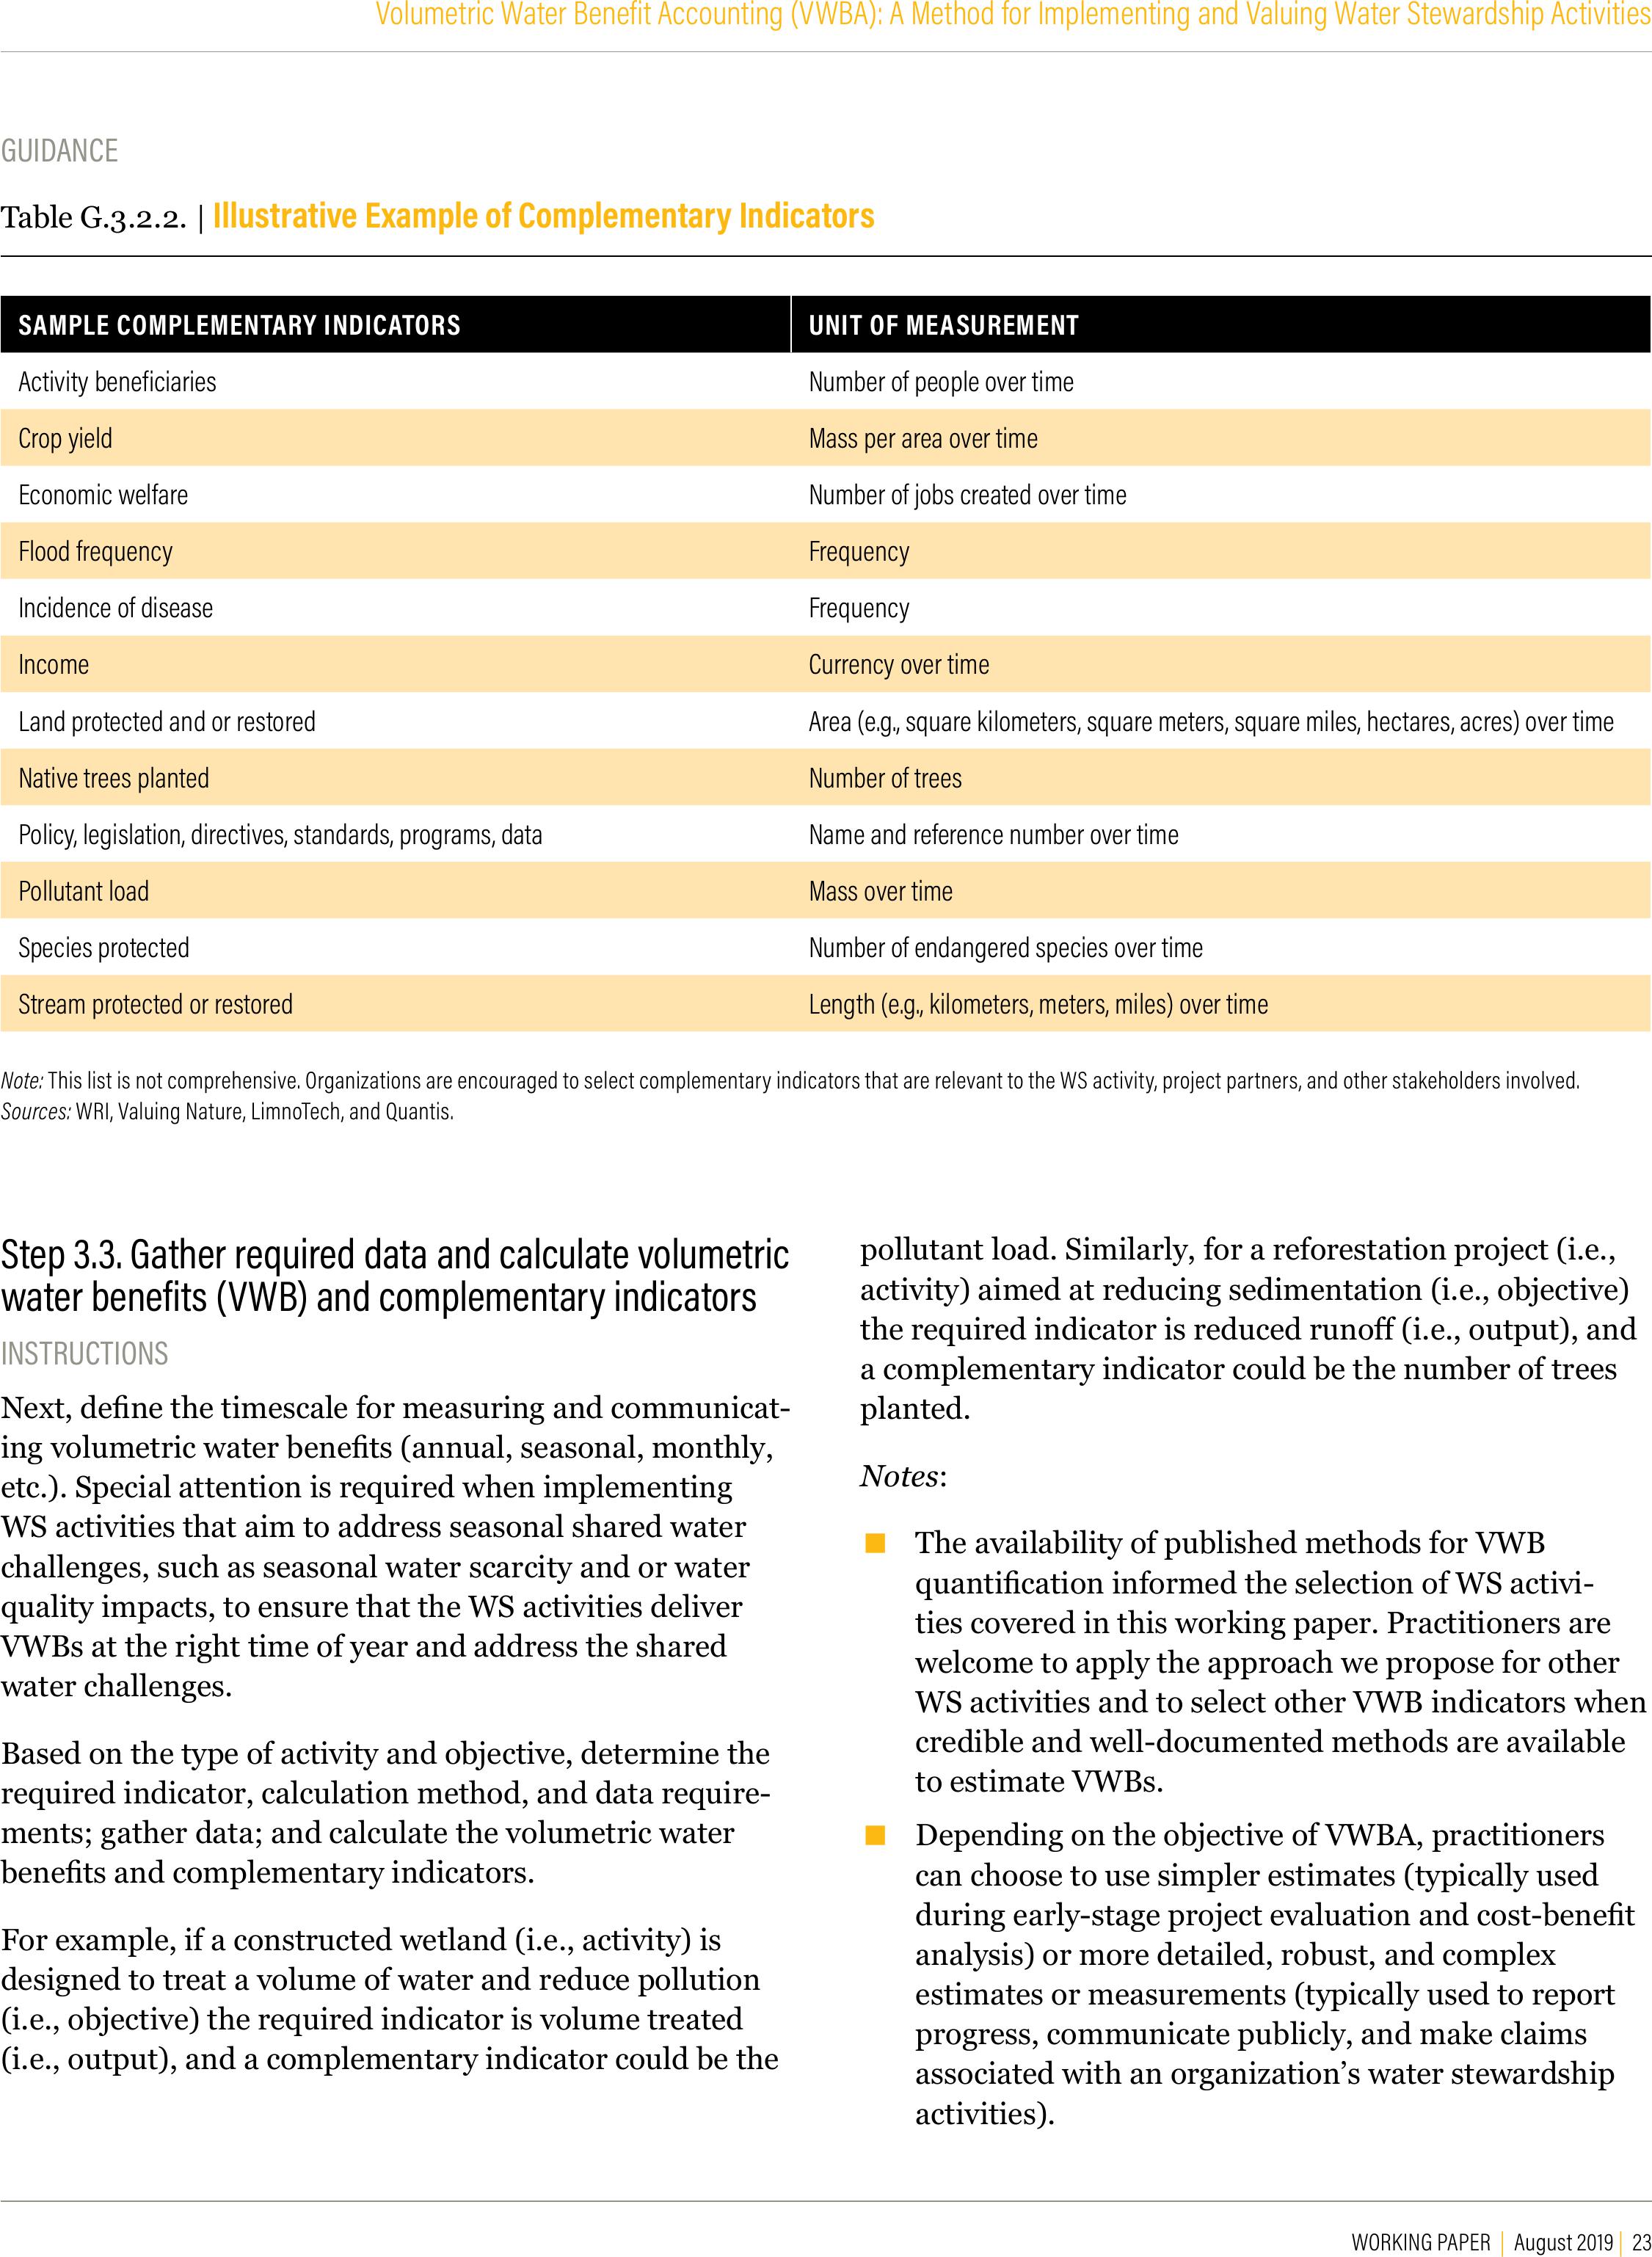
▪Complementary indicators measure nonvolumet-
ric outputs associated with the WS activity and VWB.
For example, the output of investing in a reforesta-
tion project can be measured in volume of reduced
runo (i.e., volumetric water benet) and number of
native trees planted (i.e., complementary indicator).
Complementary indicators can help decision-makers
interpret VWBs beyond the volume of water provided.
See Table G.3.2.2.
GUIDANCE
VWB INDICATORS
(MEASURED IN VOLUME OF WATER OVER UNIT OF TIME)
Avoided runo
Improved flow regime
Increased recharge
Maintained recharge
Reduced consumption
Reduced runo
Reduced withdrawals
Volume captured
Volume provided
Volume treated
Table G.3.2.1. |Volumetric Water Benefit (VWB) Indicators,
Measured as Volume of Water, Relative to a
Unit of Time, Provided as Part of VWBA
Sources:WRI, Valuing Nature, LimnoTech, and Quantis.
WORKING PAPER | August 2019 | 23
Volumetric Water Benefit Accounting (VWBA): A Method for Implementing and Valuing Water Stewardship Activities
Table G.3.2.2. |Illustrative Example of Complementary Indicators
SAMPLE COMPLEMENTARY INDICATORSUNIT OF MEASUREMENT
Activity beneficiaries Number of people over time
Crop yieldMass per area over time
Economic welfare Number of jobs created over time
Flood frequency Frequency
Incidence of disease Frequency
IncomeCurrency over time
Land protected and or restored Area (e.g., square kilometers, square meters, square miles, hectares, acres) over time
Native trees plantedNumber of trees
Policy, legislation, directives, standards, programs, dataName and reference number over time
Pollutant loadMass over time
Species protectedNumber of endangered species over time
Stream protected or restoredLength (e.g., kilometers, meters, miles) over time
Note: This list is not comprehensive. Organizations are encouraged to select complementary indicators that are relevant to the WS activity, project partners, and other stakeholders involved.
Sources:WRI, Valuing Nature, LimnoTech, and Quantis.
Step 3.3. Gather required data and calculate volumetric
water benefits (VWB) and complementary indicators
INSTRUCTIONS
Next, dene the timescale for measuring and communicat-
ing volumetric water benets (annual, seasonal, monthly,
etc.). Special attention is required when implementing
WS activities that aim to address seasonal shared water
challenges, such as seasonal water scarcity and or water
quality impacts, to ensure that the WS activities deliver
VWBs at the right time of year and address the shared
water challenges.
Based on the type of activity and objective, determine the
required indicator, calculation method, and data require-
ments; gather data; and calculate the volumetric water
benets and complementary indicators.
For example, if a constructed wetland (i.e., activity) is
designed to treat a volume of water and reduce pollution
(i.e., objective) the required indicator is volume treated
(i.e., output), and a complementary indicator could be the
pollutant load. Similarly, for a reforestation project (i.e.,
activity) aimed at reducing sedimentation (i.e., objective)
the required indicator is reduced runo (i.e., output), and
a complementary indicator could be the number of trees
planted.
Notes:
▪The availability of published methods for VWB
quantication informed the selection of WS activi-
ties covered in this working paper. Practitioners are
welcome to apply the approach we propose for other
WS activities and to select other VWB indicators when
credible and well-documented methods are available
to estimate VWBs.
▪Depending on the objective of VWBA, practitioners
can choose to use simpler estimates (typically used
during early-stage project evaluation and cost-benet
analysis) or more detailed, robust, and complex
estimates or measurements (typically used to report
progress, communicate publicly, and make claims
associated with an organization’s water stewardship
activities).
GUIDANCE

24 |
Method selection was informed by the need for VWBA to
be practical and informed by published literature, prac-
titioner experience, and best practice. Thus, the list of
calculation methods we propose (see Table G.3.3.1) is not
exhaustive, and other simpler or more complex methods
may exist. In any case, the method selected should be
documented and clearly communicated when sharing
results and/or making claims.
Table G.3.3.1. |Recommended VWB Indicator Calculation Methods for the Most Commonly Implemented WS Activities
Furthermore, and consistent with the need for a pragmatic
approach, the methods we reference allow decision-mak-
ers to estimate VWBs based on the project design char-
acteristics and do not require empirical measurements
or observations. Although not required, using empirical
measurements or observations would improve the accu-
racy of the methods proposed.
CATEGORY ACTIVITY VWB INDICATORCALCULATION METHODSAPPENDIX
Land conservation and
restoration
Land conservationAvoided runoCurve Number methodA-1
Land cover restorationReduced runo
Water supply
reliability
Agricultural water demand reduction measuresReduced withdrawal or
reduced consumption
Withdrawal method or
Consumption method
A-2
Operational eiciency measures
Reduced withdrawalWithdrawal method
Leak repair
Consumer use eiciency measures
Water reuse
New water supply for crop irrigationVolume providedVolume Provided methodA-3
Rainwater harvesting Increased rechargeCapture and Infiltration methodA-4
Water accessAccess to drinking water supply Volume providedVolume Provided methodA-3
Water quality
Agricultural best management practices (BMPs) related
to conservation tillage, laser leveling, cover cropsReduced runoCurve Number methodA-1
Stormwater managementVolume capturedRuno Reduction methodA-5
Constructed wetland treatment systemsVolume treatedVolume Treated methodA-6
Wastewater treatment plants
Aquatic habitat
restoration
Wetland protectionMaintained rechargeRecharge methodA-7
Wetland restoration and creationIncreased recharge
Legal transactions to keep water in-streamReduced withdrawalWithdrawal methodA-2
In-stream barrier removalImproved flow regimeHydrograph methodA-8
Dam reoperation
Floodplain inundation / reestablish hydrologic
connection Varies based on objectivesSee Appendix A-7A-7
Water governanceDirect engagement in water governance and public
water management Same as the water stewardship activities they supportA-9
Catalytic activitiesActivities that pave the way for longer-term water
stewardship outcomesSame as the water stewardship activities they supportA-10
Sources:WRI, Valuing Nature, LimnoTech, and Quantis.
WORKING PAPER | August 2019 | 25
Volumetric Water Benefit Accounting (VWBA): A Method for Implementing and Valuing Water Stewardship Activities
Step 3.4. Allocate volumetric water benefits (VWB) and
complementary indicators
INSTRUCTIONS:
When required, allocate volumetric water benets, based
on the total volumetric water benet achieved for a given
time and the approach to allocation agreed upon with all
activity partners in advance of implementing the project,
as outlined in Step 2.2.
COMMUNICATION AND AGGREGATION
Communication
It is important to note that, for some WS activities, such
as those that involve restoration, the desired end state and
calculated VWB may not be achieved for some time after
the implementation of the activity. Other WS activities
may have actual VWBs that vary annually due to varia-
tions in precipitation and other factors. Typically, the
methods report a long-term average VWB for these activi-
ties. It is important to document any assumptions when
reporting VWBs.
By using the VWBA method described in this working
paper, organizations can communicate and make claims
for volumetric water benets achieved in the following
ways:
▪By providing information on the shared water chal-
lenge addressed and how it was identied.
▪By providing information on which elements of eec-
tive water stewardship activities are met, in particular
□the targeted recipient of the estimated VWB gen-
erated;
□the desired social, economic, and environmental
benets the VWBs will contribute to;
□the baseline year and timeline during which the
activity will yield VWBs; and
□the resourcing plan to ensure that monitoring and
maintenance costs are provided for the desired
activity duration.
▪By sharing the total volumetric water benet and
relevant complementary indicators, per unit of time,
as well as the volumetric water benet and relevant
complementary indicators allocated to the organiza-
tion, per unit of time, and details on the approach to
determining allocation, in addition to the list of activ-
ity partners involved.
▪By measuring and communicating VWBs of all WS ac-
tivities the organization has invested in, not just those
yielding outputs desired by the company.
▪By using independent, third-party quantication of
volumetric water benets being claimed, per unit of
time.
▪By using the AWS Water Stewardship Standard 2.0
guidance for Step 5: Communicate and Disclose.
▪By clearly stating the communicating period (year,
month, etc.) and baseline year.
Aggregation
For organizations interested in using VWBA to track
and communicate progress toward meeting enterprise
goals and/or targets, such as replenish, water balance, or
contextual water goals, we recommend aggregating VWBs
across WS activities measured with the same VWB indica-
tors, within the same catchment, and clearly stating the
geographic origin of the VWB provided.
This is critical for two reasons: rst, to link the VWBs
being claimed to the local context where they were gener-
ated, and, second, so as not to aggregate VWBs that are
measuring opposite modications in the local hydrology
(e.g., runo reduced and volume provided).
While we do not recommend this, each organization can
decide whether additional aggregation across geographies
and WS activities measured with dierent VWB indica-
tors is warranted. If the organization decides that this
is justied, it can aggregate across activity types across
the enterprise, geographies, business units, and/or value
chain, clearly communicating the limitations of such an
aggregation of VWB values.
26 |
DISCUSSION
The VWBA method we propose has been developed
through extensive stakeholder engagement to help orga-
nizations account for volumetric water benets of water
stewardship activities they have supported and invested
in, while advancing public policy objectives and engaging
in collective action. Special emphasis has been placed on
providing volumetric water benet indicators with consis-
tent units of measurement and methodological guidance
to help make VWBA accessible to decision-makers and
applicable across value chains. These methods are not
overly complex but rather represent pragmatic approaches
that can be applied using readily available information
with a reasonable level of investment.
We made trade-os to ensure accessibility by limiting
VWBA to measuring volumetric water benets and not the
associated social, economic, or environmental benets.
This is particularly challenging in the context of sustain-
able water management, where solving shared water
challenges requires that improvements in hydrology be
maintained over time. Therefore, unless additional assur-
ance is provided, delivering volumetric water benets does
not guarantee that the activity will deliver the associated
social, economic, and environmental benets.
Moving forward, there are opportunities to improve
volumetric water benet accounting, rst by developing
methods to account for the volumetric water benets of
activities currently not included and, second, by building a
web-based tool to facilitate large-scale adoption of VWBA.
Additionally, the methods and approaches we propose can
be enhanced through experience gained by (a) piloting the
application of the VWBA method discussed in this work-
ing paper; (b) investing in monitoring, data collection,
and analysis that will strengthen hydrological models
and validate assumptions; and (c) developing additional
guidance to facilitate the conversion of water stewardship
activity outputs into measures of social, economic, and
environmental outcomes and impacts.
APPENDIX A: CALCULATION METHODS AND
ILLUSTRATIVE EXAMPLES
Appendices A-1–10 describe frameworks and calculation methods avail-
able to guide the calculation of VWBs for the most commonly implemented
project activities. While the methods described do not demand significant
resources or extensive data, some technical expertise is required for applica-
tion. These appendices are not designed to provide a detailed and prescrip-
tive “how to” manual for quantifying VWBs; rather, practitioners should view
this information as general guidance to inform the quantification process.
Some considerations should be kept in mind when selecting and applying a
calculation method:
▪Where relevant, it is preferable to use monitored or measured volumes,
with the goal of reporting results for average annual conditions. We
propose calculation methods for estimating VWBs where monitoring is
not possible.
▪The calculation methods were selected because they represent prag-
matic approaches that can be applied with a reasonable investment.
However, more complex approaches such as detailed modeling analyses
should be considered if available. For example, Appendix A-1 describes the
Curve Number method for calculating change in runo, but an appropri-
ate catchment model, if available, may support a more robust analysis.
▪In cases where multiple methods are relevant, the primary objective of
the project should be considered when selecting an applicable calcula-
tion method. For example, Appendix A-7 describes the recharge method
for wetland restoration and protection activities. However, if the primary
objective of a wetland restoration project is to expand the surface water
volume to provide improved aquatic habitat, then a dierent calculation
method may be more appropriate, as discussed in Appendix A-7.
▪Each project is unique, and it is not possible to capture the complexity
of site-specific conditions in short method descriptions. Users should
always consider project-specific characteristics when calculating VWBs.
For example, Appendix A-2 describes the withdrawal and consumption
method, which is applicable to projects involving fallowing of a field. Us-
ing site-specific information, the user should calculate the VWB based on
the duration of the fallowing (full year or partial year).
Illustrative examples are provided for some of the methods presented in
the appendices. Some are based on real case studies, some are not. The
purpose of the examples is not to provide prescriptive guidance on how the
methods should be applied but rather to oer insight into the application of
the methods described in this working paper. Thus examples illustrate the
calculation of VBA (Steps 3.1–3) and exclude information on Steps 1.1–2.2 and
3.4.
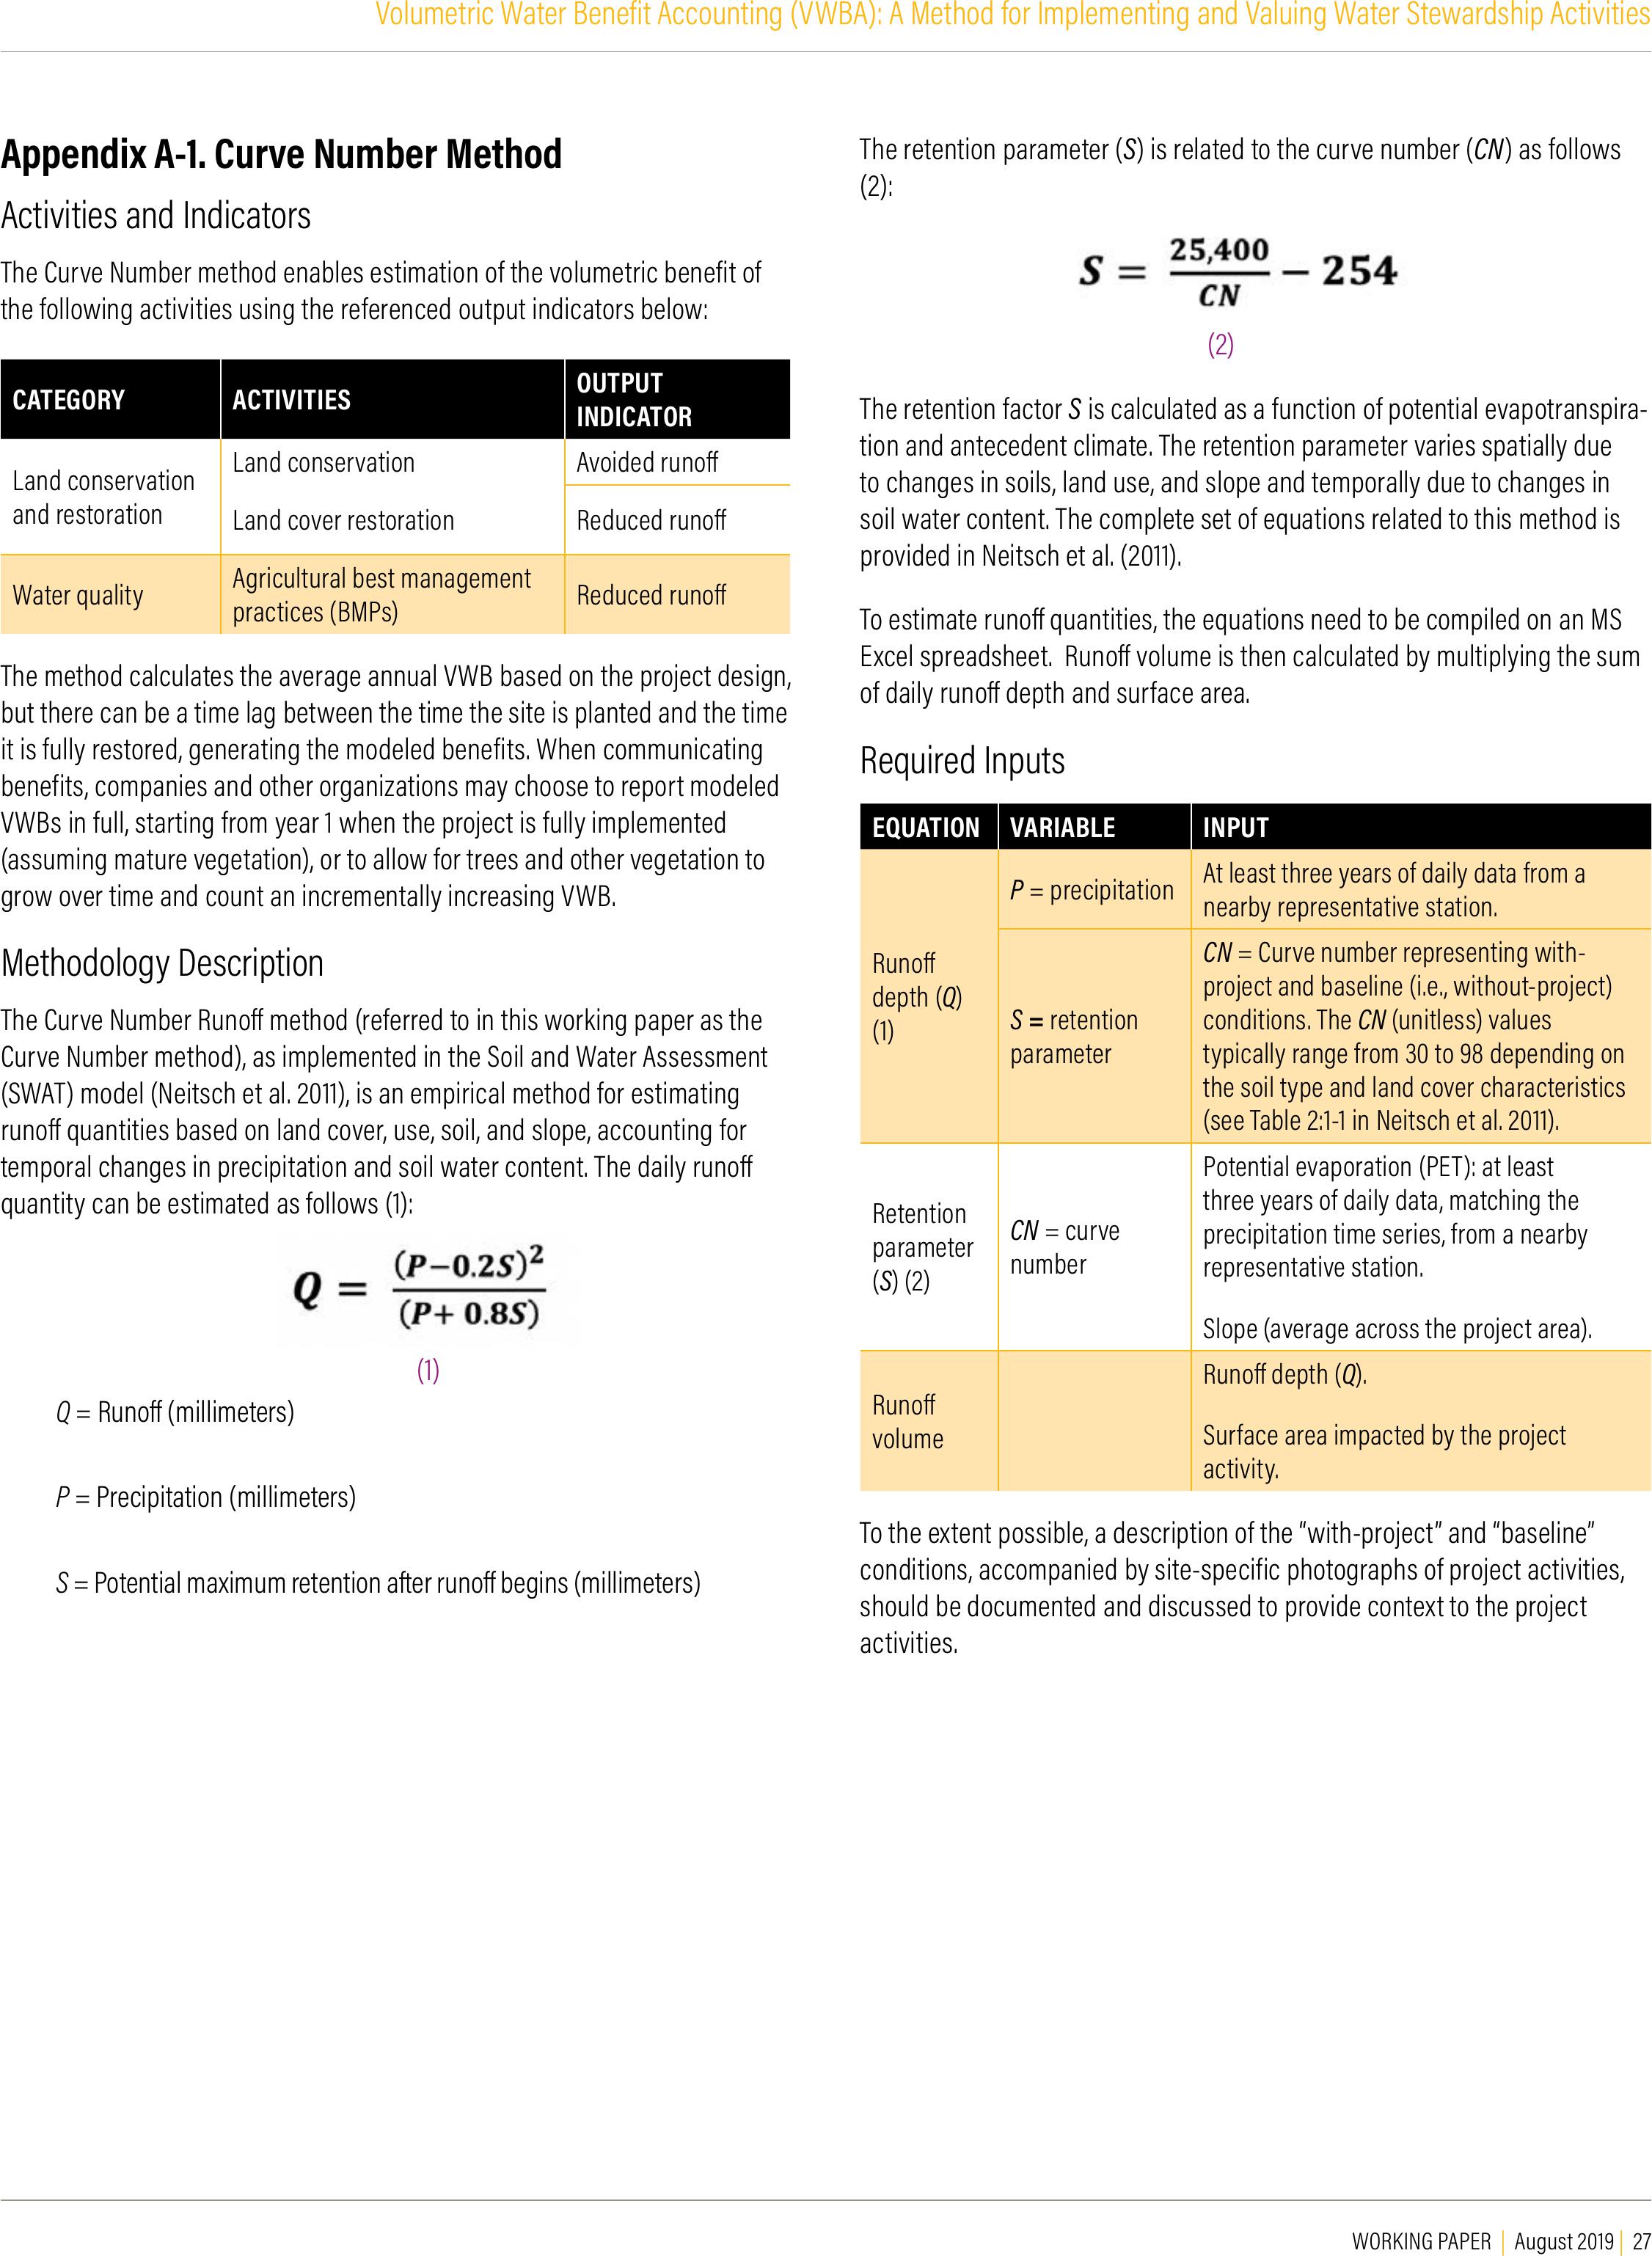
WORKING PAPER | August 2019 | 27
Volumetric Water Benefit Accounting (VWBA): A Method for Implementing and Valuing Water Stewardship Activities
Appendix A-1. Curve Number Method
Activities and Indicators
The Curve Number method enables estimation of the volumetric benefit of
the following activities using the referenced output indicators below:
CATEGORY ACTIVITIESOUTPUT
INDICATOR
Land conservation
and restoration
Land conservationAvoided runo
Land cover restorationReduced runo
Water qualityAgricultural best management
practices (BMPs)Reduced runo
The method calculates the average annual VWB based on the project design,
but there can be a time lag between the time the site is planted and the time
it is fully restored, generating the modeled benefits. When communicating
benefits, companies and other organizations may choose to report modeled
VWBs in full, starting from year 1 when the project is fully implemented
(assuming mature vegetation), or to allow for trees and other vegetation to
grow over time and count an incrementally increasing VWB.
Methodology Description
The Curve Number Runo method (referred to in this working paper as the
Curve Number method), as implemented in the Soil and Water Assessment
(SWAT) model (Neitsch et al. 2011), is an empirical method for estimating
runo quantities based on land cover, use, soil, and slope, accounting for
temporal changes in precipitation and soil water content. The daily runo
quantity can be estimated as follows (1):
Q = Runo (millimeters)
P = Precipitation (millimeters)
S = Potential maximum retention after runo begins (millimeters)
The retention parameter (S) is related to the curve number (CN) as follows
(2):
The retention factor S is calculated as a function of potential evapotranspira-
tion and antecedent climate. The retention parameter varies spatially due
to changes in soils, land use, and slope and temporally due to changes in
soil water content. The complete set of equations related to this method is
provided in Neitsch et al. (2011).
To estimate runo quantities, the equations need to be compiled on an MS
Excel spreadsheet. Runo volume is then calculated by multiplying the sum
of daily runo depth and surface area.
Required Inputs
EQUATION VARIABLE INPUT
Runo
depth (Q)
(1)
P = precipitationAt least three years of daily data from a
nearby representative station.
S = retention
parameter
CN = Curve number representing with-
project and baseline (i.e., without-project)
conditions. The CN (unitless) values
typically range from 30 to 98 depending on
the soil type and land cover characteristics
(see Table 2:1-1 in Neitsch et al. 2011).
Retention
parameter
(S) (2)
CN = curve
number
Potential evaporation (PET): at least
three years of daily data, matching the
precipitation time series, from a nearby
representative station.
Slope (average across the project area).
Runo
volume
Runo depth (Q).
Surface area impacted by the project
activity.
To the extent possible, a description of the “with-project” and “baseline”
conditions, accompanied by site-specific photographs of project activities,
should be documented and discussed to provide context to the project
activities.
(2)
(1)
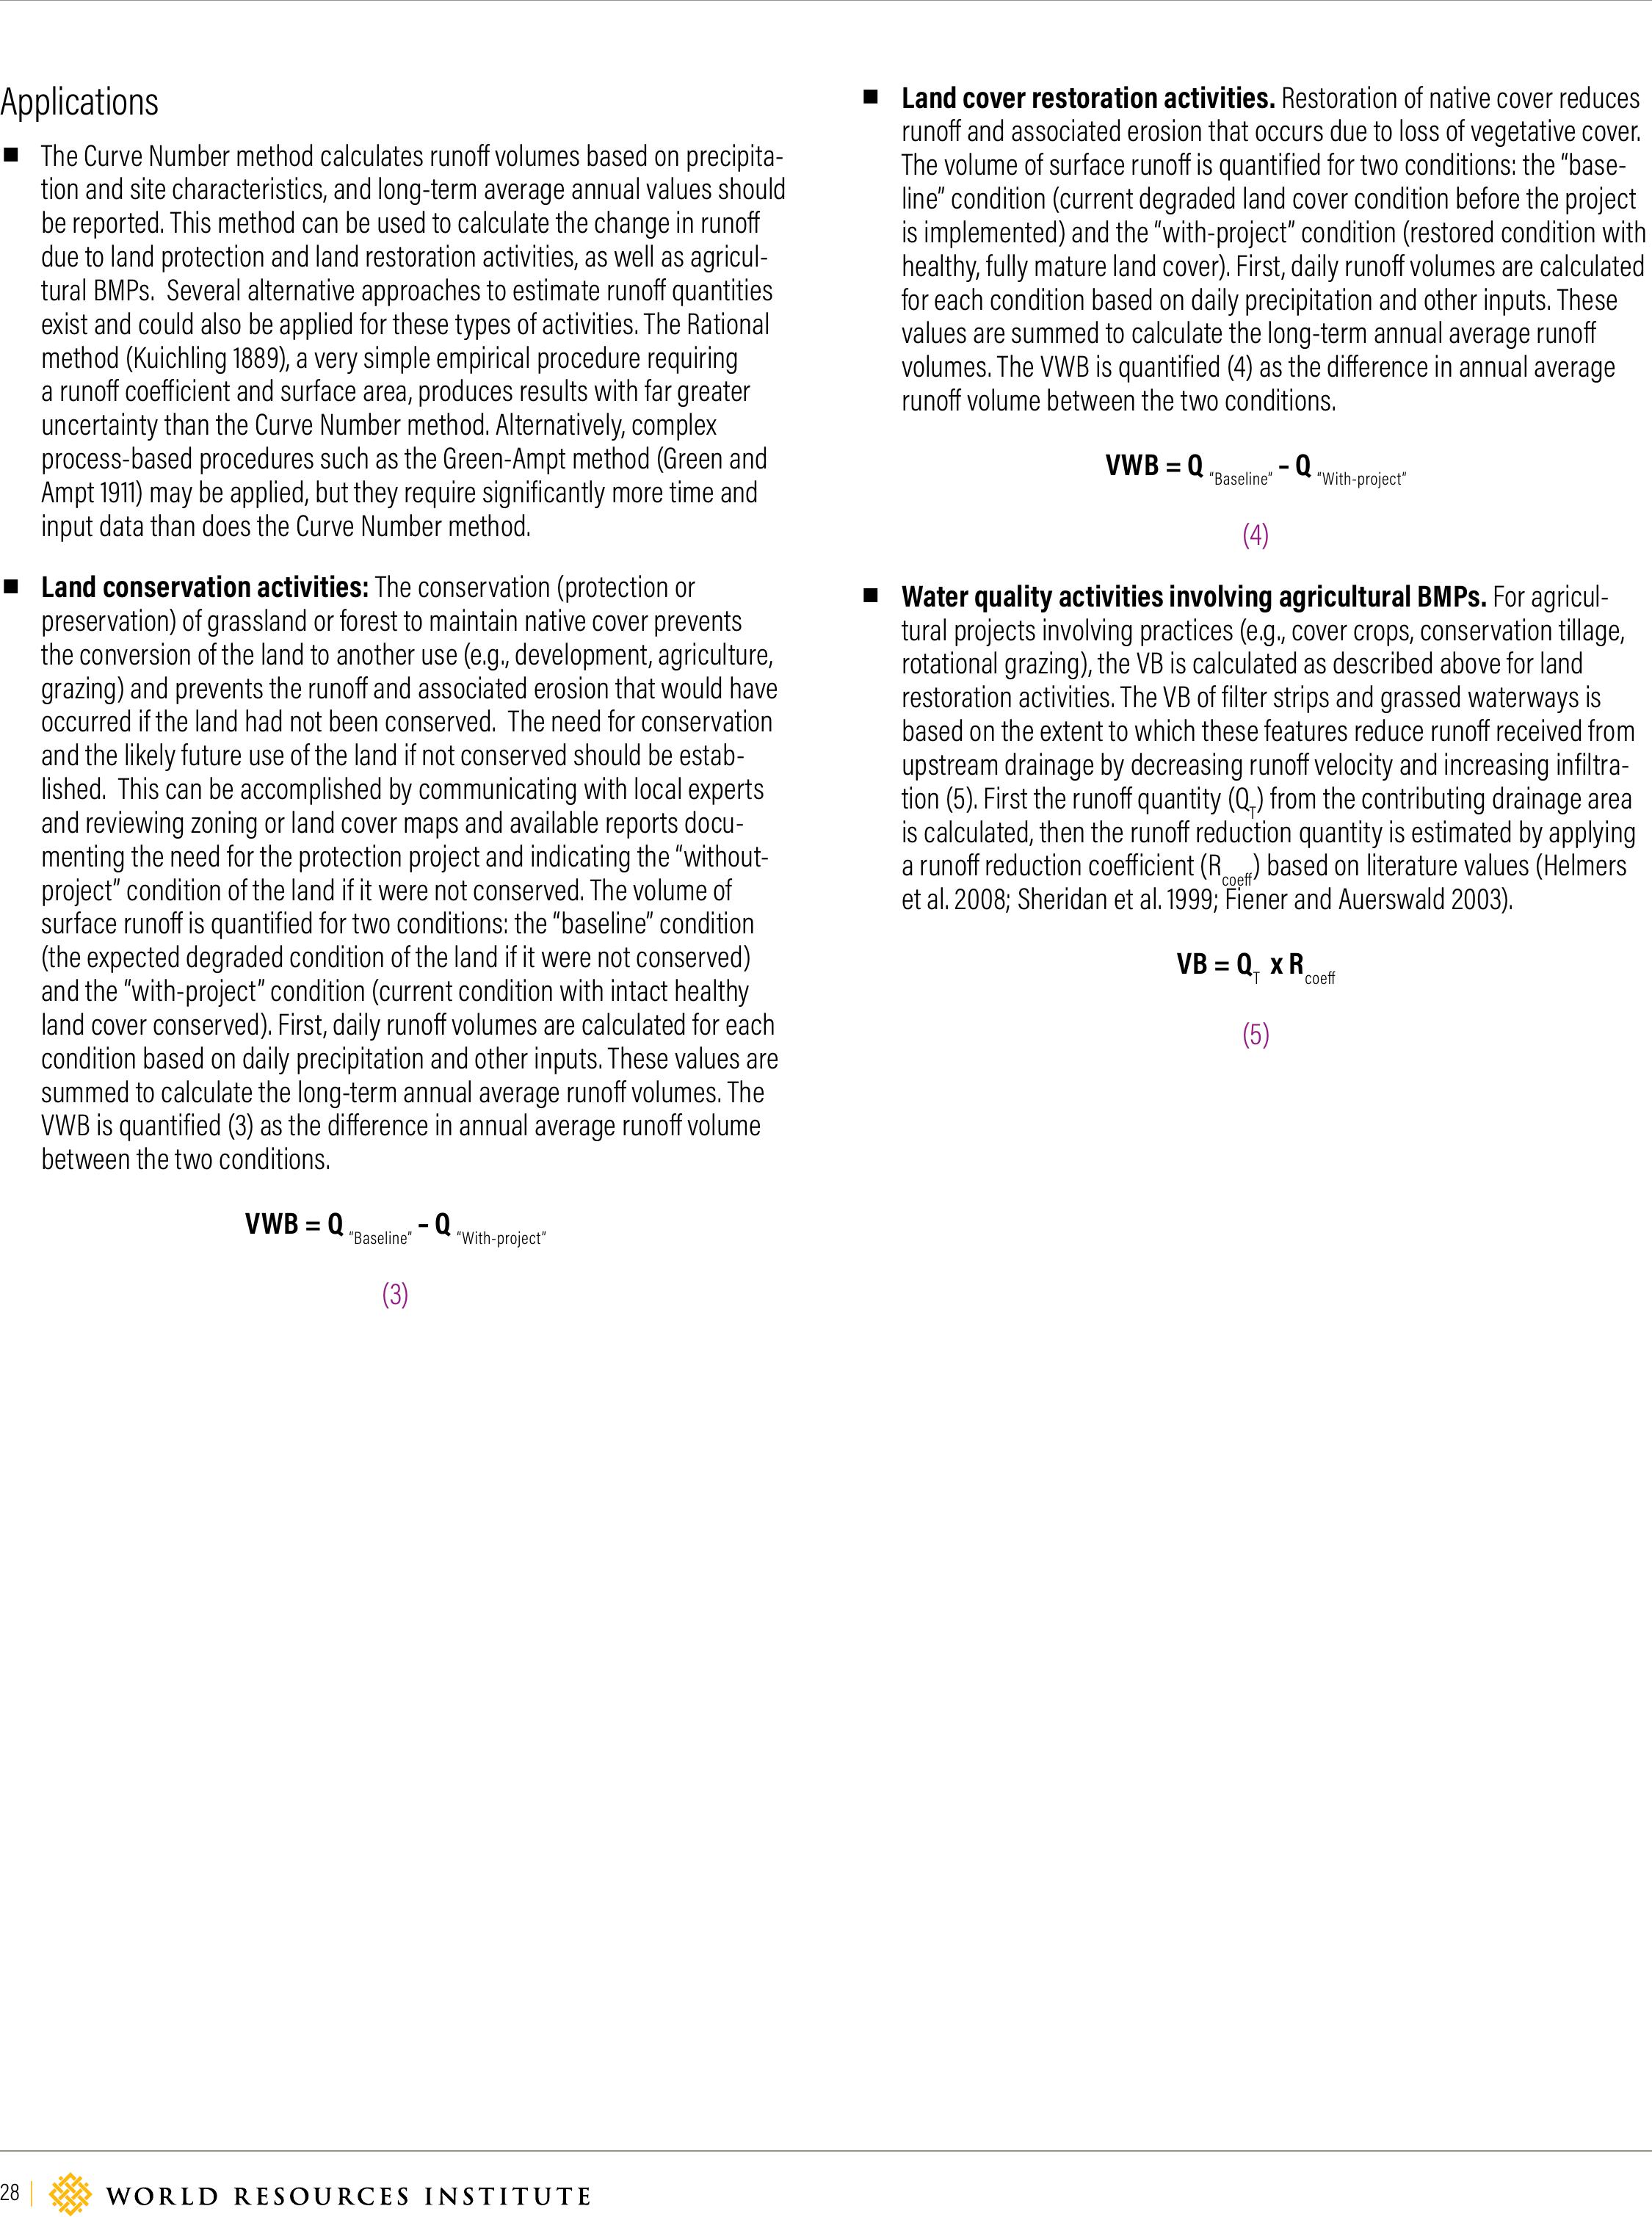
28 |
Applications
▪The Curve Number method calculates runo volumes based on precipita-
tion and site characteristics, and long-term average annual values should
be reported. This method can be used to calculate the change in runo
due to land protection and land restoration activities, as well as agricul-
tural BMPs. Several alternative approaches to estimate runo quantities
exist and could also be applied for these types of activities. The Rational
method (Kuichling 1889), a very simple empirical procedure requiring
a runo coeicient and surface area, produces results with far greater
uncertainty than the Curve Number method. Alternatively, complex
process-based procedures such as the Green-Ampt method (Green and
Ampt 1911) may be applied, but they require significantly more time and
input data than does the Curve Number method.
▪Land conservation activities: The conservation (protection or
preservation) of grassland or forest to maintain native cover prevents
the conversion of the land to another use (e.g., development, agriculture,
grazing) and prevents the runo and associated erosion that would have
occurred if the land had not been conserved. The need for conservation
and the likely future use of the land if not conserved should be estab-
lished. This can be accomplished by communicating with local experts
and reviewing zoning or land cover maps and available reports docu-
menting the need for the protection project and indicating the “without-
project” condition of the land if it were not conserved. The volume of
surface runo is quantified for two conditions: the “baseline” condition
(the expected degraded condition of the land if it were not conserved)
and the “with-project” condition (current condition with intact healthy
land cover conserved). First, daily runo volumes are calculated for each
condition based on daily precipitation and other inputs. These values are
summed to calculate the long-term annual average runo volumes. The
VWB is quantified (3) as the dierence in annual average runo volume
between the two conditions.
VWB = Q “Baseline” – Q “With-project”
(3)
▪Land cover restoration activities. Restoration of native cover reduces
runo and associated erosion that occurs due to loss of vegetative cover.
The volume of surface runo is quantified for two conditions: the “base-
line” condition (current degraded land cover condition before the project
is implemented) and the “with-project” condition (restored condition with
healthy, fully mature land cover). First, daily runo volumes are calculated
for each condition based on daily precipitation and other inputs. These
values are summed to calculate the long-term annual average runo
volumes. The VWB is quantified (4) as the dierence in annual average
runo volume between the two conditions.
VWB = Q “Baseline” – Q “With-project”
(4)
▪Water quality activities involving agricultural BMPs. For agricul-
tural projects involving practices (e.g., cover crops, conservation tillage,
rotational grazing), the VB is calculated as described above for land
restoration activities. The VB of filter strips and grassed waterways is
based on the extent to which these features reduce runo received from
upstream drainage by decreasing runo velocity and increasing infiltra-
tion (5). First the runo quantity (QT) from the contributing drainage area
is calculated, then the runo reduction quantity is estimated by applying
a runo reduction coeicient (Rcoe) based on literature values (Helmers
et al. 2008; Sheridan et al. 1999; Fiener and Auerswald 2003).
VB = QT x Rcoe
(5)
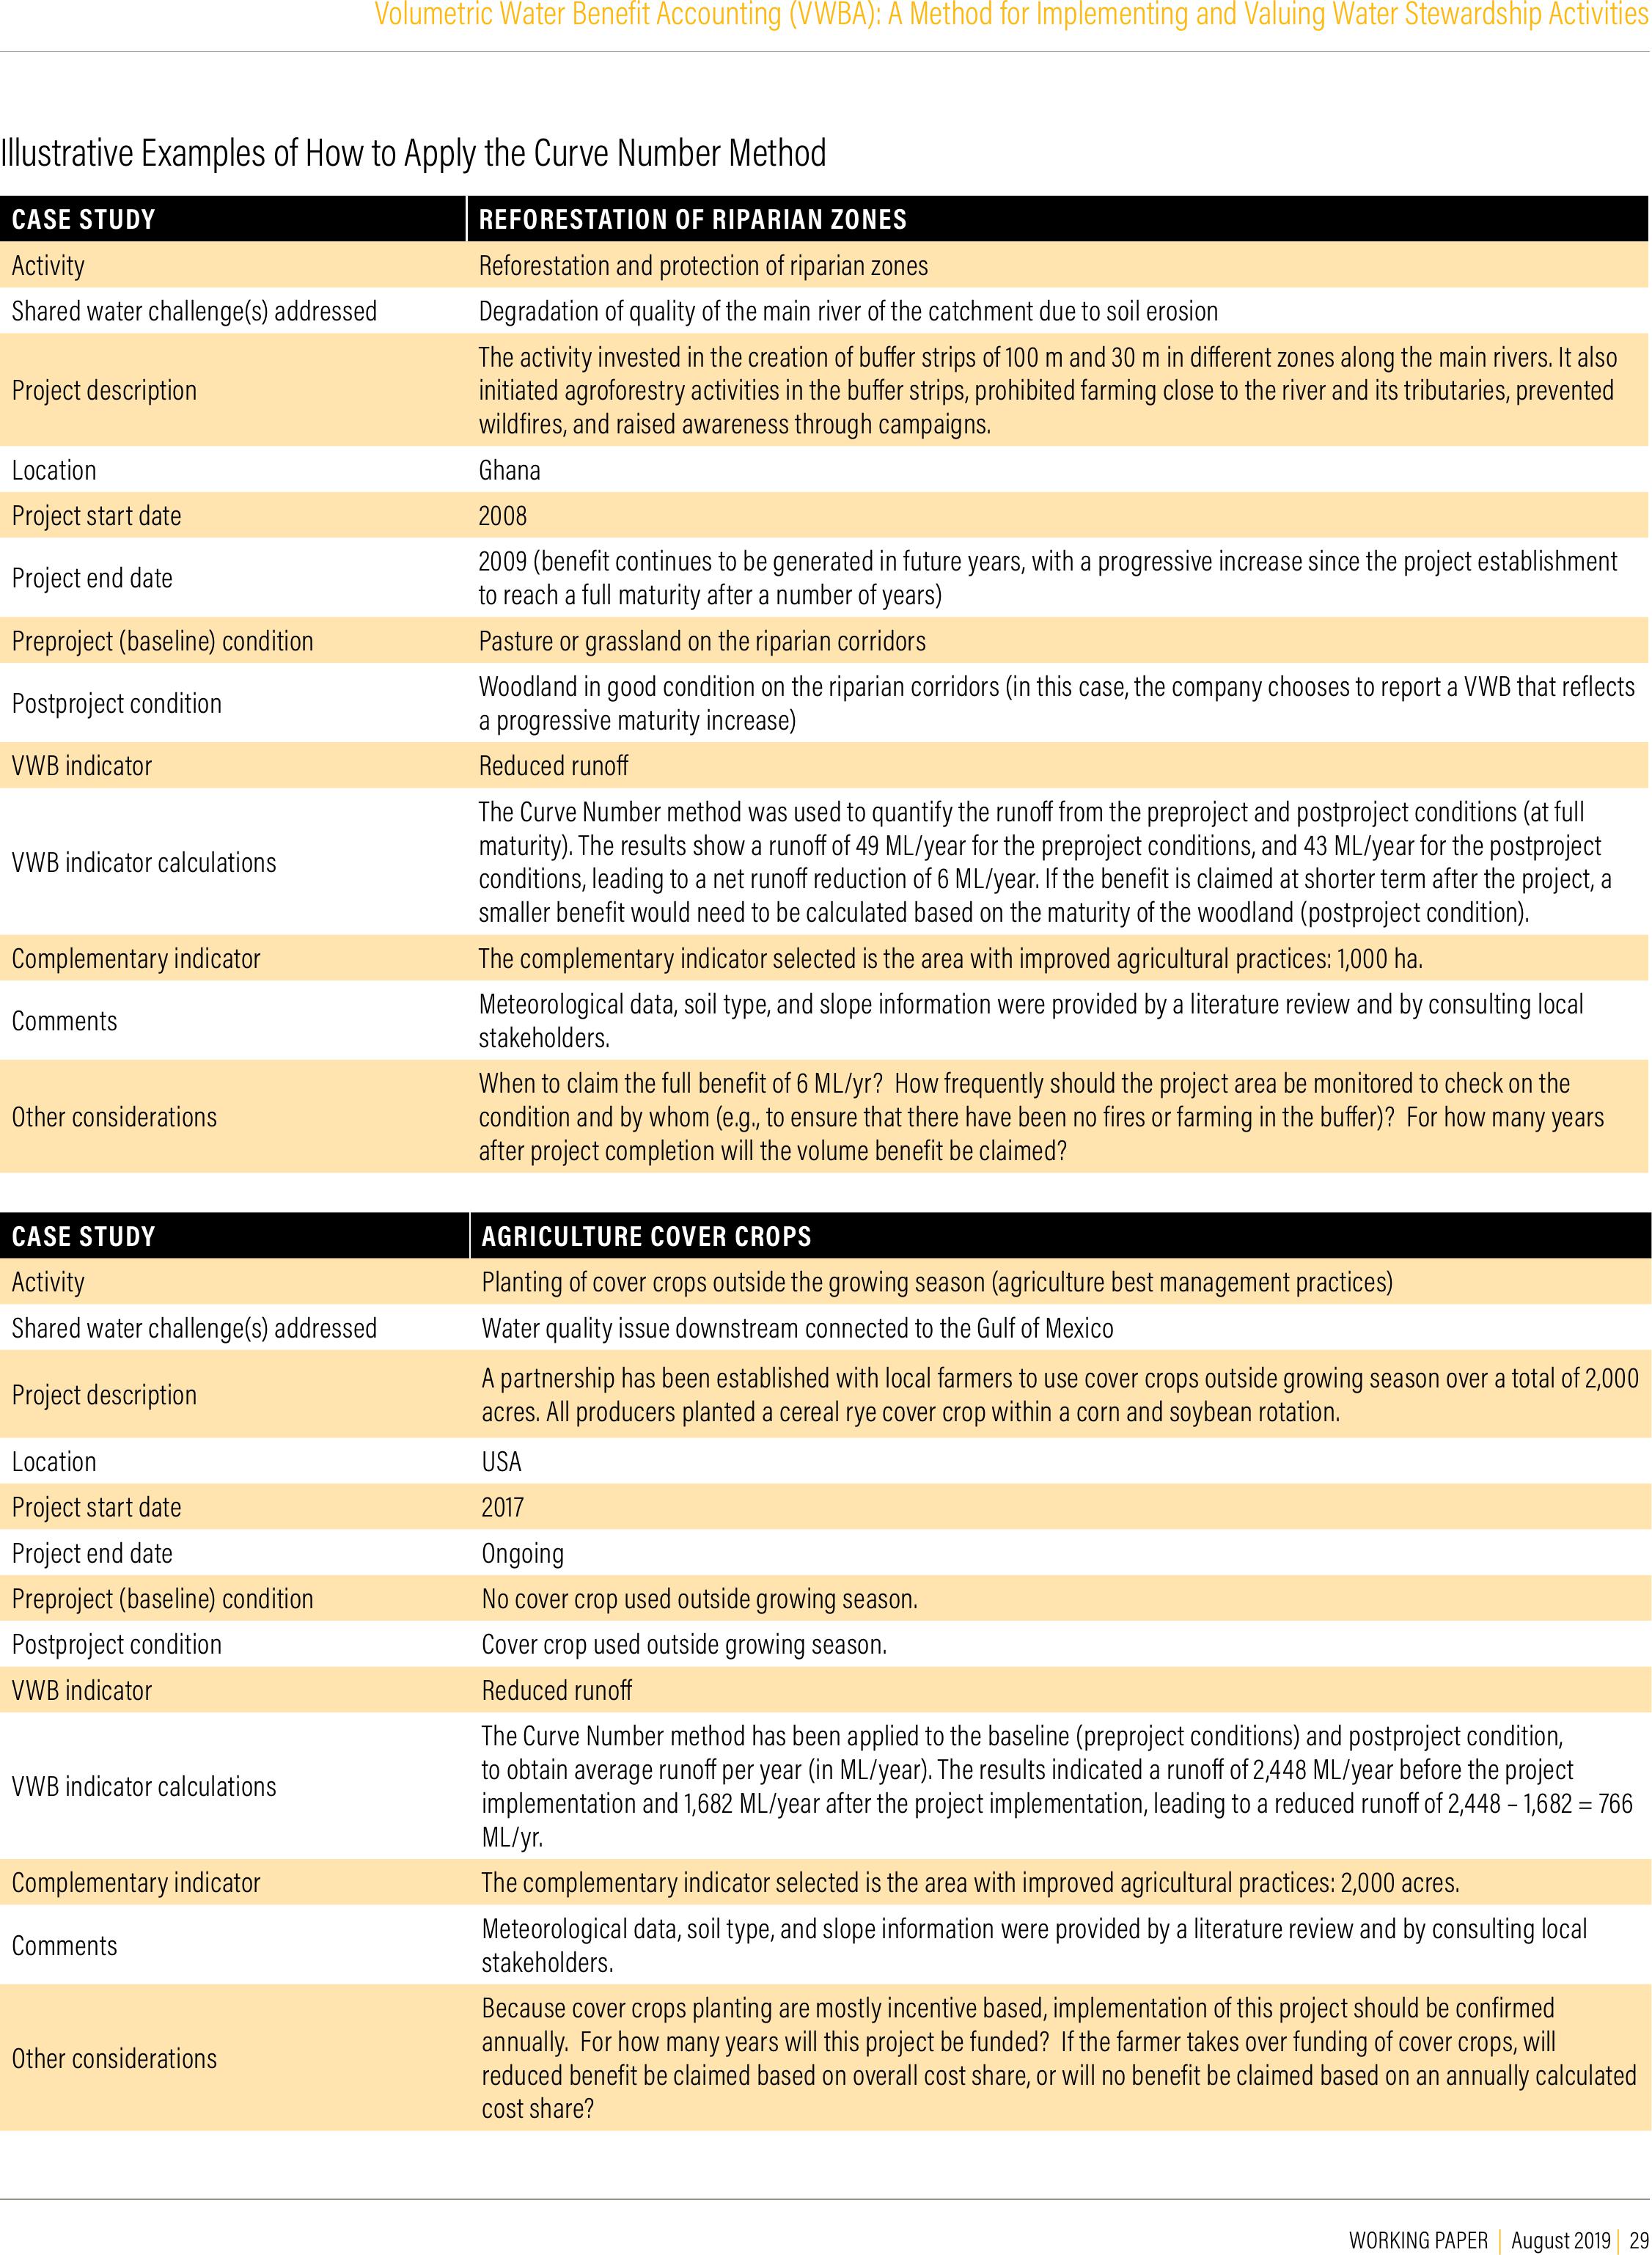
WORKING PAPER | August 2019 | 29
Volumetric Water Benefit Accounting (VWBA): A Method for Implementing and Valuing Water Stewardship Activities
Illustrative Examples of How to Apply the Curve Number Method
CASE STUDYREFORESTATION OF RIPARIAN ZONES
Activity Reforestation and protection of riparian zones
Shared water challenge(s) addressed Degradation of quality of the main river of the catchment due to soil erosion
Project description
The activity invested in the creation of buer strips of 100 m and 30 m in dierent zones along the main rivers. It also
initiated agroforestry activities in the buer strips, prohibited farming close to the river and its tributaries, prevented
wildfires, and raised awareness through campaigns.
Location Ghana
Project start date2008
Project end date2009 (benefit continues to be generated in future years, with a progressive increase since the project establishment
to reach a full maturity after a number of years)
Preproject (baseline) conditionPasture or grassland on the riparian corridors
Postproject conditionWoodland in good condition on the riparian corridors (in this case, the company chooses to report a VWB that reflects
a progressive maturity increase)
VWB indicatorReduced runo
VWB indicator calculations
The Curve Number method was used to quantify the runo from the preproject and postproject conditions (at full
maturity). The results show a runo of 49 ML/year for the preproject conditions, and 43 ML/year for the postproject
conditions, leading to a net runo reduction of 6 ML/year. If the benefit is claimed at shorter term after the project, a
smaller benefit would need to be calculated based on the maturity of the woodland (postproject condition).
Complementary indicatorThe complementary indicator selected is the area with improved agricultural practices: 1,000 ha.
Comments Meteorological data, soil type, and slope information were provided by a literature review and by consulting local
stakeholders.
Other considerations
When to claim the full benefit of 6 ML/yr? How frequently should the project area be monitored to check on the
condition and by whom (e.g., to ensure that there have been no fires or farming in the buer)? For how many years
after project completion will the volume benefit be claimed?
CASE STUDYAGRICULTURE COVER CROPS
Activity Planting of cover crops outside the growing season (agriculture best management practices)
Shared water challenge(s) addressed Water quality issue downstream connected to the Gulf of Mexico
Project descriptionA partnership has been established with local farmers to use cover crops outside growing season over a total of 2,000
acres. All producers planted a cereal rye cover crop within a corn and soybean rotation.
Location USA
Project start date2017
Project end dateOngoing
Preproject (baseline) conditionNo cover crop used outside growing season.
Postproject conditionCover crop used outside growing season.
VWB indicatorReduced runo
VWB indicator calculations
The Curve Number method has been applied to the baseline (preproject conditions) and postproject condition,
to obtain average runo per year (in ML/year). The results indicated a runo of 2,448 ML/year before the project
implementation and 1,682 ML/year after the project implementation, leading to a reduced runo of 2,448 – 1,682 = 766
ML/yr.
Complementary indicatorThe complementary indicator selected is the area with improved agricultural practices: 2,000 acres.
Comments Meteorological data, soil type, and slope information were provided by a literature review and by consulting local
stakeholders.
Other considerations
Because cover crops planting are mostly incentive based, implementation of this project should be confirmed
annually. For how many years will this project be funded? If the farmer takes over funding of cover crops, will
reduced benefit be claimed based on overall cost share, or will no benefit be claimed based on an annually calculated
cost share?
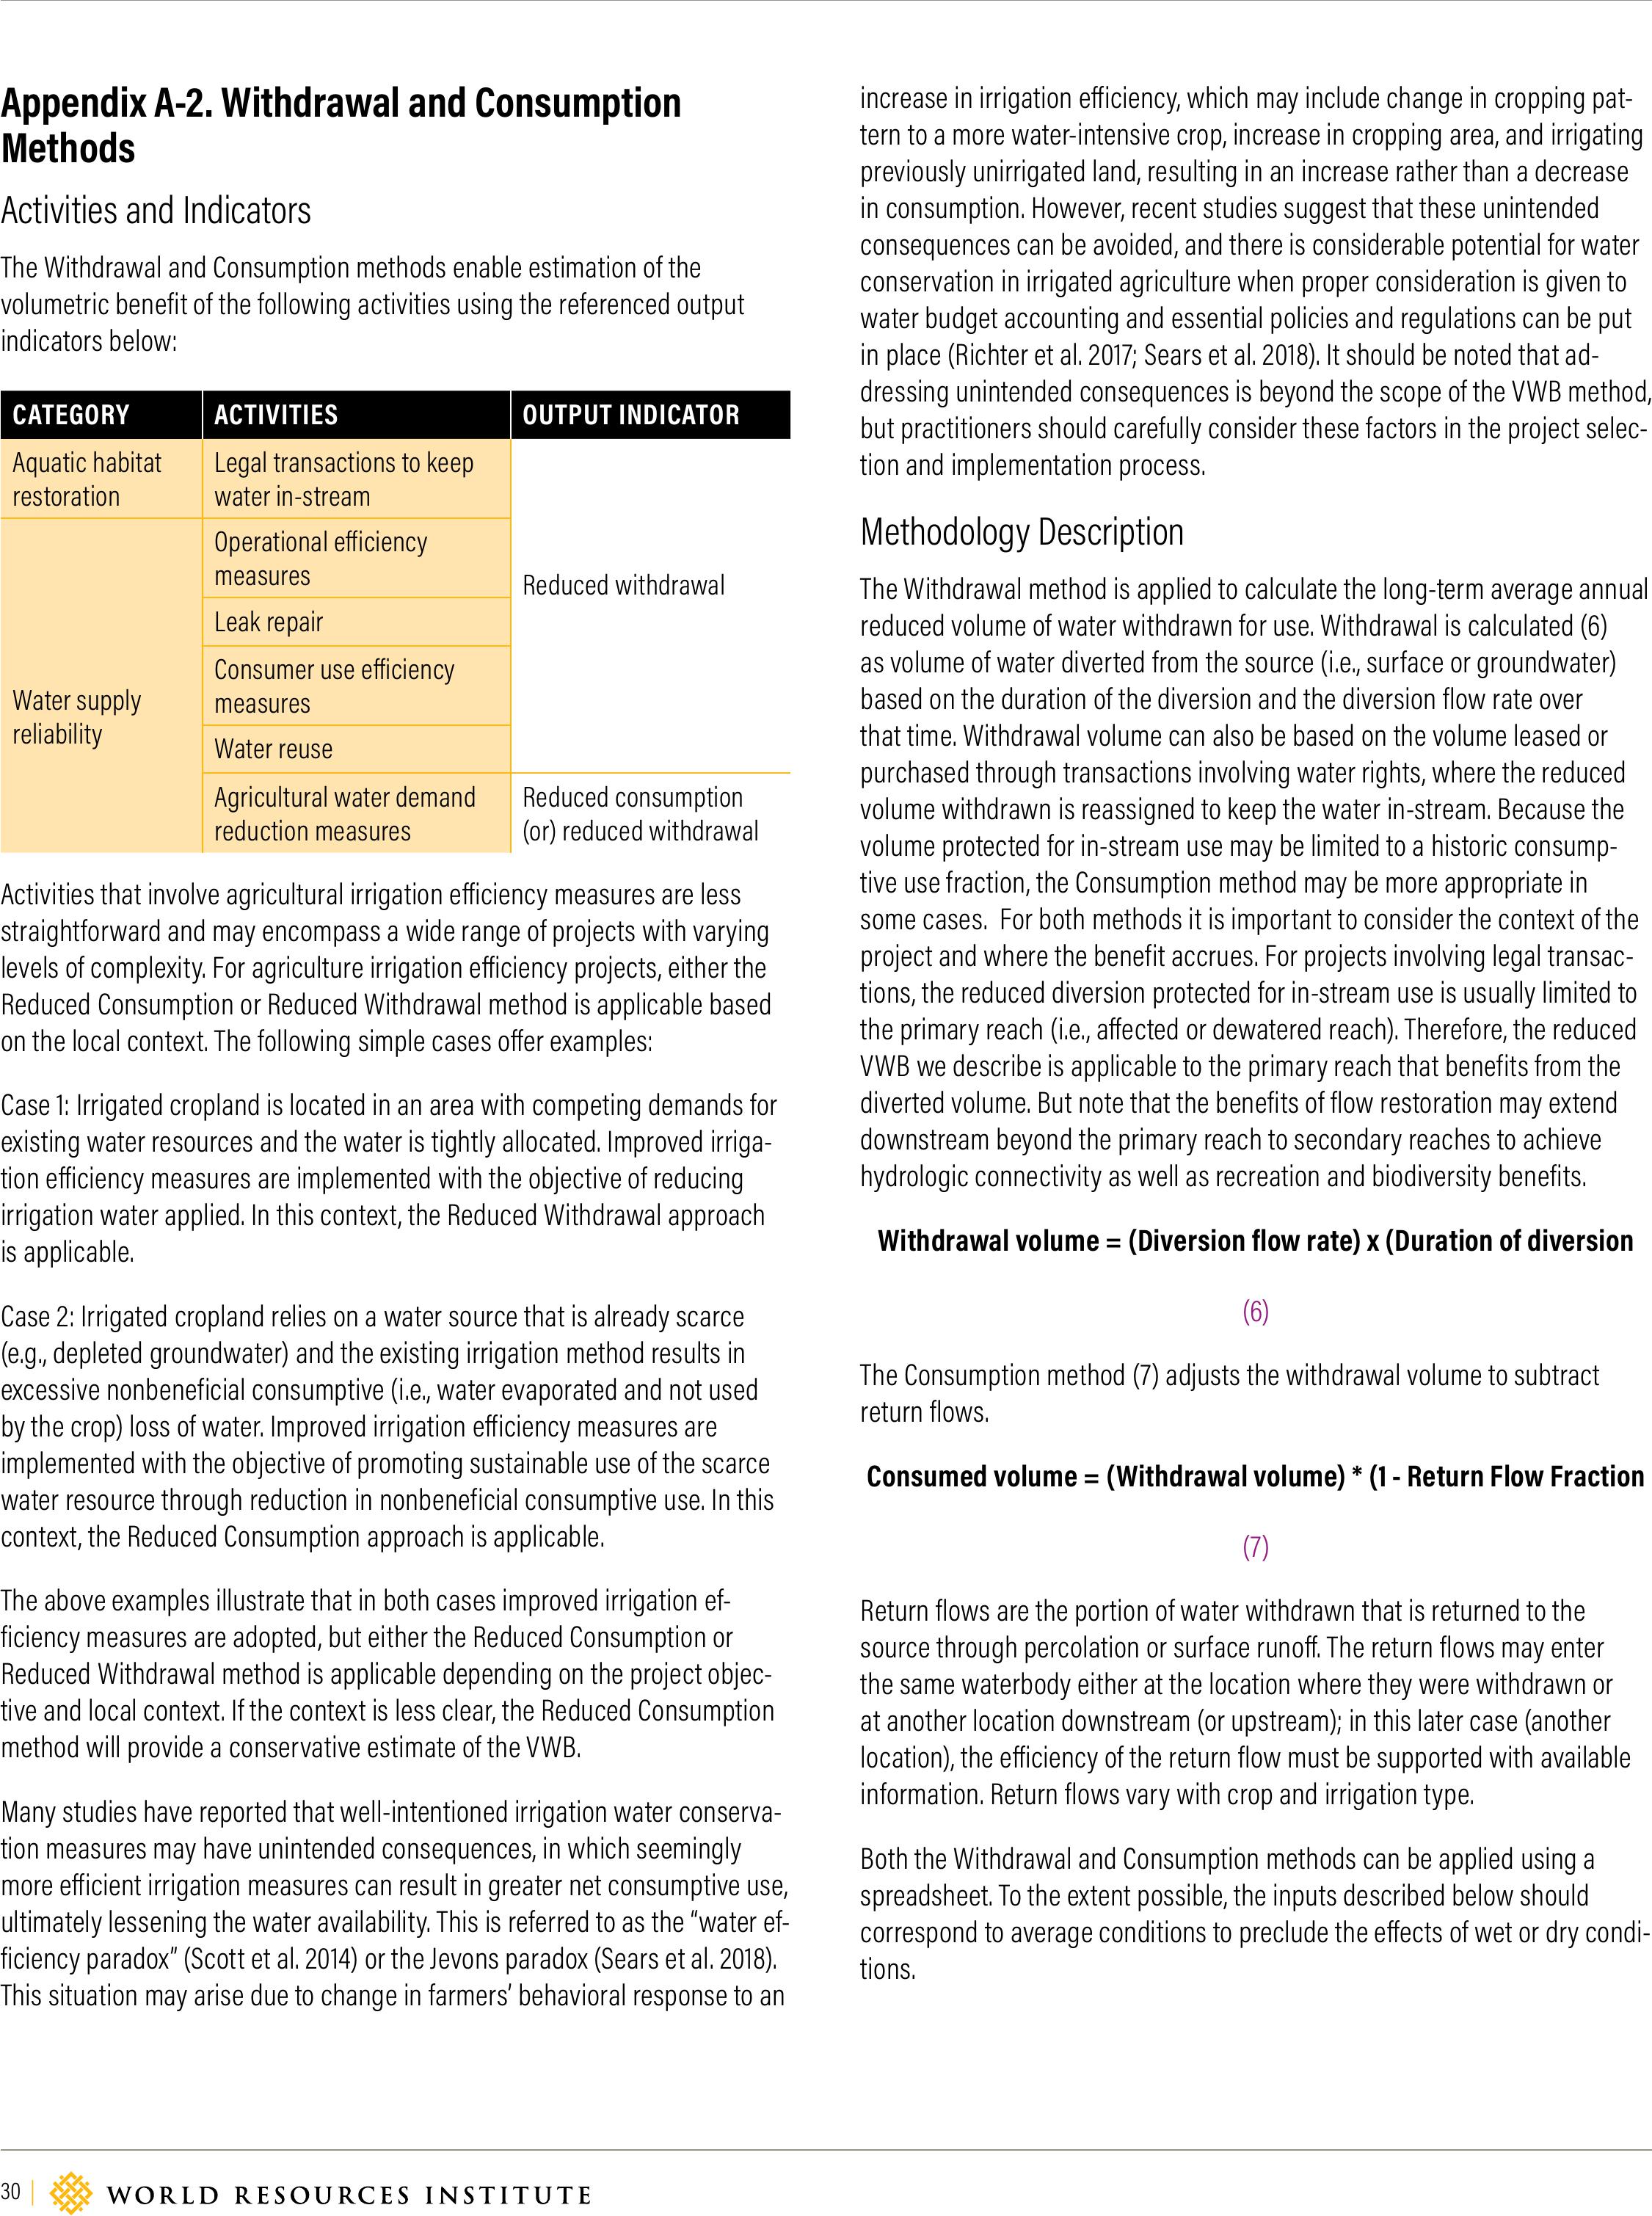
30 |
increase in irrigation eiciency, which may include change in cropping pat-
tern to a more water-intensive crop, increase in cropping area, and irrigating
previously unirrigated land, resulting in an increase rather than a decrease
in consumption. However, recent studies suggest that these unintended
consequences can be avoided, and there is considerable potential for water
conservation in irrigated agriculture when proper consideration is given to
water budget accounting and essential policies and regulations can be put
in place (Richter et al. 2017; Sears et al. 2018). It should be noted that ad-
dressing unintended consequences is beyond the scope of the VWB method,
but practitioners should carefully consider these factors in the project selec-
tion and implementation process.
Methodology Description
The Withdrawal method is applied to calculate the long-term average annual
reduced volume of water withdrawn for use. Withdrawal is calculated (6)
as volume of water diverted from the source (i.e., surface or groundwater)
based on the duration of the diversion and the diversion flow rate over
that time. Withdrawal volume can also be based on the volume leased or
purchased through transactions involving water rights, where the reduced
volume withdrawn is reassigned to keep the water in-stream. Because the
volume protected for in-stream use may be limited to a historic consump-
tive use fraction, the Consumption method may be more appropriate in
some cases. For both methods it is important to consider the context of the
project and where the benefit accrues. For projects involving legal transac-
tions, the reduced diversion protected for in-stream use is usually limited to
the primary reach (i.e., aected or dewatered reach). Therefore, the reduced
VWB we describe is applicable to the primary reach that benefits from the
diverted volume. But note that the benefits of flow restoration may extend
downstream beyond the primary reach to secondary reaches to achieve
hydrologic connectivity as well as recreation and biodiversity benefits.
Withdrawal volume = (Diversion flow rate) x (Duration of diversion
(6)
The Consumption method (7) adjusts the withdrawal volume to subtract
return flows.
Consumed volume = (Withdrawal volume) * (1 - Return Flow Fraction
(7)
Return flows are the portion of water withdrawn that is returned to the
source through percolation or surface runo. The return flows may enter
the same waterbody either at the location where they were withdrawn or
at another location downstream (or upstream); in this later case (another
location), the eiciency of the return flow must be supported with available
information. Return flows vary with crop and irrigation type.
Both the Withdrawal and Consumption methods can be applied using a
spreadsheet. To the extent possible, the inputs described below should
correspond to average conditions to preclude the eects of wet or dry condi-
tions.
Appendix A-2. Withdrawal and Consumption
Methods
Activities and Indicators
The Withdrawal and Consumption methods enable estimation of the
volumetric benefit of the following activities using the referenced output
indicators below:
CATEGORY ACTIVITIESOUTPUT INDICATOR
Aquatic habitat
restoration
Legal transactions to keep
water in-stream
Reduced withdrawal
Water supply
reliability
Operational eiciency
measures
Leak repair
Consumer use eiciency
measures
Water reuse
Agricultural water demand
reduction measures
Reduced consumption
(or) reduced withdrawal
Activities that involve agricultural irrigation eiciency measures are less
straightforward and may encompass a wide range of projects with varying
levels of complexity. For agriculture irrigation eiciency projects, either the
Reduced Consumption or Reduced Withdrawal method is applicable based
on the local context. The following simple cases oer examples:
Case 1: Irrigated cropland is located in an area with competing demands for
existing water resources and the water is tightly allocated. Improved irriga-
tion eiciency measures are implemented with the objective of reducing
irrigation water applied. In this context, the Reduced Withdrawal approach
is applicable.
Case 2: Irrigated cropland relies on a water source that is already scarce
(e.g., depleted groundwater) and the existing irrigation method results in
excessive nonbeneficial consumptive (i.e., water evaporated and not used
by the crop) loss of water. Improved irrigation eiciency measures are
implemented with the objective of promoting sustainable use of the scarce
water resource through reduction in nonbeneficial consumptive use. In this
context, the Reduced Consumption approach is applicable.
The above examples illustrate that in both cases improved irrigation ef-
ficiency measures are adopted, but either the Reduced Consumption or
Reduced Withdrawal method is applicable depending on the project objec-
tive and local context. If the context is less clear, the Reduced Consumption
method will provide a conservative estimate of the VWB.
Many studies have reported that well-intentioned irrigation water conserva-
tion measures may have unintended consequences, in which seemingly
more eicient irrigation measures can result in greater net consumptive use,
ultimately lessening the water availability. This is referred to as the “water ef-
ficiency paradox” (Scott et al. 2014) or the Jevons paradox (Sears et al. 2018).
This situation may arise due to change in farmers’ behavioral response to an
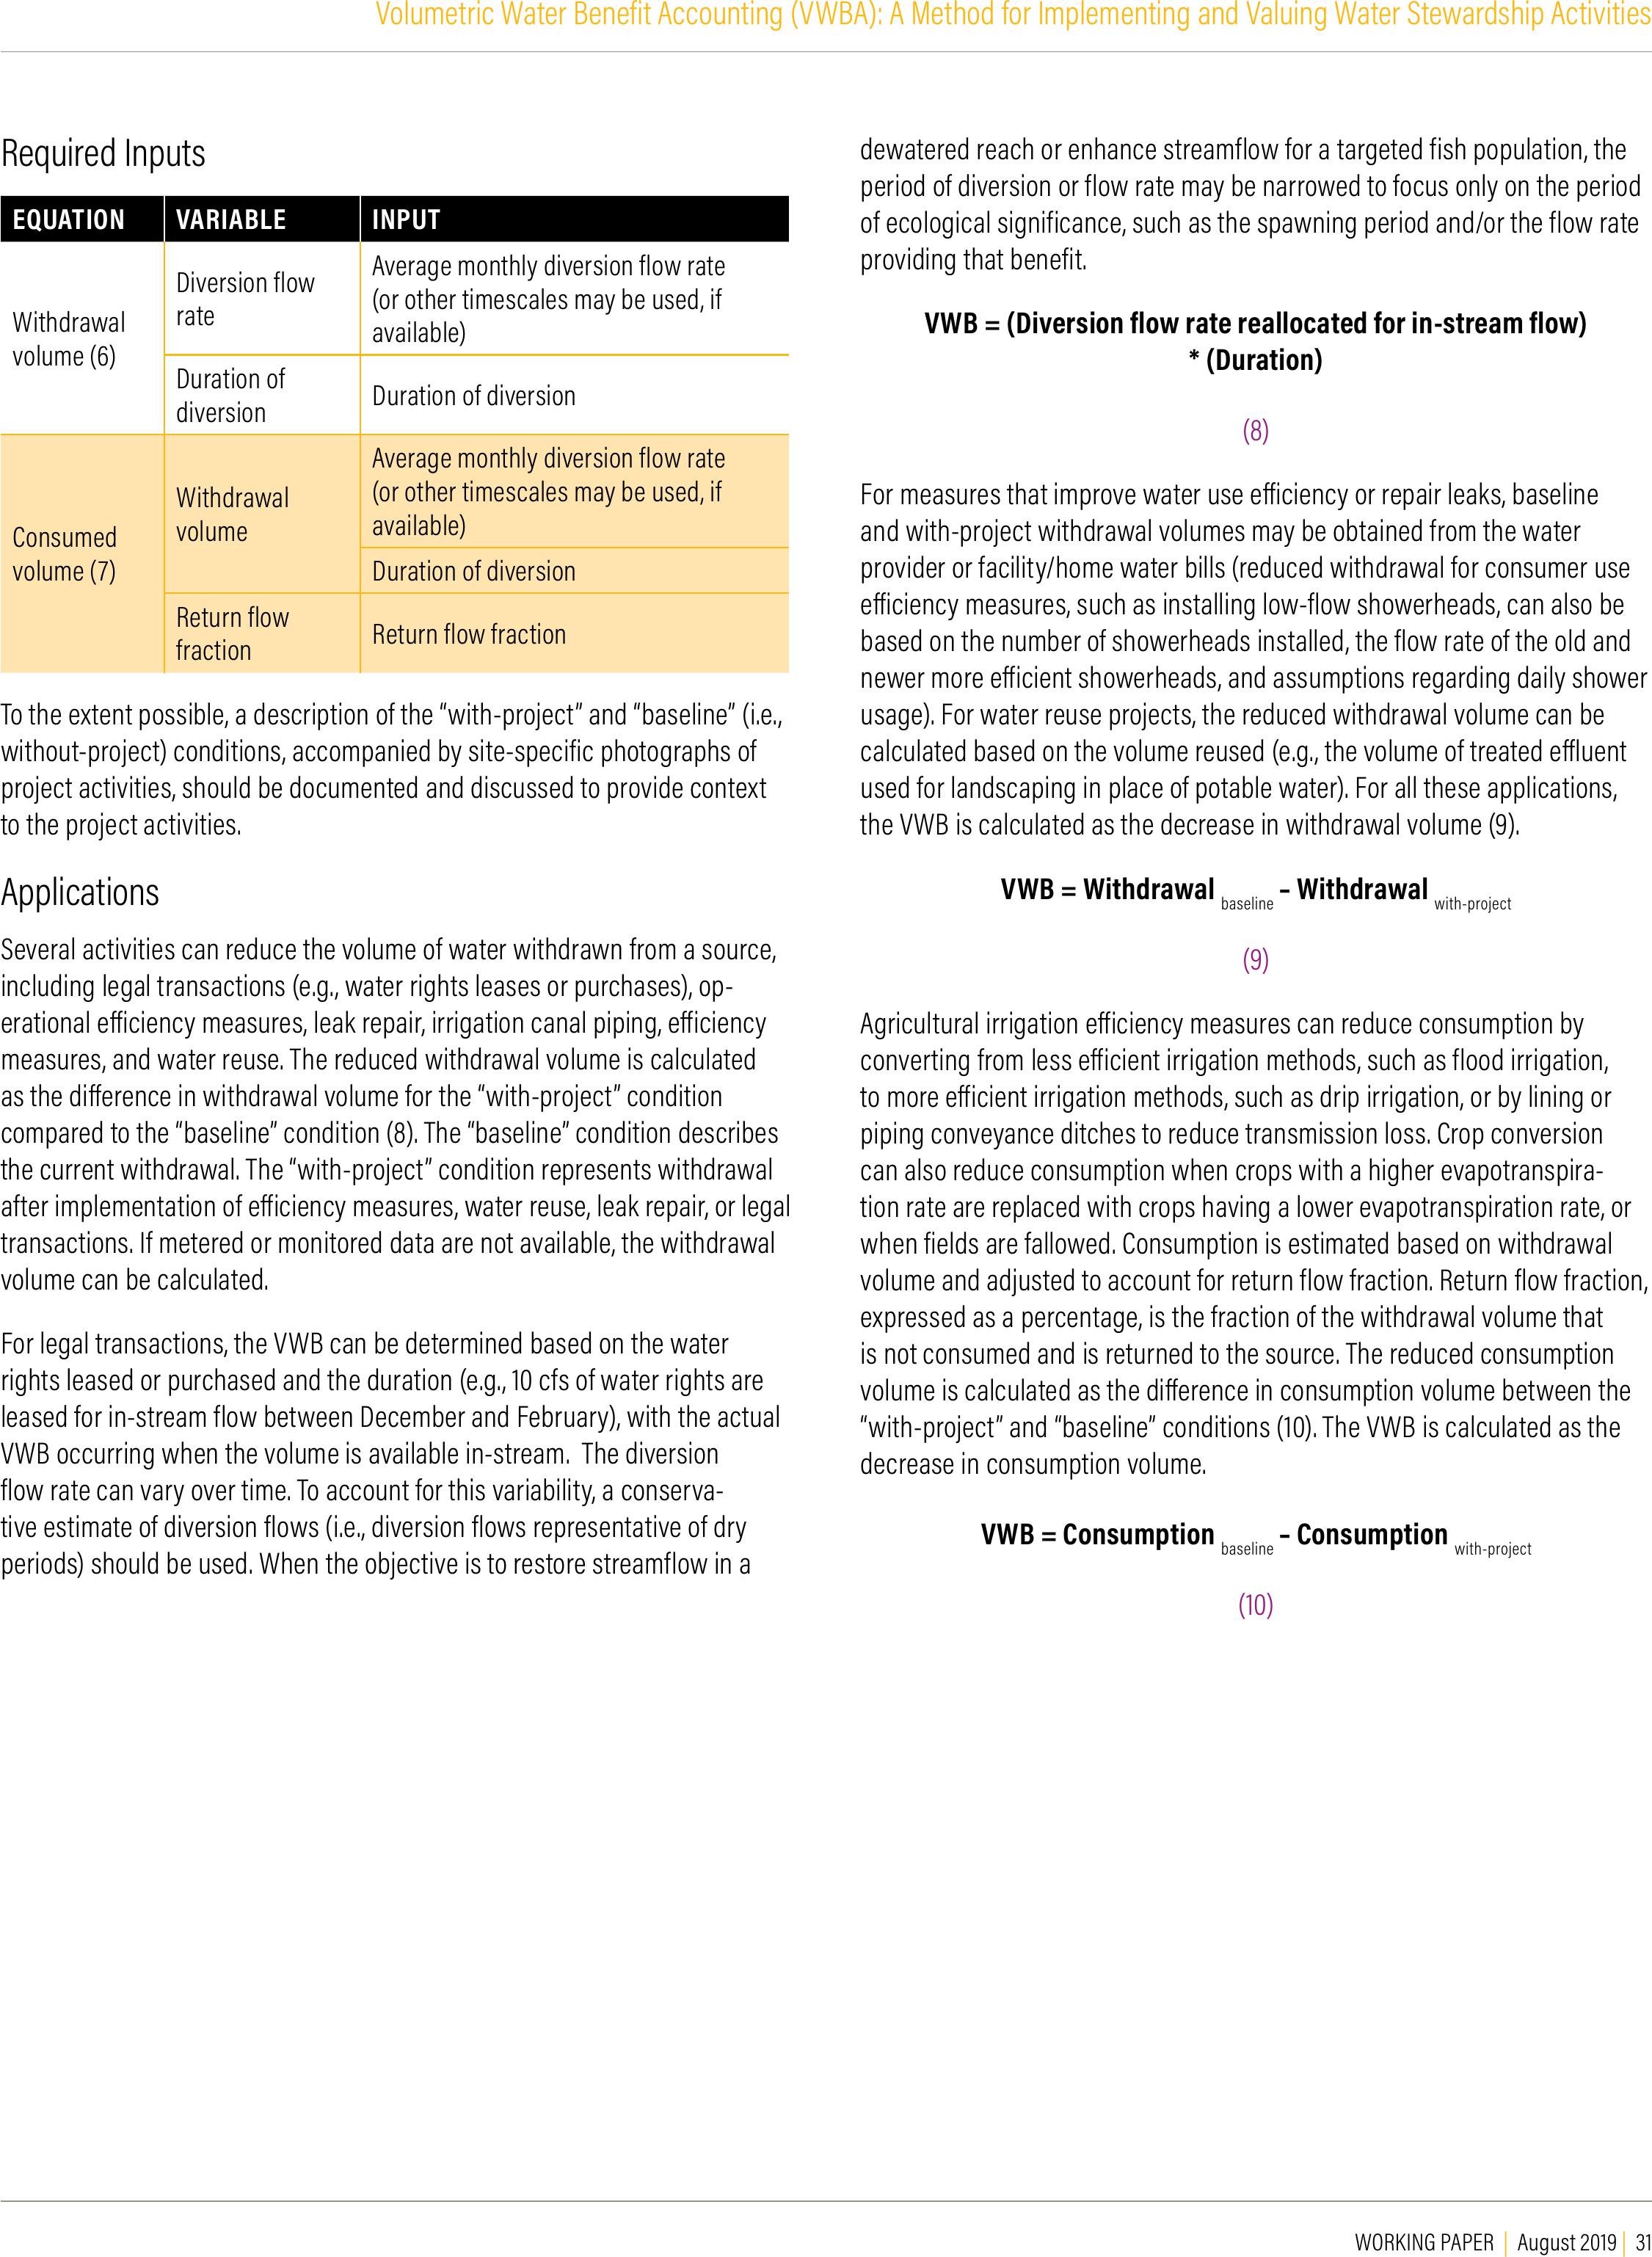
WORKING PAPER | August 2019 | 31
Volumetric Water Benefit Accounting (VWBA): A Method for Implementing and Valuing Water Stewardship Activities
Required Inputs
EQUATION VARIABLE INPUT
Withdrawal
volume (6)
Diversion flow
rate
Average monthly diversion flow rate
(or other timescales may be used, if
available)
Duration of
diversion Duration of diversion
Consumed
volume (7)
Withdrawal
volume
Average monthly diversion flow rate
(or other timescales may be used, if
available)
Duration of diversion
Return flow
fraction Return flow fraction
To the extent possible, a description of the “with-project” and “baseline” (i.e.,
without-project) conditions, accompanied by site-specific photographs of
project activities, should be documented and discussed to provide context
to the project activities.
Applications
Several activities can reduce the volume of water withdrawn from a source,
including legal transactions (e.g., water rights leases or purchases), op-
erational eiciency measures, leak repair, irrigation canal piping, eiciency
measures, and water reuse. The reduced withdrawal volume is calculated
as the dierence in withdrawal volume for the “with-project” condition
compared to the “baseline” condition (8). The “baseline” condition describes
the current withdrawal. The “with-project” condition represents withdrawal
after implementation of eiciency measures, water reuse, leak repair, or legal
transactions. If metered or monitored data are not available, the withdrawal
volume can be calculated.
For legal transactions, the VWB can be determined based on the water
rights leased or purchased and the duration (e.g., 10 cfs of water rights are
leased for in-stream flow between December and February), with the actual
VWB occurring when the volume is available in-stream. The diversion
flow rate can vary over time. To account for this variability, a conserva-
tive estimate of diversion flows (i.e., diversion flows representative of dry
periods) should be used. When the objective is to restore streamflow in a
dewatered reach or enhance streamflow for a targeted fish population, the
period of diversion or flow rate may be narrowed to focus only on the period
of ecological significance, such as the spawning period and/or the flow rate
providing that benefit.
VWB = (Diversion flow rate reallocated for in-stream flow)
* (Duration)
(8)
For measures that improve water use eiciency or repair leaks, baseline
and with-project withdrawal volumes may be obtained from the water
provider or facility/home water bills (reduced withdrawal for consumer use
eiciency measures, such as installing low-flow showerheads, can also be
based on the number of showerheads installed, the flow rate of the old and
newer more eicient showerheads, and assumptions regarding daily shower
usage). For water reuse projects, the reduced withdrawal volume can be
calculated based on the volume reused (e.g., the volume of treated eluent
used for landscaping in place of potable water). For all these applications,
the VWB is calculated as the decrease in withdrawal volume (9).
VWB = Withdrawal baseline – Withdrawal with-project
(9)
Agricultural irrigation eiciency measures can reduce consumption by
converting from less eicient irrigation methods, such as flood irrigation,
to more eicient irrigation methods, such as drip irrigation, or by lining or
piping conveyance ditches to reduce transmission loss. Crop conversion
can also reduce consumption when crops with a higher evapotranspira-
tion rate are replaced with crops having a lower evapotranspiration rate, or
when fields are fallowed. Consumption is estimated based on withdrawal
volume and adjusted to account for return flow fraction. Return flow fraction,
expressed as a percentage, is the fraction of the withdrawal volume that
is not consumed and is returned to the source. The reduced consumption
volume is calculated as the dierence in consumption volume between the
“with-project” and “baseline” conditions (10). The VWB is calculated as the
decrease in consumption volume.
VWB = Consumption baseline – Consumption with-project
(10)
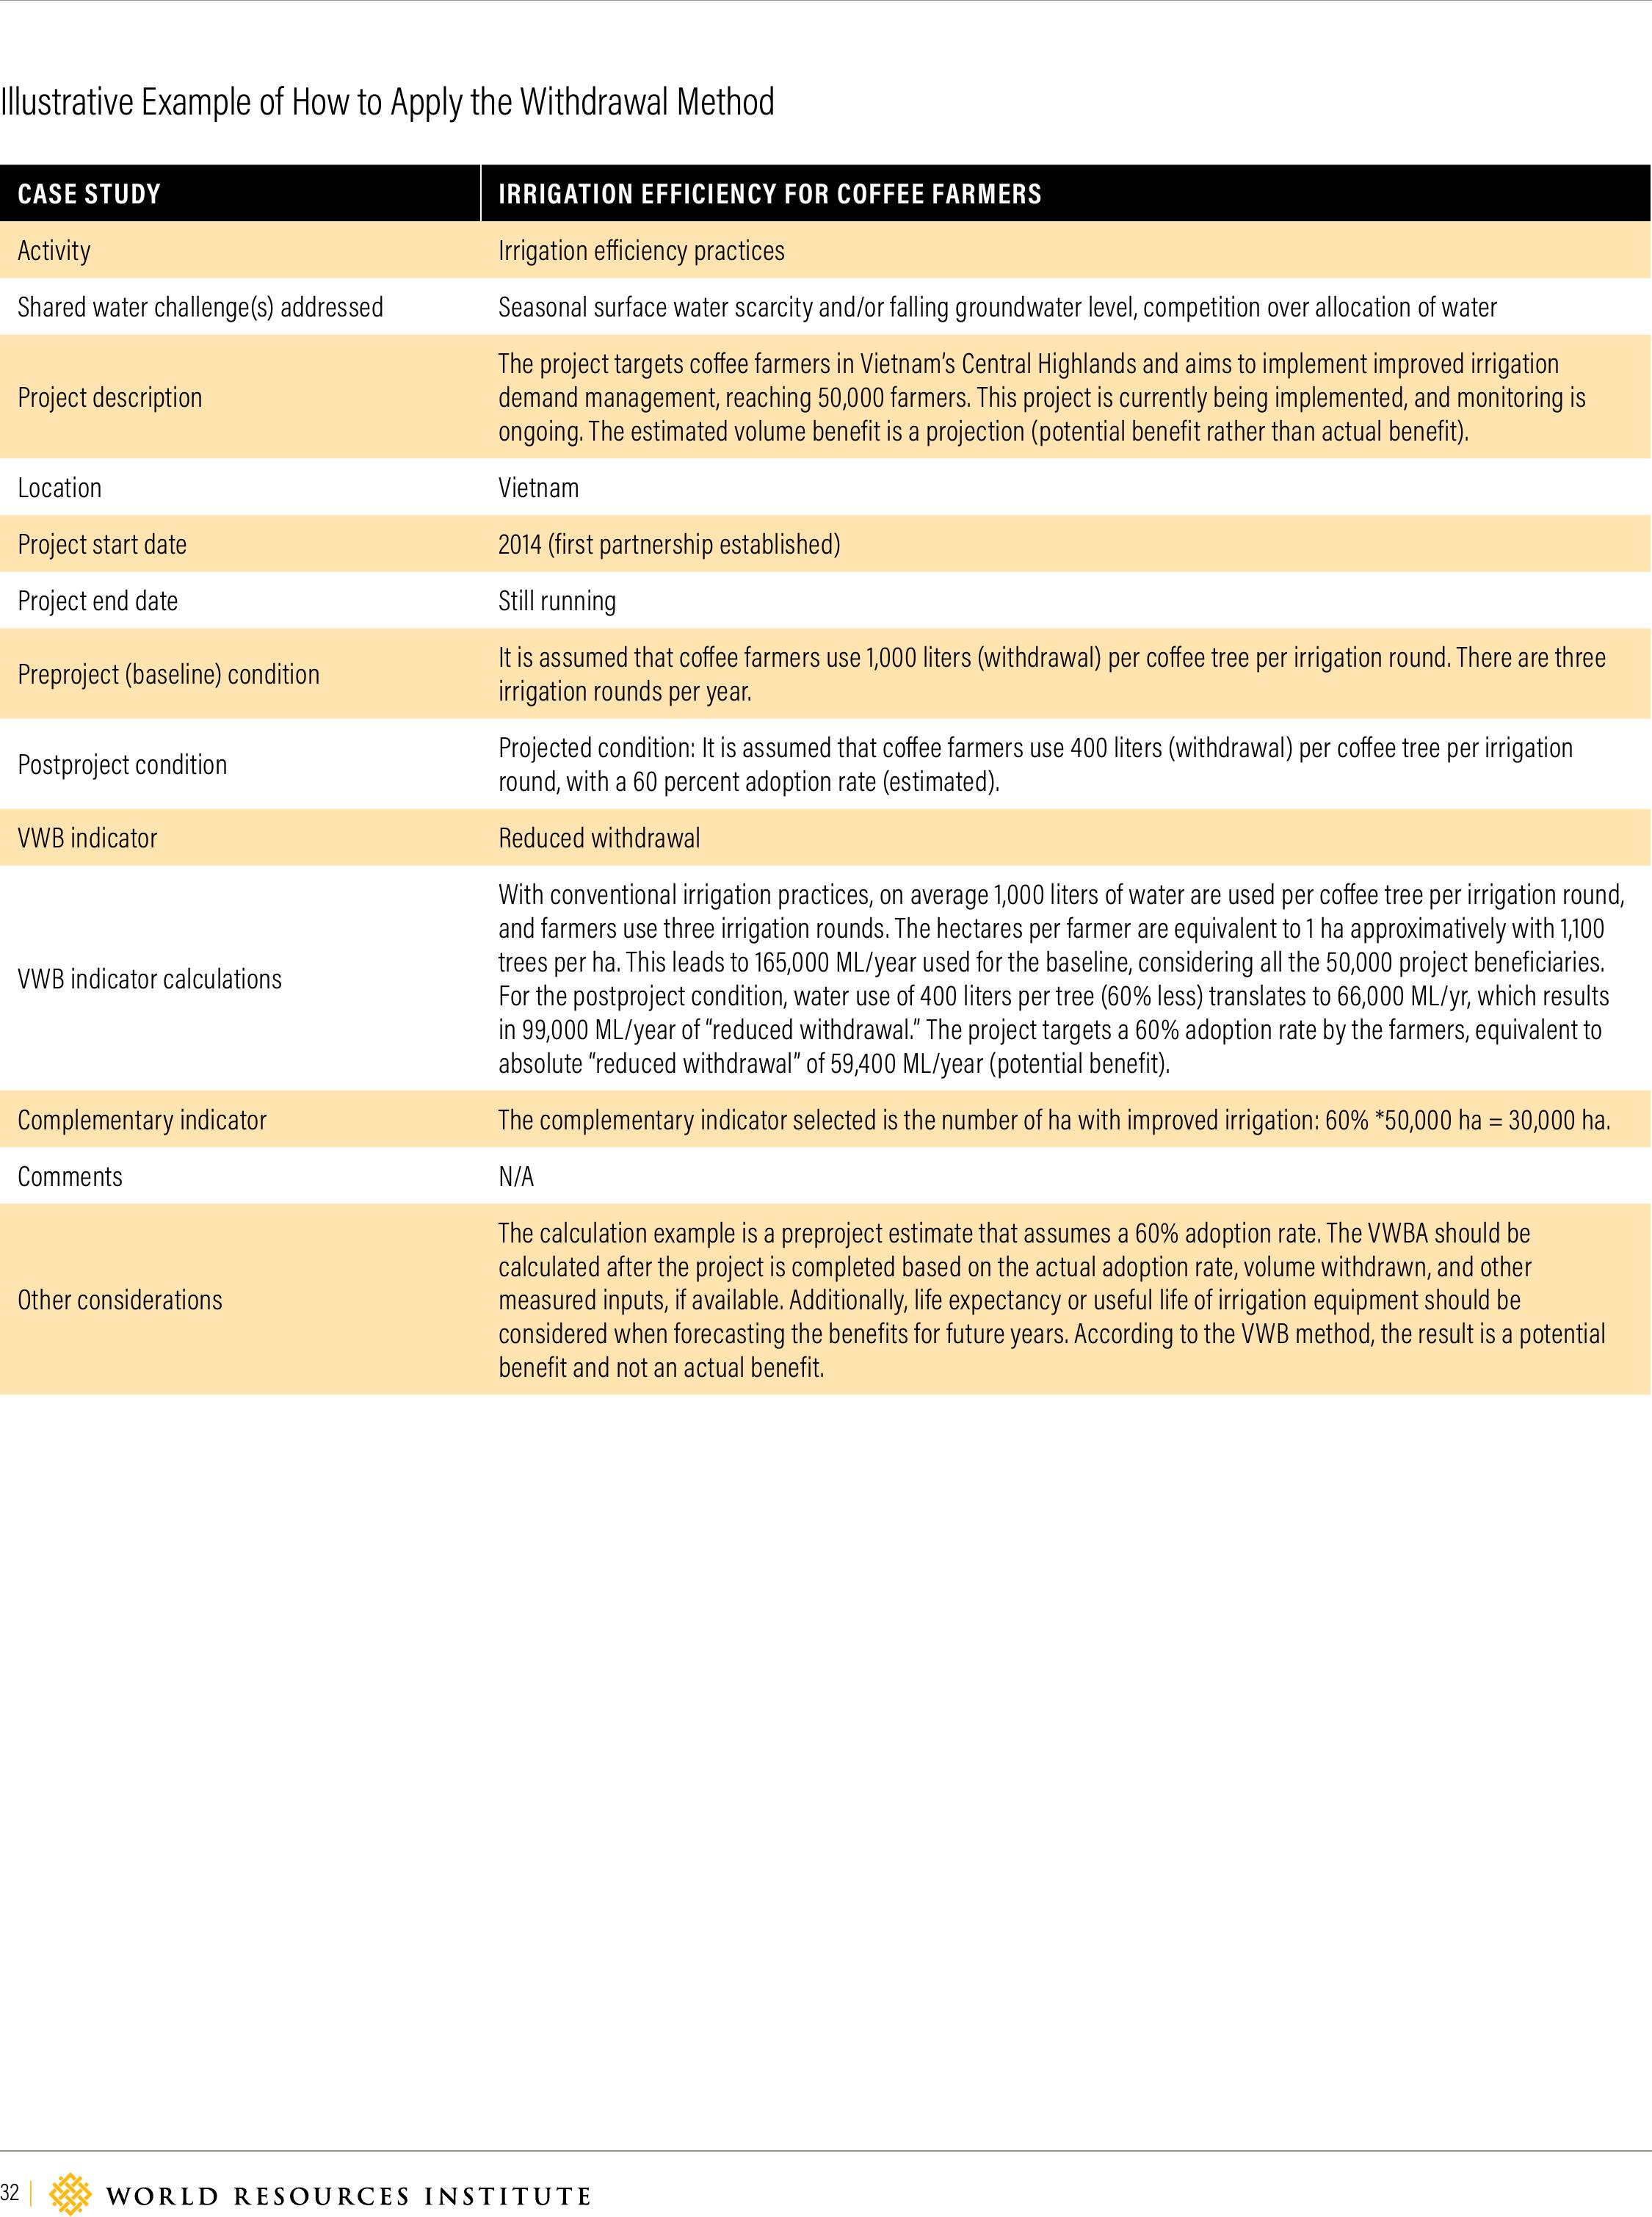
32 |
Illustrative Example of How to Apply the Withdrawal Method
CASE STUDYIRRIGATION EFFICIENCY FOR COFFEE FARMERS
Activity Irrigation eiciency practices
Shared water challenge(s) addressed Seasonal surface water scarcity and/or falling groundwater level, competition over allocation of water
Project description
The project targets coee farmers in Vietnam’s Central Highlands and aims to implement improved irrigation
demand management, reaching 50,000 farmers. This project is currently being implemented, and monitoring is
ongoing. The estimated volume benefit is a projection (potential benefit rather than actual benefit).
Location Vietnam
Project start date2014 (first partnership established)
Project end dateStill running
Preproject (baseline) conditionIt is assumed that coee farmers use 1,000 liters (withdrawal) per coee tree per irrigation round. There are three
irrigation rounds per year.
Postproject conditionProjected condition: It is assumed that coee farmers use 400 liters (withdrawal) per coee tree per irrigation
round, with a 60 percent adoption rate (estimated).
VWB indicatorReduced withdrawal
VWB indicator calculations
With conventional irrigation practices, on average 1,000 liters of water are used per coee tree per irrigation round,
and farmers use three irrigation rounds. The hectares per farmer are equivalent to 1 ha approximatively with 1,100
trees per ha. This leads to 165,000 ML/year used for the baseline, considering all the 50,000 project beneficiaries.
For the postproject condition, water use of 400 liters per tree (60% less) translates to 66,000 ML/yr, which results
in 99,000 ML/year of “reduced withdrawal.” The project targets a 60% adoption rate by the farmers, equivalent to
absolute “reduced withdrawal” of 59,400 ML/year (potential benefit).
Complementary indicatorThe complementary indicator selected is the number of ha with improved irrigation: 60% *50,000 ha = 30,000 ha.
Comments N/A
Other considerations
The calculation example is a preproject estimate that assumes a 60% adoption rate. The VWBA should be
calculated after the project is completed based on the actual adoption rate, volume withdrawn, and other
measured inputs, if available. Additionally, life expectancy or useful life of irrigation equipment should be
considered when forecasting the benefits for future years. According to the VWB method, the result is a potential
benefit and not an actual benefit.

WORKING PAPER | August 2019 | 33
Volumetric Water Benefit Accounting (VWBA): A Method for Implementing and Valuing Water Stewardship Activities
Appendix A-3. Volume Provided Method
Activities and Indicators
The Volume Provided method enables estimation of the volumetric benefit of
the following activities using the referenced output indicator below:
CATEGORY ACTIVITIESOUTPUT
INDICATOR
Water Access New water supply for crop irrigationVolume provided
Access to drinking water supply
Water access activities provide a volume of water that contributes to
improving human health and/or livelihood, as well as social or economic
security. Activities may provide a new source of water or make water usable
through treatment (e.g., water treatment plants, point of use treatment).
Water access activities are typically located in water-stressed regions and
may increase stress on water resources, although practitioners should make
every eort to ensure that the water source is sustainable. Nevertheless,
these are important projects with quantifiable volume benefits that make
a positive dierence in communities. The aggregation of these VWBs with
those benefiting the environment is discussed in the “Communication and
Aggregation” section of this working paper.
Methodology Description
When a new supply of water is provided for irrigation, the flow of water
should be metered if possible. Where metering is not feasible, the volume
of water provided for crop irrigation (i.e., the withdrawal volume) can be
estimated based on crop demand.
Metering is also preferred for drinking water access projects. However,
where metering is not feasible, the volume provided can be calculated based
on the number of direct beneficiaries receiving reasonable access to water.
This method can be applied using a spreadsheet, provided the input data are
readily available.
The VWB is calculated by multiplying the number of direct beneficiaries
receiving reasonable access to water by a per-capita volume of water over
the number of days of access (i.e., 365 days for full access projects). The
World Health Organization and United Nations Children’s Fund (WHO and
UNICEF 2000) define reasonable access as the availability of at least 20 liters
per person per day from a source within one kilometer of the user’s dwelling.
In the case where a local regulation (e.g., national regulation) defines “rea-
sonable access to water” (or a similar concept) as more than 20 L/person/
day and the project complies with the local regulation, the volume provided
can be calculated based on the number of direct beneficiaries receiving this
value of “reasonable access to water.”
Because it can be diicult to determine who is using a particular water
source, we recommend that someone familiar with the project determine the
number of direct beneficiaries for drinking water supply projects. In order
to avoid overclaiming the benefit, the VWB can be capped at the minimum
of the beneficiary-based VWB and the maximum daily delivery or pumping
capacity, if known.
Required Inputs
EQUATION VARIABLE INPUT
New irrigation water supply
(withdrawal volume)
Measured withdrawals Metered flows, if available, or pump discharge rates and operating times
Estimated irrigation
requirements
Computer models such as CROWAT, or estimated based on crop water requirement, adjusted for
rainfall and irrigation system eiciency:
▪Location
▪Irrigated area
▪Crop type
▪Crop evapotranspiration
▪Method of irrigation
▪Irrigation eiciency
Drinking water supply
Measured water volume Metered flows, if available, or pump discharge rates and operating times
Estimated water volume
Number of beneficiaries with reasonable access to water
Information regarding required per-capita availability (default is 20 L/day for full access)
If available, maximum delivery/pumping capacity of the new supply
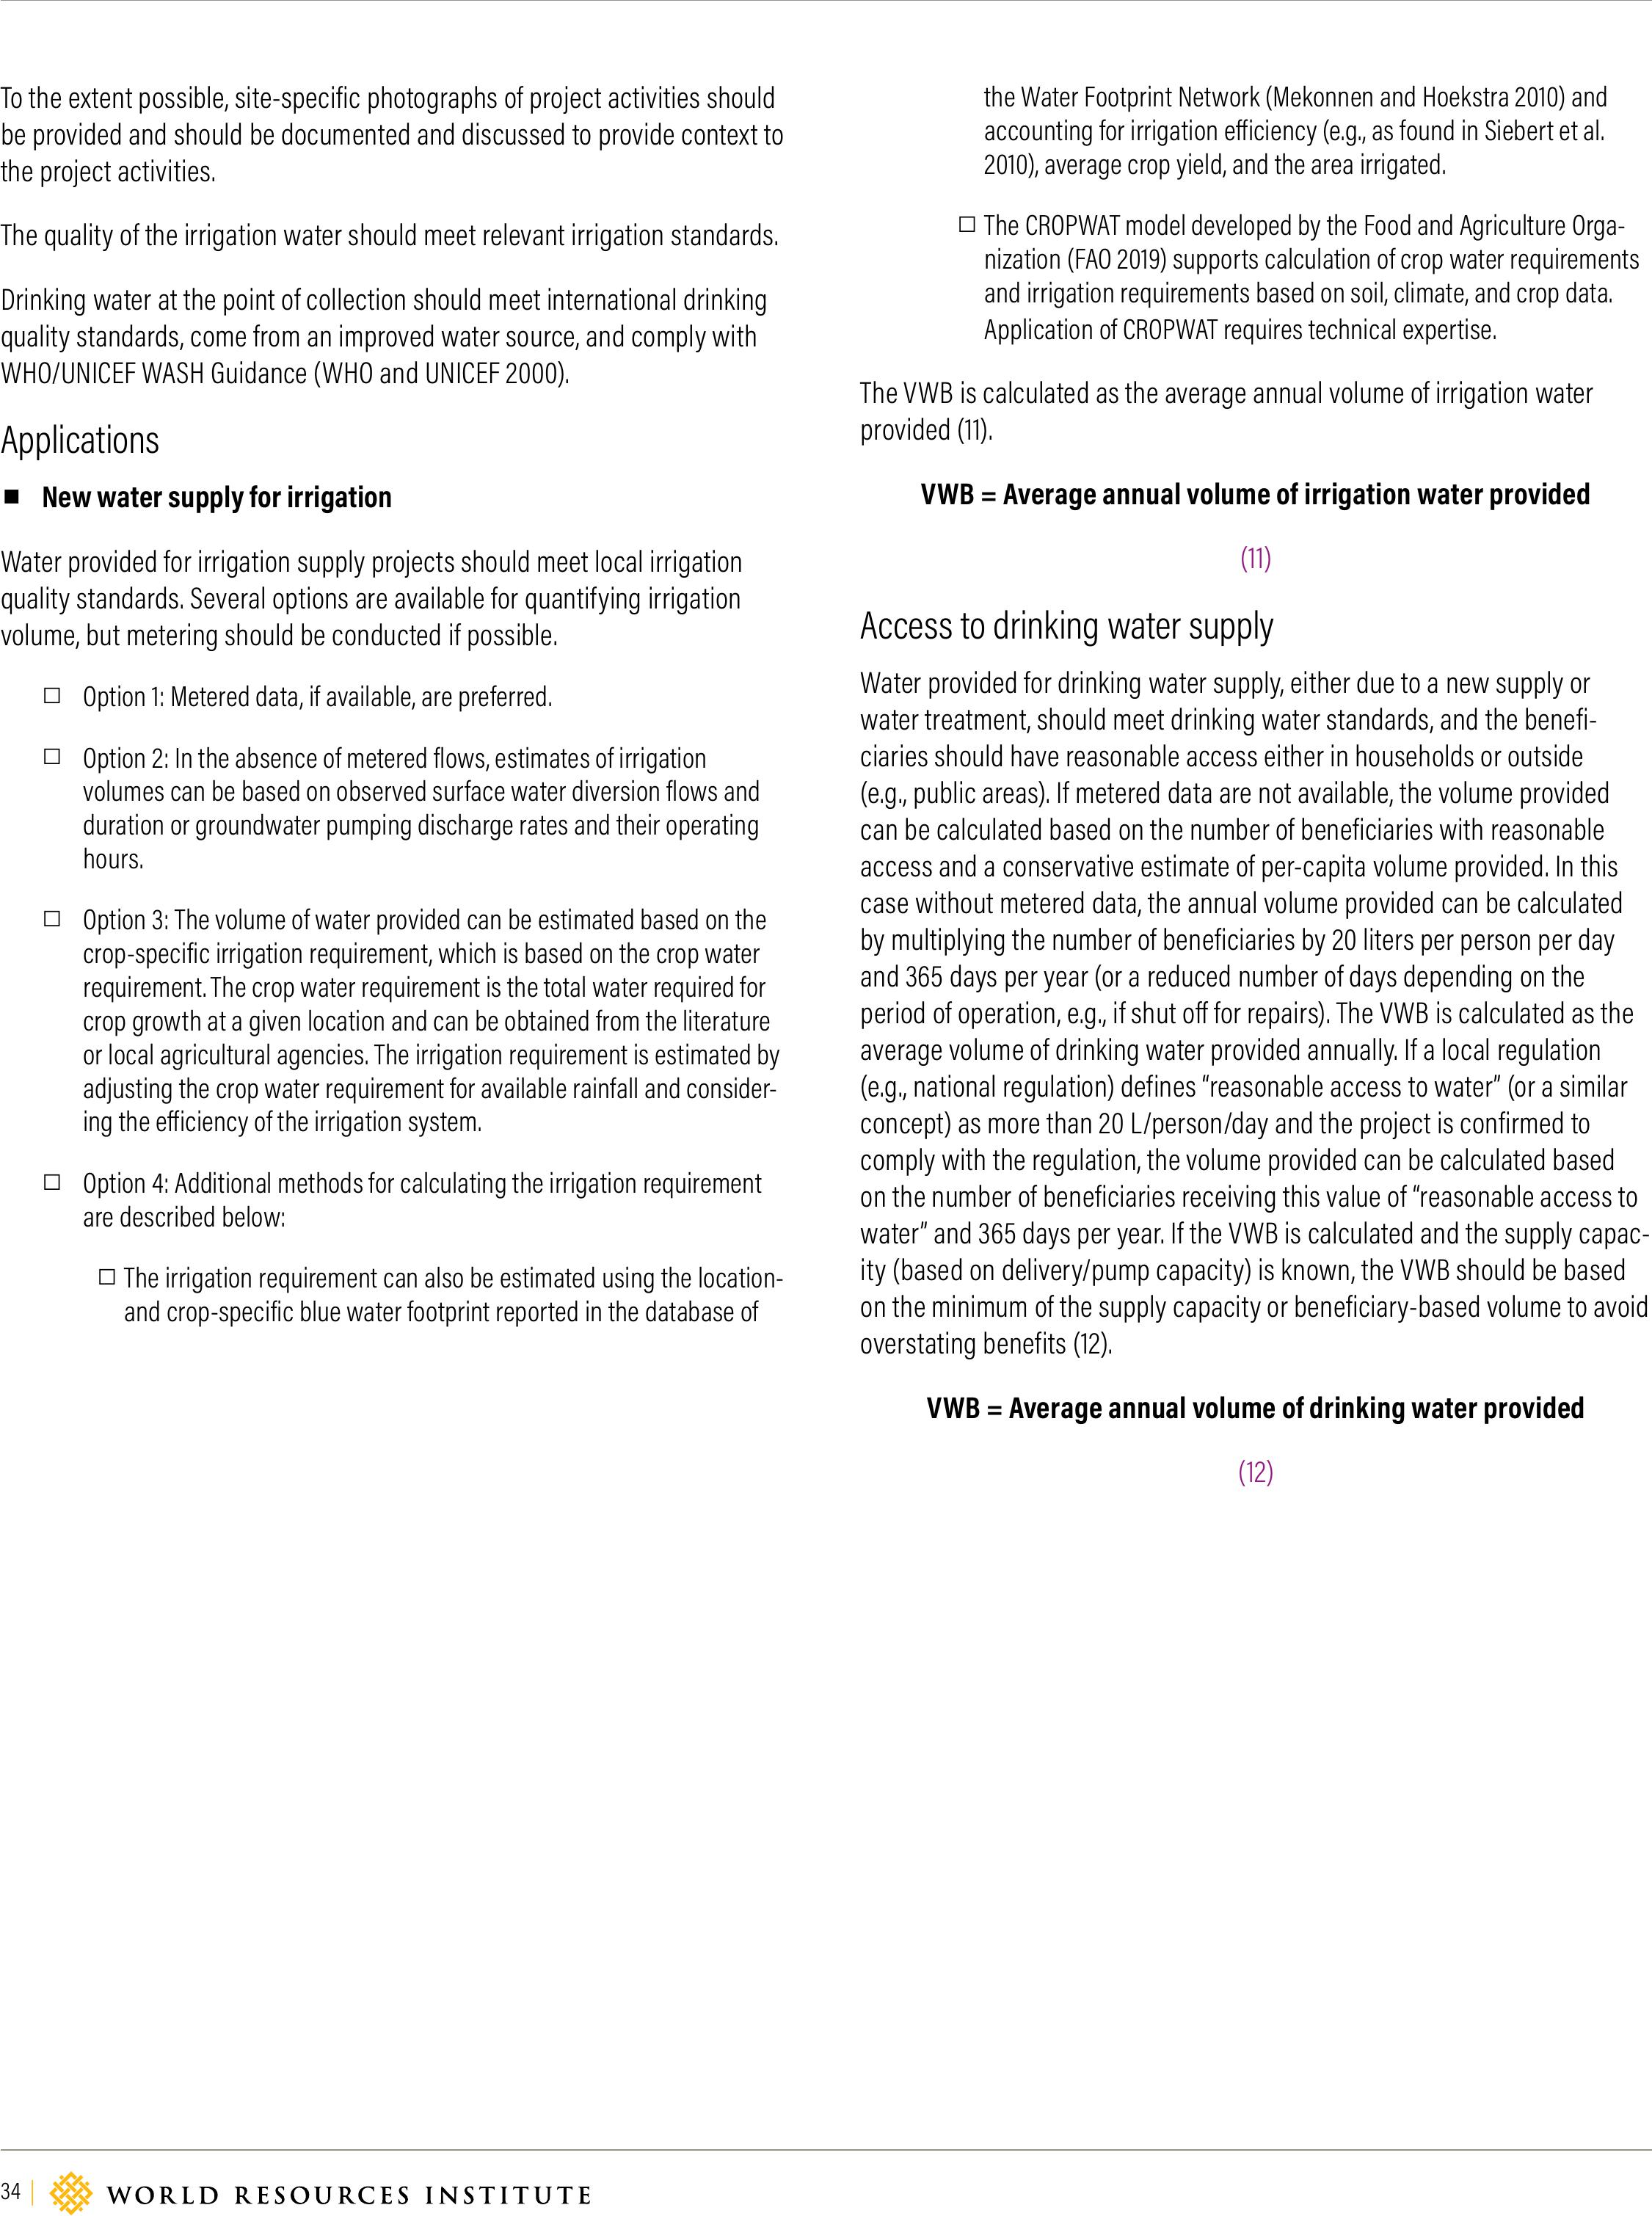
34 |
To the extent possible, site-specific photographs of project activities should
be provided and should be documented and discussed to provide context to
the project activities.
The quality of the irrigation water should meet relevant irrigation standards.
Drinking water at the point of collection should meet international drinking
quality standards, come from an improved water source, and comply with
WHO/UNICEF WASH Guidance (WHO and UNICEF 2000).
Applications
▪New water supply for irrigation
Water provided for irrigation supply projects should meet local irrigation
quality standards. Several options are available for quantifying irrigation
volume, but metering should be conducted if possible.
□Option 1: Metered data, if available, are preferred.
□Option 2: In the absence of metered flows, estimates of irrigation
volumes can be based on observed surface water diversion flows and
duration or groundwater pumping discharge rates and their operating
hours.
□Option 3: The volume of water provided can be estimated based on the
crop-specific irrigation requirement, which is based on the crop water
requirement. The crop water requirement is the total water required for
crop growth at a given location and can be obtained from the literature
or local agricultural agencies. The irrigation requirement is estimated by
adjusting the crop water requirement for available rainfall and consider-
ing the eiciency of the irrigation system.
□Option 4: Additional methods for calculating the irrigation requirement
are described below:
□The irrigation requirement can also be estimated using the location-
and crop-specific blue water footprint reported in the database of
the Water Footprint Network (Mekonnen and Hoekstra 2010) and
accounting for irrigation eiciency (e.g., as found in Siebert et al.
2010), average crop yield, and the area irrigated.
□The CROPWAT model developed by the Food and Agriculture Orga-
nization (FAO 2019) supports calculation of crop water requirements
and irrigation requirements based on soil, climate, and crop data.
Application of CROPWAT requires technical expertise.
The VWB is calculated as the average annual volume of irrigation water
provided (11).
VWB = Average annual volume of irrigation water provided
(11)
Access to drinking water supply
Water provided for drinking water supply, either due to a new supply or
water treatment, should meet drinking water standards, and the benefi-
ciaries should have reasonable access either in households or outside
(e.g., public areas). If metered data are not available, the volume provided
can be calculated based on the number of beneficiaries with reasonable
access and a conservative estimate of per-capita volume provided. In this
case without metered data, the annual volume provided can be calculated
by multiplying the number of beneficiaries by 20 liters per person per day
and 365 days per year (or a reduced number of days depending on the
period of operation, e.g., if shut o for repairs). The VWB is calculated as the
average volume of drinking water provided annually. If a local regulation
(e.g., national regulation) defines “reasonable access to water” (or a similar
concept) as more than 20 L/person/day and the project is confirmed to
comply with the regulation, the volume provided can be calculated based
on the number of beneficiaries receiving this value of “reasonable access to
water” and 365 days per year. If the VWB is calculated and the supply capac-
ity (based on delivery/pump capacity) is known, the VWB should be based
on the minimum of the supply capacity or beneficiary-based volume to avoid
overstating benefits (12).
VWB = Average annual volume of drinking water provided
(12)

WORKING PAPER | August 2019 | 35
Volumetric Water Benefit Accounting (VWBA): A Method for Implementing and Valuing Water Stewardship Activities
Illustrative Example of How to Apply the Volume Provided Method
CASE STUDYACCESS TO DRINKING WATER
Activity Repair of community water pumps
Shared water challenge(s) addressed WASH needs not met; in particular, access to water
Project description
The specific needs of cocoa farmers in Côte d’Ivoire have been targeted in this project, developed with the
International Federation of Red Cross and Red Crescent Societies as the main partner. The activity focused
on addressing WASH needs comprehensively, through various specific activities of water pumps repaired or
rehabilitated, latrines built, local committees established in charge of ensuring long-term service, installing
handwashing facilities, awareness training, etc. The activities are multiple, and the focus chosen here is on the
number of beneficiaries with access to drinking water: 109,990 by 2016.
Location Côte d’Ivoire
Project start date2007
Project end dateStill running
Preproject (baseline) conditionThe assumptions are that no community members had access to safe drinking water and that no community
members would have access to drinking water in the years to come.
Postproject conditionBy 2016, beneficiaries’ access to drinking water needs was covered by the project’s activities. We assume that the
pumps were maintained for the duration of the project until this date. There are 109,990 beneficiaries.
VWB indicatorVolume provided
VWB indicator calculations
Although the volume of water provided from the water pumps and other specific activities was not measured,
based on the number of beneficiaries it is possible to calculate the volume provided, using the average needs of a
person of 20 L/day (WHO and UNICEF 2000). Given that there are 109,990 beneficiaries, the total water provided is
estimated by the following equation:
VWB (ML/year) = 7,300 L/year-beneficiary * 109,990 (beneficiaries) = 803 ML/year (potential benefit).
Complementary indicatorThe complementary indicator selected is the number of beneficiaries: 109,990 beneficiaries.
Comments N/A
Considerations
If the delivery capacity is known, consider whether it is equal to or larger than the per capita estimated VWB. Is
the supply available 365 days/year or does the duration need to be adjusted for periods when the pump is being
repaired? Is the cost share calculated based only on the water access activity (recommended, if possible), or
on all project activities? Will benefits be claimed in full the year the project was completed, or the year after the
project was completed? Is the project being monitored and maintained to ensure that the full water supply remains
available 365 days/year in future years? Is the water tested to ensure that it is safe to drink?

36 |
Appendix A-4. Capture and Infiltration Method
Activities and Indicators
The Capture and Infiltration method enables estimation of the volumetric
benefit of the following activities using the referenced output indicator
below:
CATEGORY ACTIVITIESOUTPUT INDICATOR
Water supply
reliability Rainwater harvesting Increased recharge
Methodology Description
The Capture and Infiltration method is applied to calculate the volume
recharged to groundwater, based on available supply (i.e., volume draining
from catchment), the volume captured by these interventions and losses
associated with evaporation (if any) and use (i.e., withdrawal) (13). First, the
method calculates the volume captured as the minimum of available supply
(16) and storage potential (14). Storage potential is based on the design stor-
age capacity of the intervention and the number of times it fills to capacity
(15). Recharge volume is calculated by subtracting evaporation and usage
losses from the volume captured as follows:
Recharge volume = Volume captured – [Evaporation + Withdrawal
(13)
Volume captured = Min [Available supply, Storage potential]
(14)
Storage potential = Design storage capacity x Number of
times filled to capacity
(15)
Available supply = Catchment area * Runoff coefficient
* Annual rainfall
(16)
The method can be applied using a spreadsheet.
Required Inputs
EQUATION VARIABLE INPUT
Recharge volume (13)
Volume capturedAvailable supply
Storage potential
Evaporation Evaporation from the intervention
Withdrawal Withdrawals from the intervention
Volume captured (14)
Available supply
Catchment area draining to the intervention
Catchment runo coeicient
Average annual precipitation from a representative weather station
Storage potentialDesign storage capacity
Number of times filled to capacity
Storage potential (15)Design storage capacityDesign storage capacity of the intervention
Number of times filled to capacityNumber of times the intervention fills to capacity
Available supply (16)
Catchment areaCatchment area draining to the intervention
Runo coeicientCatchment runo coeicient
Annual rainfallAverage annual precipitation from a representative weather station
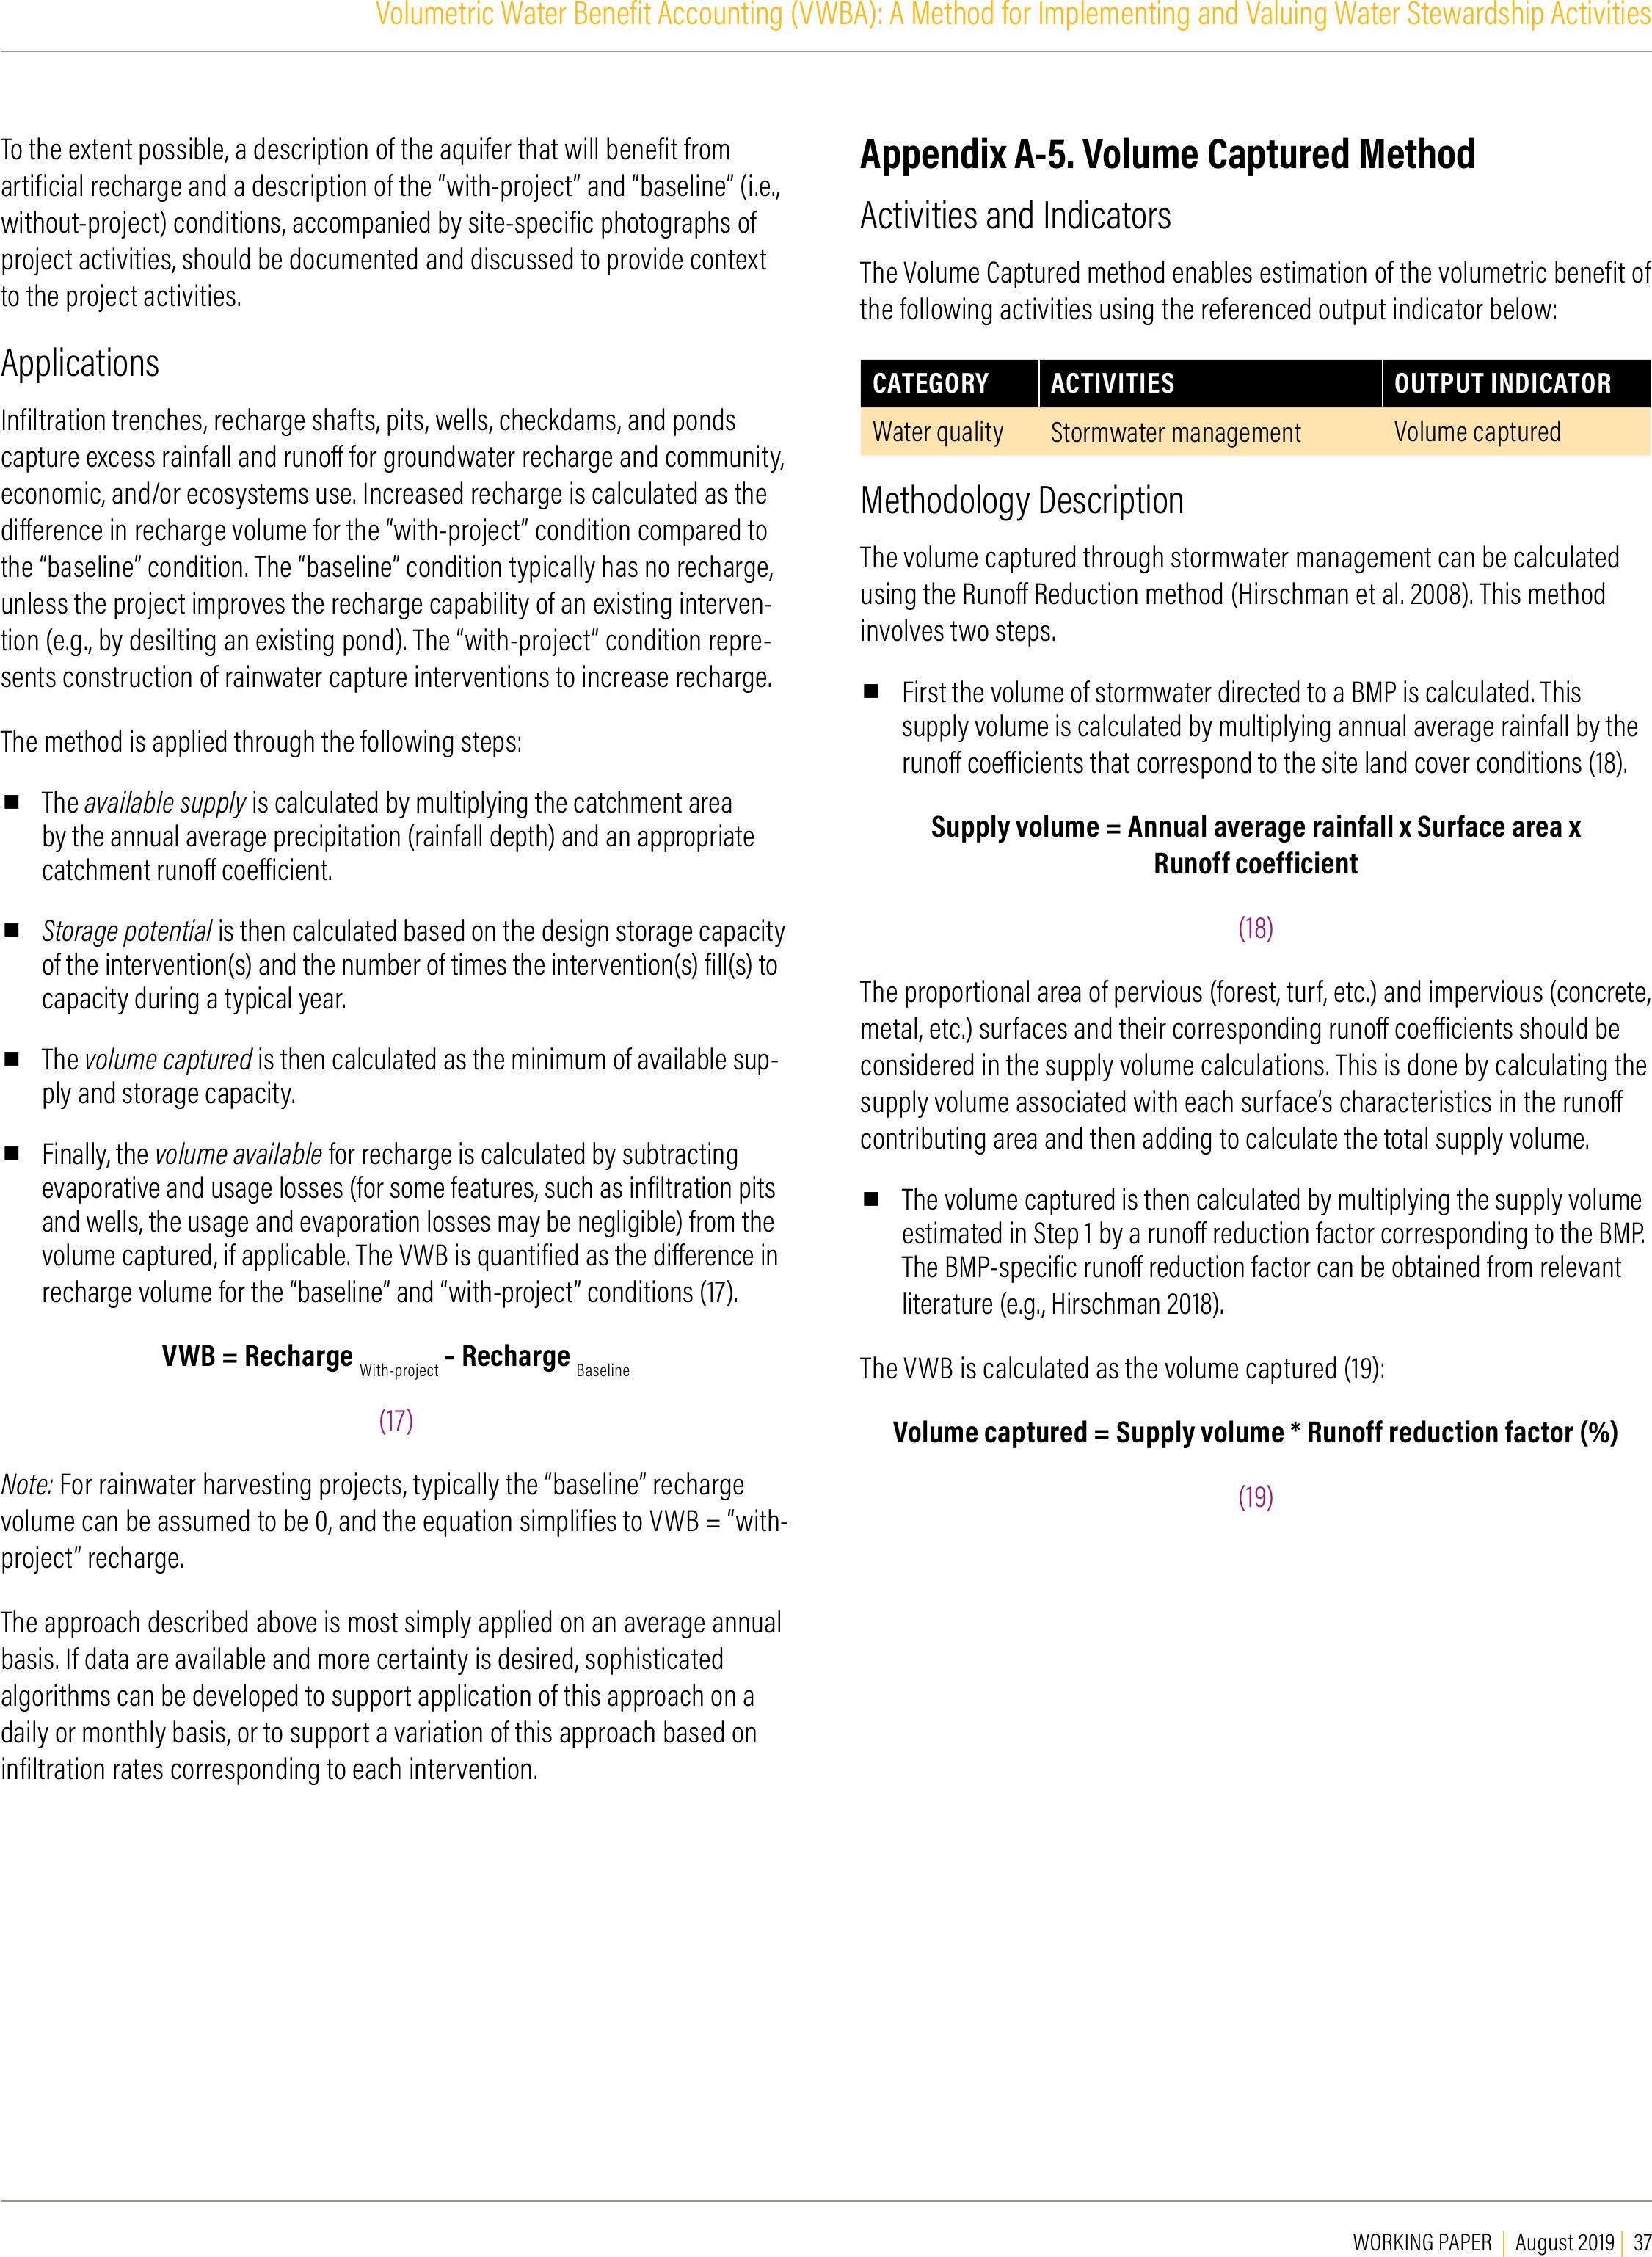
WORKING PAPER | August 2019 | 37
Volumetric Water Benefit Accounting (VWBA): A Method for Implementing and Valuing Water Stewardship Activities
To the extent possible, a description of the aquifer that will benefit from
artificial recharge and a description of the “with-project” and “baseline” (i.e.,
without-project) conditions, accompanied by site-specific photographs of
project activities, should be documented and discussed to provide context
to the project activities.
Applications
Infiltration trenches, recharge shafts, pits, wells, checkdams, and ponds
capture excess rainfall and runo for groundwater recharge and community,
economic, and/or ecosystems use. Increased recharge is calculated as the
dierence in recharge volume for the “with-project” condition compared to
the “baseline” condition. The “baseline” condition typically has no recharge,
unless the project improves the recharge capability of an existing interven-
tion (e.g., by desilting an existing pond). The “with-project” condition repre-
sents construction of rainwater capture interventions to increase recharge.
The method is applied through the following steps:
▪The available supply is calculated by multiplying the catchment area
by the annual average precipitation (rainfall depth) and an appropriate
catchment runo coeicient.
▪Storage potentialis then calculated based on the design storage capacity
of the intervention(s) and the number of times the intervention(s) fill(s) to
capacity during a typical year.
▪The volume captured is then calculated as the minimum of available sup-
ply and storage capacity.
▪Finally, the volume available for recharge is calculated by subtracting
evaporative and usage losses (for some features, such as infiltration pits
and wells, the usage and evaporation losses may be negligible) from the
volume captured, if applicable. The VWB is quantified as the dierence in
recharge volume for the “baseline” and “with-project” conditions (17).
VWB = Recharge With-project – Recharge Baseline
(17)
Note: For rainwater harvesting projects, typically the “baseline” recharge
volume can be assumed to be 0, and the equation simplifies to VWB = “with-
project” recharge.
The approach described above is most simply applied on an average annual
basis. If data are available and more certainty is desired, sophisticated
algorithms can be developed to support application of this approach on a
daily or monthly basis, or to support a variation of this approach based on
infiltration rates corresponding to each intervention.
Appendix A-5. Volume Captured Method
Activities and Indicators
The Volume Captured method enables estimation of the volumetric benefit of
the following activities using the referenced output indicator below:
CATEGORY ACTIVITIESOUTPUT INDICATOR
Water qualityStormwater managementVolume captured
Methodology Description
The volume captured through stormwater management can be calculated
using the Runo Reduction method (Hirschman et al. 2008). This method
involves two steps.
▪First the volume of stormwater directed to a BMP is calculated. This
supply volume is calculated by multiplying annual average rainfall by the
runo coeicients that correspond to the site land cover conditions (18).
Supply volume = Annual average rainfall x Surface area x
Runoff coefficient
(18)
The proportional area of pervious (forest, turf, etc.) and impervious (concrete,
metal, etc.) surfaces and their corresponding runo coeicients should be
considered in the supply volume calculations. This is done by calculating the
supply volume associated with each surface’s characteristics in the runo
contributing area and then adding to calculate the total supply volume.
▪The volume captured is then calculated by multiplying the supply volume
estimated in Step 1 by a runo reduction factor corresponding to the BMP.
The BMP-specific runo reduction factor can be obtained from relevant
literature (e.g., Hirschman 2018).
The VWB is calculated as the volume captured (19):
Volume captured = Supply volume * Runoff reduction factor (%)
(19)
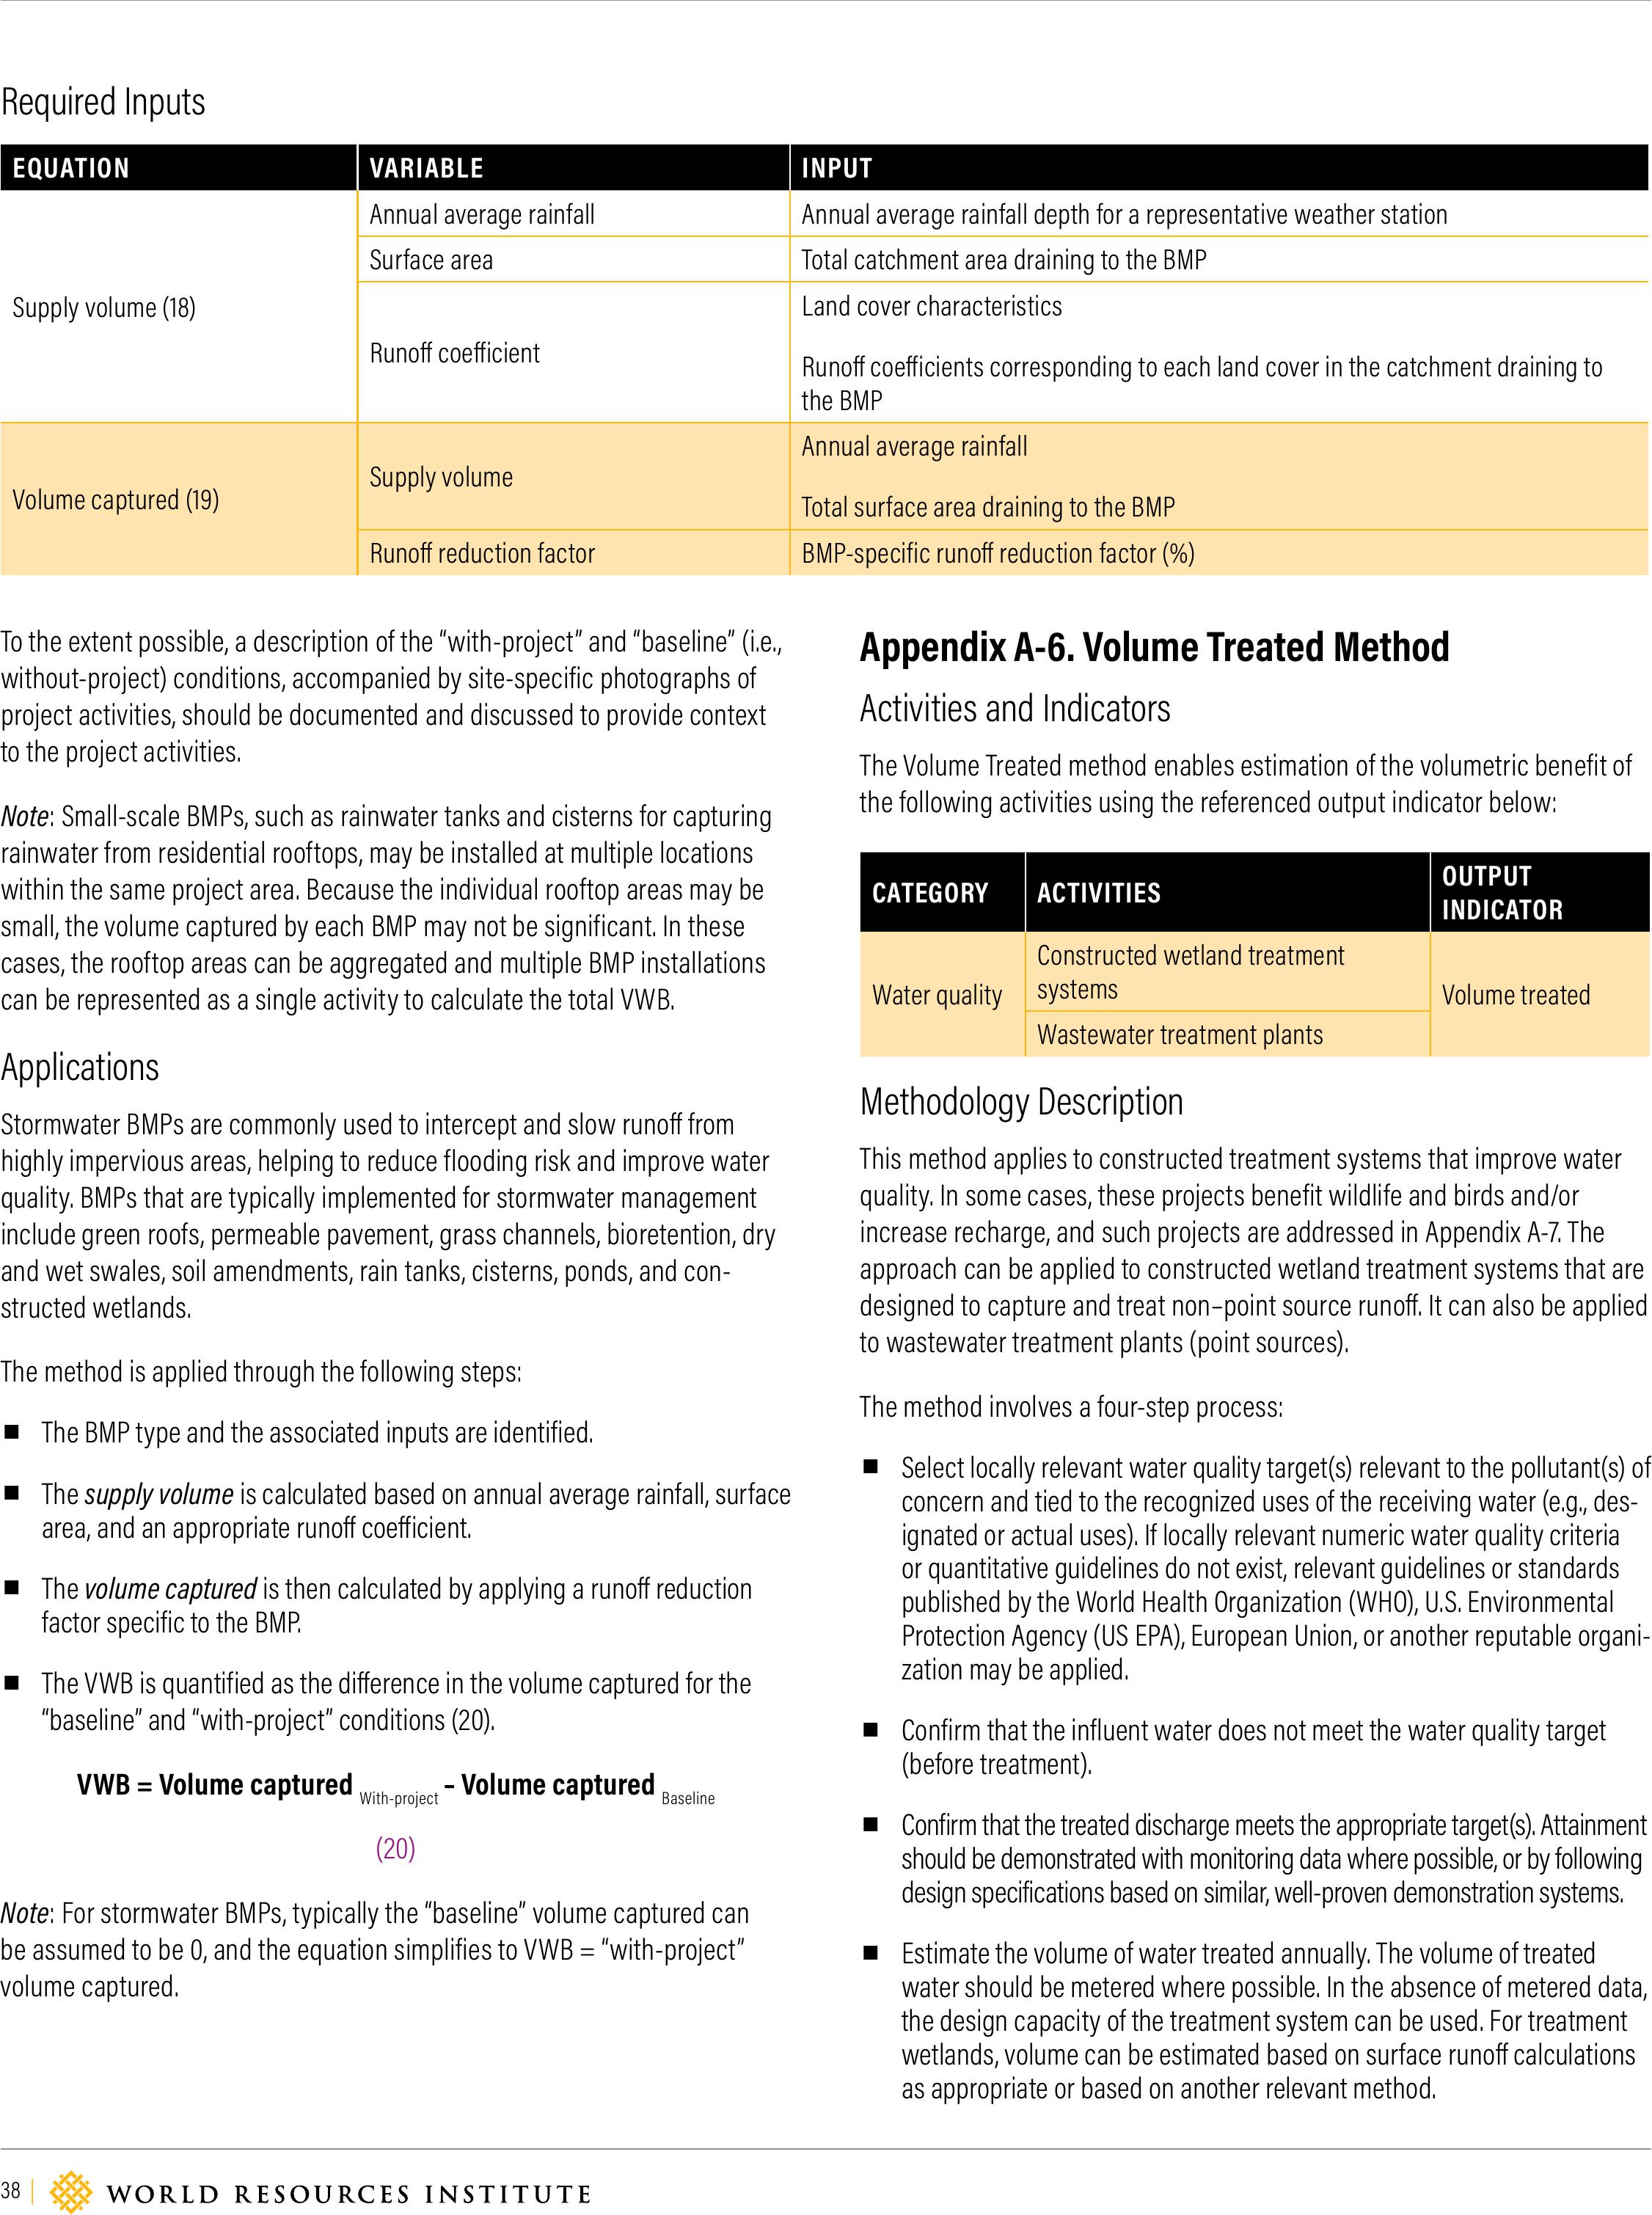
38 |
Required Inputs
EQUATION VARIABLE INPUT
Supply volume (18)
Annual average rainfallAnnual average rainfall depth for a representative weather station
Surface areaTotal catchment area draining to the BMP
Runo coeicient
Land cover characteristics
Runo coeicients corresponding to each land cover in the catchment draining to
the BMP
Volume captured (19)Supply volumeAnnual average rainfall
Total surface area draining to the BMP
Runo reduction factorBMP-specific runo reduction factor (%)
To the extent possible, a description of the “with-project” and “baseline” (i.e.,
without-project) conditions, accompanied by site-specific photographs of
project activities, should be documented and discussed to provide context
to the project activities.
Note: Small-scale BMPs, such as rainwater tanks and cisterns for capturing
rainwater from residential rooftops, may be installed at multiple locations
within the same project area. Because the individual rooftop areas may be
small, the volume captured by each BMP may not be significant. In these
cases, the rooftop areas can be aggregated and multiple BMP installations
can be represented as a single activity to calculate the total VWB.
Applications
Stormwater BMPs are commonly used to intercept and slow runo from
highly impervious areas, helping to reduce flooding risk and improve water
quality. BMPs that are typically implemented for stormwater management
include green roofs, permeable pavement, grass channels, bioretention, dry
and wet swales, soil amendments, rain tanks, cisterns, ponds, and con-
structed wetlands.
The method is applied through the following steps:
▪The BMP type and the associated inputs are identified.
▪The supplyvolume is calculated based on annual average rainfall, surface
area, and an appropriate runo coeicient.
▪The volume captured is then calculated by applying a runo reduction
factor specific to the BMP.
▪The VWB is quantified as the dierence in the volume captured for the
“baseline” and “with-project” conditions (20).
VWB = Volume captured With-project – Volume captured Baseline
(20)
Note: For stormwater BMPs, typically the “baseline” volume captured can
be assumed to be 0, and the equation simplifies to VWB = “with-project”
volume captured.
Appendix A-6. Volume Treated Method
Activities and Indicators
The Volume Treated method enables estimation of the volumetric benefit of
the following activities using the referenced output indicator below:
CATEGORY ACTIVITIESOUTPUT
INDICATOR
Water quality
Constructed wetland treatment
systems Volume treated
Wastewater treatment plants
Methodology Description
This method applies to constructed treatment systems that improve water
quality. In some cases, these projects benefit wildlife and birds and/or
increase recharge, and such projects are addressed in Appendix A-7. The
approach can be applied to constructed wetland treatment systems that are
designed to capture and treat non–point source runo. It can also be applied
to wastewater treatment plants (point sources).
The method involves a four-step process:
▪Select locally relevant water quality target(s) relevant to the pollutant(s) of
concern and tied to the recognized uses of the receiving water (e.g., des-
ignated or actual uses). If locally relevant numeric water quality criteria
or quantitative guidelines do not exist, relevant guidelines or standards
published by the World Health Organization (WHO), U.S. Environmental
Protection Agency (US EPA), European Union, or another reputable organi-
zation may be applied.
▪Confirm that the influent water does not meet the water quality target
(before treatment).
▪Confirm that the treated discharge meets the appropriate target(s). Attainment
should be demonstrated with monitoring data where possible, or by following
design specifications based on similar, well-proven demonstration systems.
▪Estimate the volume of water treated annually. The volume of treated
water should be metered where possible. In the absence of metered data,
the design capacity of the treatment system can be used. For treatment
wetlands, volume can be estimated based on surface runo calculations
as appropriate or based on another relevant method.
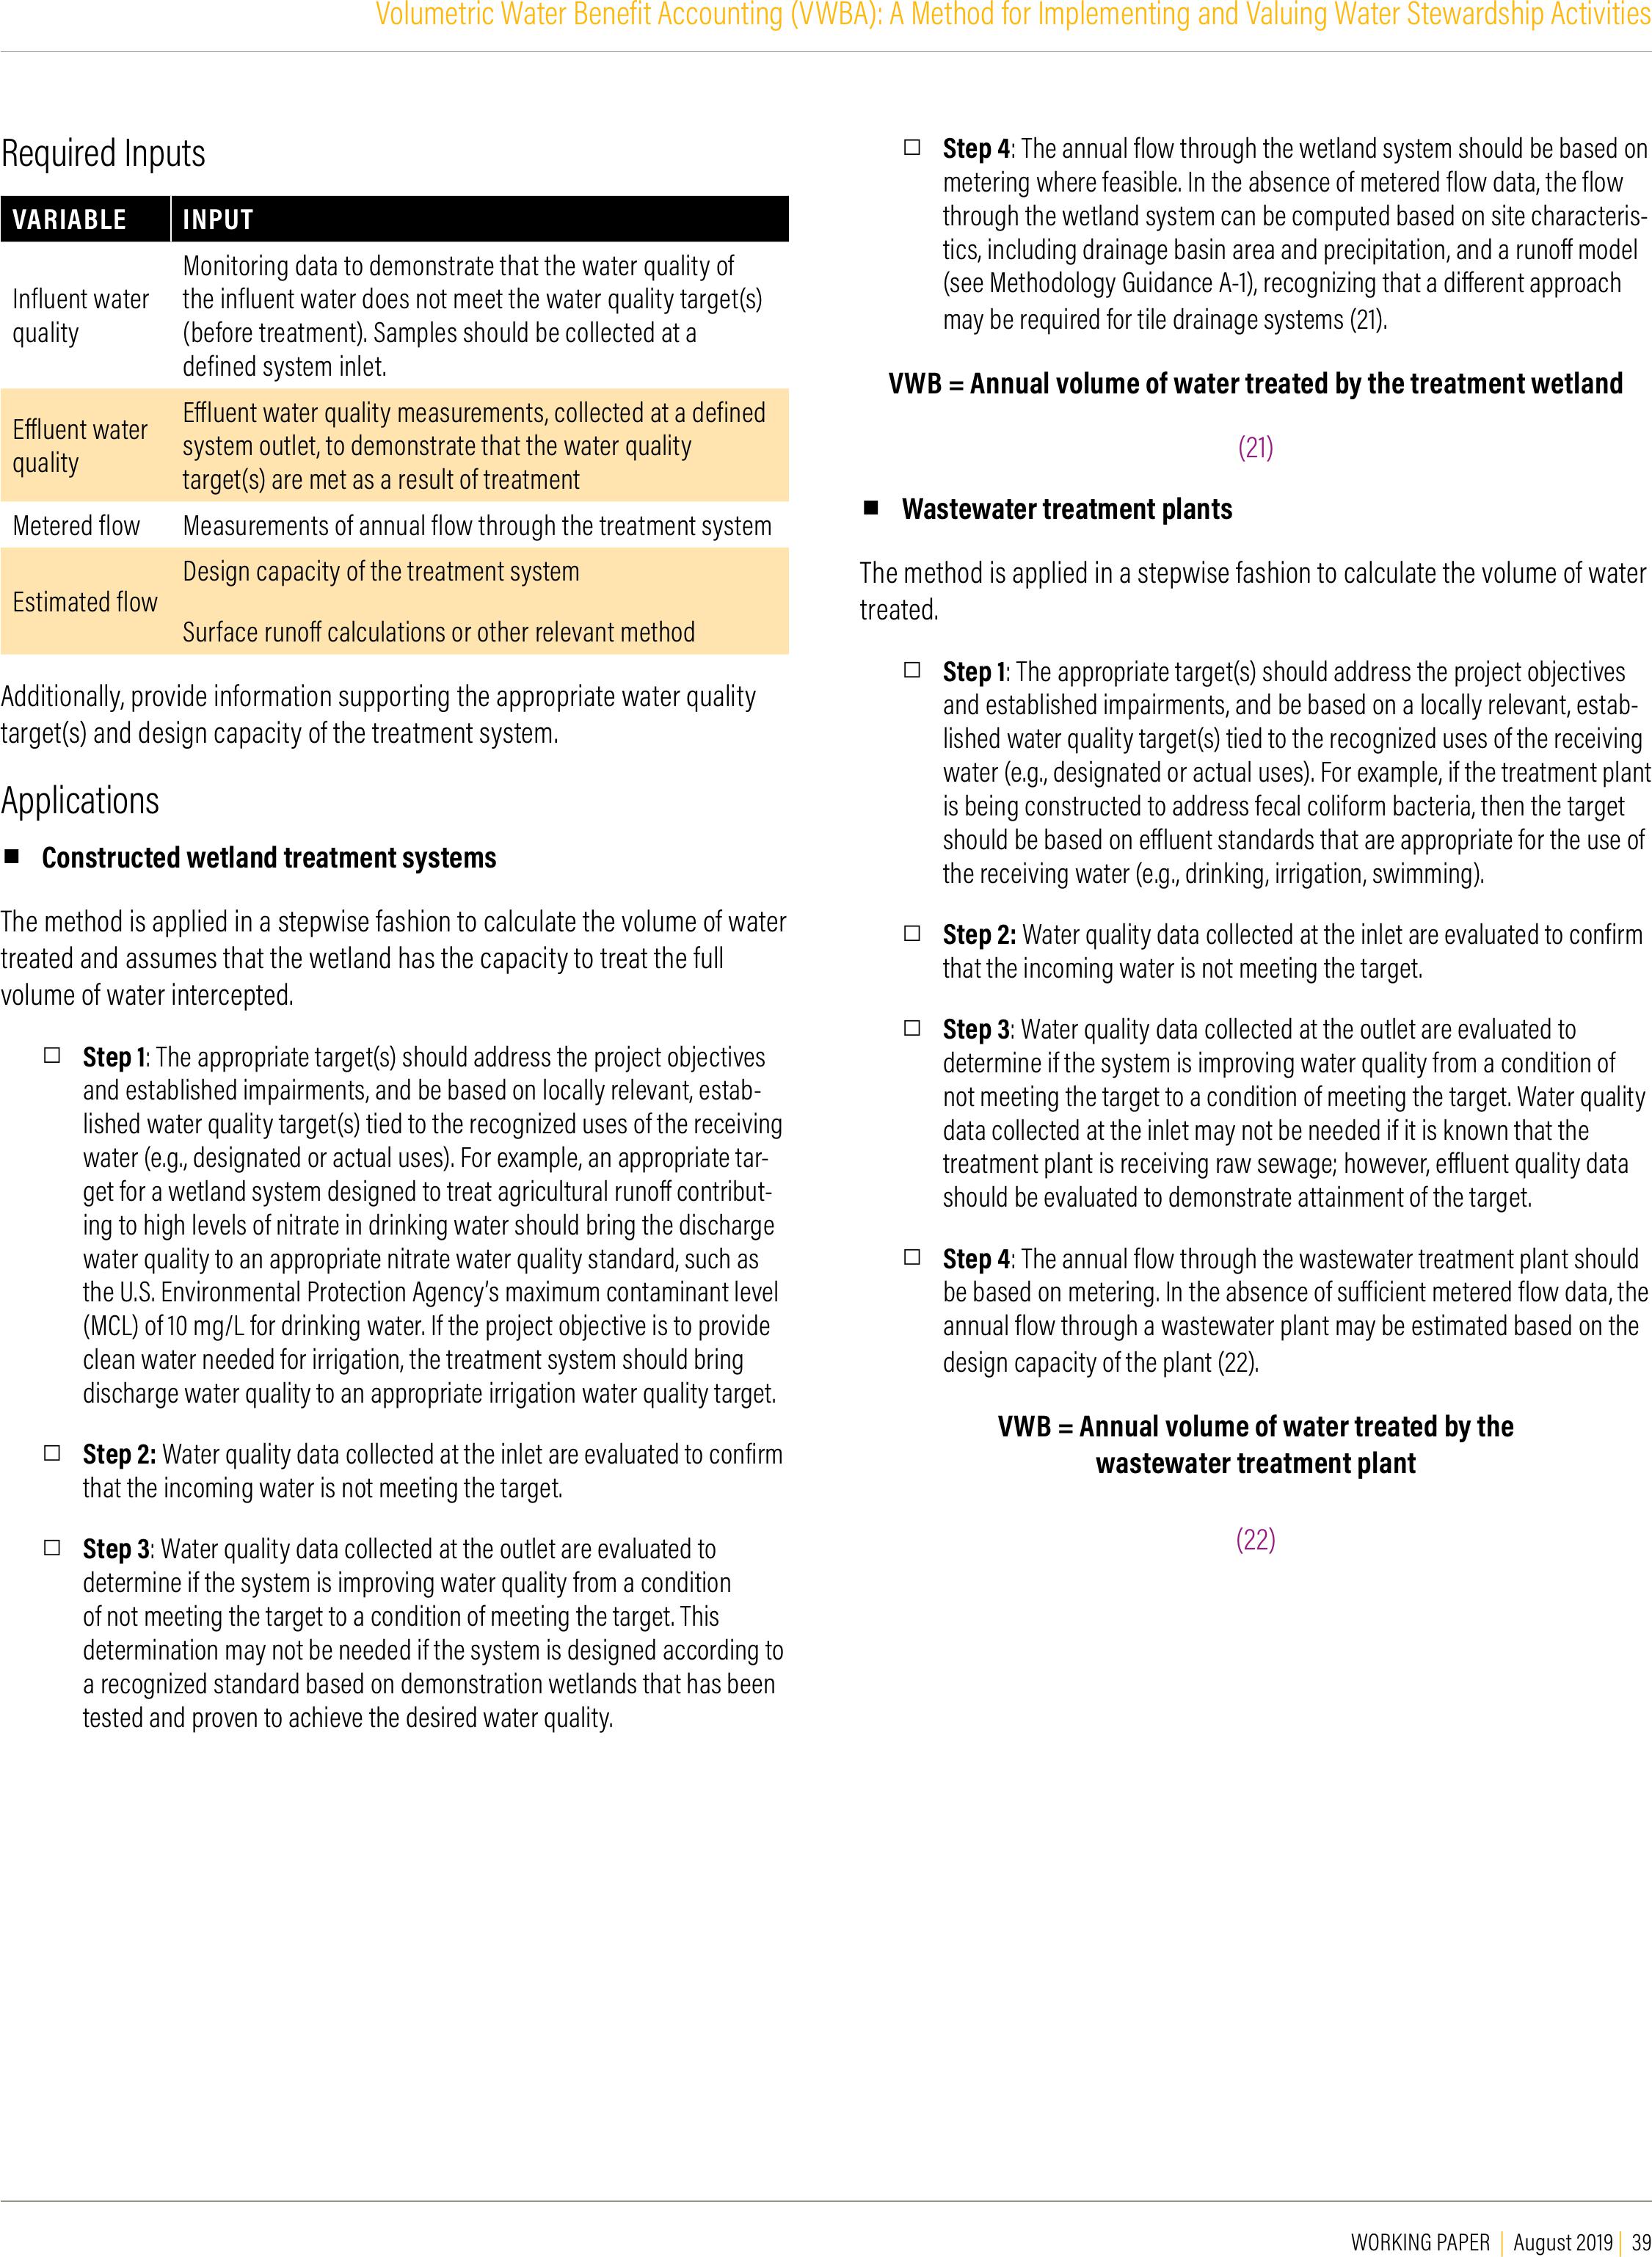
WORKING PAPER | August 2019 | 39
Volumetric Water Benefit Accounting (VWBA): A Method for Implementing and Valuing Water Stewardship Activities
Required Inputs
VARIABLE INPUT
Influent water
quality
Monitoring data to demonstrate that the water quality of
the influent water does not meet the water quality target(s)
(before treatment). Samples should be collected at a
defined system inlet.
Eluent water
quality
Eluent water quality measurements, collected at a defined
system outlet, to demonstrate that the water quality
target(s) are met as a result of treatment
Metered flowMeasurements of annual flow through the treatment system
Estimated flowDesign capacity of the treatment system
Surface runo calculations or other relevant method
Additionally, provide information supporting the appropriate water quality
target(s) and design capacity of the treatment system.
Applications
▪Constructed wetland treatment systems
The method is applied in a stepwise fashion to calculate the volume of water
treated and assumes that the wetland has the capacity to treat the full
volume of water intercepted.
□Step 1: The appropriate target(s) should address the project objectives
and established impairments, and be based on locally relevant, estab-
lished water quality target(s) tied to the recognized uses of the receiving
water (e.g., designated or actual uses). For example, an appropriate tar-
get for a wetland system designed to treat agricultural runo contribut-
ing to high levels of nitrate in drinking water should bring the discharge
water quality to an appropriate nitrate water quality standard, such as
the U.S. Environmental Protection Agency’s maximum contaminant level
(MCL) of 10 mg/L for drinking water. If the project objective is to provide
clean water needed for irrigation, the treatment system should bring
discharge water quality to an appropriate irrigation water quality target.
□Step 2: Water quality data collected at the inlet are evaluated to confirm
that the incoming water is not meeting the target.
□Step 3: Water quality data collected at the outlet are evaluated to
determine if the system is improving water quality from a condition
of not meeting the target to a condition of meeting the target. This
determination may not be needed if the system is designed according to
a recognized standard based on demonstration wetlands that has been
tested and proven to achieve the desired water quality.
□Step 4: The annual flow through the wetland system should be based on
metering where feasible. In the absence of metered flow data, the flow
through the wetland system can be computed based on site characteris-
tics, including drainage basin area and precipitation, and a runo model
(see Methodology Guidance A-1), recognizing that a dierent approach
may be required for tile drainage systems (21).
VWB = Annual volume of water treated by the treatment wetland
(21)
▪Wastewater treatment plants
The method is applied in a stepwise fashion to calculate the volume of water
treated.
□Step 1: The appropriate target(s) should address the project objectives
and established impairments, and be based on a locally relevant, estab-
lished water quality target(s) tied to the recognized uses of the receiving
water (e.g., designated or actual uses). For example, if the treatment plant
is being constructed to address fecal coliform bacteria, then the target
should be based on eluent standards that are appropriate for the use of
the receiving water (e.g., drinking, irrigation, swimming).
□Step 2: Water quality data collected at the inlet are evaluated to confirm
that the incoming water is not meeting the target.
□Step 3: Water quality data collected at the outlet are evaluated to
determine if the system is improving water quality from a condition of
not meeting the target to a condition of meeting the target. Water quality
data collected at the inlet may not be needed if it is known that the
treatment plant is receiving raw sewage; however, eluent quality data
should be evaluated to demonstrate attainment of the target.
□Step 4: The annual flow through the wastewater treatment plant should
be based on metering. In the absence of suicient metered flow data, the
annual flow through a wastewater plant may be estimated based on the
design capacity of the plant (22).
VWB = Annual volume of water treated by the
wastewater treatment plant
(22)
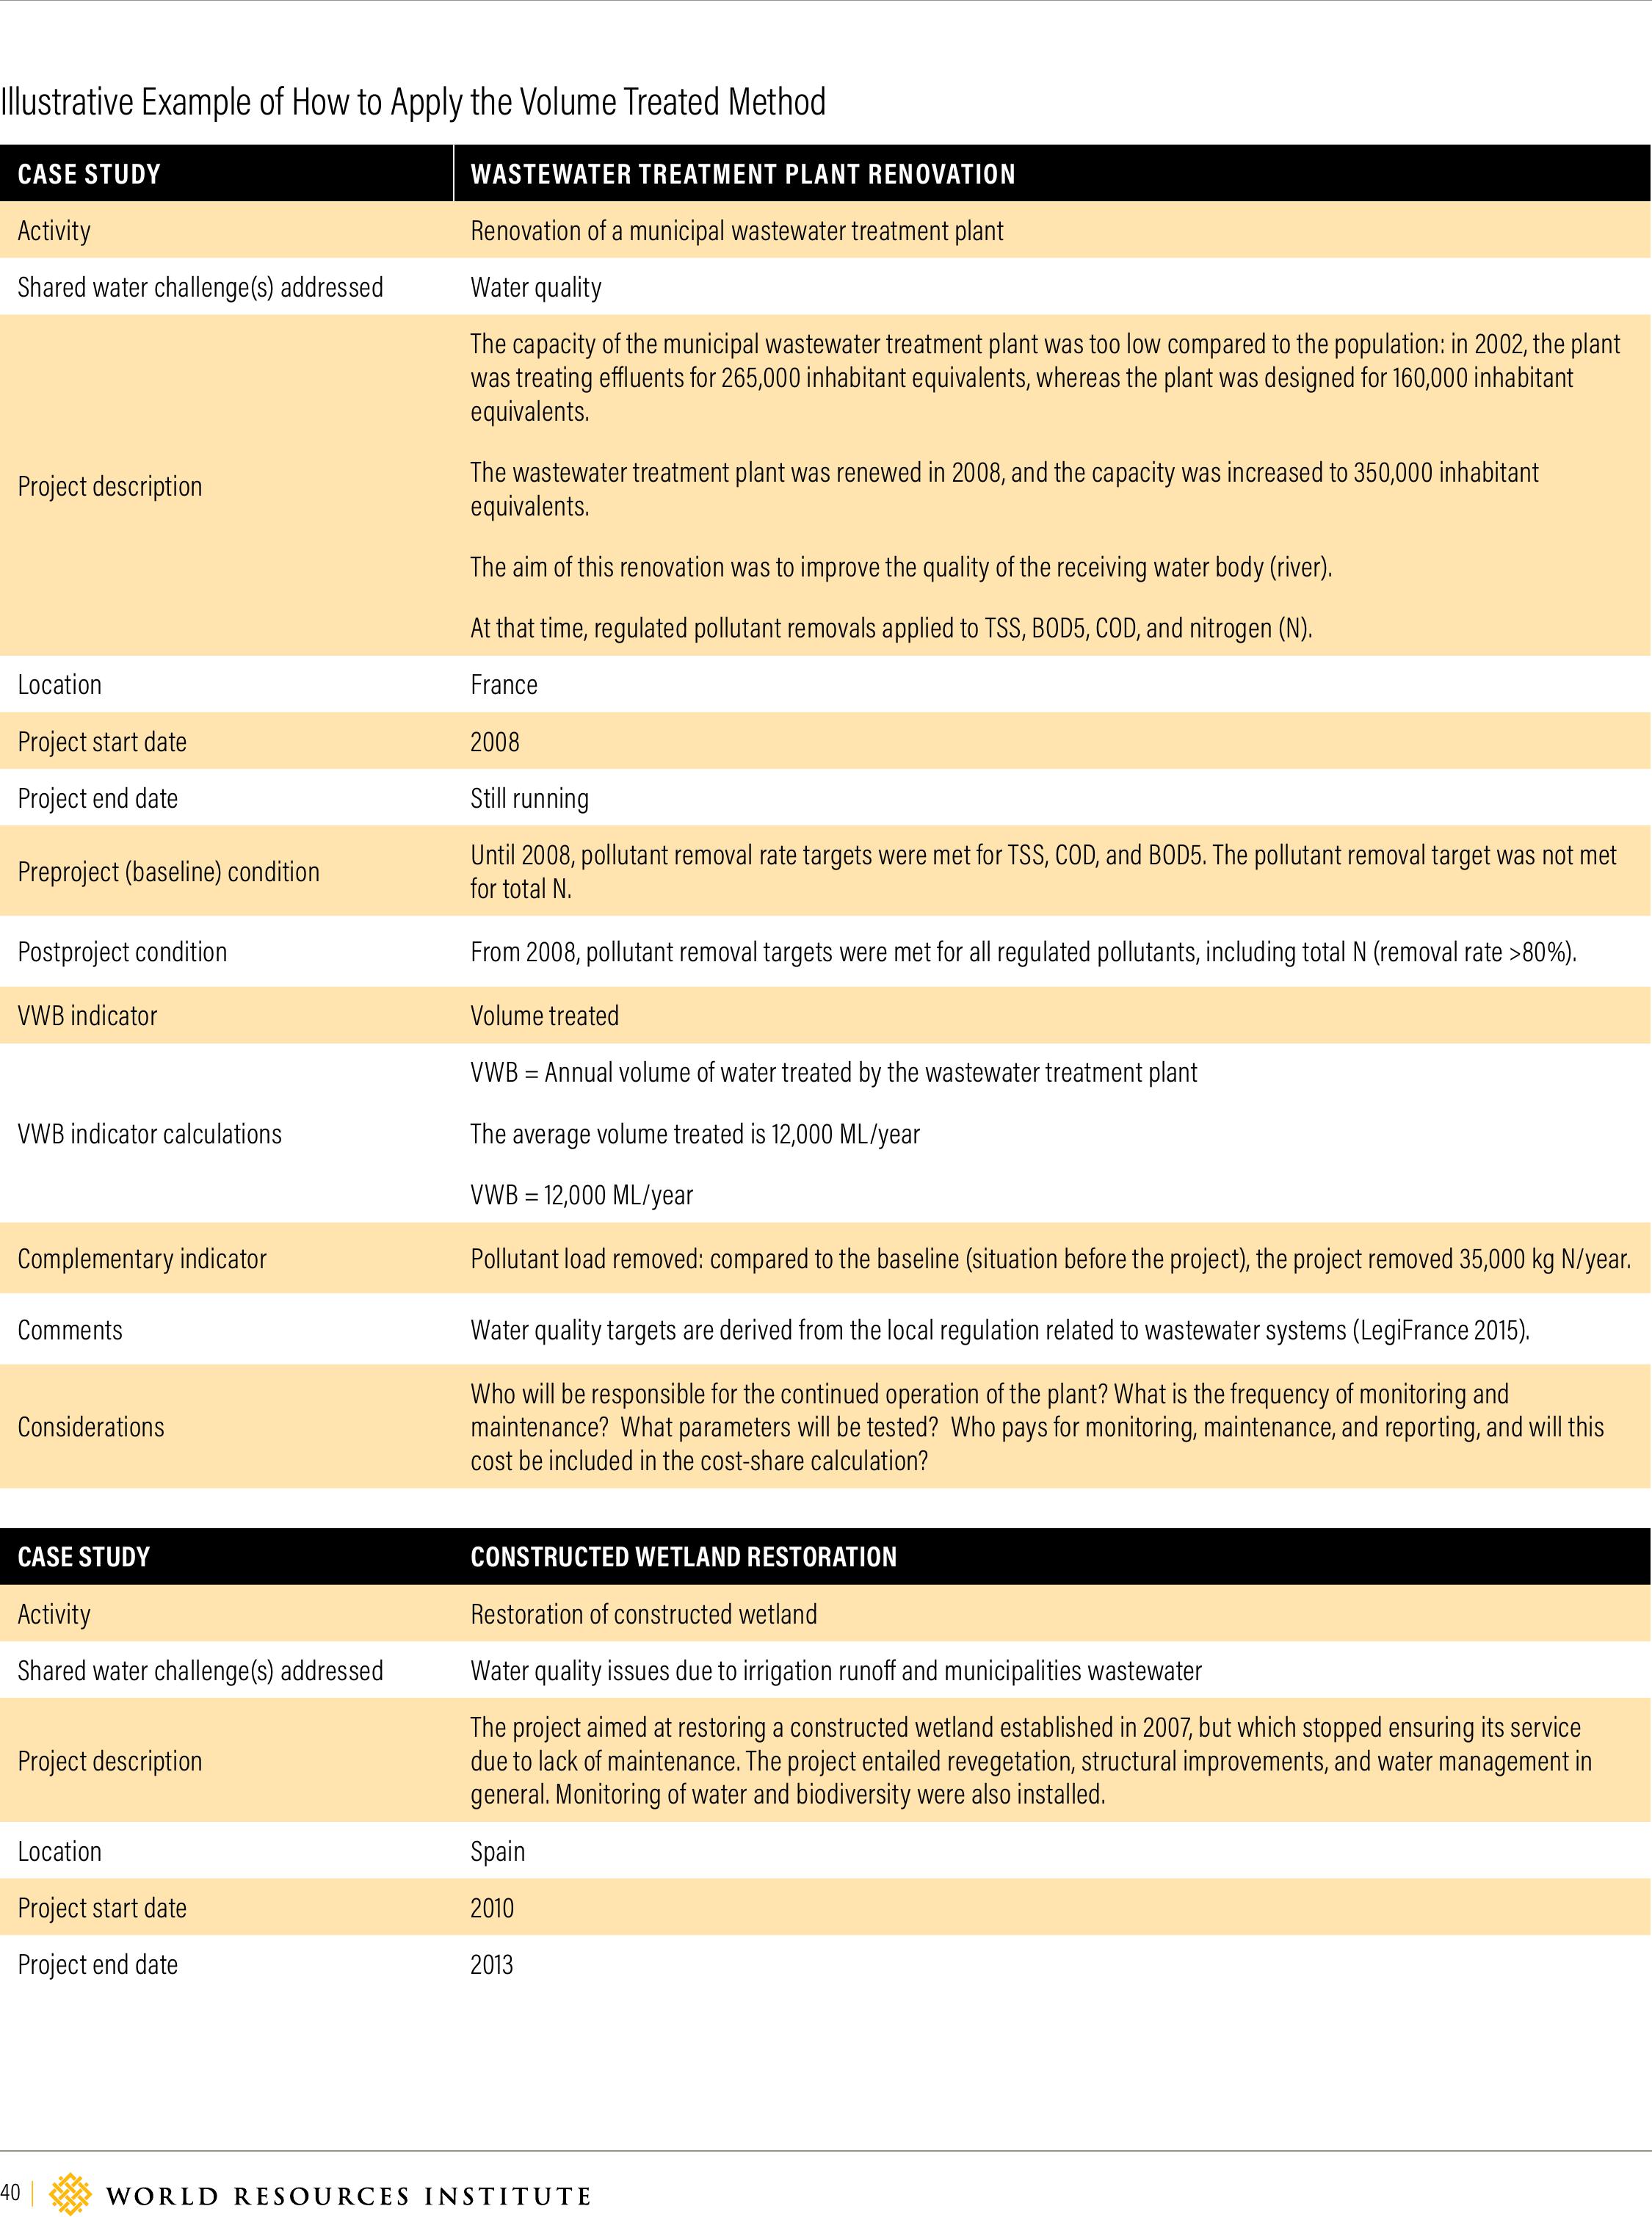
40 |
Illustrative Example of How to Apply the Volume Treated Method
CASE STUDYWASTEWATER TREATMENT PLANT RENOVATION
Activity Renovation of a municipal wastewater treatment plant
Shared water challenge(s) addressed Water quality
Project description
The capacity of the municipal wastewater treatment plant was too low compared to the population: in 2002, the plant
was treating eluents for 265,000 inhabitant equivalents, whereas the plant was designed for 160,000 inhabitant
equivalents.
The wastewater treatment plant was renewed in 2008, and the capacity was increased to 350,000 inhabitant
equivalents.
The aim of this renovation was to improve the quality of the receiving water body (river).
At that time, regulated pollutant removals applied to TSS, BOD5, COD, and nitrogen (N).
Location France
Project start date2008
Project end dateStill running
Preproject (baseline) conditionUntil 2008, pollutant removal rate targets were met for TSS, COD, and BOD5. The pollutant removal target was not met
for total N.
Postproject conditionFrom 2008, pollutant removal targets were met for all regulated pollutants, including total N (removal rate >80%).
VWB indicatorVolume treated
VWB indicator calculations
VWB = Annual volume of water treated by the wastewater treatment plant
The average volume treated is 12,000 ML/year
VWB = 12,000 ML/year
Complementary indicatorPollutant load removed: compared to the baseline (situation before the project), the project removed 35,000 kg N/year.
Comments Water quality targets are derived from the local regulation related to wastewater systems (LegiFrance 2015).
Considerations
Who will be responsible for the continued operation of the plant? What is the frequency of monitoring and
maintenance? What parameters will be tested? Who pays for monitoring, maintenance, and reporting,and will this
cost be included in the cost-share calculation?
CASE STUDYCONSTRUCTED WETLAND RESTORATION
Activity Restoration of constructed wetland
Shared water challenge(s) addressed Water quality issues due to irrigation runo and municipalities wastewater
Project description
The project aimed at restoring a constructed wetland established in 2007, but which stopped ensuring its service
due to lack of maintenance. The project entailed revegetation, structural improvements, and water management in
general. Monitoring of water and biodiversity were also installed.
Location Spain
Project start date2010
Project end date2013
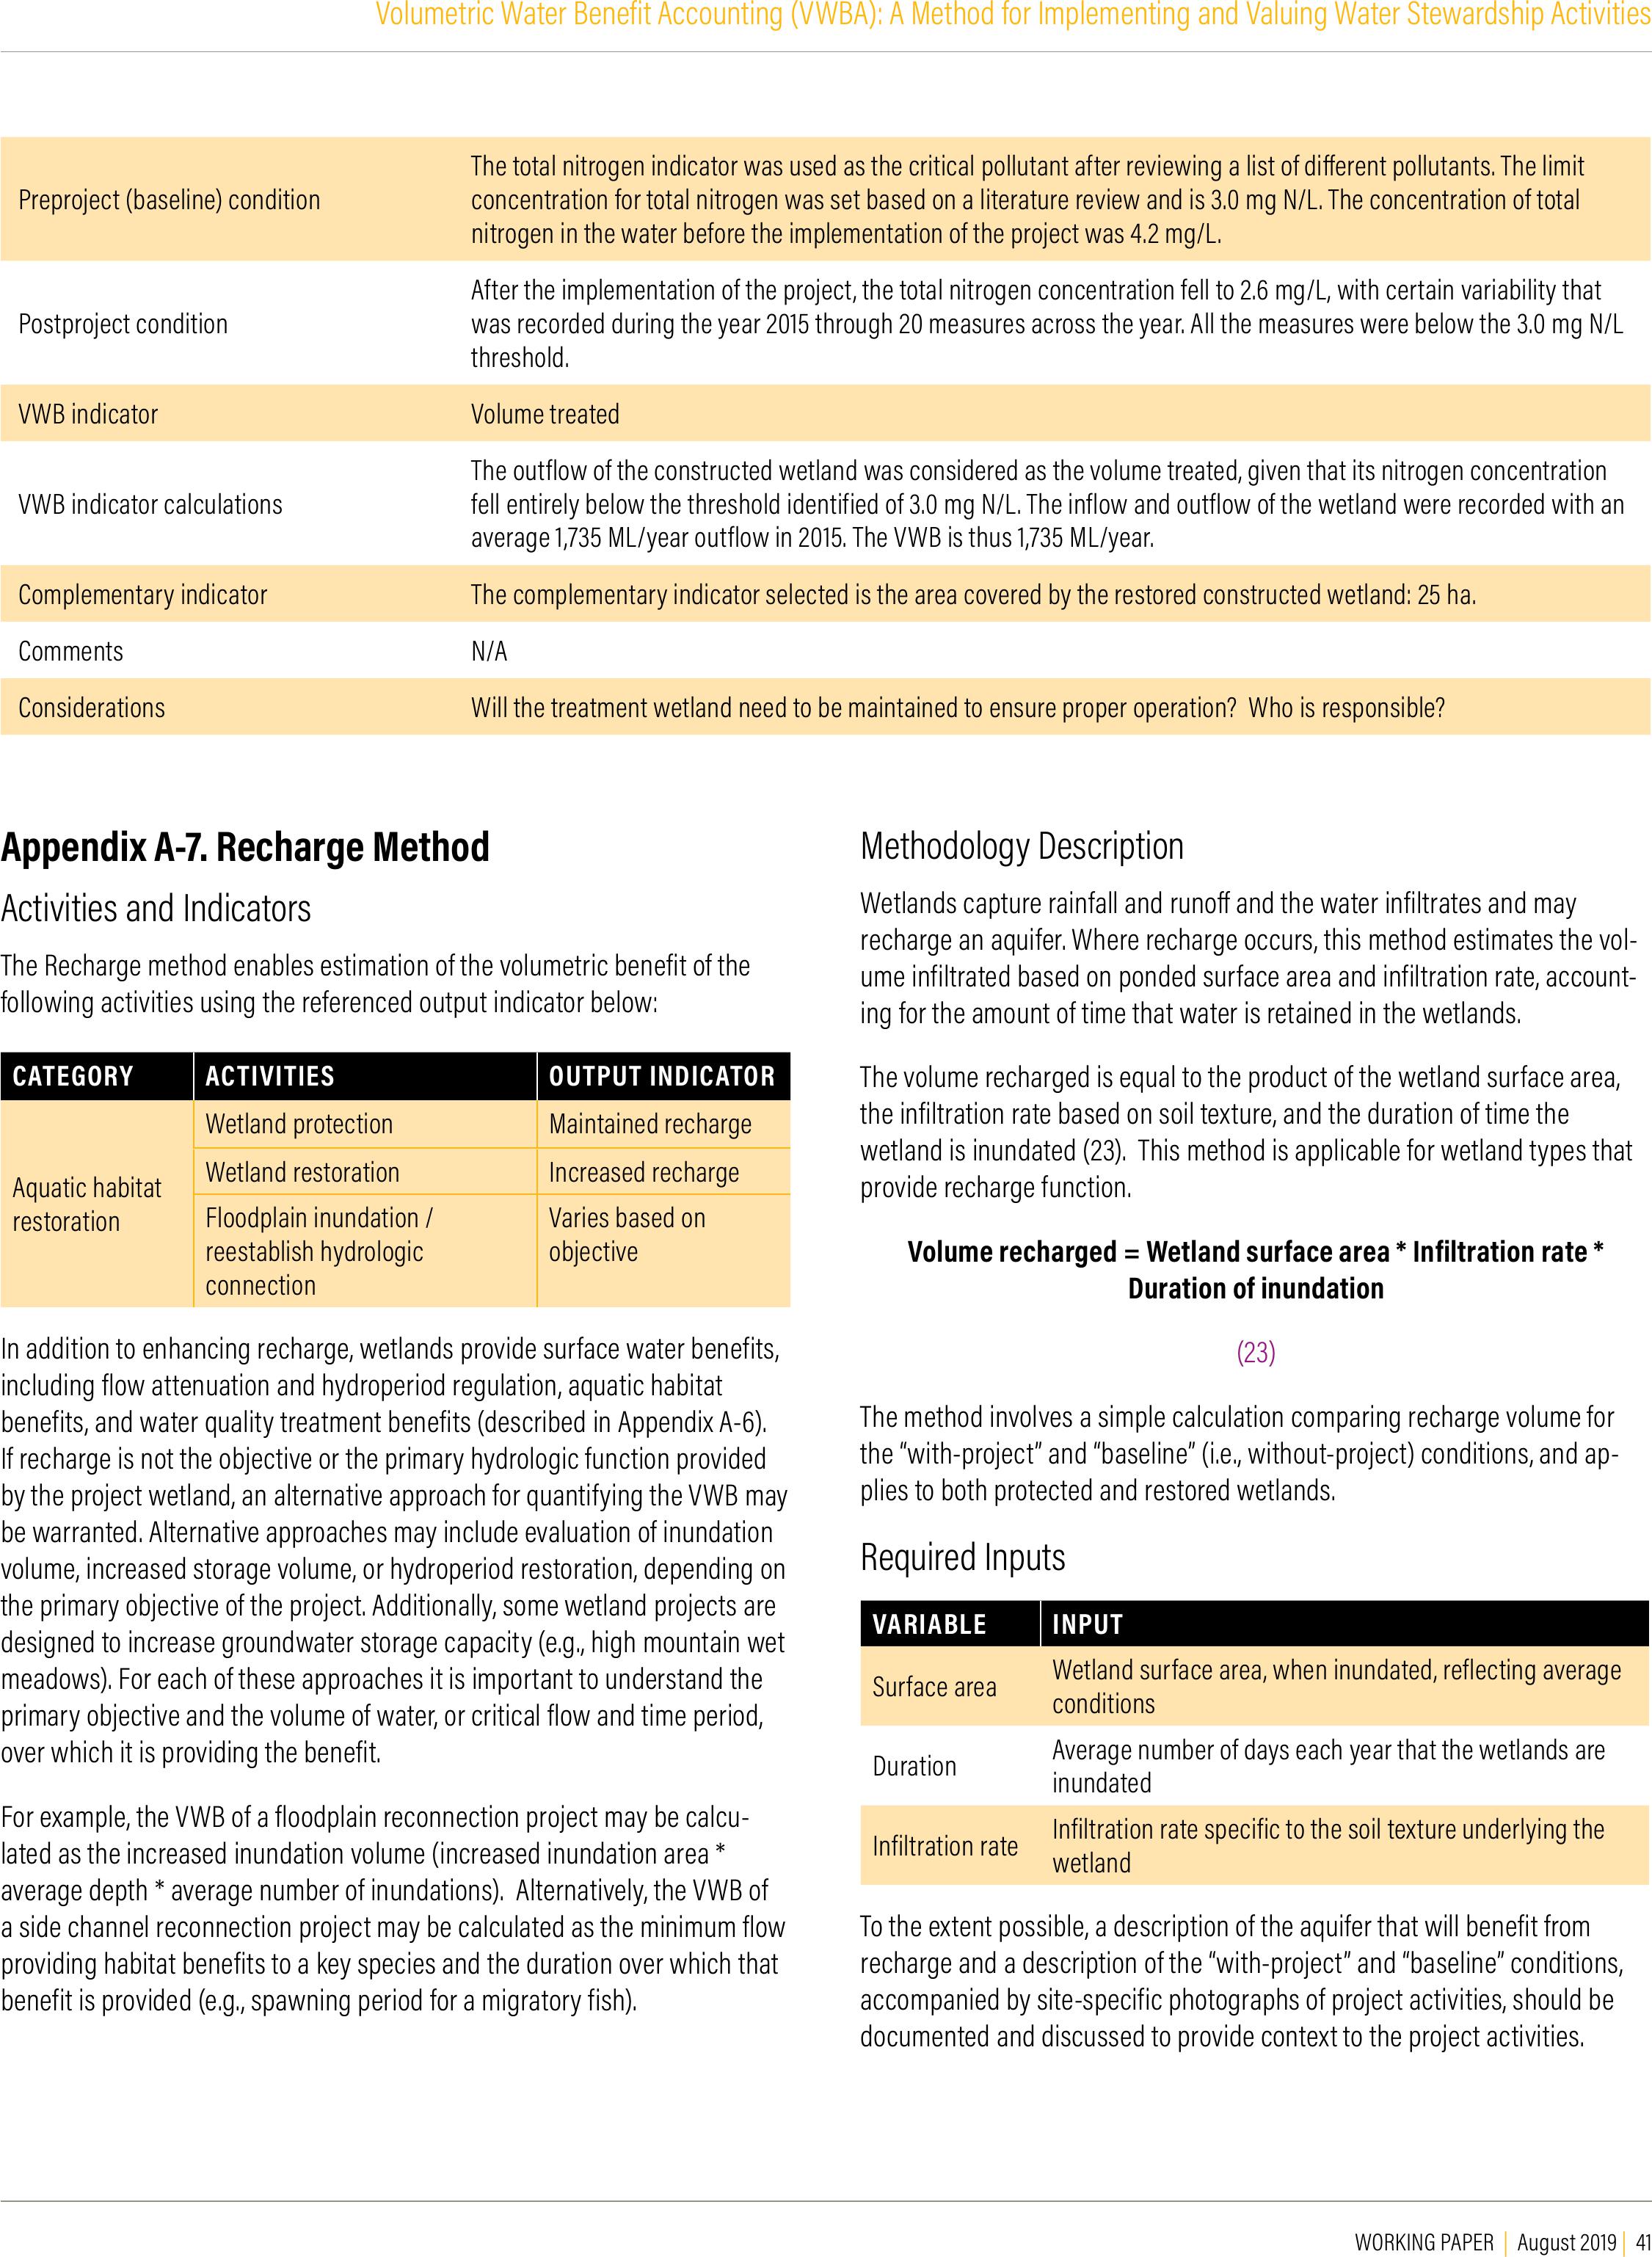
WORKING PAPER | August 2019 | 41
Volumetric Water Benefit Accounting (VWBA): A Method for Implementing and Valuing Water Stewardship Activities
Preproject (baseline) condition
The total nitrogen indicator was used as the critical pollutant after reviewing a list of dierent pollutants. The limit
concentration for total nitrogen was set based on a literature review and is 3.0 mg N/L. The concentration of total
nitrogen in the water before the implementation of the project was 4.2 mg/L.
Postproject condition
After the implementation of the project, the total nitrogen concentration fell to 2.6 mg/L, with certain variability that
was recorded during the year 2015 through 20 measures across the year. All the measures were below the 3.0 mg N/L
threshold.
VWB indicatorVolume treated
VWB indicator calculations
The outflow of the constructed wetland was considered as the volume treated, given that its nitrogen concentration
fell entirely below the threshold identified of 3.0 mg N/L. The inflow and outflow of the wetland were recorded with an
average 1,735 ML/year outflow in 2015. The VWB is thus 1,735 ML/year.
Complementary indicatorThe complementary indicator selected is the area covered by the restored constructed wetland: 25 ha.
Comments N/A
Considerations Will the treatment wetland need to be maintained to ensure proper operation? Who is responsible?
Appendix A-7. Recharge Method
Activities and Indicators
The Recharge method enables estimation of the volumetric benefit of the
following activities using the referenced output indicator below:
CATEGORY ACTIVITIESOUTPUT INDICATOR
Aquatic habitat
restoration
Wetland protectionMaintained recharge
Wetland restoration Increased recharge
Floodplain inundation /
reestablish hydrologic
connection
Varies based on
objective
In addition to enhancing recharge, wetlands provide surface water benefits,
including flow attenuation and hydroperiod regulation, aquatic habitat
benefits, and water quality treatment benefits (described in Appendix A-6).
If recharge is not the objective or the primary hydrologic function provided
by the project wetland, an alternative approach for quantifying the VWB may
be warranted. Alternative approaches may include evaluation of inundation
volume, increased storage volume, or hydroperiod restoration, depending on
the primary objective of the project. Additionally, some wetland projects are
designed to increase groundwater storage capacity (e.g., high mountain wet
meadows). For each of these approaches it is important to understand the
primary objective and the volume of water, or critical flow and time period,
over which it is providing the benefit.
For example, the VWB of a floodplain reconnection project may be calcu-
lated as the increased inundation volume (increased inundation area *
average depth * average number of inundations). Alternatively, the VWB of
a side channel reconnection project may be calculated as the minimum flow
providing habitat benefits to a key species and the duration over which that
benefit is provided (e.g., spawning period for a migratory fish).
Methodology Description
Wetlands capture rainfall and runo and the water infiltrates and may
recharge an aquifer. Where recharge occurs, this method estimates the vol-
ume infiltrated based on ponded surface area and infiltration rate, account-
ing for the amount of time that water is retained in the wetlands.
The volume recharged is equal to the product of the wetland surface area,
the infiltration rate based on soil texture, and the duration of time the
wetland is inundated (23). This method is applicable for wetland types that
provide recharge function.
Volume recharged = Wetland surface area * Infiltration rate *
Duration of inundation
(23)
The method involves a simple calculation comparing recharge volume for
the “with-project” and “baseline” (i.e., without-project) conditions, and ap-
plies to both protected and restored wetlands.
Required Inputs
VARIABLE INPUT
Surface areaWetland surface area, when inundated, reflecting average
conditions
Duration Average number of days each year that the wetlands are
inundated
Infiltration rateInfiltration rate specific to the soil texture underlying the
wetland
To the extent possible, a description of the aquifer that will benefit from
recharge and a description of the “with-project” and “baseline” conditions,
accompanied by site-specific photographs of project activities, should be
documented and discussed to provide context to the project activities.
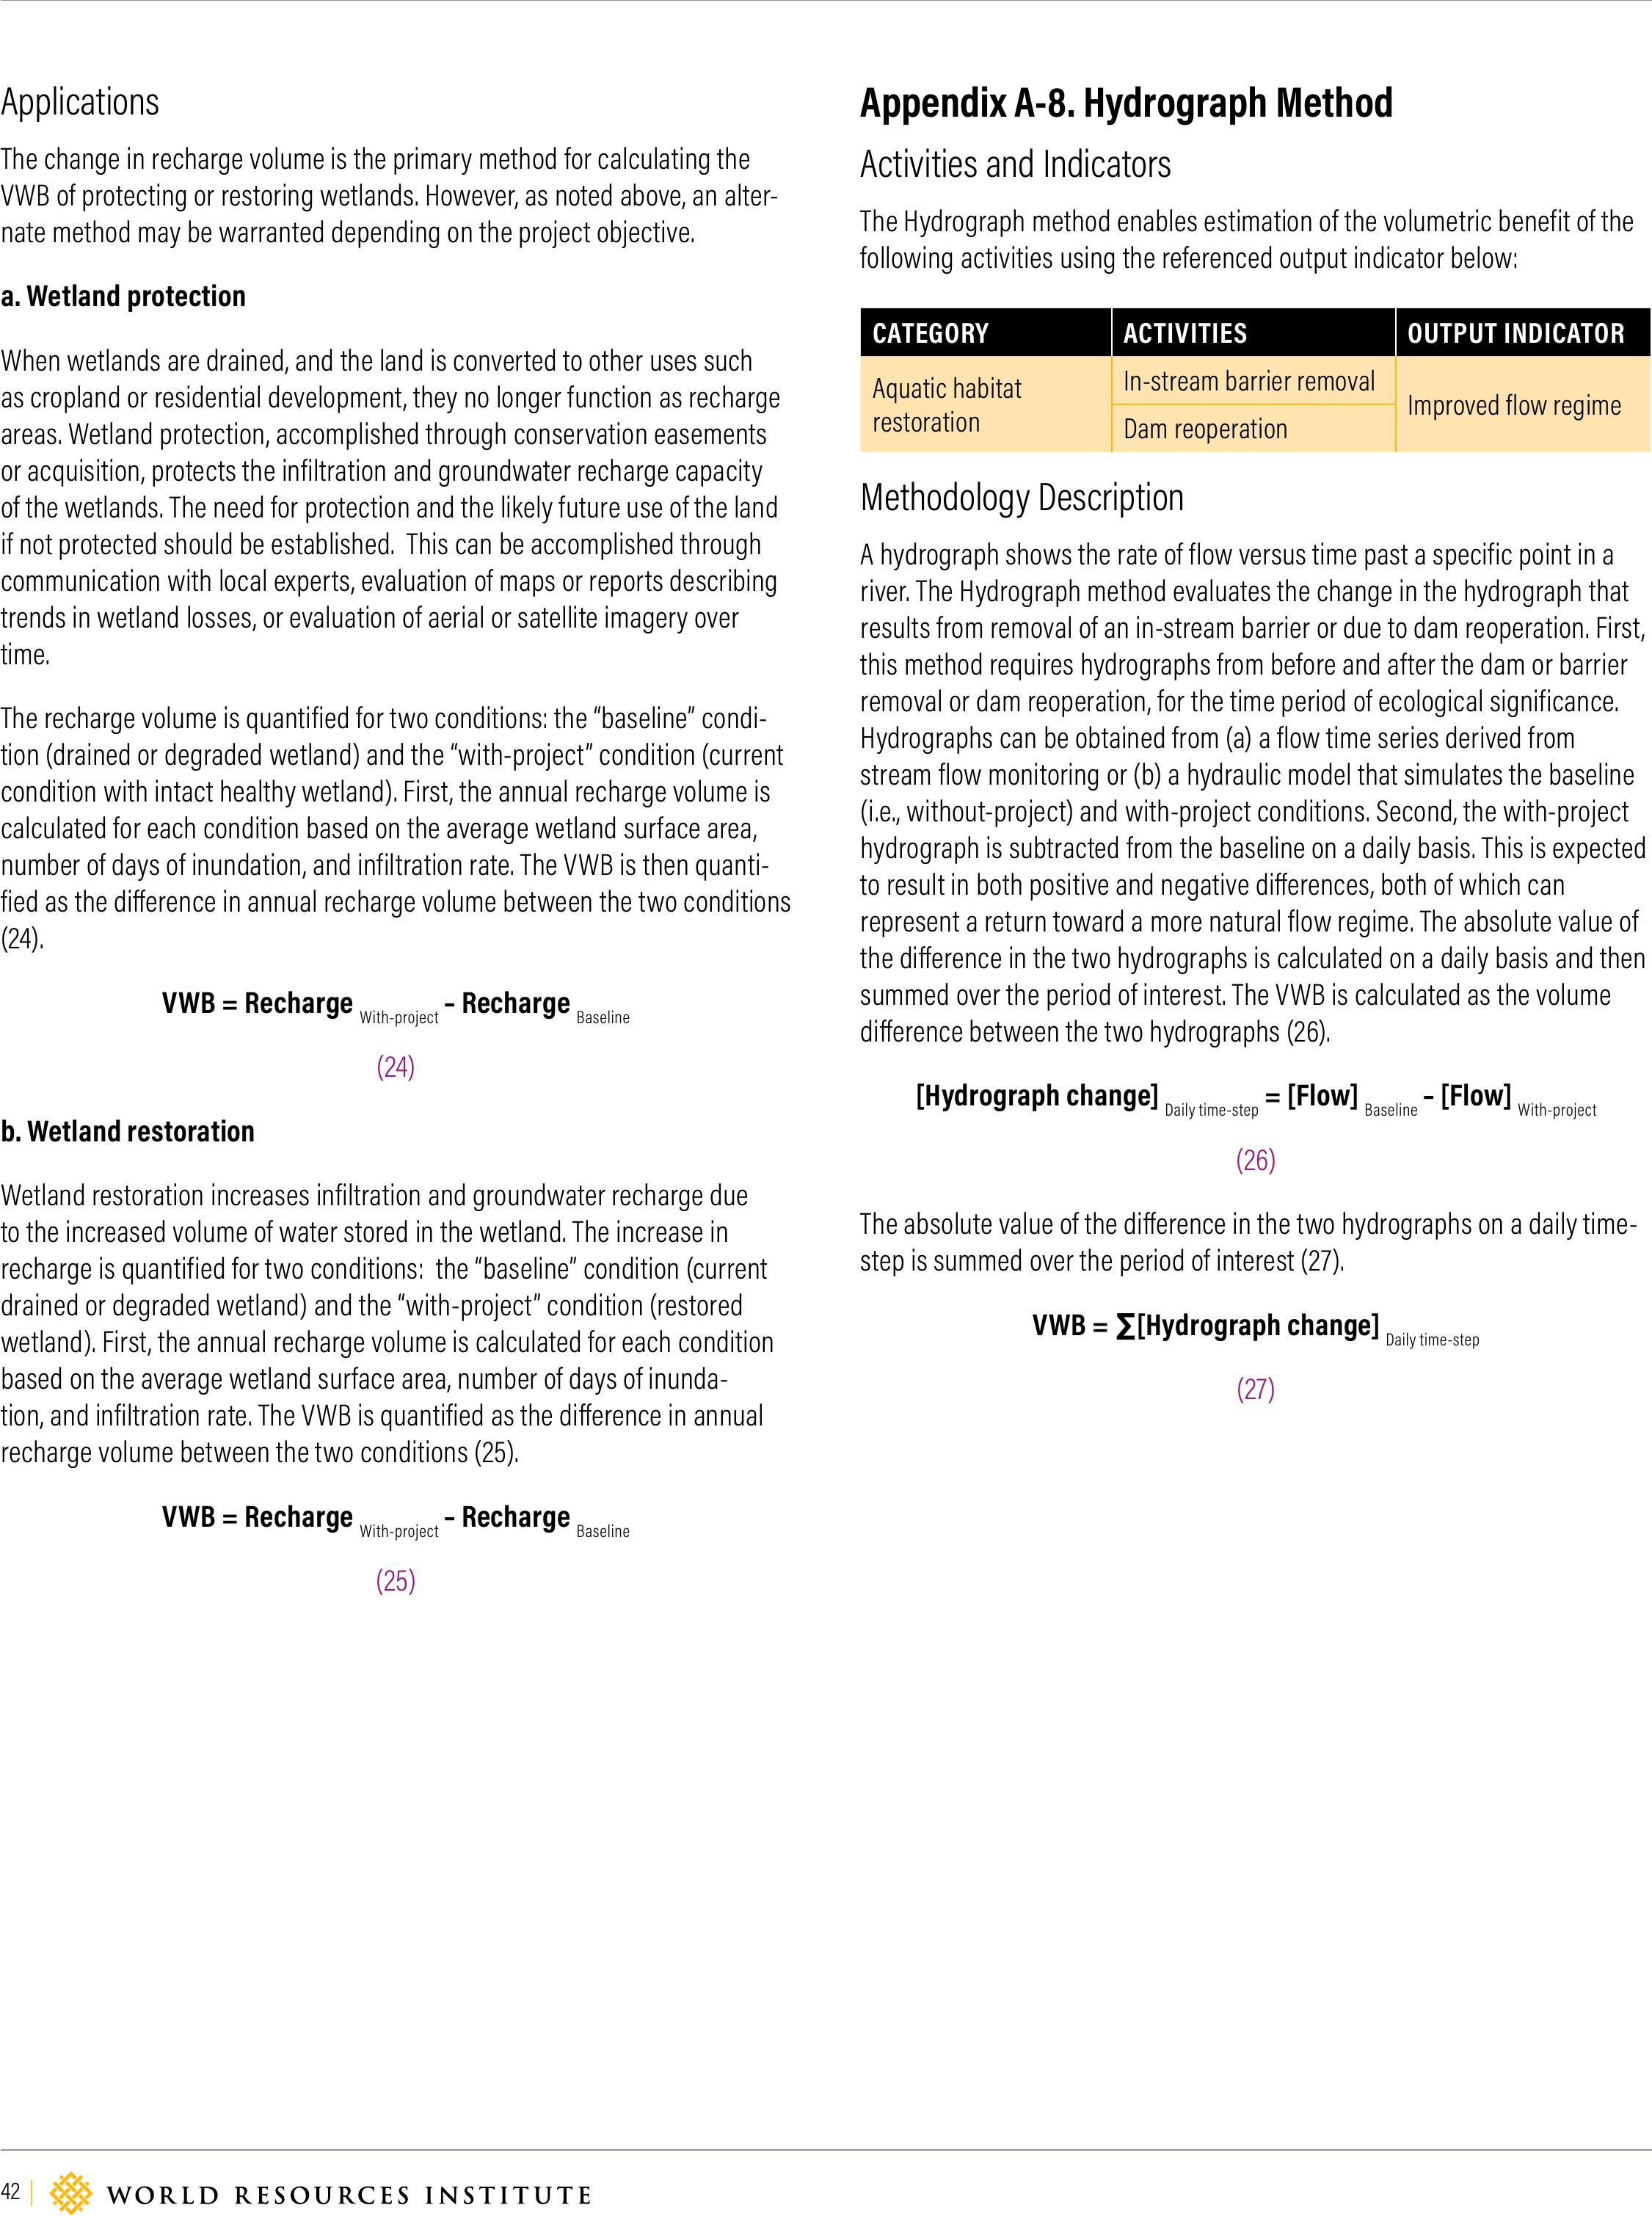
42 |
Applications
The change in recharge volume is the primary method for calculating the
VWB of protecting or restoring wetlands. However, as noted above, an alter-
nate method may be warranted depending on the project objective.
a. Wetland protection
When wetlands are drained, and the land is converted to other uses such
as cropland or residential development, they no longer function as recharge
areas. Wetland protection, accomplished through conservation easements
or acquisition, protects the infiltration and groundwater recharge capacity
of the wetlands. The need for protection and the likely future use of the land
if not protected should be established. This can be accomplished through
communication with local experts, evaluation of maps or reports describing
trends in wetland losses, or evaluation of aerial or satellite imagery over
time.
The recharge volume is quantified for two conditions: the “baseline” condi-
tion (drained or degraded wetland) and the “with-project” condition (current
condition with intact healthy wetland). First, the annual recharge volume is
calculated for each condition based on the average wetland surface area,
number of days of inundation, and infiltration rate. The VWB is then quanti-
fied as the dierence in annual recharge volume between the two conditions
(24).
VWB = Recharge With-project – Recharge Baseline
(24)
b. Wetland restoration
Wetland restoration increases infiltration and groundwater recharge due
to the increased volume of water stored in the wetland. The increase in
recharge is quantified for two conditions: the “baseline” condition (current
drained or degraded wetland) and the “with-project” condition (restored
wetland). First, the annual recharge volume is calculated for each condition
based on the average wetland surface area, number of days of inunda-
tion, and infiltration rate. The VWB is quantified as the dierence in annual
recharge volume between the two conditions (25).
VWB = Recharge With-project – Recharge Baseline
(25)
Appendix A-8. Hydrograph Method
Activities and Indicators
The Hydrograph method enables estimation of the volumetric benefit of the
following activities using the referenced output indicator below:
CATEGORY ACTIVITIESOUTPUT INDICATOR
Aquatic habitat
restoration
In-stream barrier removalImproved flow regime
Dam reoperation
Methodology Description
A hydrograph shows the rate of flow versus time past a specific point in a
river. The Hydrograph method evaluates the change in the hydrograph that
results from removal of an in-stream barrier or due to dam reoperation. First,
this method requires hydrographs from before and after the dam or barrier
removal or dam reoperation, for the time period of ecological significance.
Hydrographs can be obtained from (a) a flow time series derived from
stream flow monitoring or (b) a hydraulic model that simulates the baseline
(i.e., without-project) and with-project conditions. Second, the with-project
hydrograph is subtracted from the baseline on a daily basis. This is expected
to result in both positive and negative dierences, both of which can
represent a return toward a more natural flow regime. The absolute value of
the dierence in the two hydrographs is calculated on a daily basis and then
summed over the period of interest. The VWB is calculated as the volume
dierence between the two hydrographs (26).
[Hydrograph change] Daily time-step = [Flow] Baseline – [Flow] With-project
(26)
The absolute value of the dierence in the two hydrographs on a daily time-
step is summed over the period of interest (27).
VWB = ∑[Hydrograph change] Daily time-step
(27)

WORKING PAPER | August 2019 | 43
Volumetric Water Benefit Accounting (VWBA): A Method for Implementing and Valuing Water Stewardship Activities
Required Inputs
EQUATION VARIABLE INPUT
Hydrograph change (26)
Flow - measured (preferred)Time series of flow (cfs) downstream of the barrier/dam for the baseline and with-
project conditions
Flow - modeled (in the absence of
measured flows)
Channel geometry
Barrier/dam geometry
Manning’s coeicients
Time series of upstream flow
Time periodIdentification of time period of ecological significance based on seasonal requirements
of the target species
Volumetric water benefit (27)Change in flow (absolute value) Sum of daily change in flow (hydrograph change)
To the extent possible, a description of the “with-project” and “baseline”
conditions, accompanied by site-specific photographs of project activities,
should be documented and discussed to provide context to the project
activities.
Applications
In-stream barrier removal and dam reoperation are activities that help
restore a more natural flow regime to a river, which is particularly important
during periods of ecological significance when streamflow is a limiting
factor for target species. This method requires that the user determine the
relevant period for in-stream flow restoration based on the project objec-
tives. For example, the period may be based on provision of critical low
flows during the spawning season, or on restoration of peak spring flows
that are necessary for floodplain reconnection to support species dispersal
and growth. Additionally, the user should develop or obtain “baseline” and
“with-project” hydrographs to calculate the change in the flow regime over
the period of ecological significance.
Hydrographs can be measured or developed using a model. If measured
flows are used, they should be monitored at a location downstream from
the barrier to represent the eects of “baseline” condition and “with-project”
conditions. To the extent possible, hydrographs should be compared for
years with similar climactic conditions so that the dierence reflects the
project and not dierences in rainfall.
If a hydraulic model is used, the channel and in-stream barrier geometry
should be represented for the baseline and with-project conditions. Up-
stream flows can be measured or estimated using a drainage area ratio to
a representative flow series. Simulations should be conducted for an entire
year to develop the hydrographs, but the VWB calculation should focus on
the period of ecological significance.
HEC-RAS (US ACE 2018) and EPA-SWMM (US EPA 2018) are examples of
modeling frameworks that can be applied to develop hydrographs. Both
frameworks can simulate the impact of culvert removal.
In addition to the Hydrograph method, other potential methods can be
considered for evaluating in-stream barrier removal projects. One potential
VWB method is based on fish habitat requirements and the premise that,
due to the presence of large in-stream barriers, the optimal water depth
necessary for fish passage and habitat does not occur frequently. After
channel restoration, the optimal depth is achieved more frequently due
to the improved channel geometry and stream conditions. This method
compares the frequency of time the optimal depth is achieved and considers
the flow volume associated with that time period as the benefit. Application
of this method would involve the use of a hydraulic model and knowledge
of species-specific requirements. In some cases, using the impounded
volume may provide a simple pathway to assess VWB considering that the
small barriers or dams prevented habitat functions, and the removal of these
structures frees up this impounded volume and contributes to natural flow
and habitat function.
44 |
Appendix A-9. Water Governance Activities Method
Activities and Indicators
The Water Governance Activities method enables estimation of the volu-
metric water benefit of activities resulting from direct engagement in water
governance and public water management.
Using the Water Governance Activities method, volumetric water benefits
can be estimated using the same VWB indicators required to measure the
VWBs of the WS activities that the water governance activities support.
Methodology Description
The Water Governance Activities method requires that practitioners
engage in and/or support water governance and public water management
interventions that result in specific water stewardship activities that can be
measured using the VWBA three-step method we propose.
Required Inputs
Prior to engaging in and/or supporting water governance and public water
management interventions, practitioners should identify the specific water
stewardship activities and activity beneficiaries targeted as part of the
engagement in water governance and/or public water management.
Once the water governance or public water management interventions
result in specific water stewardship activities, practitioners can apply the
three-step method to calculate and attribute/allocate the volumetric water
benefits generated by that specific activity.
Applications
For example, industries in Kenya’s Lake Naivasha area contributed to improv-
ing local water management by funding a water allocation plan to guide
the establishment of multiple local water resource users’ associations and
implement Kenya’s national water policy (CEO Water Mandate 2010).
Using the Water Governance Activities method, industries in Kenya’s Lake
Naivasha area can apply the Withdrawal and Consumption methods to cal-
culate the VWB associated with water savings resulting from the activities of
the local water resource users’ associations, using the withdrawal reduction
indicator. Following that, industries in Kenya’s Lake Naivasha area could
attribute or allocate those VWBs to the stakeholders that were involved in
funding the implementation of Kenya’s national water policy by creating
local water resource users’ associations.
Note: Given how far removed the company may be from the activities
resulting from water governance activities, organizations can opt to make
a qualitative claim describing the governance activity and how it translated
into water stewardship outcomes.
Appendix A-10. Catalytic Activities Method
Activities and Indicators
The Catalytic Activities method enables estimation of the volumetric water
benefit of activities that pave the way for longer-term water stewardship
outcomes, such as capacity building, deployment of monitoring systems,
development of catchment numerical modeling tools, or investment in open
source watershed data.
Using the Catalytic Activities method, volumetric water benefits can be
estimated using the same VWB indicators required to measure the VWBs of
the WS activities toward which the catalytic activities contribute.
Methodology Description
The Catalytic Activities method requires that practitioners engage in and/or
support catalytic activities that result in specific water stewardship activities
that can be measured using the VWBA three-step method we propose.
Required Inputs
Prior to engaging in and/or supporting catalytic activities, practitioners
should identify the specific water stewardship activities and activity benefi-
ciaries targeted as part of the engagement in the catalytic activity.
Once the catalytic activity results yield specific water stewardship activities,
practitioners can apply the three-step method to calculate and attribute or
allocate the volumetric water benefits generated by that specific activity.
Applications
For example, a company funds the implementation of an automated head-
gate and telemetry monitoring system on an outdated ditch system—this
modernization work was needed to pave the way for many future projects
among a series of ditch users to use less water and conserve water in a
river. However, this work did not, by itself, generate VWBs.
Using the Catalytic Activities method, the company can apply the With-
drawal and Consumption methods to calculate the VWB associated with
water savings resulting from the activities of specific ditch users, using the
withdrawal reduction indicator. Following that, the company can attribute
or allocate those VWBs to the stakeholders that were involved in funding
the automated headgate and telemetry monitoring system on the ditch
system. We recommend that the project scope and costs include both the
catalytic work on the headgate and telemetry monitoring system, and the
other activities that reduce the volume withdrawn or consumed. Addition-
ally, the implementing partner should be involved in the allocation of VWBs if
multiple stakeholders are making volumetric claims.
Note: Given how far removed the company may be from the activities
resulting from catalytic activities, organizations can opt to make a qualita-
tive claim describing the catalytic activity and how it translated into water
stewardship outcomes.
WORKING PAPER | August 2019 | 45
Volumetric Water Benefit Accounting (VWBA): A Method for Implementing and Valuing Water Stewardship Activities
GLOSSARY
▪Activity: The interventions whose eects on natural and social capital
are considered “outputs” and can be analyzed and quantified (adapted
from WBCSD 2017). A water stewardship project may encompass multiple
activities.
▪Allocation: The distribution of volumetric water benefits among organi-
zations where multiple organizations share a common volumetric water
benefit.
▪Baseline: The beginning points at which an organization or activity will
be monitored and against which progress can be assessed or compari-
sons made (adapted from AWS 2019).
▪Benefit: Long-term social, economic, and environmental eects resulting
from the implementation of a project or activity, either directly or indirect-
ly, intentionally or unintentionally. Benefits, which are the ultimate result,
derive from outcomes, and can also be referred to as positive impacts
(those impacts which directly or indirectly, intentionally or unintentionally,
generally benefit stakeholders and/or the environment) (adapted from
AWS 2019). See also “Volumetric water benefit” below.
▪Catchment: The area of land from which all surface runo and subsur-
face waters flow through a sequence of streams, rivers, aquifers, and
lakes into the sea or another outlet at a single river mouth, estuary, or
delta (adapted from AWS 2019). It’s important to consider that catchments
□include associated groundwater areas, but surface and subsurface
waters often have dierent catchment boundaries and degrees of con-
nection;
□may include the totality or portions of water bodies, such as lakes or
rivers;
□are also referred to as watersheds, basins, or subbasins; and
□may be interconnected with infrastructure, so interventions in one can
result in benefits or detriments in another.
▪Claim: To state or declare the creation of volumetric water benefits.
▪Complementary indicators: Measurements that provide additional
insight into the implications of estimated volumetric water benefits and
help decision-makers interpret the volumetric water benefits achieved
beyond the volume of water provided.
▪Elements of effective water stewardship activities: Measures of
a water stewardship activity that increase the likelihood of generating
social, economic, and environmental benefits and solving shared water
challenges.
▪Impact: Changes in the well-being of those aected over the longer
term (WBCSD 2017). In the context of water stewardship, impact refers to
the positive or negative long-term social, economic, and environmental
eects resulting from the implementation of a project or activity, either
directly or indirectly, intentionally or unintentionally. Impacts, which are
the ultimate result, derive from outcomes. Impacts may be beneficial and
called benefits (those impacts which directly or indirectly, intentionally or
unintentionally, generally benefit stakeholders and/or the environment) or
adverse (those impacts which directly or indirectly, intentionally or unin-
tentionally, are generally harmful to stakeholders and/or the environment)
(adapted fromAWS 2019).
▪Indicator: A quantitative factor or variable that provides reliable means
to measure the achievement of outputs or outcomes.
▪Input: The data and information necessary to estimate the volumetric
water benefits of an activity.
▪Outcome: Changes in the lives of the target population and/or environ-
ment (WBCSD 2017). In the context of water stewardship, the Alliance
for Water Stewardship Standard contains four outcomes: (1) good water
governance, (2) sustainable water balance, (3) good water quality status,
and (4) healthy status of important water-related areas. Outcomes derive
from outputs and lead to impacts (adapted fromAWS 2019).
▪Output: The results of the activity in question (WBCSD 2017). Outputs de-
rive from activities and lead to outcomes and ultimately impacts (adapted
fromAWS 2019).
▪Shared water challenge:The water-related issues that are of interest
or concern in the catchment or area of interest (e.g., aquifer, municipal-
ity, town, state) and which, if addressed, will provide positive impacts or
prevent negative impacts. Shared water challenges are not necessarily
unique and may be the same for multiple sites or stakeholders (AWS
2019).
▪Volumetric water benefit accounting (VWBA): Method to estimate
the volumetric water benefits of water stewardship activities, and associ-
ated guidance related to planning, project selection, and assessment.
▪Volumetric water benefits (VWBs): Water stewardship activity out-
puts, estimated in volume per unit of time, that help reduce shared water
challenges.
▪Water balance goal or target: Organizational goal or target to bal-
ance a volume of water equal to what is consumed by the organization,
through interventions in catchments and communities outside the four
walls of the organization.
▪Water risk: The eect of water-related uncertainty on an organization’s
objectives. It is important to note that water risk is felt dierently by every
sector of society and the organizations within them and thus is defined
and interpreted dierently (even when they experience the same degree
of water scarcity or water stress or when it aects the same area of inter-
est)(AWS 2019).
▪Water stewardship (WS): The socially equitable, environmentally sus-
tainable, and economically beneficial use of freshwater, achieved through
a stakeholder-inclusive process that involves site- and catchment-based
actions (AWS 2019).
46 |
REFERENCES
AWS (Alliance for Water Stewardship). 2019. “The AWS Standard 2.0.” http://
a4ws.org/about/the-aws-standard/.
Bass, L., and W. Larson. 2016. “Water Balance Targets: Exploring the Role
of Volumetric Goals in Water Stewardship.” Washington, DC: World Wildlife
Fund and LimnoTech. https://c402277.ssl.cf1.rackcdn.com/publications/979/
files/original/WWF_Water_Balance_Targets_Report.pdf?1481293867.
CDP (Carbon Disclosure Project). 2017. Global Water Report. https://www.cdp.
net/en/research/global-reports/global-water-report-2017.
CDP, CEO Water Mandate (a project of the Pacific Institute and the UN Global
Compact), The Nature Conservancy, World Resources Institute, and the
World Wildlife Fund. 2017. “Exploring the Case for Corporate Context-Based
Water Targets.” https://www.ceowatermandate.org/files/context-based-
targets.pdf.
CEO Water Mandate. 2018. “Water Stewardship in 60 Seconds: How
to Understand and Manage Your Business’ Water Risks.” https://
ceowatermandate.org/academy/water-stewardship-60-seconds-
understand-manage-business-water-risks/.
CEO Water Mandate. 2010. Guide to Responsible Business Engagement with
Water Policy. November. Oakland, CA: UN Global Compact, Pacific Institute.
Ceres. 2011. “Ceres Aqua Gauge: A Comprehensive Assessment Tool for
Evaluating Corporate Management of Water Risk.” https://www.ceres.org/
resources/tools/ceres-aqua-gauge-comprehensive-assessment-tool-
evaluating-corporate-management.
The Coca-Cola Company. 2018. “Collaborating to Replenish the Water We
Use.” https://www.coca-colacompany.com/collaborating-to-replenish-the-
water-we-use.
Cummins. 2018. “Cummins Nears 2020 Products-in-Use Environmental
Goal.” https://www.cummins.com/news/2018/06/25/cummins-nears-2020-
products-use-environmental-goal.
Diageo. 2019. “Water Stewardship.” https://www.diageo.com/en/in-society/
reducing-our-environmental-impact/water-stewardship/.
FAO (Food and Agriculture Organization of the United Nations). 2019.
“CROPWAT 8.0.” http://www.fao.org/land-water/databases-and-software/
cropwat/en/.
Fiener, P., and K. Auerswald. 2003. “Eectiveness of Grassed Waterways
in Reducing Runo and Sediment Delivery from Agricultural Watersheds.”
Journal of Environmental Quality 32 (3): 927–36.
Gold Standard. 2016. “Water Benefits Certificate.” https://www.goldstandard.
org/articles/gold-standard-water-benefit-certificates.
Green, W.H., and G.A. Ampt. 1911. “Studies on Soil Physics.” Journal of
Agricultural Science 4 (1): 1–24.
Heineken. 2019. “Every Drop: Protecting Water Resources.” https://www.
theheinekencompany.com/Sustainability/Focus-Areas/Protecting-Water-
Resources.
Helmers, M.J., T.M. Isenhart, M.G. Dosskey, S.M. Dabney, and J.S. Strock. 2008.
“Buers and Vegetative Filter Strips.” In Final Report: Gulf Hypoxia and Local
Water Quality Concerns Workshop, 43–58. St. Joseph, MI: ASABE, 2008.
Hirschman, D., M. Aguilar, J. Hathaway, K. Lindow, and T. Schueler. 2018.
“Updating the Runo Reduction Method.” Technical Report, Metro
Government of Nashville and Davidson County, Tennessee Metro Water
Services, Stormwater Division. https://hirschmanwater.com/wp-content/
uploads/2018/07/RRM-Nashville_Report_FINAL_060718.pdf.
Hirschman, D., K. Collins, and T. Schueler. 2008. “The Runo Reduction
Method.” Technical Memorandum. Center for Watershed Protection Inc.
and Chesapeake Stormwater Network. https://www.vwrrc.vt.edu/swc/
documents/CWP_TechMemo_VRRM_20080418.
Hoekstra, A.Y., A.K. Chapagain, M.M. Aldaya, and M.M. Mekonnen. 2011.
“The Water Footprint Assessment Manual: Setting the Global Standard.”
London: Earthscan. https://waterfootprint.org/media/downloads/
TheWaterFootprintAssessmentManual_2.pdf.
Intel. 2017. “Our Commitment to Restore 100% of Our Water Use.” https://
blogs.intel.com/csr/2017/09/water/#gs.olz36e.
International Standard ISO 14046. 2014. “Environmental Management—Water
Footprint: Principles, Requirements and Guidelines, 2014.” https://www.iso.
org/standard/43263.html.
Keurig Green Mountain. 2019. “Clean Water.” https://www.
keuriggreenmountain.com/en/Sustainability/CleanWaterforEveryone/
Overview.aspx.
Kuichling, E. 1889. “The Relation between the Rainfall and the Discharge
of Sewers in Populous Districts.” Transactions, American Society of Civil
Engineers 20: 1–56.
WORKING PAPER | August 2019 | 47
Volumetric Water Benefit Accounting (VWBA): A Method for Implementing and Valuing Water Stewardship Activities
LegiFrance. 2015. Arrêté du 21 juillet 2015 relatif aux systèmes
d’assainissement collectif et aux installations d’assainissement non collectif,
à l’exception des installations d’assainissement non collectif recevant une
charge brute de pollution organique inférieure ou égale à 1,2 kg/j de DBO5.
https://www.legifrance.gouv.fr/aichTexte.do?cidTexte=JORFTEXT000031052
756&dateTexte=20170926.
Mekonnen, M.M., and A.Y. Hoekstra. 2010. “The Green, Blue and Grey Water
Footprint of Crops and Derived Crop Products.” In Value of Water Research
Report Series, no. 47. Vol. 2, Appendices. Delft, the Netherlands: UNESCO-IHE.
http://waterfootprint.org/media/downloads/Report47-WaterFootprintCrops-
Vol2_1.pdf.
Natural Capital Coalition. 2019. “Natural Capital Protocol.” https://
naturalcapitalcoalition.org/natural-capital-protocol/.
Neitsch, S.L., J.G. Arnold, J.R. Kiniry, and J.R. Williams.2011.“Soil and Water
Assessment Tool Theoretical Documentation Version 2009.”Texas Water
Resources Institute. http://hdl.handle.net/1969.1/128050.
Pegram, G., S. Orr, and C. Williams.2009.“Investigating Shared Riskin Water:
Corporate Engagement with the Public Policy Process.” WWF. http://assets.
wwf.org.uk/downloads/investigating_shared_risk.pdf.
PepsiCo. 2019. “Water Stewardship.” https://www.pepsico.com/
sustainability/water.
Richter, B.D., J.D. Brown, R. DiBenedetto, A. Gorsky, E. Keenan, C. Madray, M.
Morris, D. Rowell, and S. Ryu. 2017. “Opportunities for Saving and Reallocating
Agricultural Water to Alleviate Water Scarcity.” Water Policy 19 (5): 886–907.
Rozza, J., B.D. Richter, W.M. Larson, T. Redder, K. Vigerstol, and P. Bowen. 2013.
“Corporate Water Stewardship: Achieving a Sustainable Balance.” Journal of
Management and Sustainability 3 (4). http://dx.doi.org/10.5539/jms.v3n4p41.
Scott, C.A., S. Vicuña, I. Blanco-Gutiérrez, F. Meza, and C. Varela-Ortega.
2014. “Irrigation Eiciency and Water-Policy Implications for River Basin
Resilience.” Hydrology and Earth System Sciences 18: 1339–48.
Sears, L., J. Caparelli, C. Lee, D. Pan, G. Strandberg, L. Vuu, and C.Y. Lin Lawell.
2018. “Jevons’ Paradox and Eicient Irrigation Technology.”Sustainability10
(5): 1590.
Sheridan, J.M., R. Lowrance, and D.D. Bosch. 1999. “Management Eects on
Runo and Sediment Transport in Riparian Forest Buers.” Transactions of
the ASAE 42 (1): 55.
Siebert, S., J. Burke, J.M. Faures, K. Frenken, J. Hoogeveen, P. Döll, and F.T.
Portmann. 2010. “Groundwater Use for Irrigation: A Global Inventory.”
Hydrology and Earth Systems Sciences 14: 1863–80. https://doi.org/10.5194/
hess-14-1863-2010.
UN (United Nations). 2015. “Sustainable Development Goal 6.” https://
sustainabledevelopment.un.org/sdg6.
U.S. ACE (United States Army Corps of Engineers). 2018. “Hydrologic
Engineering Center’s (CEIWR-HEC) River Analysis System (HEC-RAS).”Last
updated November. http://www.hec.usace.army.mil/software/hec-ras/
default.aspx.
U.S. EPA (United States Environmental Protection Agency). 2018. “Storm
Water Management Model.” Last updated October 30. https://www.epa.gov/
water-research/storm-water-management-model-swmm.
U.S. National Fish and Wildlife Foundation. 2018. “Five Star and Urban Waters
Restoration Program.” https://www.nfwf.org/fivestar/Pages/home.aspx.
WBCSD (World Business Council for Sustainable Development). 2017. “Social
Capital Protocol.” https://www.wbcsd.org/Programs/People/Social-Impact/
Social-and-Human-Capital-Protocol/Resources/Social-Capital-Protocol.
WBCSD. 2019. “Social & Human Capital Protocol.” https://www.wbcsd.org/
Programs/Redefining-Value/Business-Decision-Making/Measurement-
Valuation/Social-Human-Capital-Protocol.
World Economic Forum. 2019. Global Risks Report. http://www3.weforum.
org/docs/WEF_Global_Risks_Report_2019.pdf.
WHO and UNICEF (World Health Organization and United Nations Children’s
Fund). 2000. Global Water Supply and Sanitation Assessment 2000
Report. Geneva and New York: WHO/UNICEF. https://www.who.int/water_
sanitation_health/monitoring/jmp2000.pdf.
WRI (World Resources Institute). 2019. “Aqueduct Water Risk Atlas.” http://
aqueduct.wri.org.
Wright, A. 2009. “Quantifying Water Access Benefits in Community Water
Partnership Projects.” Global Environment & Technology Foundation. https://
www.coca-cola.ie/content/dam/journey/ie/en/hidden/reports/water-
pdfs/2009_water_access_benefits.pdf.
WWF (World Wildlife Fund). 2019. “Water Risk Filter.”https://waterriskfilter.
panda.org/.
48 |
ACKNOWLEDGMENTS
This publication was made possible thanks to financial support provided
by the Coca-Cola Company, Danone, Ecolab Inc., Facebook Inc., Intel
Corporation, L’Oréal S.A., Mars Inc., MillerCoors, Nestlé S.A., Nike Inc., Novartis
International A.G., Procter & Gamble Co., Spadel, and Veolia.
We are pleased to acknowledge our institutional strategic partners, who
provide core funding to WRI: Netherlands Ministry of Foreign Aairs, Royal
Danish Ministry of Foreign Aairs, and Swedish International Development
Cooperation Agency.
The authors would like to thank the following for their extensive guidance
and feedback during the design and development of this method:
Expert Advisory Group
▪Lindsay Bass, WWF US
▪Peter Bjørnsen, UNEP-DHI
▪Sebastian Cabrera, The Nature Conservancy (TNC)
▪Anthony Chatwin, National Fish and Wildlife Foundation
▪John Chilton, International Association of Hydrogeologists
▪James Dalton, International Union for Conservation of Nature (IUCN)
▪Rylan Dobson, WWF Germany
▪Monica Freyman, Ceres
▪Carlos Hurtado Aguilera, FEMSA Foundation
▪Cate Lamb, CDP Water
▪Doug MacNair, Natural Capital Coalition
▪Scott McCready, Alliance for Water Stewardship
▪Alexis Morgan, WWF Germany
▪Naabia Ofosu-Amaah, The Nature Conservancy (TNC)
▪Todd Reeve, Bonneville Environmental Foundation
▪Jake Reilly, National Fish and Wildlife Foundation
▪Ruth Romer, WaterAid
▪Naomi Rosenthal, South Pole Group
▪Tobias Salathe, Ramsar
▪Marta Santamaria, Natural Capital Coalition
▪Tien Shiao, Pacific Institute and UN Global Compact CEO Water Mandate
▪Kari Vigerstol, The Nature Conservancy (TNC)
▪Wouter Wolters, Wageningen Environmental Research
Experts representing the project funders:
▪The Coca-Cola Company: Ulrike Sapiro
▪Danone: Olivier Beon and Patrick Lachassagne
▪Ecolab Inc.: Emilio Tenuta
▪Facebook Inc.: Sylvia Lee
▪Intel Corporation: Fawn Bergen
▪L’Oréal S.A.: Hans-Ulrich Buchholz and Jean-Michel Pille
▪Mars Inc.: Ian Knight and Kevin Rabinovitch
▪MillerCoors: Kim Marotta and Diane Wagner
▪Nestlé S.A.: Carlo Galli and Jonathan Sottas
▪Nike Inc.: Adam Brundage, John Hollerung, Jeremy Lardeau, and John
Rydzewski
▪Novartis International A.G.: Sonja Haut, Jutta Hellstern, Daniela Kessler,
and Dense Weger
▪Procter & Gamble Co.: Kate Brown and Shannon Quinn
▪Spadel: Arnaud Collignon and Patrick Jobe
▪Veolia: Boris David and Magali Dechesne
Experts providing feedback during the open consultation:
▪Laurent Bellet, Électricité de France S.A.
▪Jacob Bourgeoise, First Climate AG
▪Paul Byrnes, Paqua Consulting
▪Cecilia Coates, Colgate-Palmolive Company
▪Liese Dallbauman, Integrated Water Stewardship
▪Peter Easton, Easton Consulting
▪Andre Fourie, Anheuser-Busch InBev SA/NV
▪Je Hanratty, General Mills Inc.
▪Piet Klop, PGGM
▪Rick Love, United Technologies Corporation
▪Nick Martin, Antea Group
▪Kim McGrath, Environmental Resources Management (ERM)
▪John Mikolak
▪Bert Share, Share Sustainability
WORKING PAPER | August 2019 | 49
Volumetric Water Benefit Accounting (VWBA): A Method for Implementing and Valuing Water Stewardship Activities
The authors would also like to thank the following people for providing
invaluable insight and assistance: Penelope Moskus and Pranesh
Selvendiran, from LimnoTech; Marcial Vargas-González, from Quantis; and
Juan-Carlos Altamirano, Samrat Basak, Laura Malaguzzi, Gabriela Morales,
Suzanne Ozment, Leah Schleifer, Neelam Singh, and Colin Strong from WRI.
Disclaimer: Opinions or points of view expressed in this report are those of
the authors and do not necessarily reflect the position of the Expert Advisory
Group, experts representing the project funders, experts providing feedback
during the open consultation, or the organizations they represent.
ABOUT VALUING NATURE
Valuing Nature’s mission is to help organizations integrate the value of
nature and society into decision-making, by providing innovative methods,
data, and experience. Samuel Vionnet founded Valuing Nature in 2015.He
is an independent consultant with 10 years of experience in sustainability
consulting. Before founding his organization, Samuel worked for six years
with Quantis International supporting organizations worldwide on their
strategies, using sustainability metrics. Valuing Nature works primarily
with the private sector, advising multinational companies around the
world on issues that include sustainability metrics, water stewardship,
risk assessment, supply-chain management, sustainability strategy, and
natural and social capital accounting. His clients include Nestlé, Tetra Pak,
Ikea, Novartis, Olam, Natura, Nespresso, Samsung, and Firmenich, among
others.His current focus is on economic valuation of human, social, and
natural capital and flows related to the private sector. Redefining value and
our economic model are at the core of the focus of Valuing Nature.
ABOUT LIMNOTECH
LimnoTech is a leading water science and environmental engineering
consulting firm headquartered in Ann Arbor, Michigan, with regional oices
across the United States. We work with clients across a range of sectors
and locations to address challenging water resource issues. Our sta has a
national reputation for the scientific assessment of complex environmental
issues and for finding innovative, eective solutions, especially as they
relate to the selection and design of management alternatives for the water
environment.
ABOUT QUANTIS
Quantis guides top organizations to define, shape, and implement intelligent
environmental sustainability solutions. In a nutshell, our creative geeks take
the latest science and make it actionable. They deliver resilient strategies,
robust metrics, useful tools, and credible communications.
With oices in the United States, France, Switzerland, Germany, Italy, and
Colombia and clients around the world, Quantis is a key partner in inspiring
sustainable change on a global scale.
10 G Street, NE | Washington, DC 20002 | www.WRI.org
Volumetric Water Benefit Accounting (VWBA): A Method for Implementing and Valuing Water Stewardship Activities
ABOUT WRI
World Resources Institute is a global research organization that turns big ideas
into action at the nexus of environment, economic opportunity, and human
well-being.
Our Challenge
Natural resources are at the foundation of economic opportunity and human
well-being. But today, we are depleting Earth’s resources at rates that are
not sustainable, endangering economies and people’s lives. People depend
on clean water, fertile land, healthy forests, and a stable climate. Livable cit-
ies and clean energy are essential for a sustainable planet. We must address
these urgent, global challenges this decade.
Our Vision
We envision an equitable and prosperous planet driven by the wise manage-
ment of natural resources. We aspire to create a world where the actions of
government, business, and communities combine to eliminate poverty and
sustain the natural environment for all people.
Our Approach
COUNT IT
We start with data. We conduct independent research and draw on the lat-
est technology to develop new insights and recommendations. Our rigorous
analysis identifies risks, unveils opportunities, and informs smart strategies.
We focus our eorts on influential and emerging economies where the
future of sustainability will be determined.
CHANGE IT
We use our research to influence government policies, business strategies,
and civil society action. We test projects with communities, companies,
and government agencies to build a strong evidence base. Then, we work
with partners to deliver change on the ground that alleviates poverty and
strengthens society. We hold ourselves accountable to ensure our outcomes
will be bold and enduring.
SCALE IT
We don’t think small. Once tested, we work with partners to adopt and
expand our eorts regionally and globally. We engage with decision-makers
to carry out our ideas and elevate our impact. We measure success through
government and business actions that improve people’s lives and sustain a
healthy environment.
Copyright 2019 World Resources Institute. This work is licensed under the Creative Commons Attribution 4.0 International License.
To view a copy of the license, visit http://creativecommons.org/licenses/by/4.0/
ABOUT THE AUTHORS
Paul Reig is a director of corporate water stewardship at WRI.
Contact: Paul.reig@wri.org
Wendy Larson is a vice president of water sustainability at LimnoTech.
Contact: wlarson@limno.com
Samuel Vionnet is a sustainability expert and founder at Valuing Nature.
Contact: sv@valuingnature.ch
Jean-Baptiste Bayart is a sustainability consultant at Quantis.
Contact: jean-baptiste.bayart@quantis-intl.com