
Cathedral Peak Research Catchments Hydroclimatology Mid-2023
Update
Michele Toucher and Kent Lawrence
Below is a brief summary on the current status of the Cathedral Peak research catchments.
Rainfall
The 2022/2023 summer seasonsaw higher than average rainfall in the Cathedral Peakresearch
catchments. On 5 January 2023, the highest daily rainfall since SAEON resumed monitoring in 2012
was recorded at most raingauges. Mike’s Pass recorded 82.8 mm on the 5th, while IVB recorded the
highest of 113 mm. The autumn season was variable with March and Aprilbeing drier than normal,
however, May saw good rains.
Figure 1: Monthly rainfall anomaly for the Mike’s Pass Meteorological station

Temperature
The mean monthly temperatures continue to be higher than the mean monthlyhistorical
temperatures, particularly in the autumn and winter months. On average, the monthly deviation from
the historical mean monthly value since SAEON resumed monitoring is 0.98°C warmer. This appears
to indicate considerable warming in the catchments relative to the past.
Figure 2: Mean monthly temperature anomaly for the Mike’s Pass Meteorological station
Heat Waves
The number of heat waves being experienced at the Mike’s Pass weatherstation appears to be greater
than what was experienced historically. In the historical record available for the station, the greatest
number of heat waves experienced in one year was five in 1968. Some years no heat waves were
experienced, and the majority of years experiencedone heat wave. During the current period of
monitoring, nine heat waves occurred during 2019, seven heat waves in both 2013 and 2018 and six
heat waves in 2015. All years in the current period have experienced at least two heatwaves, even
2023 where only six months of data is included. Interestingly, the hottest day on record for the Mike
Pass weather station was recorded in 1970, 36.5°C. However, the next four hottest days were
recorded in 2016, 2015, 2018 and 2019 recording 35.16, 34.65, 32.92 and 32.67°C respectively.

Figure 3: Number of heat waves recorded at the Mike’s Pass meteorological station

Taken from WRC Report “TOWARDS SUSTAINABLE AND EQUITABLE MANAGEMENT OF WATER
RESOURCES: UNDERSTANDING THE INTERLINKAGES BETWEEN WATER, ECOSYSTEMS AND SOCIETY
THROUGH SPATIAL MAPPING OF ECOSYSTEM SERVICES AND LIVELIHOOD BENEFITS”
IMPACT OF HEAT WAVES ON CROP PRODUCTION STULWANE, BERGVILLE
In January 2023, a six-day long heat wave was recorded at the Mike’s Pass weather station. The heat
wave was broken with one day falling below the SAWS definition of 5°C warmer than the mean maximum
temperature of the hottest month of the year. This was followed by a four-day heat wave.
Mahlathini DevelopmentFoundation (MDF) have been working with villages in the Northern
Drakensberg for a number of years, encouraging and tracking the influence of conservation agriculture
(CA) on crop production. Reflections on the influence of the January 2023 heat wave on crop production
were noted by the MDF team for the area of Stulwane (located about 20 km from the town of
Winterton). By late January, the majority of participants’ in the MDF maize program were showing signs
of drought stress. A few of the lead farmers, such asPhumelele Hlongwane, in Ezibomvini, however,
were spared and their crops remained vibrant. The two photographs below were both taken on the 24
January 2023 after the two heat waves. The homesteads of Cabangani Hlongwane and Phumelele
Hlongwane are right next to each other and their fields are separated by no more than 50m.
Both these farmers have been practicing CA since 2014, however the sites have quite different soil
characteristics (some innate and some due to farmer’s managementstrategies), which is likely to be
responsible for the difference in the performance of the crops. Phumelele’s fields have higher clay
percentage (43% versus 27% for Cabanagani), N% (0.19 versus 0.15), organic carbon (2% versus 1.6%)
and pH (5.1 versus 4.9). This set of photographs demonstrates that CA improves the capacity of crops to
perform well even under circumstances of mid-season dry spells, which are likely to become more
common aswe experience the impacts of climate change, but only if all three principles of minimum
tillage, increased soil cover and crop diversification are diligently followed.
Maize showing heat stress in Cabangani Hlongwane’s CA plot (above) and Maize and cover crops looking vibrant
with good canopy cover in Phumelele Hlongwane’s field (below).Note: The pictures were taken on the same day
and fields are in very close proximity.
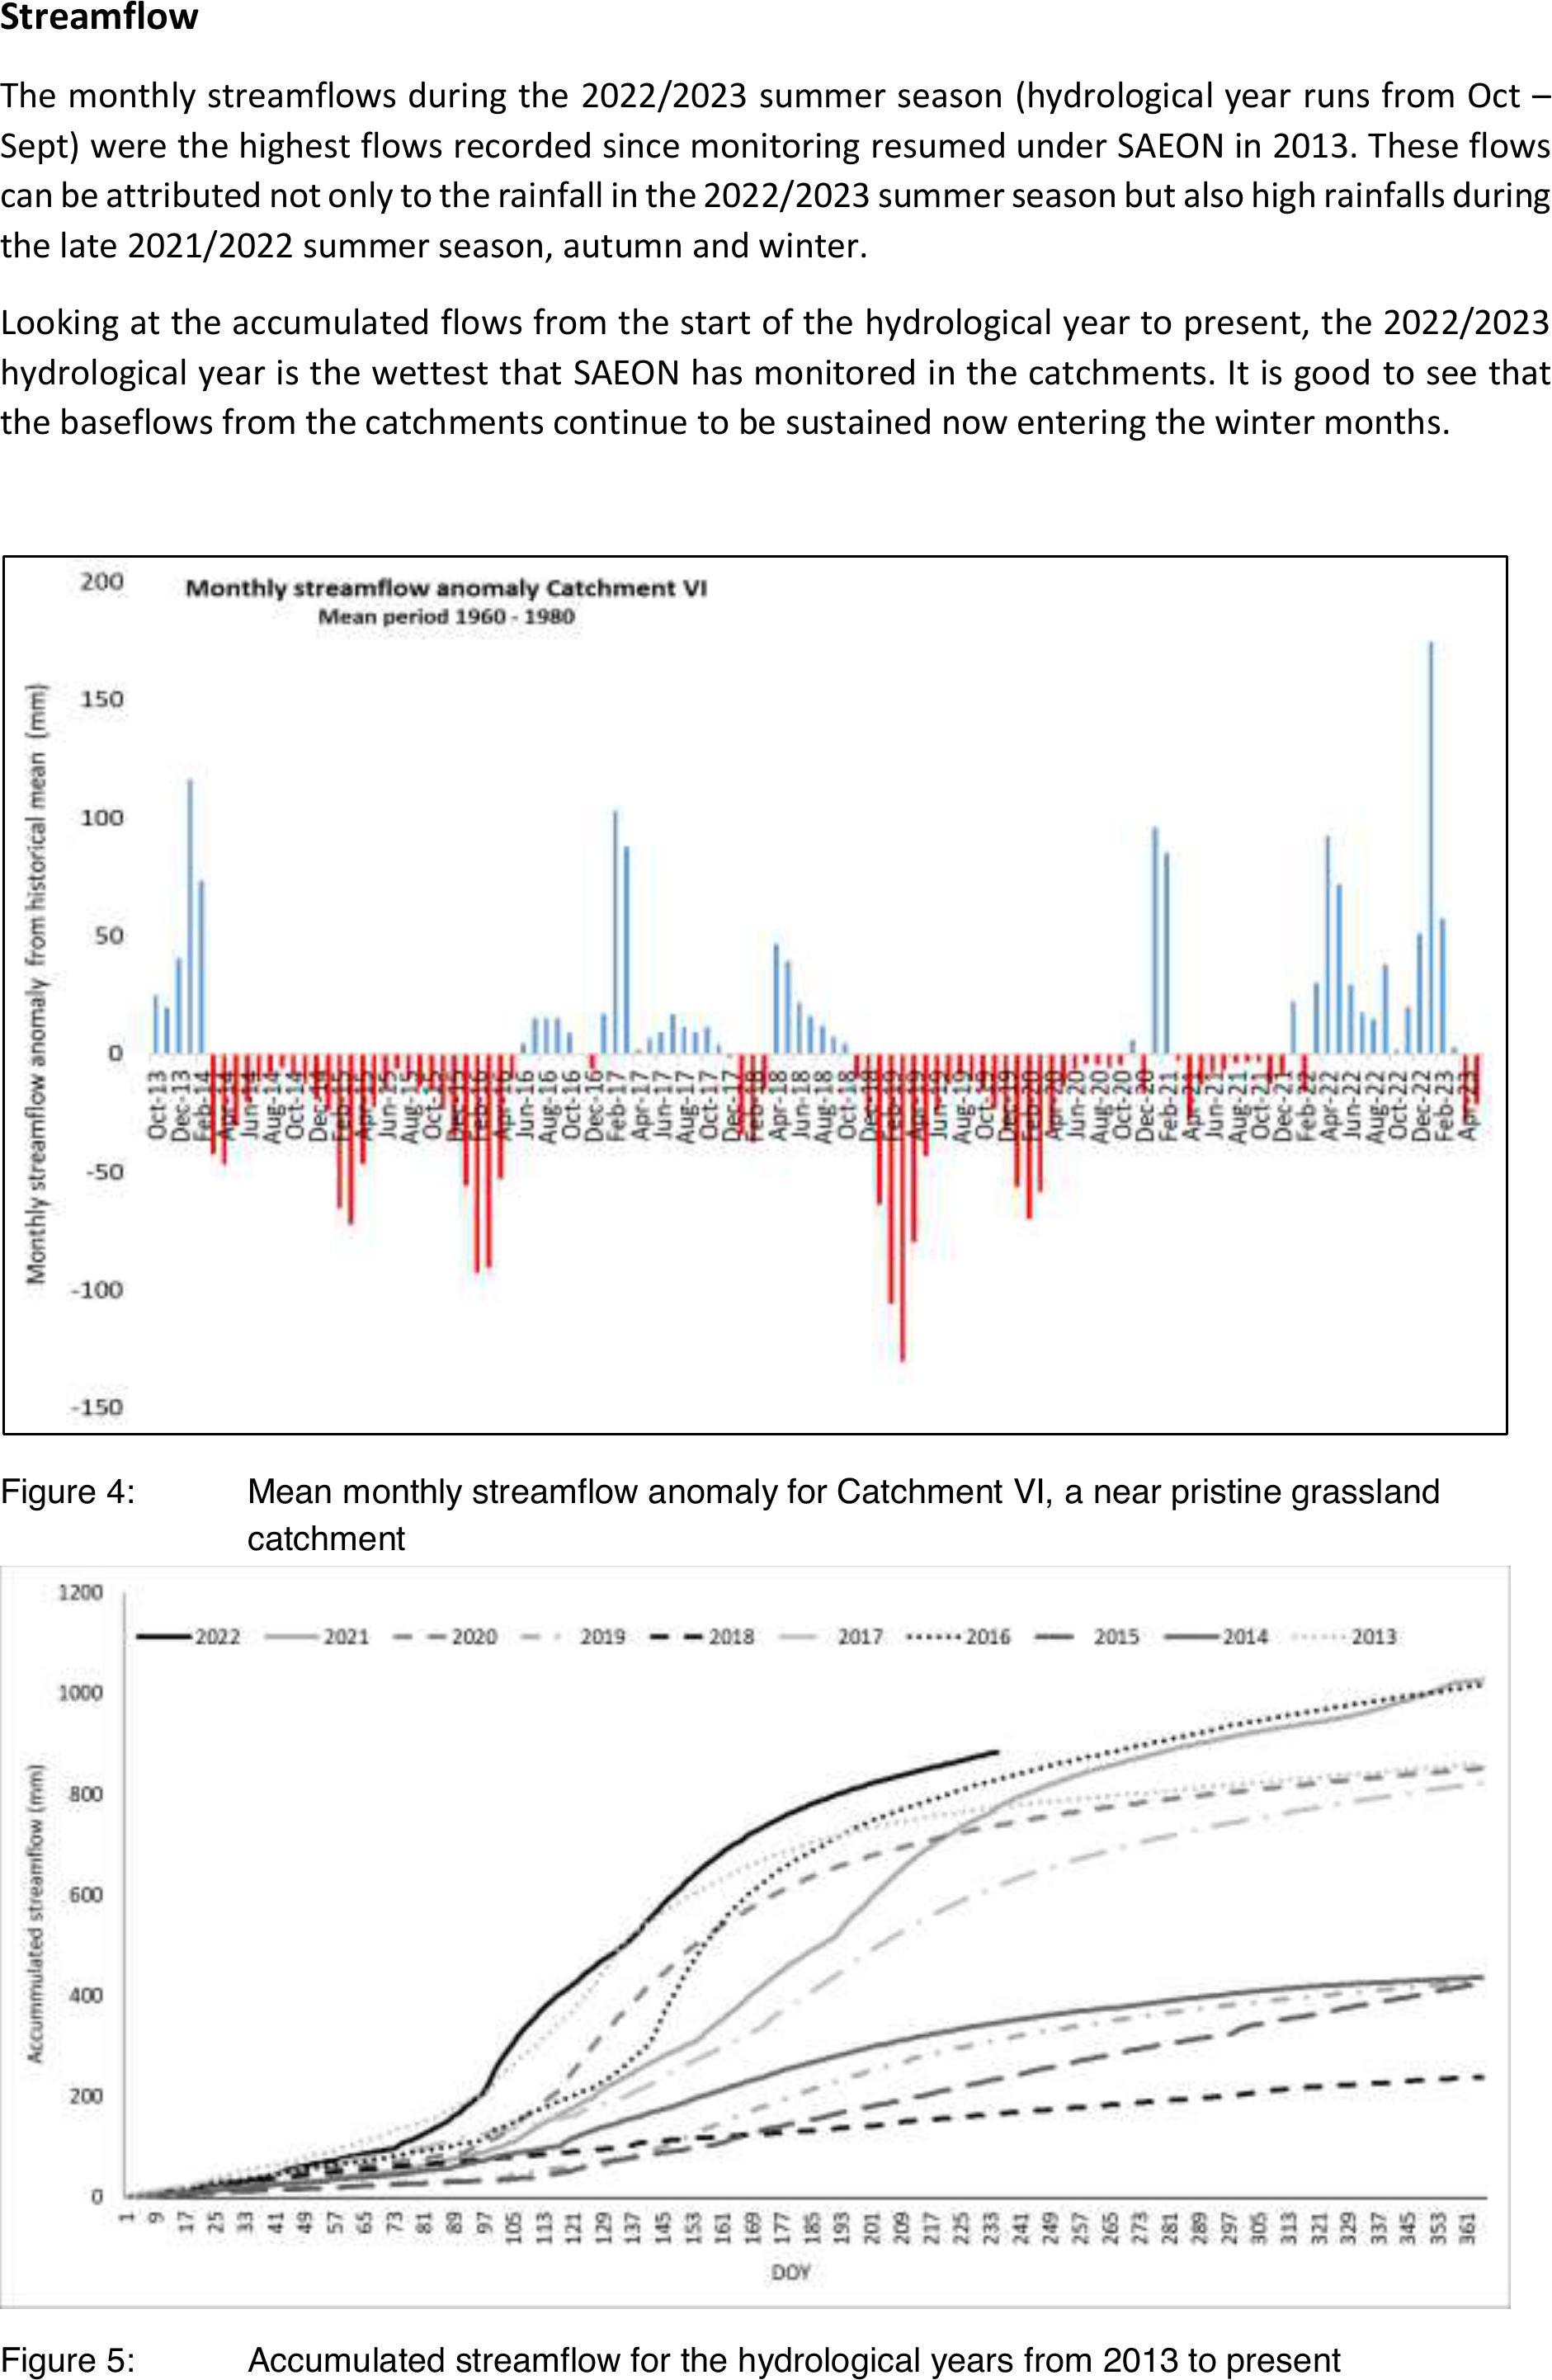
Streamflow
The monthly streamflows during the 2022/2023 summer season (hydrological year runs from Oct –
Sept) were the highest flows recorded since monitoring resumed under SAEON in 2013. These flows
can be attributed not only to the rainfall in the 2022/2023 summer season but also high rainfalls during
the late 2021/2022 summer season, autumn and winter.
Looking at the accumulated flows from the start of the hydrological year to present, the 2022/2023
hydrological year is the wettest that SAEON has monitored in the catchments. It is good to see that
the baseflows from the catchments continue to be sustained now entering the winter months.
Figure 4: Mean monthly streamflow anomaly for Catchment VI, a near pristine grassland
catchment
Figure 5: Accumulated streamflow for the hydrological years from 2013 to present

Evapotranspiration and Energy Balance Components
SAEON is measuring the evapotranspiration (ET) over three landcovers, namely the bracken fern in
Catchment III, the woody encroachment in Catchment IX and lastly over the near-pristine grassland in
Catchment VI. We are using the surface renewal (SR) methodology in Catchments III and IX, and the
Eddy Covariance (EC) technique in Catchment VI. We have looked at the comparability of these
methods, and published a paper showing that the cheaper SR method is comparable to the expensive
EC method for ET measurements in the mesic climate of Cathedral Peak.
A seasonal pattern in the ET is evident for all three land covers. During the summer months the ET
over the three land covers is comparable, except in the drier years when the ET from the grassland is
lower than that from the bracken and woody species. For example, during the summer of 2019/2020
the ET over the grassland was lower than the bracken and woody species ET. Transitioning from
summer to winter, the bracken and woody species continue to transpire at a higher rate than the
grassland for longer, and they maintain a higher ET throughout winter. The woody species transpire
the most during the core winter months.
As a further step we have been lookingat thedivision of the net radiation into the
components of the energy balance, namely the latent heat (LE) which equates to your ET,
sensible heat (H) and ground heat flux (G). There is a seasonal pattern in the LE, H and G. With
LE being higher in the summer months. This variation and trend is greatest in the grassland
which corresponds to the higher variability in grassland ET. The G is fairly constant in the
bracken and woody species, varying over time with soil water content rather than seasonally.
Whereas G in the grassland varies seasonally.
Figure 6: Monthly evapotranspiration over three land cover types
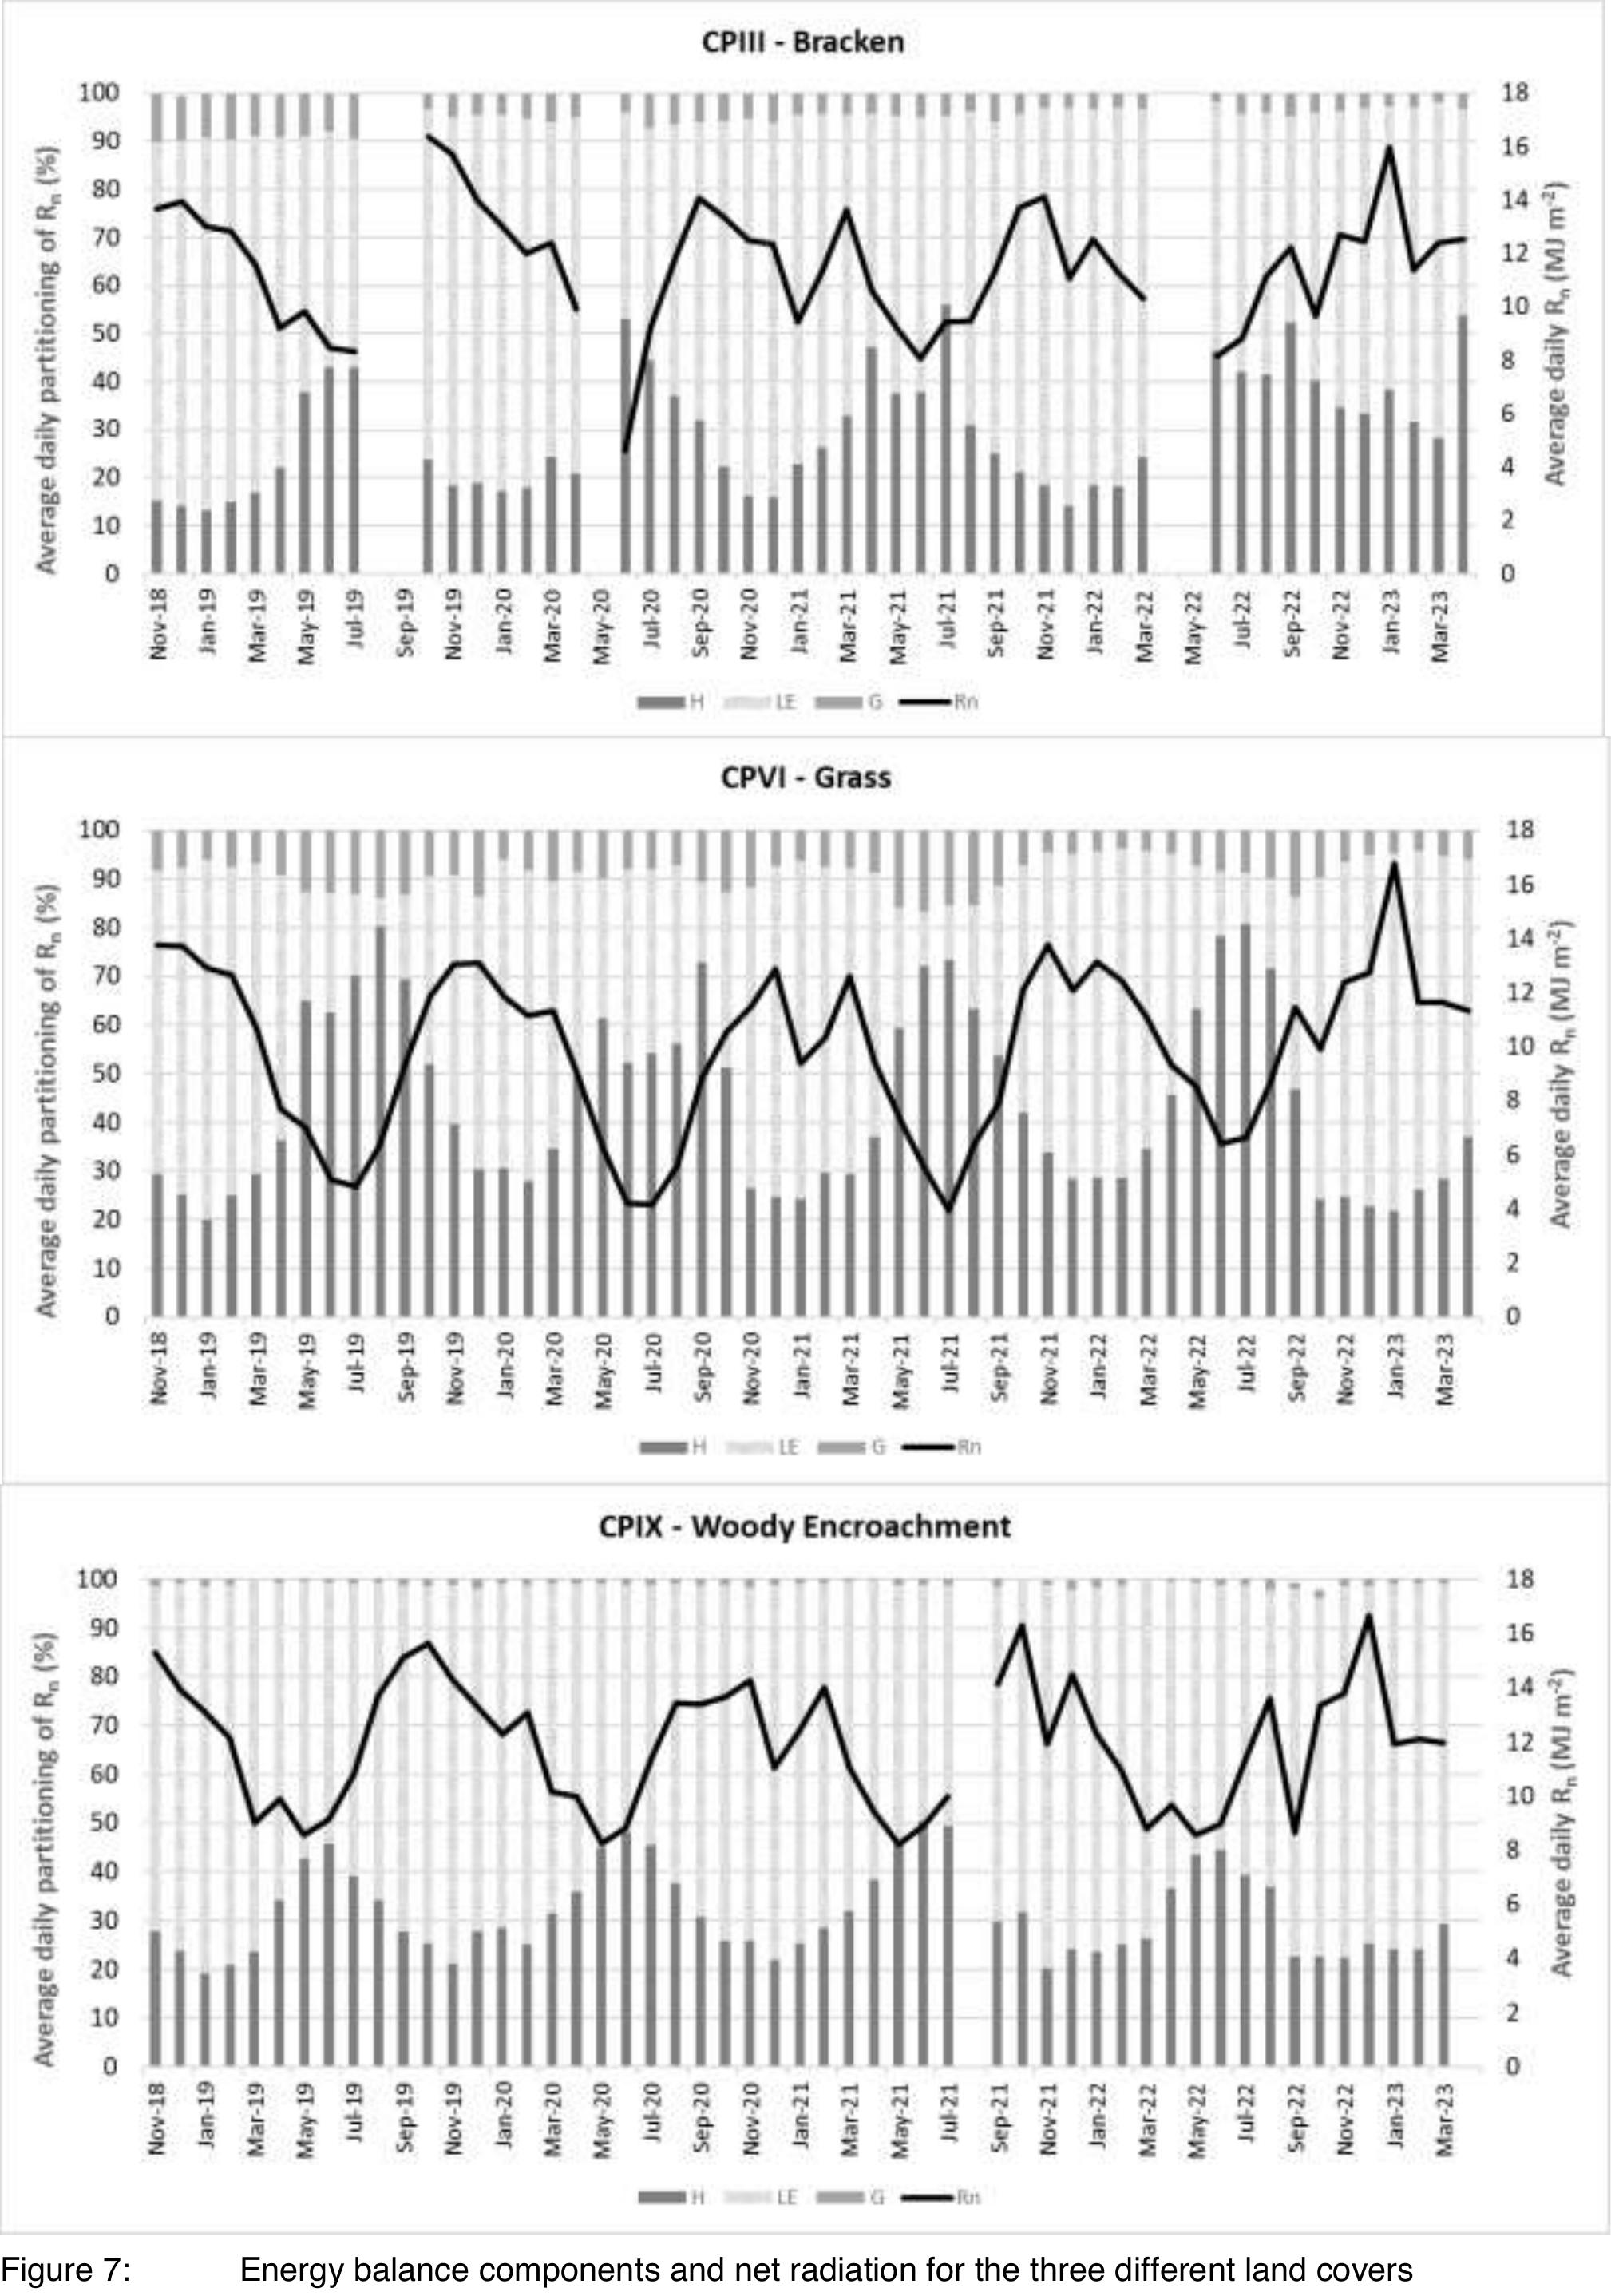
Figure 7: Energy balance components and net radiation for the three different land covers

The albedo over the three land covers has also been compared. The albedo record from the
grassland is shorter than over the bracken and woody species as a net radiometer was used
in Catchment VI until 2021. The albedo over all three land covers does show a seasonal
pattern, however, the albedo of the grassland is more seasonally variable and generally
greater than the albedo over the bracken and woody species. The albedo over the woody
species is the lowest averaging 0.1 and is the most constant over time.
An interestingaspect to note is the change in the grassland catchment albedo in August 2022.
This is attributable to the biennial catchment spring burn. The influence was very clear at the
monthly scale, but even more so atthe daily scale. The changes in the energy balance
components due to the burn are also evident in September and October with larger jumps in
the change in H/LE division compared to previous years. Further, the ET was very low in
August 2022 for the grassland catchment, but was the highestland cover ET in November
2022 when the grass was actively growing following the burn.
Figure 8: Albedo over the grassland, bracken and woody encroached catchments (measured
using a CNR4)
Soil Temperature and Soil Water Content
The soil temperature shows a strong seasonal pattern below the three land covers. The soil
temperatures below the woody encroached species are the generally cooler and less variable.
Whereas, the soil temperature below the bracken ismore variable and is colder in the winter
seasons than the other land covers. The soil temperatures under the grassland are generally
the warmer soils. The differences in the wet, summer season soil temperatures are lower
when the soil water contents are higher, for example, the 2022/2023 summer season. The
soil water contents again show seasonal variability. Over the course of our monitoring, the

soil water contents, particularly in the grassland catchmenthas increased with the higher
rainfalls that have been falling in the 2021/2022 and 2022/2023 summer seasons.
Figure 9: Thirty day moving average of soil temperature below the grassland, bracken and woody
encroached land covers
Figure 10: Daily averaged soil water content below the grassland, bracken and woody encroached
land covers