
Water Research Commission
Submitted to:
Dr Gerhard Backeberg
Executive Manager:Water Utilisation in Agriculture
Water Research Commission
Pretoria
Prepared By:
Project team led by Mahlathini Development Foundation.
Project Number: K5/2719/4
Project Title: Collaborative knowledge creation and mediation strategies for the dissemination of
Water and Soil Conservationpractices and Climate Smart Agriculture in smallholder farming
systems.
Deliverable No.4:Report- CoPs and Demonstration Sites Established
Date: May 2018
Deliverable
4
Submitted to:
Executive Manager: Water Utilisation in Agriculture
Water Research Commission
Pretoria
Project team:
Mahlathini Development Foundation
Erna Kruger
Sylvester Selala
Mazwi Dlamini
Khethiwe Mthethwa
Temakholo Mathebula
Institute of Natural Resources NPC
Jon McCosh
Rural Integrated Engineering (Pty) Ltd
Christiaan Stymie
Rhodes University Environmental Learning Research Centre
Lawrence Sisitka

WRC K4/2719 Deliverable 4: Report CoPs and Demonstration Sites established-May 2018
3
CONTENTS
FIGURES 4
TABLES 4
1OVERVIEW OF PROJECT AND DELIVERABLE 5
Contract Summary 5
Project objectives5
Deliverables 5
Overview of Deliverable 4 6
2Cops and demonStration sites established 8
3CSA practices 8
Further practices suggested by local farmers 17
4Outcomes of CC dialogues (Workshop 1): Definitions, changes, present activities,
impacts 17
Overview 17
Impacts of CC on livelihoods and farming18
5Potential adaptive measures 19
6Continuation of CC dialogues (Workshop 2): Potential adaptive measures,
prioritisation of practices and experimentation planning22
Ezibomvini (KZN) CCAworkshop 2 25
Alice (Eastern Cape) CCA Workshop 29
7Baseline information 32
Household level questionnaires 32
Farmer typologies 35
Scale of operation42
Walkabouts 43
Tabamhlophe43
Ezibomvini 44
Case Study GrainSA SFIP: Conservation Agriculture builds a better life for Mrs Phumelele
Hlongwane (Bergville)45
Conservation Agriculture Experimentation47
Yield results47
Run-off results49
Mvuso (Alice) EC51
8Community level prioritization of Practices for Experimentation 52
Collaborative activities in learning groups 60
Experimentation with vegetable production and tunnels61
Individual experimentation 62
Conservation Agriculture experimentation- Limpopo62
Tunnel and gardening experimentation _KZN- Ezibomvini 65
9Capacity building and publications67
Community level learning 67
Organisational capacity building 67
Post graduate students67
Sanelise Tafa:68
Khethiwe Mthethwa:70
Mazwi Dlamini73
Palesa Motaung75
Publications and networking 80

WRC K4/2719 Deliverable 4: Report CoPs and Demonstration Sites established-May 2018
4
FIGURES
Figure 1: The Smallholder decision support system process ................................................................32
Figure 2:Baseline information for CCA workshop participants .............................................................34
Figure 3: Household, scale of farming and income information for CCA participants .........................35
Figure 4: CAtrial layout for Koko Maphori’s field (Plots highlighted in brown is where runoff plots have
been installed) ......................................................................................................................................65
TABLES
Table 1: Deliverables for the research period; completed .....................................................................5
Table 2: CoPs’ established in three provinces........................................................................................8
Table 3: Summary of climate change impacts from community level workshops ...............................18
Table 4: An example of potential adaptive measures from the Turkey (Limpopo) climate change
dialogue process ...................................................................................................................................19
Table 5: An example of potential adaptive measures from the Thamela (KZN)) climate change dialogue
process ..................................................................................................................................................20
Table 6: An example of potential adaptive measures from the Sekororo (Limpopo) climate change
dialogue process ...................................................................................................................................21
Table 7: 2nd CC workshop agenda outline .............................................................................................23
Table 8:Climate change dialogues; workshops 1 and 2. .......................................................................24
Table 9: Suggested practices for farmers, categorised into the 5 primary themes..............................26
Table 10: Individual volunteers for trench bed experimentation in KZN (Bergville) ............................28
Table 11:CSA Practices: Prioritization by groups and individuals .........................................................29
Table 12: Farmer segmentation in the Bergville smallholder farming system .....................................36
Table 13: Baseline information related to incomes ..............................................................................37
Table 14: Farmer typology for the WRC-CCA process ..........................................................................40
Table 15:Summary of scale of operation for present participants in the WRC-CCA process ...............42
Table 16 : Participants in quantitative measurements for trials; KZN and Limpopo ...........................60
Table 17: Participants in the individual CA farmer experimentation in Limpopo ...............................62
Table 18: Individual experimentation with trench beds, mixed cropping and mulching for the
Ezibomvini Learning Group ...................................................................................................................65

WRC K4/2719 Deliverable 4: Report CoPs and Demonstration Sites established-May 2018
5
Report-CoPsanddemonstrationsites
established
1OVERVIEW OF PROJECT AND DELIVERABLE
Contract Summary
Project objectives
1.To evaluate and identify best practice options for CSA and Soil and Water Conservation
(SWC) in smallholder farming systems, in two bioclimatic regions in South Africa. (Output 1)
2.To amplify collaborative knowledge creation of CSA practices with smallholder farmers in
South Africa (Output 2)
3.To test and adapt existing CSA decision support systems (DSS) for the South African smallholder
context (Outputs 2,3)
4.To evaluate the impact of CSA interventions identified through the DSS by piloting interventions
in smallholder farmer systems, considering water productivity, social acceptability and farm-scale
resilience (Outputs 3,4)
5.Visual and proxy indicators appropriate for a Paymentfor Ecosystems based model aretested at
community level for local assessment of progress and tested against field and laboratory analysis
of soil physical and chemical properties, and water productivity (Output 5)
Deliverables
Table 1: Deliverables for the research period; completed
No
Deliverable
Description
Target date
FINANCIAL YEAR 2017/2018
1
Report: Desktop review of
CSA and WSC
Desktop review of current science, indigenous and traditional
knowledge, and best practice in relation to CSA and WSC in the
South African context
1 June 2017
2
Report on stakeholder
engagement and case
study development and
site identification
Identifying and engaging with projects and stakeholders
implementing CSA and WSC processes and capturing case studies
applicable to prioritized bioclimatic regions
Identification of pilot research sites
1 September
2017
3
Decision support system
for CSA in smallholder
farming developed
(Report)
Decision support system for prioritization of best bet CSA options in
a particular locality; initial database and models. Review existing
models, in conjunction with stakeholder discussions for initial
criteria
15 January
2018
FINANCIAL YEAR: 2018/2019
4
CoPs and demonstration
sites established (report)
Establish communities of practice (CoP)s including stakeholders and
smallholder farmers in each bioclimatic region.5. With each CoP,
identify and select demonstration sites in each bioclimatic region
and pilot chosen collaborative strategies for introduction of a range
of CSA and WSC strategies in homestead farming systems (gardens
and fields)
1 May 2018
5
Interim report: Refined
decision support system
for CSA in smallholder
farming (report)
Refinement of criteria and practices, introduction of new ideas and
innovations, updating of decision support system
1 October
2018
6
Interim report: Results of
pilots, season 1
Pilot chosen collaborative strategies for introduction of a range of
CSA and WSC strategies, working with the CoPs in each site and the
decisions support system. Create knowledge mediation productions,
31 January
2019
WRC K4/2719 Deliverable 4: Report CoPs and Demonstration Sites established-May 2018
6
manuals, handouts and other resources necessary for learning and
implementation.
FINANCIAL YEAR 2019/2020
7
Report: Appropriate
quantitative measurement
procedures for verification
of the visual indicators.
Set up farmer and researcher level experimentation
1 May 2019
8
Interim report:
Development of indicators,
proxies and benchmarks
and knowledge mediation
processes
Document and record appropriate visual indicators and proxies for
community level assessment, work with CoPs to implement and
refine indicators. Link proxies and benchmarks to quantitative
research to verify and formalise. Explore potential incentive
schemes and financing mechanisms.
Analysis of contemporary approaches to collaborative knowledge
creation within the agricultural sector. Conduct survey of present
knowledge mediation processes in community and smallholder
settings. Develop appropriate knowledge mediation processes for
each CoP. Develop CoP decision support systems
1 August
2019
9
Interim report: results of
pilots, season 2
Pilot chosen collaborative strategies for introduction of a range of
CSA and WSC strategies, working with the CoPs in each site and the
decisions support system. Create knowledge mediation productions,
manuals, handouts and other resources necessary for learning and
implementation.
31 January
2020
FINANCIAL YEAR 2020/2021
10
Final report: Results of
pilots, season
Pilot chosen collaborative strategies for introduction of a range of
CSA and WSC strategies , working with the CoPs in each site and the
decisions support system. Create knowledge mediation productions,
manuals, handouts and other resources necessary for learning and
implementation.
1 May 2020
11
Final Report: Consolidation
and finalisation of decision
support system
Finalisation of criteria and practices, introduction of new ideas and
innovations, updating of decision support system
3 July 2020
12
Final report - Summarise
and disseminate
recommendations for best
practice options.
Summarise and disseminate recommendations for best practice
options for knowledge mediation and CSA and SWC techniques for
prioritized bioclimatic regions
7 August
2020
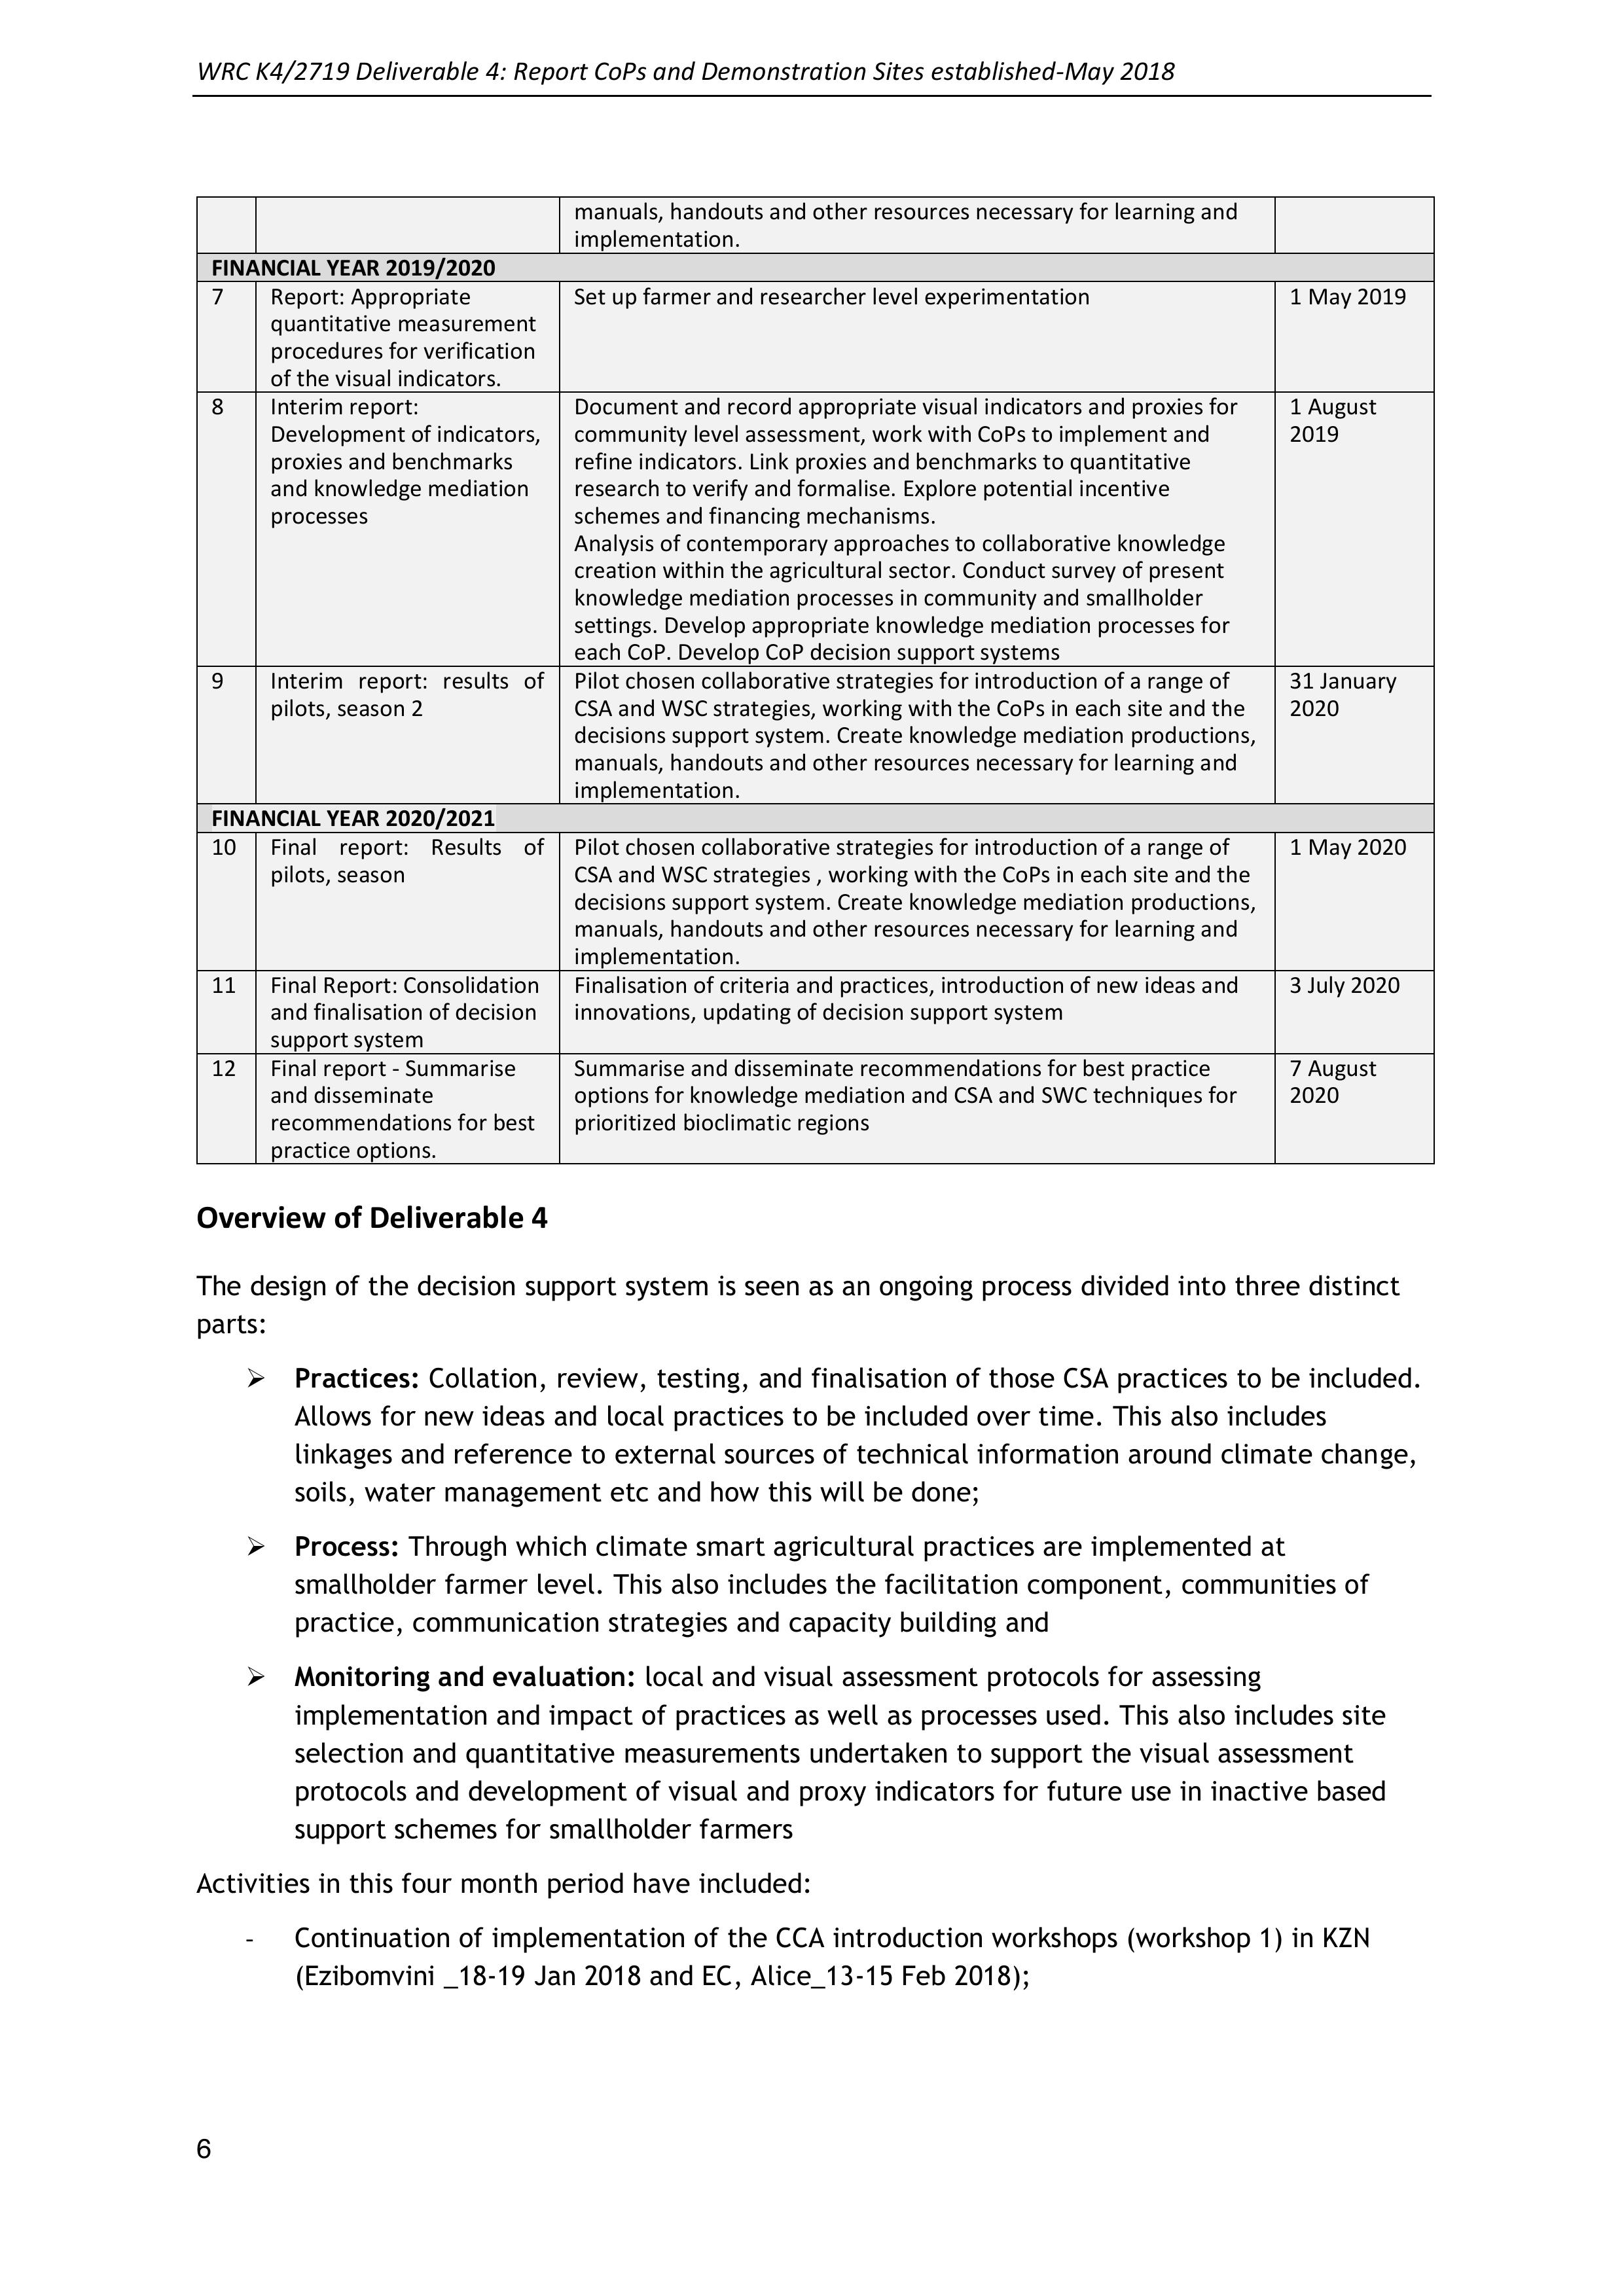
Overview of Deliverable 4
The design of the decision support system is seen as an ongoing process divided into three distinct
parts:
➢Practices: Collation, review, testing, and finalisation of those CSA practices to be included.
Allows for new ideas and local practices to be included over time. This also includes
linkages and reference to external sources of technical information around climate change,
soils, water management etc and how this will be done;
➢Process: Through which climate smart agricultural practices are implemented at
smallholder farmer level. This also includes the facilitation component, communities of
practice, communication strategies and capacity building and
➢Monitoring and evaluation: local and visual assessment protocols for assessing
implementation and impact of practices as well as processes used. This also includes site
selection and quantitative measurements undertaken to support the visual assessment
protocols and development of visual and proxy indicators for future use in inactive based
support schemes for smallholder farmers
Activities in this four month period have included:
-Continuation of implementation of the CCA introduction workshops (workshop 1) in KZN
(Ezibomvini _18-19 Jan 2018 and EC, Alice_13-15 Feb 2018);

WRC K4/2719 Deliverable 4: Report CoPs and Demonstration Sites established-May 2018
7
-Initiation of collaborative activities in 6 villages (KZN and Limpopo): Tunnels and drip kits
(Thabamhlophe, Ezibomvini, Eqeleni_29-31 Jan 2018 Sedawa, Lourene, Turkey_9-12 April
2018); CSA gardening practices (Turkey_ Jan, March 2018)
-Team planning meeting; including training of trainers (16 March 2018)_ Outline and
planning for CCA workshop 2 (Prioritization of practices)
-Implementation of CCA Workshop 2 in 3 villages (KZN and EC): Ezibomvini (22,23 March
2018), Thabamhlophe (17-18 April 2018), Alice (16-17 April 2018).
-Dialogues in climate change adaptation- including prioritization of practices – Limpopo (13-
15 March 2018)
-Visual and descriptive outlines of all practices in the database; Attached as a separate
document
-Set up of sites for quantitative measurements: KZN – field sites (Ezibomvini, Eqeleni,
Mhlwazini); garden site (Ezibomvini), Limpopo – field sites (Sedawa, Mametje, Botshabelo)
garden site (Sedawa); weather stations, run-off plots, gravimetric water sampling, soil
health sampling, soil fertility sampling, chameleon water sensors.
-Capacity building and publications:
oResearch presentations and chapters:
▪Khethiwe Mthethwa – Agric Honours( UKZN -Completed cum
laude);Investigating the sustainability of adoption of conservation
agriculture by small-scale farmers in Bergville, Dec 2017),
▪Mazwi Dlamini – M Phil (PLAAS UWC-yr 2); completed proposal and research
methodology
▪Palesa Motaung- M Agric (UP- yr 2); completed proposal and research
methodology
oNewsletter articles: Adaptation Network newsletter, SA Grain Newsletter, African
Farming.Com - Feature
oRangeland learning exchange visit (UCPP_6-8 Feb 2018), Regenerative Agriculture
oConference-Reitz (GrainSA and Landbouweekblad_19-20 March 2018).

WRC K4/2719 Deliverable 4: Report CoPs and Demonstration Sites established-May 2018
8
2COPS AND DEMONSTRATION SITES ESTABLISHED
Table 2: CoPs’ established in three provinces
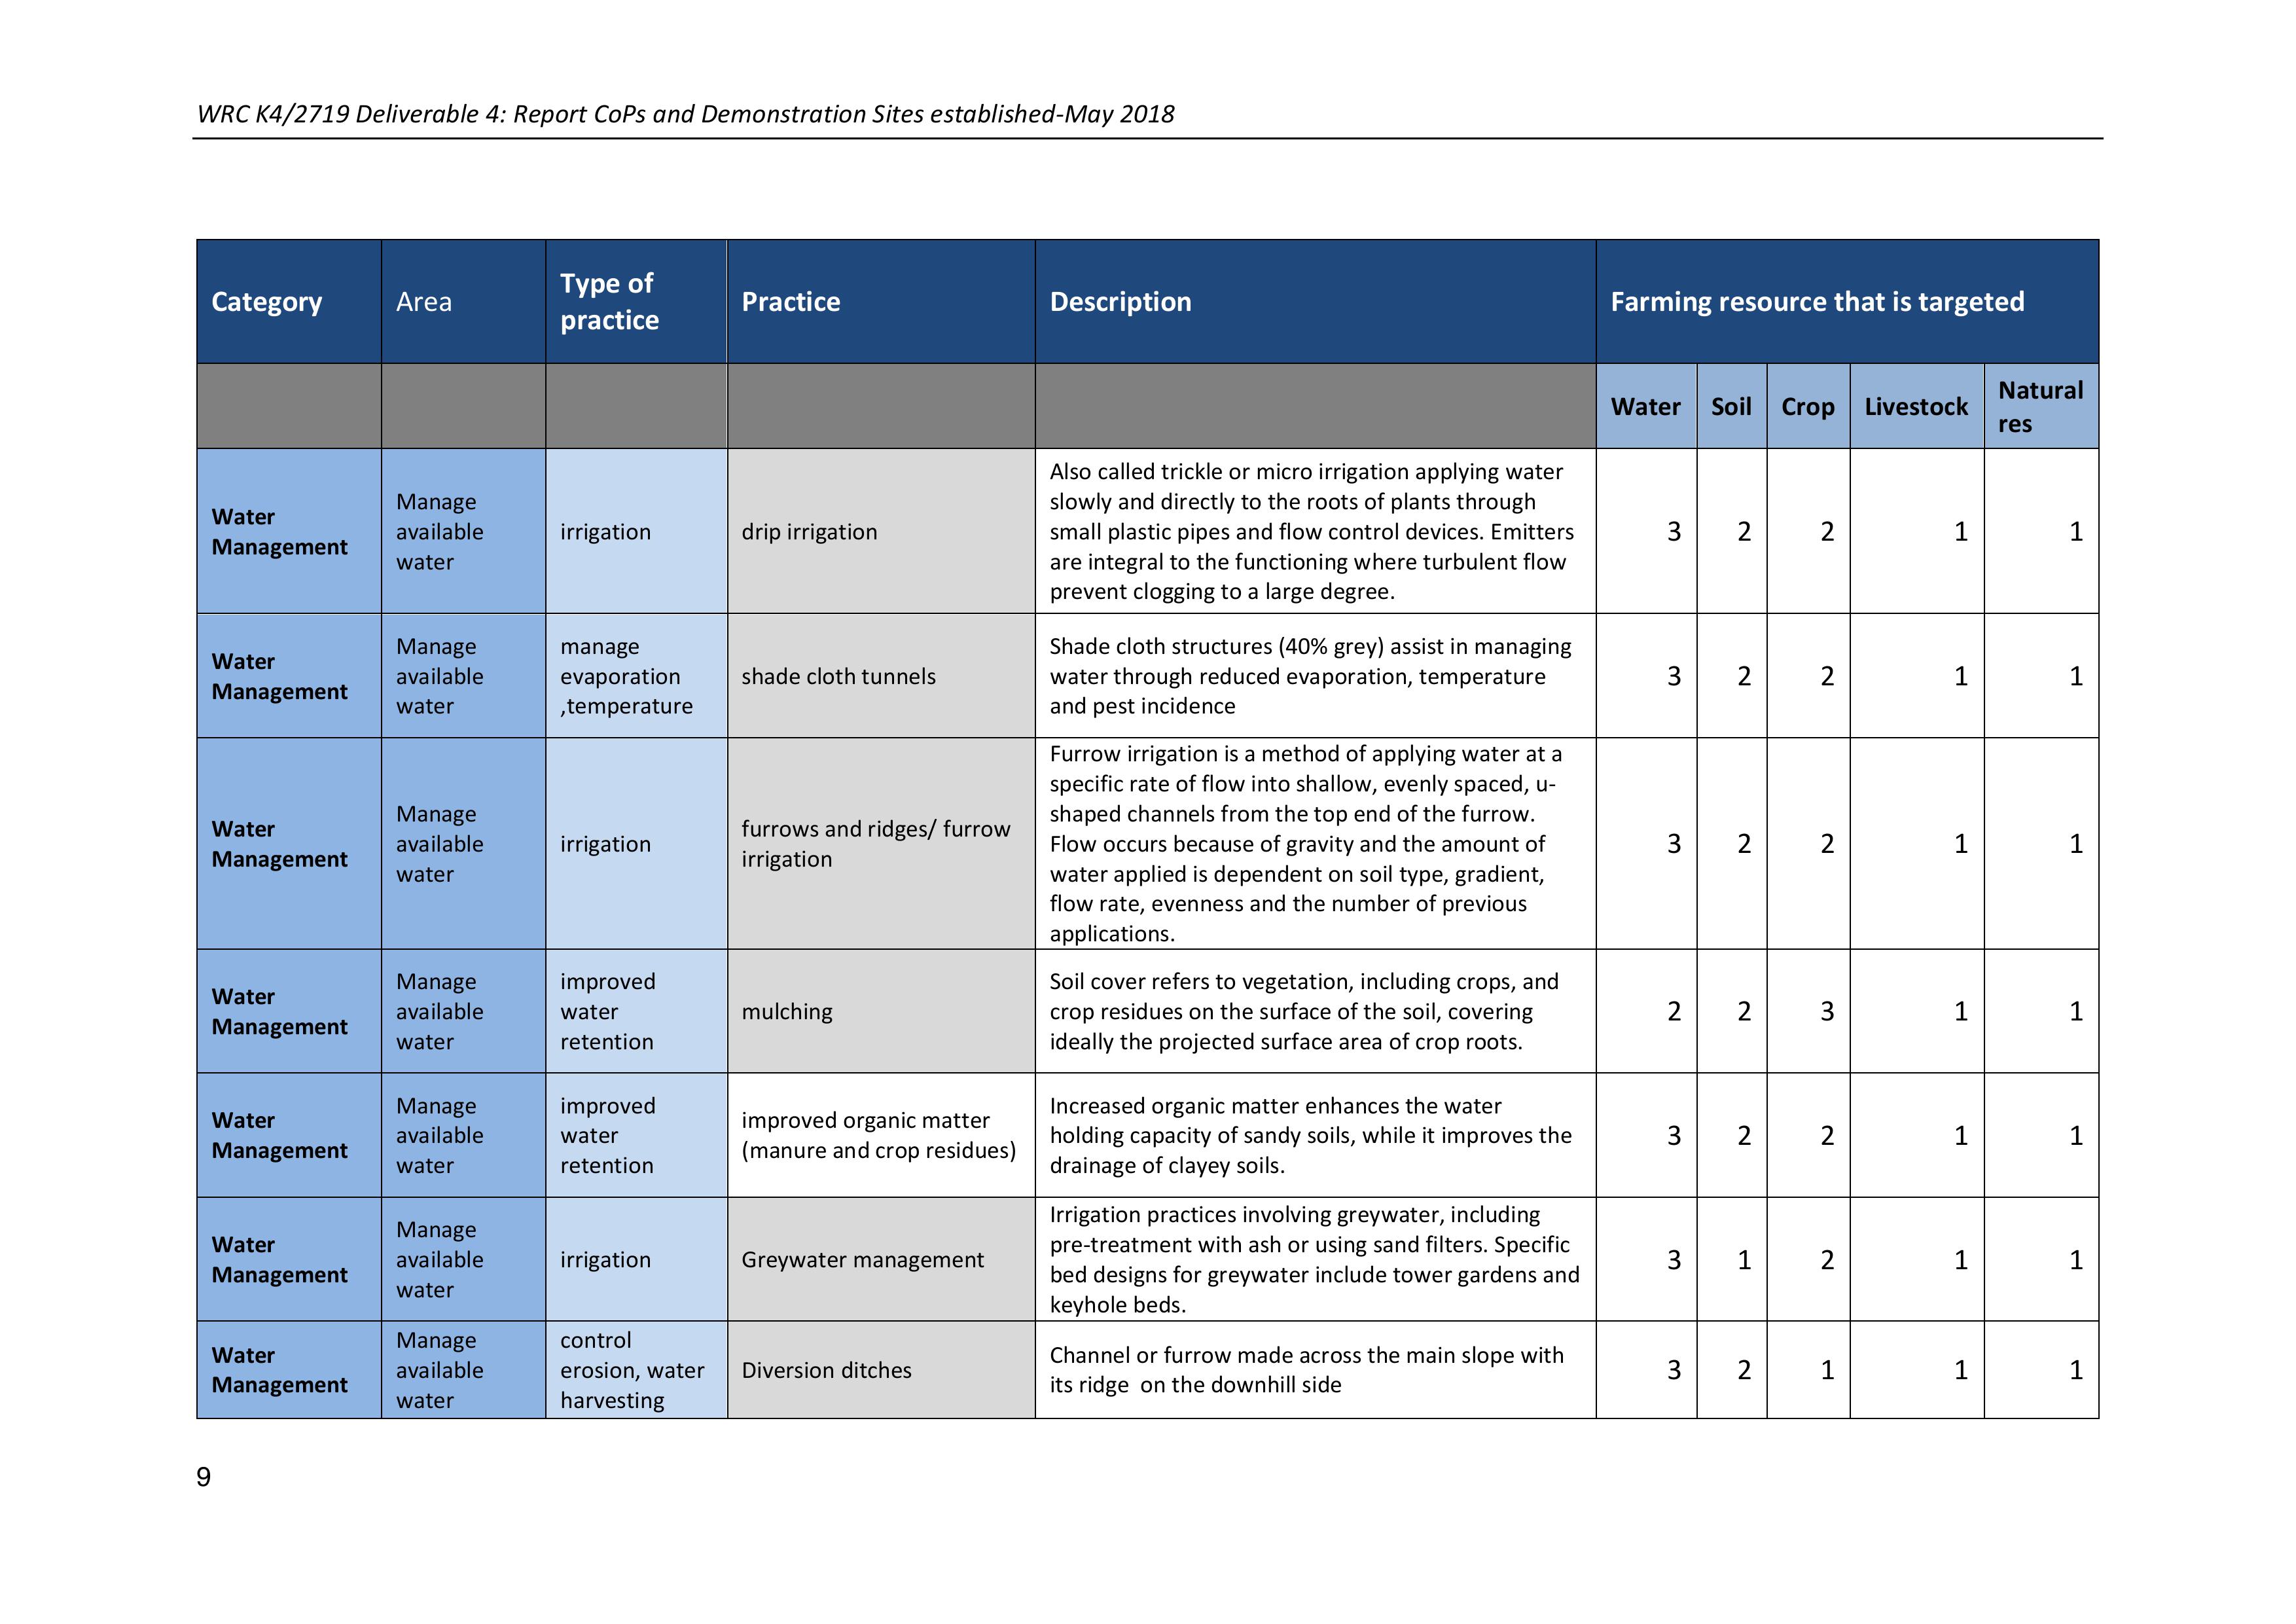
3CSA PRACTICES
A little more work was done on the practices database, providing for a focus on the Agroforestry and
Livestock management options and coming up with the first ideas around these two important
farming system processes.
Province
Site/Area;
villages
Demonstration
sites
CoPs
Collaborative strategies
KZN
Tabamhlophe
- 1st CC workshop
- Collaborative
strategies:
-2nd CC workshop
-Farmers w NGO
support (Lima RDF)
- Tunnels and drip kits
- Individual experimentation
with basket of options
Ezibomvini/
Thamela, Eqeleni
- 1st CC workshop
-Collaborative
strategies
-2nd CC workshop
-CA open days,
cross visits
(LandCare, DARD,
ARC, GrainSA), LM
Agric forums, ….
- Tunnels (Quantitative
measurements
- CA farmer experimentation
(Quantitative measurements)
– case studies
-Individual experimentation
with basket of options
Limpopo
Mametja
(Sedawa, Turkey,
- 1st CC workshop
- 3rd DICLAD
workshop
- Collaborative
strategies:
-Agroecology
network
(AWARD/MDF)
- Tunnels (Quantitative
measurements
- CA farmer experimentation
(Quantitative measurements)
– case studies
- Individual experimentation
with basket of options
Tzaneen
(Sekororo -
Lourene)
- 1st CC workshop
- Collaborative
strategies
-Tunnels and drip kits
EC
Alice/Middledrift
area
- 1st CC workshop
-2nd CC workshop
Imvotho Bubomi
Learning Network
(IBLN) - ERLC, Fort
Cox, Farmers, Agric
Extension services,
NGOs
-Individual and collaborative
experimentation with basket
of options
WRC K4/2719 Deliverable 4: Report CoPs and Demonstration Sites established-May 2018
9
Category
Area
Type of
practice
Practice
Description
Farming resource that is targeted
Water
Soil
Crop
Livestock
Natural
res
Water
Management
Manage
available
water
irrigation
drip irrigation
Also called trickle or micro irrigation applying water
slowly and directly to the roots of plants through
small plastic pipes and flow control devices. Emitters
are integral to the functioning where turbulent flow
prevent clogging to a large degree.
3
2
2
1
1
Water
Management
Manage
available
water
manage
evaporation
,temperature
shade cloth tunnels
Shade cloth structures (40% grey) assist in managing
water through reduced evaporation, temperature
and pest incidence
3
2
2
1
1
Water
Management
Manage
available
water
irrigation
furrows and ridges/ furrow
irrigation
Furrow irrigation is a method of applying water at a
specific rate of flow into shallow, evenly spaced, u-
shaped channels from the top end of the furrow.
Flow occurs because of gravity and the amount of
water applied is dependent on soil type, gradient,
flow rate, evenness and the number of previous
applications.
3
2
2
1
1
Water
Management
Manage
available
water
improved
water
retention
mulching
Soil cover refers to vegetation, including crops, and
crop residues on the surface of the soil, covering
ideally the projected surface area of crop roots.
2
2
3
1
1
Water
Management
Manage
available
water
improved
water
retention
improved organic matter
(manure and crop residues)
Increased organic matter enhances the water
holding capacity of sandy soils, while it improves the
drainage of clayey soils.
3
2
2
1
1
Water
Management
Manage
available
water
irrigation
Greywater management
Irrigation practices involving greywater, including
pre-treatment with ash or using sand filters. Specific
bed designs for greywater include tower gardens and
keyhole beds.
3
1
2
1
1
Water
Management
Manage
available
water
control
erosion, water
harvesting
Diversion ditches
Channel or furrow made across the main slope with
its ridge on the downhill side
3
2
1
1
1

WRC K4/2719 Deliverable 4: Report CoPs and Demonstration Sites established-May 2018
10
Water
Management
Manage
available
water
control erosion
Grass water ways
Shaped or graded channels with suitable vegetation,
designed to intermittently carry surface water runoff
at non-erosive velocities to stable outlets.
2
3
2
1
1
Water
Management
Increase
available
water
water
harvesting, soil
fertility
infiltration pits / banana
circles
0.7m-1.5m deep pits/basins dug in water flow lines
to control water movement and filled with organic
matter for improved soil fertility. Various planting
regimes including bananas
3
2
3
1
1
Water
Management
Increase
available
water
water
harvesting
rain water harvesting
The collection of run off from rain, roof and other
surfaces for productive use in and outside the field.
Both infield and storage options are available
3
2
2
1
1
Water
Management
Increase
available
water
water
harvesting
tied ridges
Increases the water availability by collecting rainfall
from an unplanted sloping basin and catching it with
a furrow and ridge. Planting takes place on either
side of the furrow where the water has infiltrated.
3
2
2
1
1
Water
Management
Increase
available
water
water
harvesting, soil
erosion control
Half moon basins
These are small semi circular earth bunds for
catching water flowing down a slope
3
2
2
1
1
Water
Management
Increase
available
water
water
harvesting
small dams
2m-5m deep pond constructed to catch water during
the rainy season with a clay core, a wall (for larger
earth dams) and a spillway to let go off excess water
3
2
2
1
1
Soil
Management
Control soil
movement
control erosion
Contours; ploughing and
planting
Ploughing and or planting along the contours of the
land in order to minimize soil erosion. Can use line
levels, A-frames, dumpy levels etc to mark contours
2
3
2
1
1
Soil
Management
Control soil
movement
control erosion
gabions
Rectangular baskets fabricated from a hexagonal
mesh of heavily galvanized iron, filled with stones/
gravel for erosion control steel wire filled with rock
and stacked atop one another to form a gravity type
wall.
2
3
2
1
1
Soil
Management
Control soil
movement
control
erosion, water
harvesting
Stone bunds
Used along contour lines to slow down, filter and
spread out runoff water, thus increasing infiltration
and reducing soil erosion.
2
3
2
1
1

WRC K4/2719 Deliverable 4: Report CoPs and Demonstration Sites established-May 2018
11
Soil
Management
Control soil
movement
control
erosion, water
harvesting
check dams
These are small dams constructed across a drainage
ditch, or waterway to counteract erosion by reducing
water flow velocity and allowing sedimentation of
silt.
2
3
2
1
1
Soil
Management
Control soil
movement
control
erosion, water
harvesting
Swales
Swales are ditches and bunds constructed on
contour to manage water flow and sedimentation.
Mulching and planting occurs in both the ditch and
on the bunds
2
3
3
1
1
Soil
Management
Control soil
movement
control
erosion, water
harvesting
Zai pits
Hand dug 0.6m diameter and 0.3m deep circular
holes that collect and store water for crop use
3
2
3
1
1
Soil
Management
Control soil
movement
control
erosion, water
harvesting
Terraces
A terrace is a level strip of soil built along the
contour of a slope and supported by an earth or
stone bund, or rows of old tyres for example
2
3
2
1
1
Soil
Management
Control soil
movement
control
erosion, water
harvesting
Stone packs
Like gabions and check dams these are constructed
across gulleys or water flow paths to control erosion,
slow surface water flow rate and promote
sedimentation
2
3
2
1
1
Soil
Management
Control soil
movement
control
erosion, crops,
livestock,
natural
resources
Strip cropping
Strip cropping is a strategy for subdividing single
fields on slopes into strips that follow contours;
where different crops are planted; a mixture of
annual and perennial crops are usually used.
2
3
3
2
1
Soil
Management
Control soil
movement
control erosion
Pitting
Pitting is carried out in large fields or areas prone to
sheet and wind erosion where the whole area is
imprinted with small pits- into which sediment and
seeds can be blown for germination when it rains.
2
3
2
2
2
Soil
Management
Control soil
movement
control
erosion, soil
fertility
Woodlots for soil
reclamation
Trees planted in an eroded area will assist with
recuding the flow rate of surface water and thus help
to prevent further erosion.
1
3
1
1
3
Soil
Management
Improve soil
fertility
soil nutrients
Targeted application of
small quantities of
fertilizer, lime etc
Use of site specific fertilizer recommendation and
more efficient use of fertilizer (using the right,
source, at right time, at right place and applying the
right rate) , liming to manage soil acidity (surface
liming and incorporation).
2
1
3
1
1

WRC K4/2719 Deliverable 4: Report CoPs and Demonstration Sites established-May 2018
12
Soil
Management
Improve soil
fertility
soil nutrients
Liquid manures
Brews are made of animal and plant matter as liquid
supplements to soil fertility,
1
1
3
1
1
Soil
Management
Improve soil
fertility
soil nutrients,
livestock
fodder
Woody hedgerows for
browse, mulch, green
manure, soil conservation
Growing leguminous tree shrubs in narrow strips
across the slope and material used a green manure
1
2
3
2
2
Soil
Management
Improve soil
fertility and
health
manage water,
control erosion
and soil
health, crops,
livestock
Conservation Agriculture
Three main principles of minimal soil disturbance (no
ploughing), soil cover (stover, mulching and cropping
patterns) and diversity ( inter cropping, relay
cropping and cover crops) upheld in the field
cropping system
2
2
3
2
2
Soil
Management
Improve soil
fertility and
soil health
soil nutrients
Planting legumes, manure,
green manures
Use of legumes , manures (improved) and green
manures in specific combinations to improve soil
fertility and soil health.
1
2
3
1
1
Soil
Management
Improve soil
fertility and
soil health
soil nutrients,
crops
Mixed cropping
Managing soil health and pest and disease incidence
through crop combinations; mixed cropping, inter
cropping, crop rotation
1
2
3
2
1
Soil
Management
Improve soil
fertility and
soil health
soil nutrients,
crops
Herbs and multifunctional
plants
Managing soil health and pest and disease incidence
through crop combinations; using herbs and
multifunctional plants - including windbreaks, trap
cropping, pest deterrents, bee fodder etc
1
2
3
2
1
Soil
Management
Improve soil
fertility and
health
soil nutrients,
crops,
livestock
Agroforestry options
(multipurpose, fast growing
trees and fodder species)
Land use management system in which trees or
shrubs are grown around or among crops or
pastureland
2
2
3
3
1
Soil
Management
Improve soil
fertility and
health
soil nutrients,
crops
Bed design; trench beds,
eco circles
Intensive beds dug out and filled with a range of
organic matter ( dry, wet manure, bones, ash etc) to
provide for highly fertile beds with high water
holding capacity - e.g. trench beds, shallow trenches,
eco-circles
2
2
3
1
1
Soil
Management
Improve soil
fertility and
health
soil nutrients,
crops
Understand soil health
aspects using visual
indicators
Using visual indicators for soil type, soil aggregates,
porosity, soil mottles, infiltration etc can assist in
planning appropriate soil management structures
1
3
2
1
1
WRC K4/2719 Deliverable 4: Report CoPs and Demonstration Sites established-May 2018
13
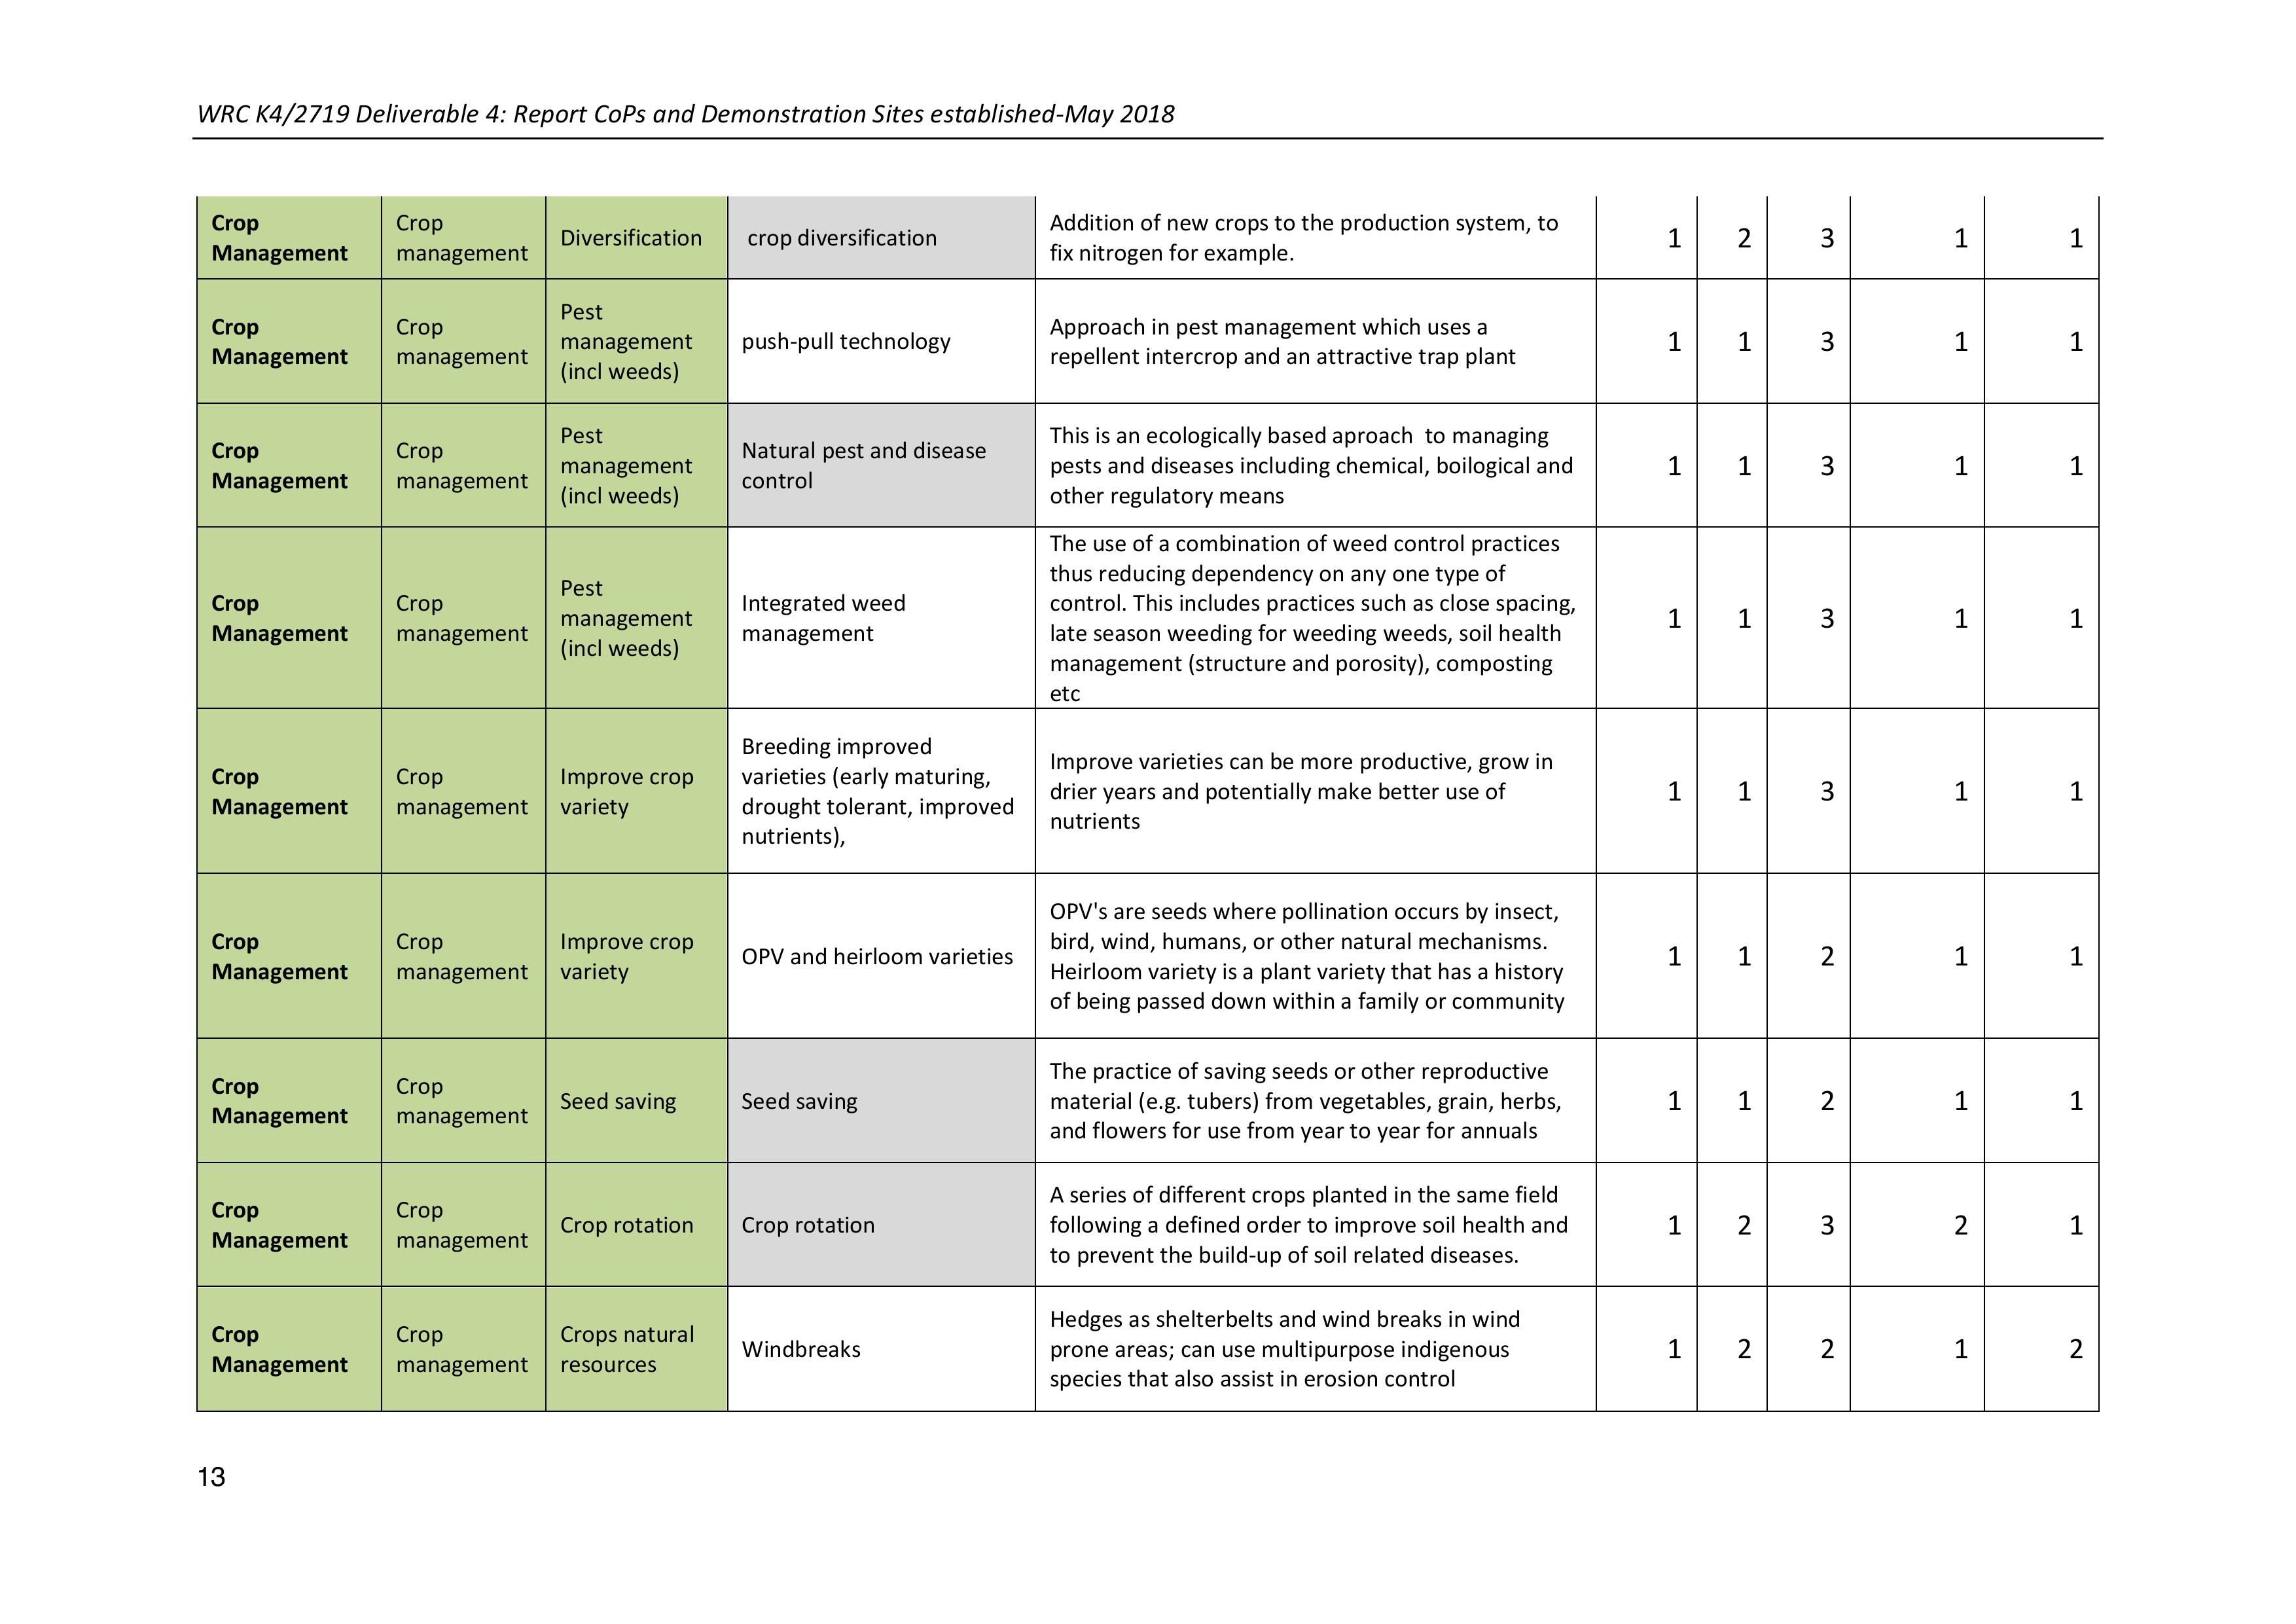
Crop
Management
Crop
management
Diversification
crop diversification
Addition of new crops to the production system, to
fix nitrogen for example.
1
2
3
1
1
Crop
Management
Crop
management
Pest
management
(incl weeds)
push-pull technology
Approach in pest management which uses a
repellent intercrop and an attractive trap plant
1
1
3
1
1
Crop
Management
Crop
management
Pest
management
(incl weeds)
Natural pest and disease
control
This is an ecologically based aproach to managing
pests and diseases including chemical, boilogical and
other regulatory means
1
1
3
1
1
Crop
Management
Crop
management
Pest
management
(incl weeds)
Integrated weed
management
The use of a combination of weed control practices
thus reducing dependency on any one type of
control. This includes practices such as close spacing,
late season weeding for weeding weeds, soil health
management (structure and porosity), composting
etc
1
1
3
1
1
Crop
Management
Crop
management
Improve crop
variety
Breeding improved
varieties (early maturing,
drought tolerant, improved
nutrients),
Improve varieties can be more productive, grow in
drier years and potentially make better use of
nutrients
1
1
3
1
1
Crop
Management
Crop
management
Improve crop
variety
OPV and heirloom varieties
OPV's are seeds where pollination occurs by insect,
bird, wind, humans, or other natural mechanisms.
Heirloom variety is a plant variety that has a history
of being passed down within a family or community
1
1
2
1
1
Crop
Management
Crop
management
Seed saving
Seed saving
The practice of saving seeds or other reproductive
material (e.g. tubers) from vegetables, grain, herbs,
and flowers for use from year to year for annuals
1
1
2
1
1
Crop
Management
Crop
management
Crop rotation
Crop rotation
A series of different crops planted in the same field
following a defined order to improve soil health and
to prevent the build-up of soil related diseases.
1
2
3
2
1
Crop
Management
Crop
management
Crops natural
resources
Windbreaks
Hedges as shelterbelts and wind breaks in wind
prone areas; can use multipurpose indigenous
species that also assist in erosion control
1
2
2
1
2

WRC K4/2719 Deliverable 4: Report CoPs and Demonstration Sites established-May 2018
14
Livestock
Management
Integrated
crop-
livestock
management
Integrated
systems
Trees and bushes lining fish
ponds for optimal pond
conditions and fish
"browsing"
Trees and shrubs are planted on the edge of the
pond to prevent trampling by cattle. Watering points
need to be provided if the pond is used for stock
watering.
3
1
2
2
1
Livestock
Management
Integrated
crop-
livestock
management
Honey
Trees suitable for honey
production
Trees suitable for honey production could be planted
on field edges and unused areas.
1
1
2
1
2
Livestock
Management
Integrated
crop-
livestock
management
Protein rich
trees
Production of protein-rich
tree fodder on
farm/rangelands for cut-
and-carry fodder
production
Protein rich trees like tree Lucerne could enhance
the grazing capacity and assist with soil protection
1
2
2
3
2
Livestock
Management
Integrated
crop-
livestock
management
Woodlots
Woodlots for timber,
fodder, soil protection, soil
reclamation
Appropriate trees planted in an eroded area will
assist with reducing the flow rate of surface water
and thus help to prevent further erosion. It will also
enhance the soil fertility because of the falling
leaves.
1
2
2
2
1
Livestock
Management
Integrated
crop-
livestock
management
Improved
fallow
Woodly legumious crops
planted and left to grow
during fallow phase to
improve fallow
Deliberate planting of leguminous species primarily
for fixing nitrogen as part of crop fallow and rotation
and secondarily for livestock fodder
1
2
3
3
2
Livestock
Management
Integrated
crop-
livestock
management
Shade
Trees planted for shading
crops or animals
A plantation of one or more rows of trees for
shading purposes. This can enhance the production
of dairy cows significantly - if the waiting area is fully
shaded.
1
1
1
3
1
Livestock
Management
Integrated
crop-
livestock
management
Broilers
Small scale broiler
production
Grow broilers in naturally ventilated houses made of
iso-wall panels. Free range optional
1
1
1
3
1
Livestock
Management
Integrated
crop-
livestock
management
Layers
Small scale egg production
Produce eggs in naturally ventilated houses made of
iso-wall panels. Free range optional
1
1
1
3
1
WRC K4/2719 Deliverable 4: Report CoPs and Demonstration Sites established-May 2018
15
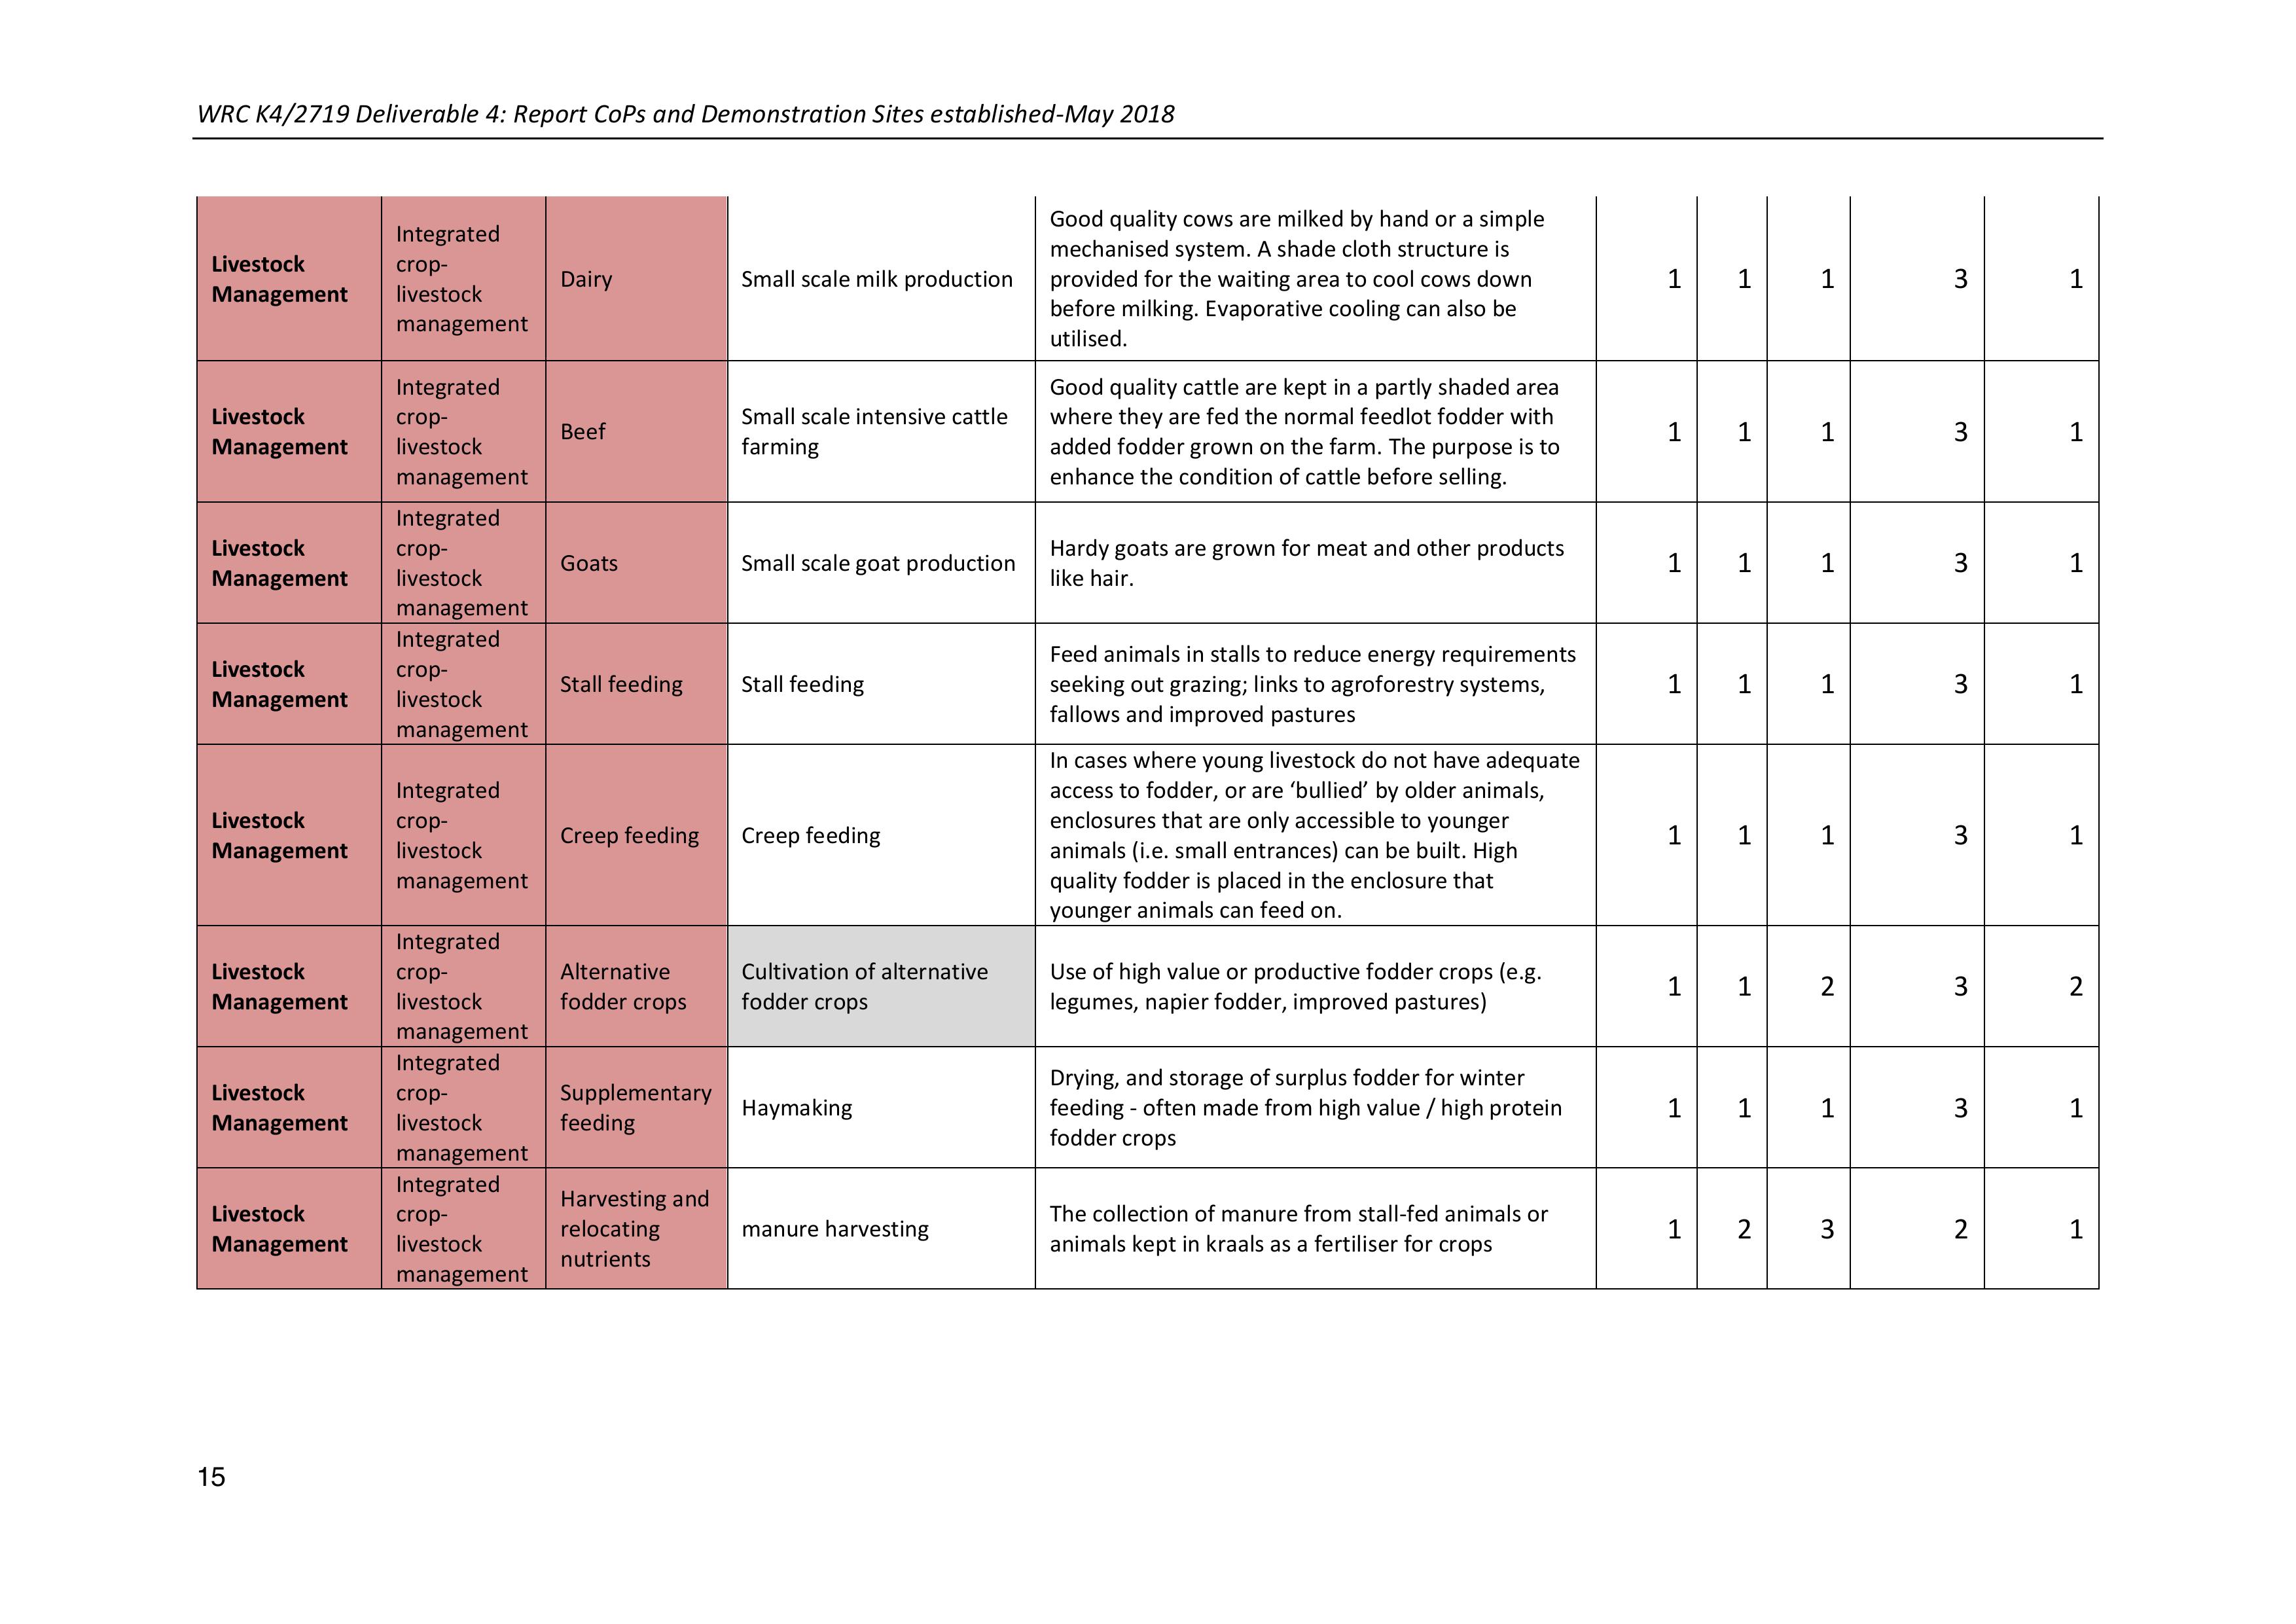
Livestock
Management
Integrated
crop-
livestock
management
Dairy
Small scale milk production
Good quality cows are milked by hand or a simple
mechanised system. A shade cloth structure is
provided for the waiting area to cool cows down
before milking. Evaporative cooling can also be
utilised.
1
1
1
3
1
Livestock
Management
Integrated
crop-
livestock
management
Beef
Small scale intensive cattle
farming
Good quality cattle are kept in a partly shaded area
where they are fed the normal feedlot fodder with
added fodder grown on the farm. The purpose is to
enhance the condition of cattle before selling.
1
1
1
3
1
Livestock
Management
Integrated
crop-
livestock
management
Goats
Small scale goat production
Hardy goats are grown for meat and other products
like hair.
1
1
1
3
1
Livestock
Management
Integrated
crop-
livestock
management
Stall feeding
Stall feeding
Feed animals in stalls to reduce energy requirements
seeking out grazing; links to agroforestry systems,
fallows and improved pastures
1
1
1
3
1
Livestock
Management
Integrated
crop-
livestock
management
Creep feeding
Creep feeding
In cases where young livestock do not have adequate
access to fodder, or are ‘bullied’ by older animals,
enclosures that are only accessible to younger
animals (i.e. small entrances) can be built. High
quality fodder is placed in the enclosure that
younger animals can feed on.
1
1
1
3
1
Livestock
Management
Integrated
crop-
livestock
management
Alternative
fodder crops
Cultivation of alternative
fodder crops
Use of high value or productive fodder crops (e.g.
legumes, napier fodder, improved pastures)
1
1
2
3
2
Livestock
Management
Integrated
crop-
livestock
management
Supplementary
feeding
Haymaking
Drying, and storage of surplus fodder for winter
feeding - often made from high value / high protein
fodder crops
1
1
1
3
1
Livestock
Management
Integrated
crop-
livestock
management
Harvesting and
relocating
nutrients
manure harvesting
The collection of manure from stall-fed animals or
animals kept in kraals as a fertiliser for crops
1
2
3
2
1
WRC K4/2719 Deliverable 4: Report CoPs and Demonstration Sites established-May 2018
16
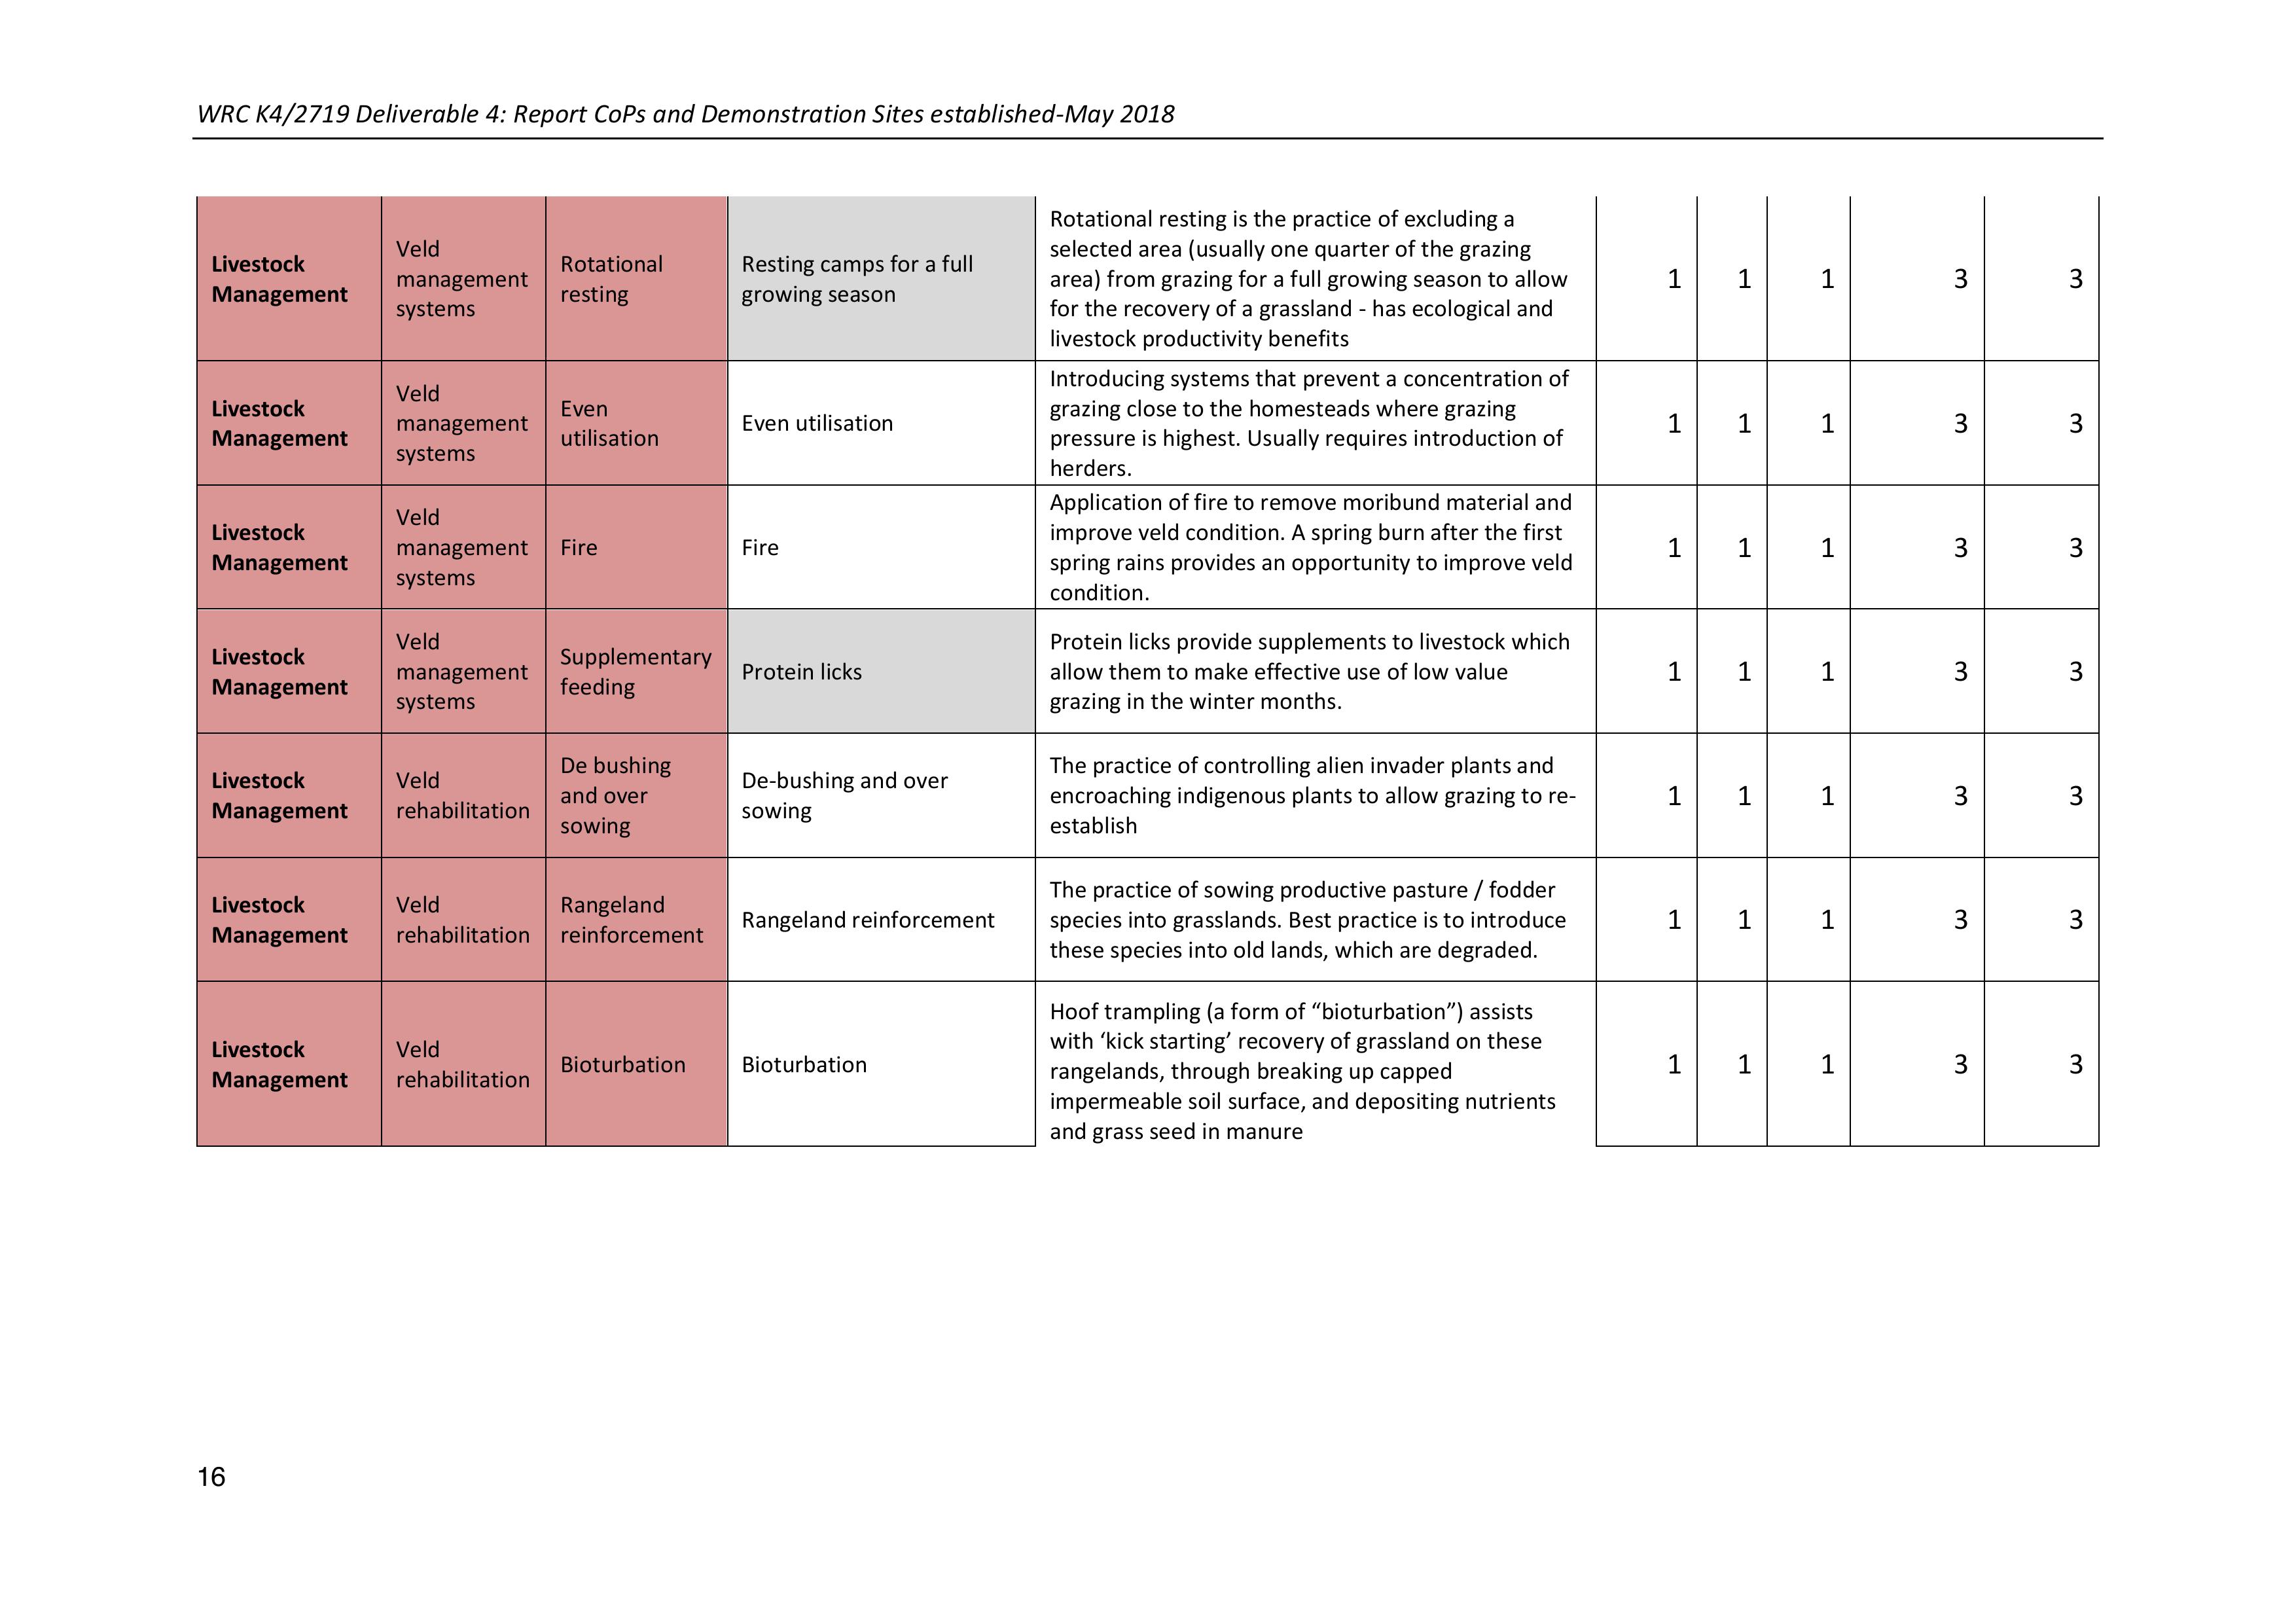
Livestock
Management
Veld
management
systems
Rotational
resting
Resting camps for a full
growing season
Rotational resting is the practice of excluding a
selected area (usually one quarter of the grazing
area) from grazing for a full growing season to allow
for the recovery of a grassland - has ecological and
livestock productivity benefits
1
1
1
3
3
Livestock
Management
Veld
management
systems
Even
utilisation
Even utilisation
Introducing systems that prevent a concentration of
grazing close to the homesteads where grazing
pressure is highest. Usually requires introduction of
herders.
1
1
1
3
3
Livestock
Management
Veld
management
systems
Fire
Fire
Application of fire to remove moribund material and
improve veld condition. A spring burn after the first
spring rains provides an opportunity to improve veld
condition.
1
1
1
3
3
Livestock
Management
Veld
management
systems
Supplementary
feeding
Protein licks
Protein licks provide supplements to livestock which
allow them to make effective use of low value
grazing in the winter months.
1
1
1
3
3
Livestock
Management
Veld
rehabilitation
De bushing
and over
sowing
De-bushing and over
sowing
The practice of controlling alien invader plants and
encroaching indigenous plants to allow grazing to re-
establish
1
1
1
3
3
Livestock
Management
Veld
rehabilitation
Rangeland
reinforcement
Rangeland reinforcement
The practice of sowing productive pasture / fodder
species into grasslands. Best practice is to introduce
these species into old lands, which are degraded.
1
1
1
3
3
Livestock
Management
Veld
rehabilitation
Bioturbation
Bioturbation
Hoof trampling (a form of “bioturbation”) assists
with ‘kick starting’ recovery of grassland on these
rangelands, through breaking up capped
impermeable soil surface, and depositing nutrients
and grass seed in manure
1
1
1
3
3

WRC K4/2719 Deliverable 4: Report CoPs and Demonstration Sites established-May 2018
17
Further practices suggested by local farmers
The practices mentioned below are to be added into the database of practices
-Spring protection
-Biogas digesters
-Different seed varieties
-Planting calendars
-Drought tolerant and bird resistant varieties
-Lizard hotel
-More on greywater management
4OUTCOMES OF CC DIALOGUES (WORKSHOP 1): DEFINITIONS,
CHANGES, PRESENT ACTIVITIES, IMPACTS
Initial Climate Change dialogues, to explore concepts of climate change, the impacts on peoples’ lives
and farming activities and tostart discussions on potential adaptive strategies in these communities
have been undertaken for 7 villages across three provinces. Full reports for a number of these
workshops are attached in Appendices 2-5.
Here a summary of some of the outcomes and discussions will be provided.
Overview
It can be considered that farmers always complain about the weather; especially those reliant on the
weather for crop and livestock production. This meant that our first topic revolved around the
differences between general weather variability and climate change. This was achievedthrough role
plays, slide shows and discussions.
The situation differs across the provinces:
-In Limpopo; there was consensus among participants that it is generally hotter throughout
the whole year than it was in the past (10 years ago) and that they are receiving less rain
than before. They feel that the impact of the recent drought has been a lot more severe
because of these conditions.
-In KZN; farmers are aware of changes in rainfall patterns. They experience more extreme
events (storms, high winds and hail) than before. Temperature variability has also increased
with cold weather at unexpected times, snow both earlier and later than usual in the season
and excessive heat in spring, summer and autumn.
-In the EC; farmers are aware of changes in rainfall patterns. They experience more extreme
events (storms, high winds and hail) than before. They feel that winters are colder than
before. There is greater temperature variability from day to day than before.

WRC K4/2719 Deliverable 4: Report CoPs and Demonstration Sites established-May 2018
18
Impacts of CC on livelihoods and farming
These impacts were first discussed in general terms, then reviewed in terms of comparingthe past
present and future and then interrogated using the impacts mind mapping process.
The table below outlines a summary of impacts mentioned for each province
Table 3: Summary of climate change impacts from community level workshops
Climate change impacts on livelihoods and farming
KZN
EC
Limpopo
Water
Less water in the landscape;
streams and springs dry up,
borehole run dry, soils dry
out quickly after rain
Less water in the landscape;
streams and springs dry up,
borehole run dry, soils dry
out quickly after rain
Less water in the landscape;
streams and springs dry up,
borehole run dry, soils dry
out quickly after rain
Dams dry up
Dams dry up
Dams dry up
Municipal water supply
becoming more unreliable
Municipal water supply
becoming more unreliable
Municipal water supply
becoming more unreliable;
Need to buy water for
household use – now
sometimes for more than 6
months of the year
RWH storage only enough for
household use.
Soil
More erosion
More erosion
More erosion
Soils becoming more
compacted and infertile
Soils becoming more
compacted and infertile
Soils becoming more
compacted and infertile
Soils too hot to sustain plant
growth
Cropping
Timing for planting has
changed- later
Timing for planting has
changed- later
Can no longer plant dryland
maize
All cropping now requires
irrigation – even crops such
as sweet potato
Drought tolerant crops such
as sorghum and millet grow=-
but severe bird damage
Heat damage to crops
Heat damage to crops
Heat damage to crops
Reduced germination and
growth
Reduced germination and
growth
Reduced germination and
growth
Seeding of legumes
becoming unreliable
Seeding of legumes
becoming unreliable
Seeding of legumes becoming
unreliable
Lower yields
Lower yields
Lower yields
Winter vegetables don’t do
well -stress induced bolting
and lack of growth
More pests and diseases
More pests and diseases
More pests and diseases
Loss of indigenous seed
stocks
Loss of indigenous seed
stocks
Livestock
Less grazing; not enough to
see cattle through winter
Less grazing; not enough to
see cattle through winter
Less grazing; not enough to
see cattle through winter
More disease in cattle and
heat stress symptoms
More disease in cattle and
heat stress symptoms
More disease in cattle and
heat stress symptoms
Fewer calves
Fewer calves
Fewer calves
More deaths
More deaths
More deaths
WRC K4/2719 Deliverable 4: Report CoPs and Demonstration Sites established-May 2018
19
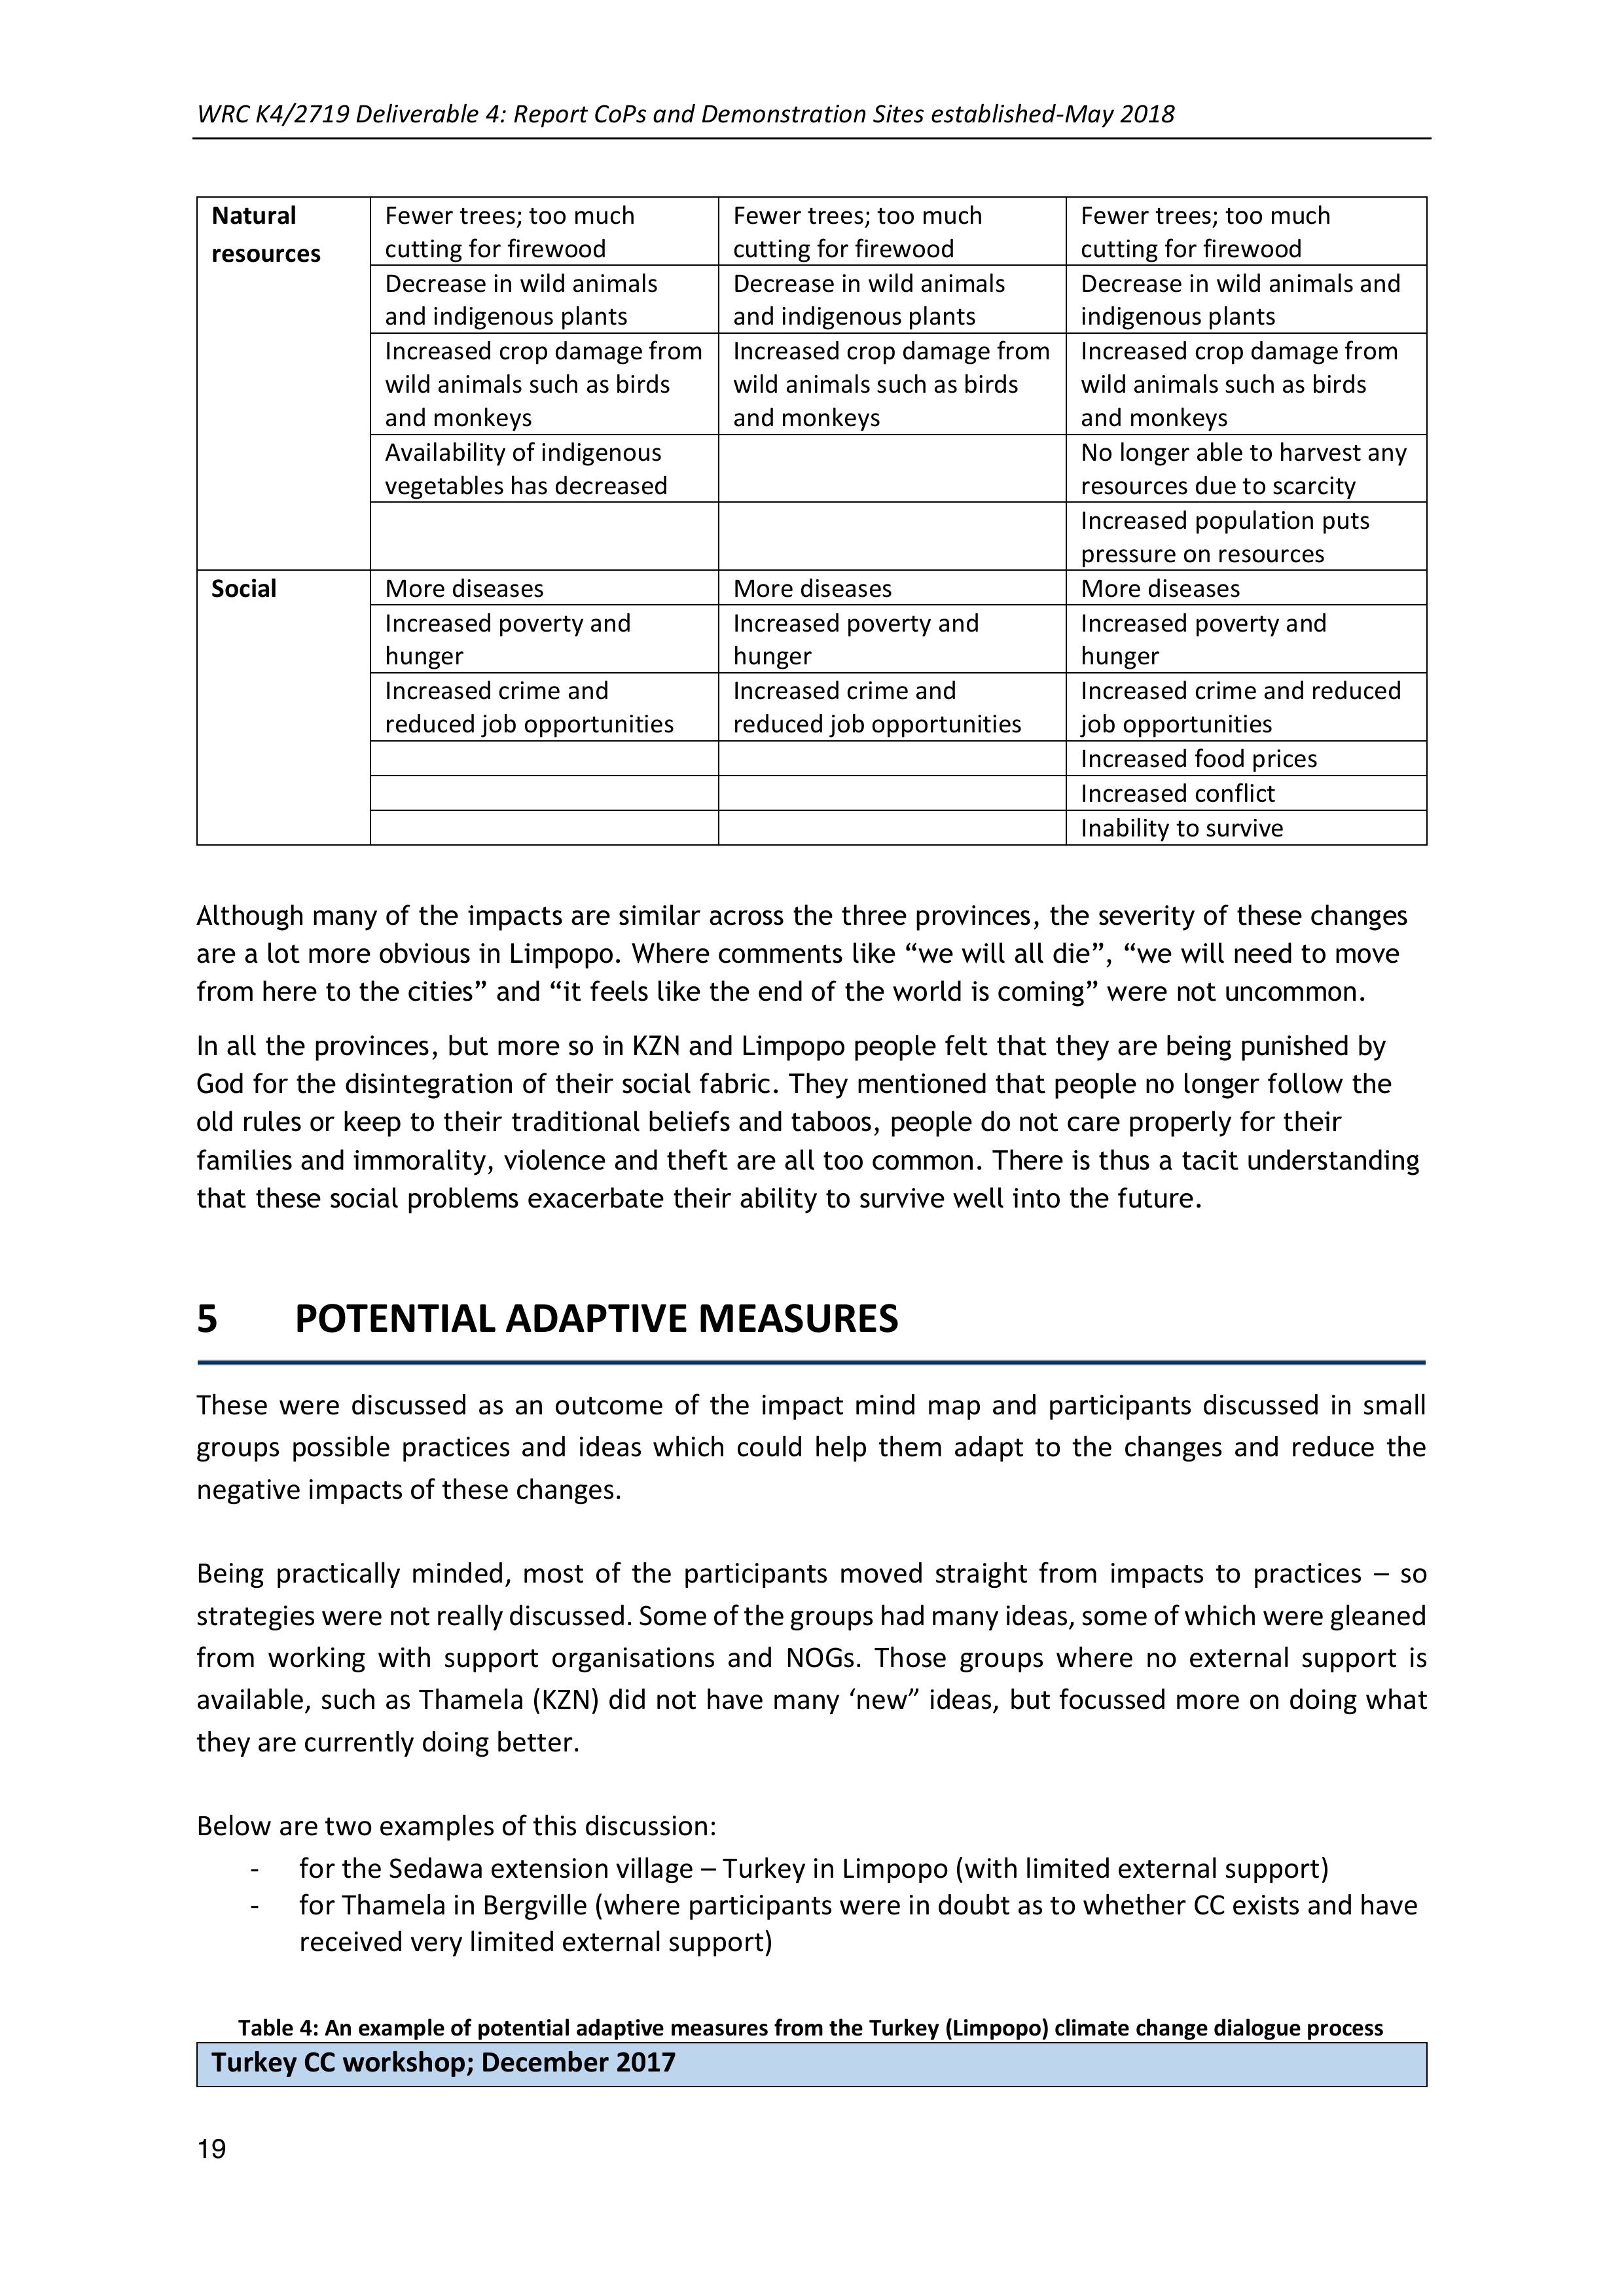
Natural
resources
Fewer trees; too much
cutting for firewood
Fewer trees; too much
cutting for firewood
Fewer trees; too much
cutting for firewood
Decrease in wild animals
and indigenous plants
Decrease in wild animals
and indigenous plants
Decrease in wild animals and
indigenous plants
Increased crop damage from
wild animals such as birds
and monkeys
Increased crop damage from
wild animals such as birds
and monkeys
Increased crop damage from
wild animals such as birds
and monkeys
Availability of indigenous
vegetables has decreased
No longer able to harvest any
resources due to scarcity
Increased population puts
pressure on resources
Social
More diseases
More diseases
More diseases
Increased poverty and
hunger
Increased poverty and
hunger
Increased poverty and
hunger
Increased crime and
reduced job opportunities
Increased crime and
reduced job opportunities
Increased crime and reduced
job opportunities
Increased food prices
Increased conflict
Inability to survive
Although many of the impacts are similar across the three provinces, the severity of these changes
are a lot more obvious in Limpopo. Where comments like “we will all die”, “we will need to move
from here to the cities” and “it feels like the end of the world is coming” were not uncommon.
In all the provinces, but more so in KZN and Limpopo people felt that they are being punished by
God for the disintegration of their social fabric. They mentioned that people no longer follow the
old rules or keep to their traditional beliefs and taboos, people do not care properly for their
families and immorality, violence and theft are all too common. There is thus a tacit understanding
that these social problems exacerbate their ability to survive well into the future.
5POTENTIAL ADAPTIVE MEASURES
These were discussed as an outcome of the impact mind map and participants discussed in small
groups possiblepracticesand ideaswhich couldhelp them adapt to the changes and reduce the
negative impacts of these changes.
Being practically minded, most of the participants moved straight from impacts to practices –so
strategies were not really discussed. Some of the groups had many ideas, some of which were gleaned
from working with support organisations and NOGs. Those groups where no external support is
available, such as Thamela (KZN) did not have many ‘new” ideas,but focussed more on doing what
they are currently doing better.
Below are two examples of this discussion:
-for the Sedawa extension village – Turkey in Limpopo (with limited external support)
-for Thamela in Bergville (where participants were in doubt as to whether CC exists and have
received very limited external support)
Table 4: An example of potential adaptive measures from the Turkey (Limpopo) climate change dialogue process
Turkey CC workshop; December 2017

WRC K4/2719 Deliverable 4: Report CoPs and Demonstration Sites established-May 2018
20
Impacts
Description and linkages
Outcomes
Potential adaptive measure
GROUP 1
Reduced
water
availability
Dams dry out, boreholes
provide less water, rivers dry
out, less rain
Reduced
production,
hunger, diseases,
no jobs, poverty,
crime, death
More boreholes, more dams, water
management, irrigation in evenings
and early morning, mulching, trench
beds (keep moisture in and soil cool)
Drying of
environment
Soils are hotter and drier,
drought, plants wilt,
increased pests
Save plant residues for animals, buy
fodder, control pests on animals
Reduction of
resources
Deforestation, Fruit trees die,
livestock, wild animals die
Planting of trees after they have
been cut down; make use of paraffin
stoves and electricity, government
involvement in solving the problem,
GROUP 2
Extreme heat
Early fruiting, trees wilt
Poor crop health
Shade netting
Shortage of
water
Rivers dry out, municipal
supply only once per week.
Boreholes dry out
Lack of education
towards saving
water
NGOs and government to assist
Trench beds, mulching, save water
in dams, drip irrigation, irrigate in
evening, boreholes, greywater
Reduction of
resources
Less grazing, seed shortage,
trees are removed,
indigenous animals are no
longer there
Donations for/of seed
Rather use paraffin stoves than
firewood. Only chop down mature
trees to allow others to grow,
planting trees, government
intervention
Taking care of indigenous plants
Plant fodder for livestock
Soils
Poor cultivation practices, soil
erosion, dry soils, sandy soils
Using crop residues and manure
Social
repercussions
Less or no food, health
problems, no jobs
Burning of buses,
divorce,
separation of
families, poverty,
crime
Getting access to health care,
parents must work
Shortage of
implements
Setting up cooperatives for
government support, use animal
drawn traction- oxen and donkeys,
improvise, make our own tools,
make use of hand hoes
Table 5: An example of potential adaptive measures from the Thamela (KZN)) climate change dialogue process
Thamela CC workshop; Dec 2017
Impact
Adaptation
Reddish soils
Weeding, they leave it in the plots, because it helps cover the soil but
others they take it out of their plots
Pests
Chemicals
Increased temperatures our yields
decrease
Their crops need soil fertilizer,
oFertilizer increase soil fertility
oLime lasts for 3 years
oManure
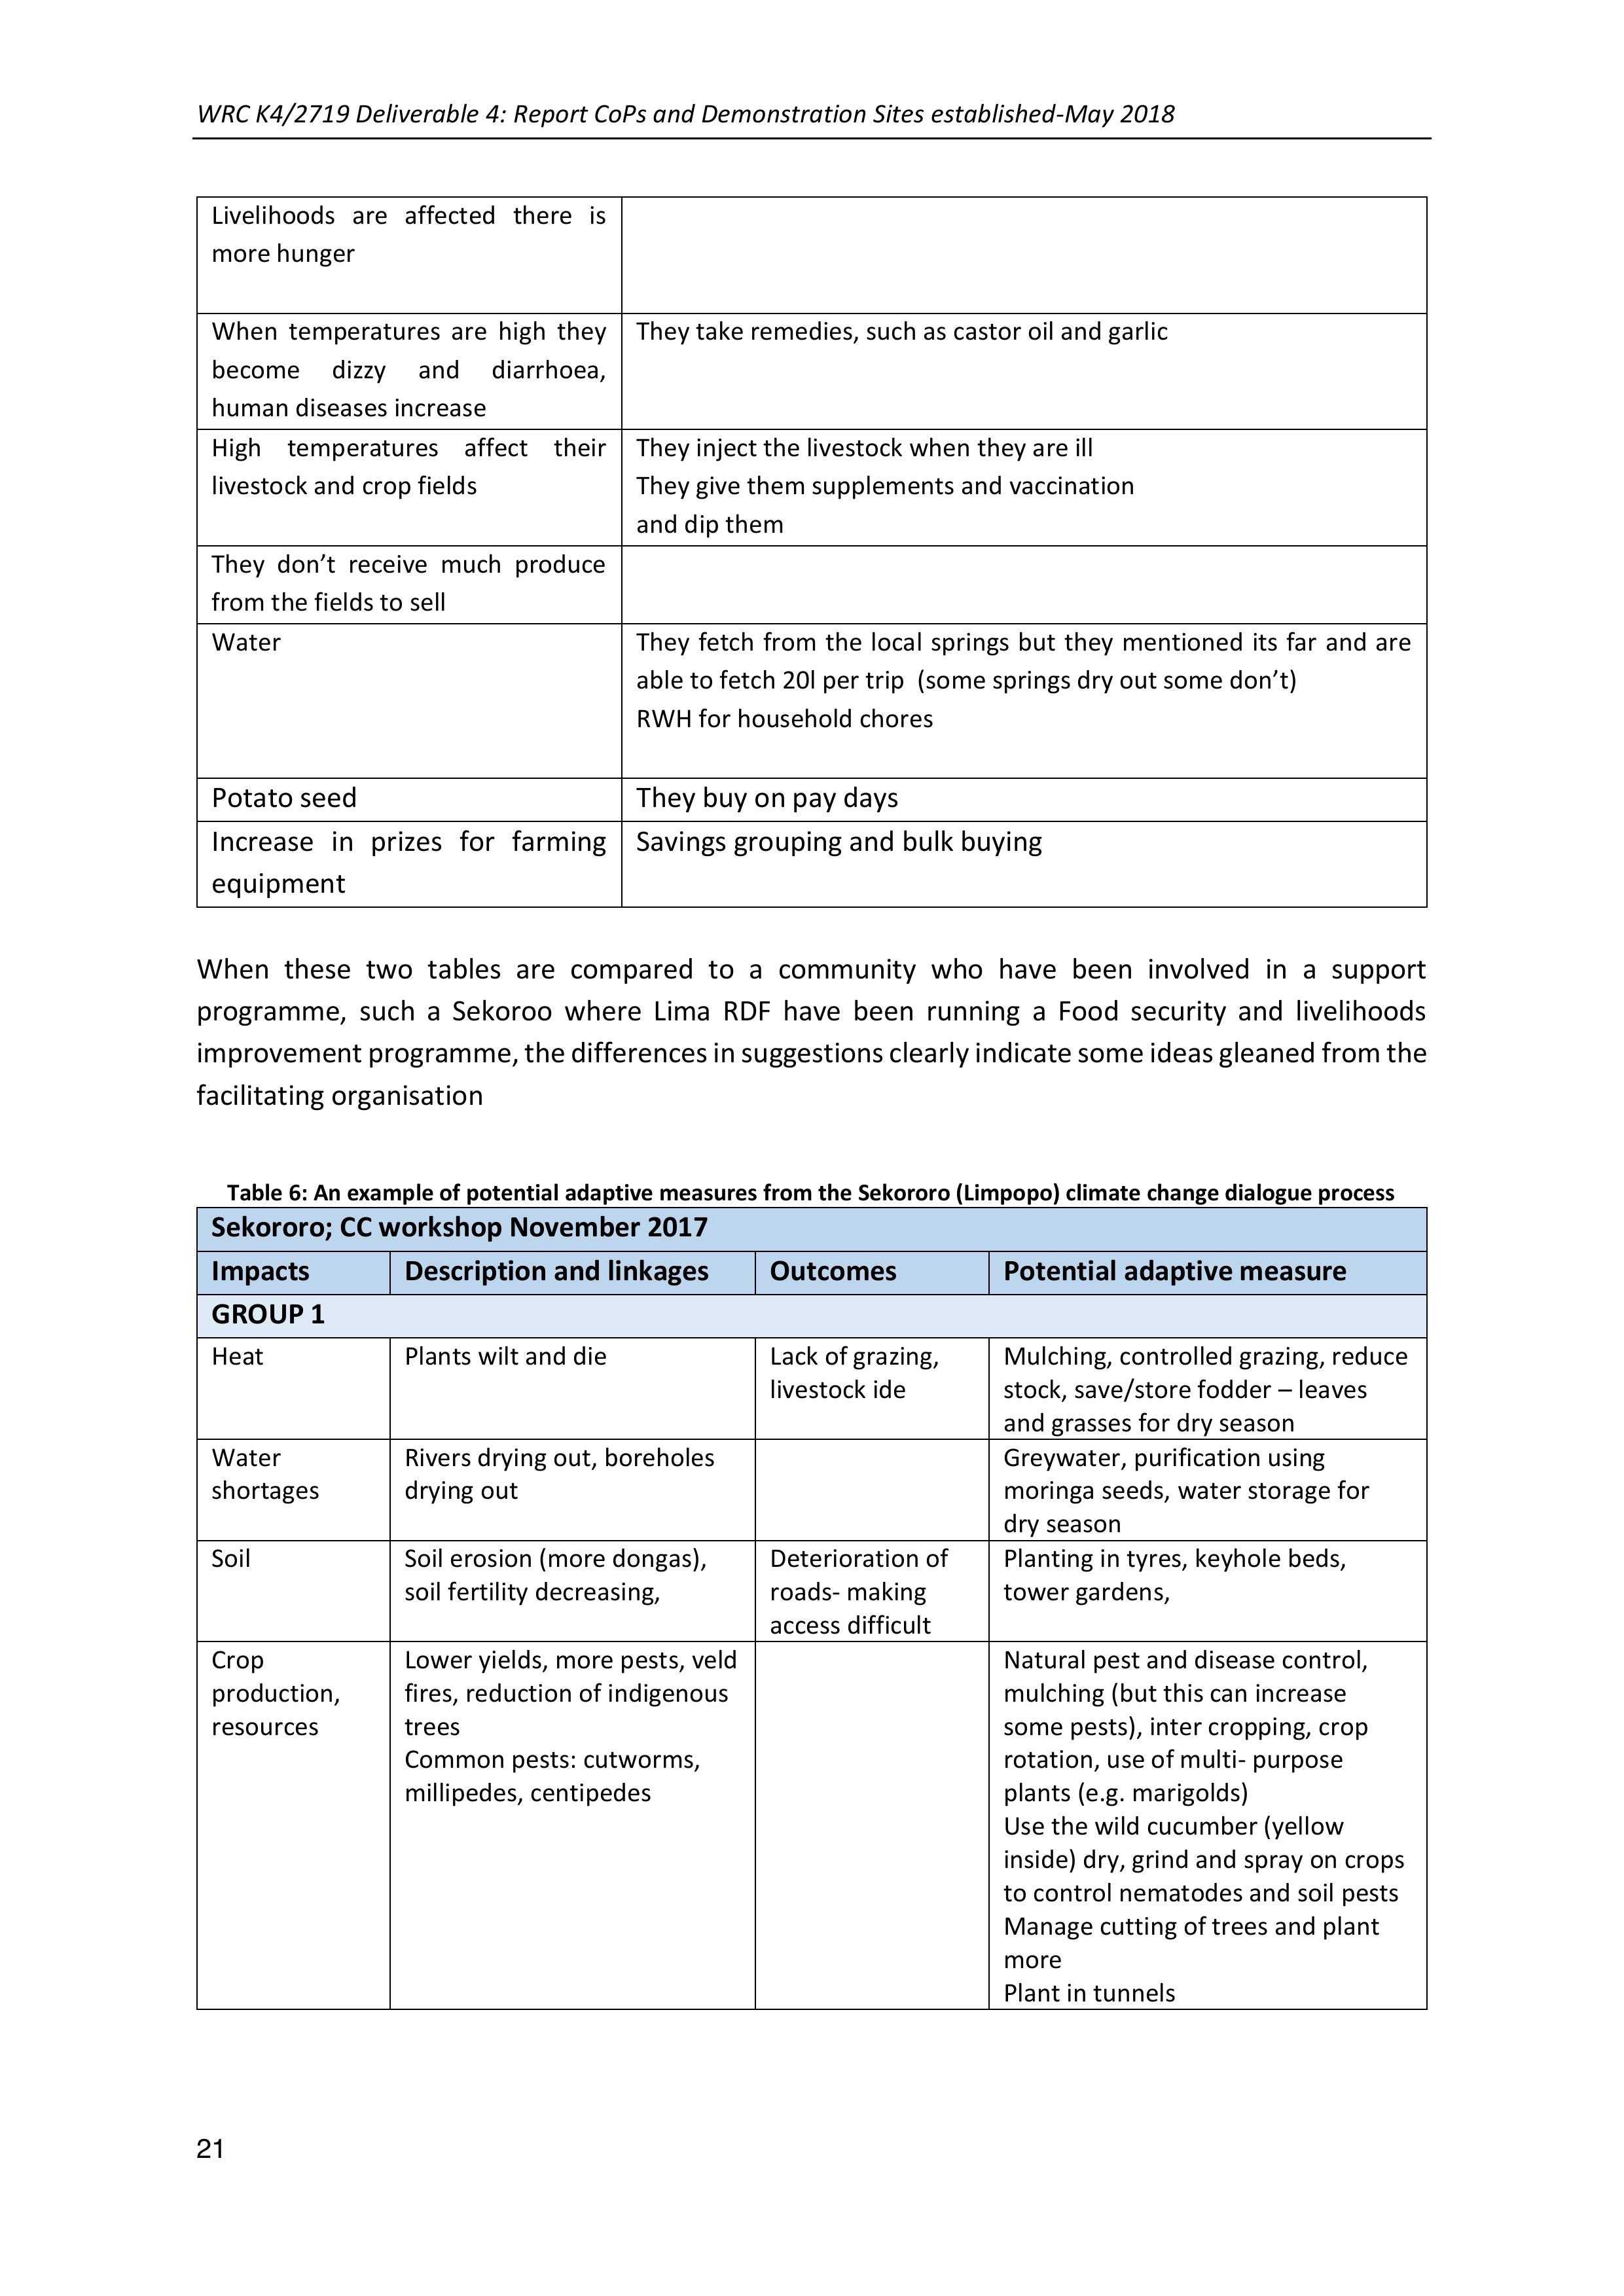
WRC K4/2719 Deliverable 4: Report CoPs and Demonstration Sites established-May 2018
21
Livelihoods are affected there is
more hunger
When temperatures are high they
become dizzy anddiarrhoea,
human diseases increase
They take remedies, such as castor oil and garlic
High temperatures affect their
livestock and crop fields
They inject the livestock when they are ill
They give them supplements and vaccination
and dip them
They don’t receive much produce
from the fields to sell
Water
They fetch from the local springs but they mentioned its far and are
able to fetch 20l per trip (some springs dry out some don’t)
RWH for household chores
Potato seed
They buy on pay days
Increase inprizes for farming
equipment
Savings grouping and bulk buying
When these two tables are compared to a community who have beeninvolved in a support
programme, such a Sekoroo where LimaRDF have been running a Food security and livelihoods
improvement programme, the differences in suggestions clearly indicate some ideas gleaned from the
facilitating organisation
Table 6: An example of potential adaptive measures from the Sekororo (Limpopo) climate change dialogue process
Sekororo; CC workshop November 2017
Impacts
Description and linkages
Outcomes
Potential adaptive measure
GROUP 1
Heat
Plants wilt and die
Lack of grazing,
livestock ide
Mulching, controlled grazing, reduce
stock, save/store fodder – leaves
and grasses for dry season
Water
shortages
Rivers drying out, boreholes
drying out
Greywater, purification using
moringa seeds, water storage for
dry season
Soil
Soil erosion (more dongas),
soil fertility decreasing,
Deterioration of
roads- making
access difficult
Planting in tyres, keyhole beds,
tower gardens,
Crop
production,
resources
Lower yields, more pests, veld
fires, reduction of indigenous
trees
Common pests: cutworms,
millipedes, centipedes
Natural pest and disease control,
mulching (but this can increase
some pests), inter cropping, crop
rotation, use of multi- purpose
plants (e.g. marigolds)
Use the wild cucumber (yellow
inside) dry, grind and spray on crops
to control nematodes and soil pests
Manage cutting of trees and plant
more
Plant in tunnels

WRC K4/2719 Deliverable 4: Report CoPs and Demonstration Sites established-May 2018
22
Livestock
Lack of grazing, more
diseases, more damage of
crops
Livestock
decreasing, not
healthy
Control grazing,
Social
repercussions
Poverty, diseases, hunger
Crime, murder
and theft,
domestic
violence, divorce,
increased death
rate, no money to
pay lobola
GROUP 2
Extreme heat
Veld fires
Use of tunnels, plant heat resistant
cultivars, irrigate in early mornings
and evenings
Lack of water
No grazing, drying of natural
vegetation and bushes,
wilting of plants, trees do not
fruit, extreme rains destroy
infrastructure,
Food shortages,
animals die due to
lack of grazing,
Water harvesting, earth dams, grey
water and management of existing
water, diversion furrows
Soils
Organic matter content is
low, dry soils, roots are
exposed, soil erosion, also
due to use of mechanisation -
ploughing
Liquid manure, make use of animal
manure, trench beds and eco-circles
Plant sweet potatoes to hold soil,
plant across the slope, plant
indigenous crops such as cowpeas,
Make use of hands and oxen to
plant using conservation agriculture
Loosen the soil to avoid water
logging and yellowing of plants
Crops
Reduced production
increased pests, medicinal
herbs destroyed in drought
and heat
Plant colourful flowers and plants to
attract pest predators and bees,
companion planting, making brews
form marigolds
Plant medicinal species in controlled
environments with the vegetables
9tunnels)
Social
repercussions
More diseases and health
problems, poverty food
shortages, low education
standards (because schools
are free)
No transfer of
knowledge, crime
Plant herbs and vegetables,
entrepreneurship, job creation,
plant your own crops instead of
always buying
Based on the adaptive measures suggested a selection of the CSA practices summarised as 1 pagers
were introduced to each group. This process was easy for groups that have had some exposure to
agroecological practices and support in implementation and a lot harder where little outside support
has been available.
6CONTINUATION OF CC DIALOGUES (WORKSHOP 2): POTENTIAL
ADAPTIVE MEASURES, PRIORITISATION OF PRACTICES AND
EXPERIMENTATION PLANNING
An outline has been designed for this process and is presented in the table below.
WRC K4/2719 Deliverable 4: Report CoPs and Demonstration Sites established-May 2018
23
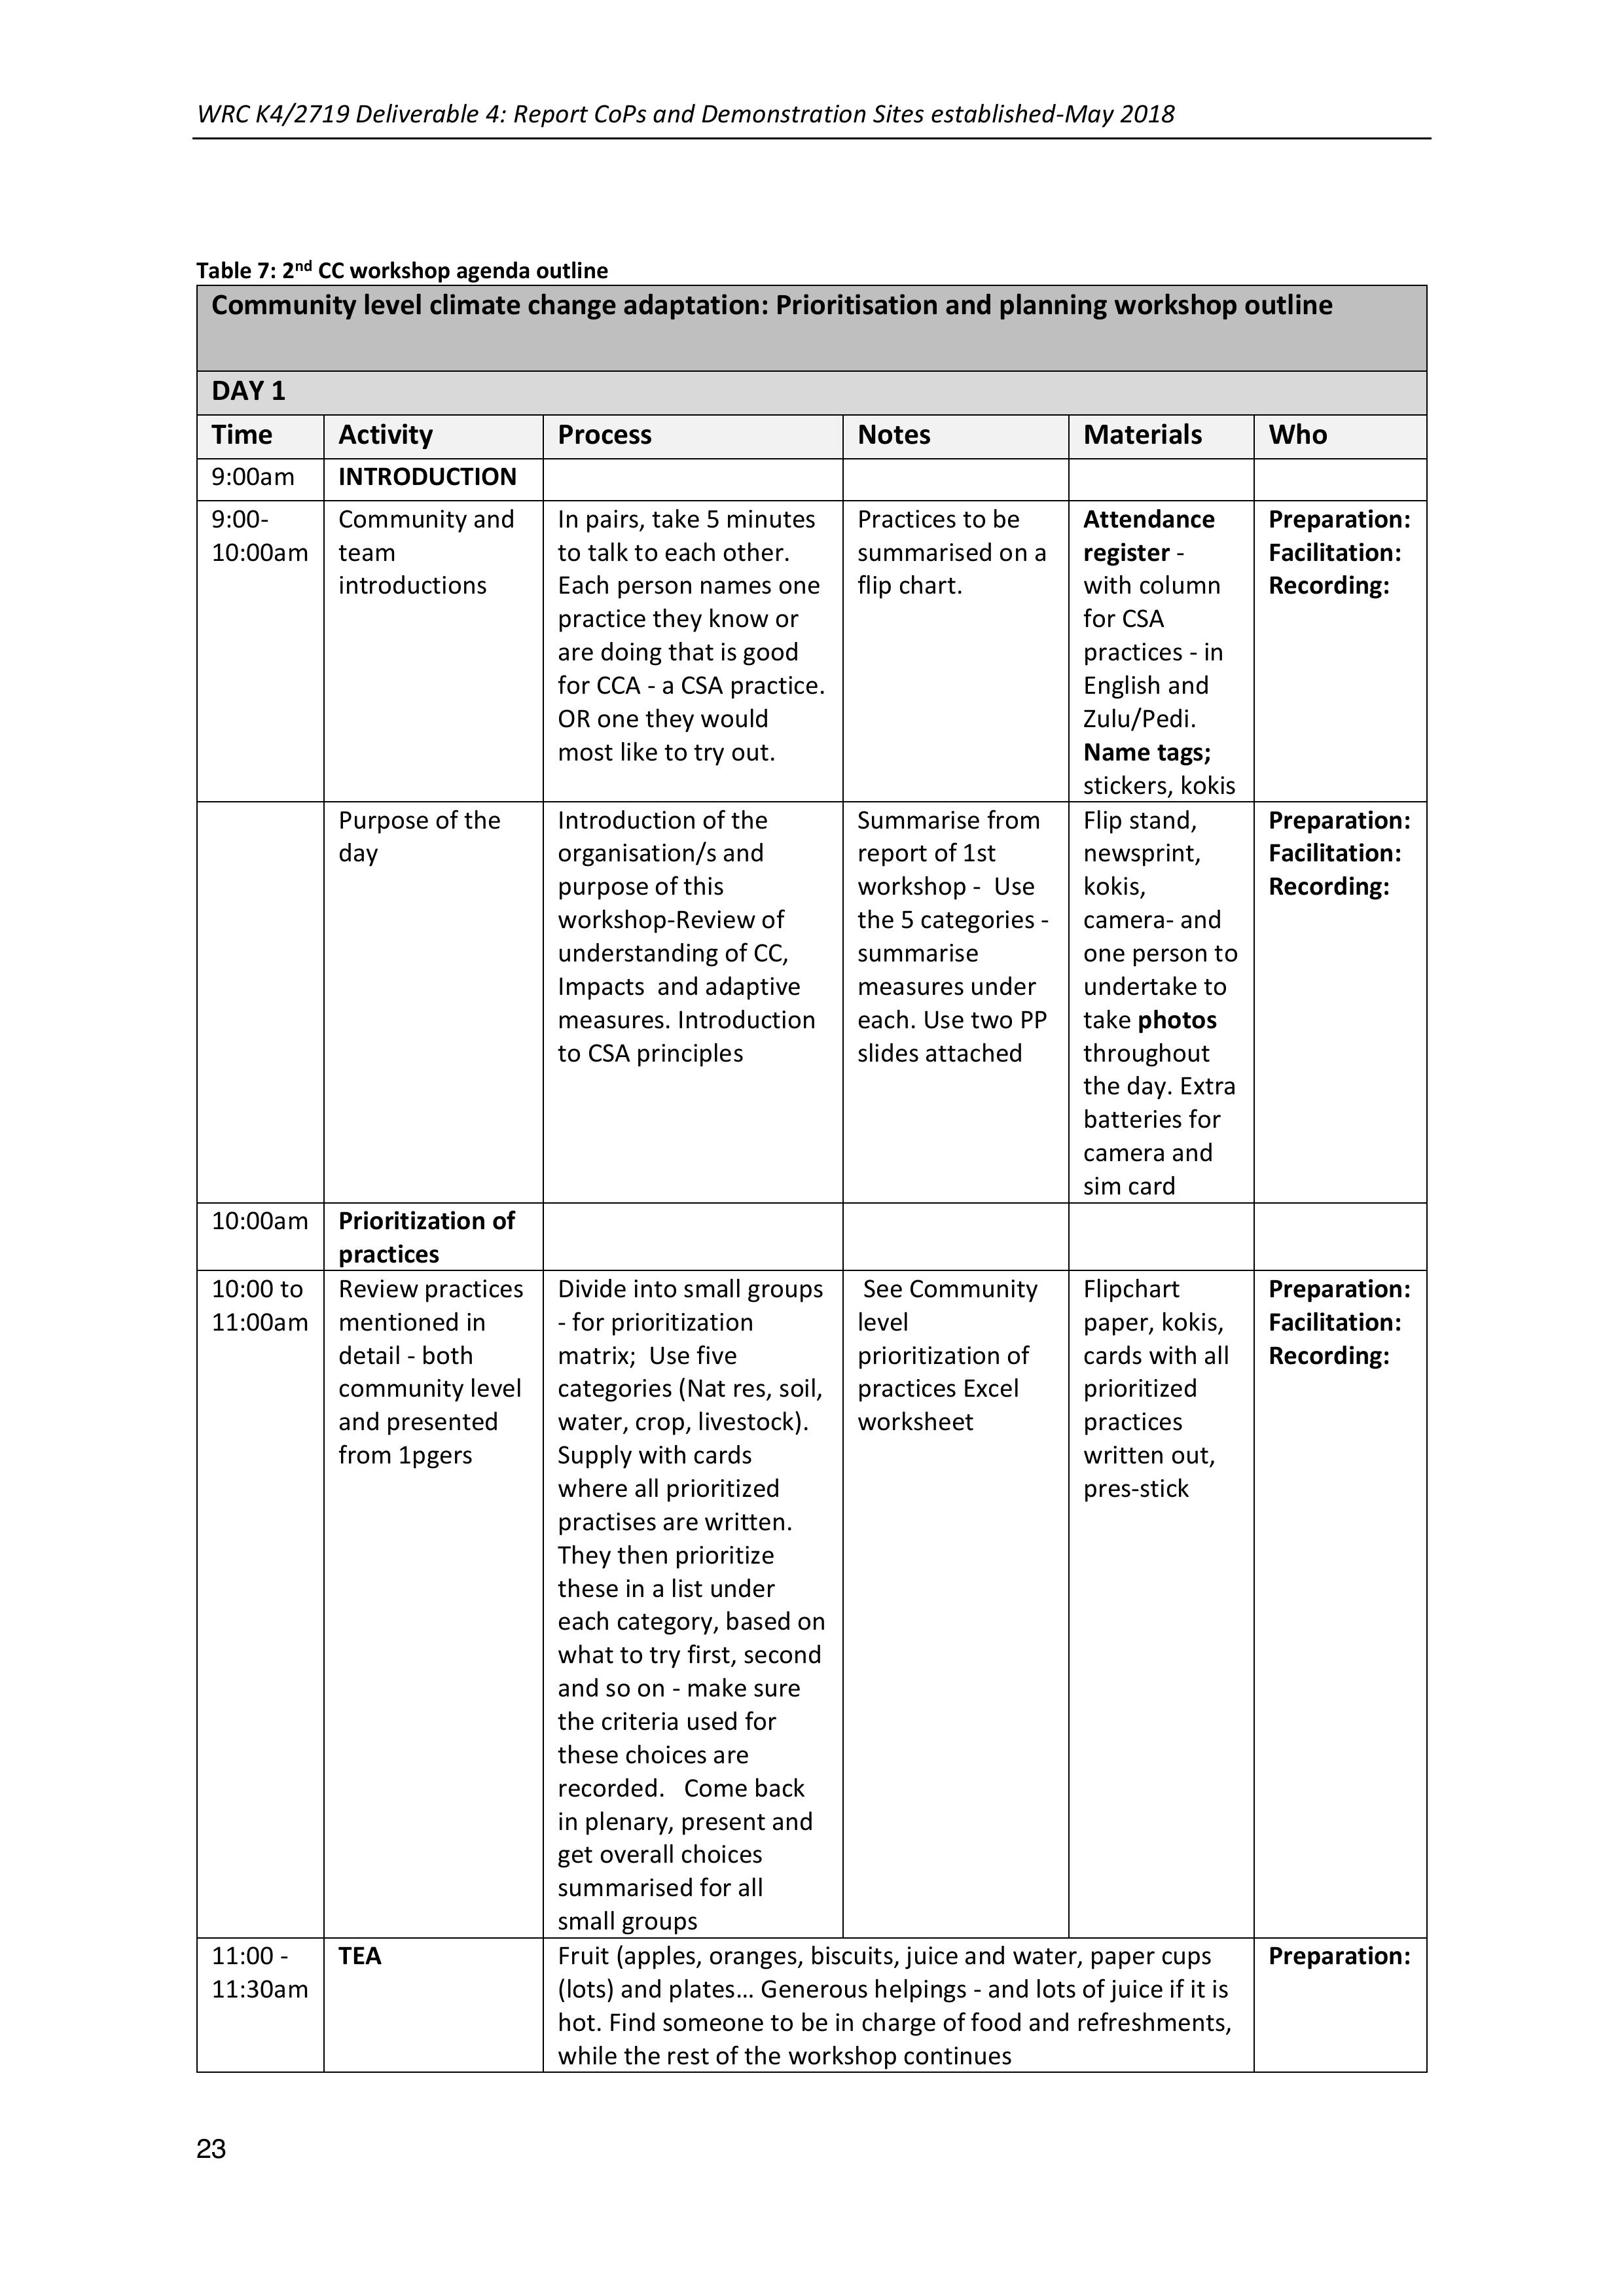
Table 7: 2nd CC workshop agenda outline
Community level climate change adaptation: Prioritisation and planning workshop outline
DAY 1
Time
Activity
Process
Notes
Materials
Who
9:00am
INTRODUCTION
9:00-
10:00am
Community and
team
introductions
In pairs, take 5 minutes
to talk to each other.
Each person names one
practice they know or
are doing that is good
for CCA - a CSA practice.
OR one they would
most like to try out.
Practices to be
summarised on a
flip chart.
Attendance
register -
with column
for CSA
practices - in
English and
Zulu/Pedi.
Name tags;
stickers, kokis
Preparation:
Facilitation:
Recording:
Purpose of the
day
Introduction of the
organisation/s and
purpose of this
workshop-Review of
understanding of CC,
Impacts and adaptive
measures. Introduction
to CSA principles
Summarise from
report of 1st
workshop -Use
the 5 categories -
summarise
measures under
each. Use two PP
slides attached
Flip stand,
newsprint,
kokis,
camera- and
one person to
undertake to
take photos
throughout
the day. Extra
batteries for
camera and
sim card
Preparation:
Facilitation:
Recording:
10:00am
Prioritization of
practices
10:00 to
11:00am
Review practices
mentioned in
detail - both
community level
and presented
from 1pgers
Divide into small groups
- for prioritization
matrix; Use five
categories (Nat res, soil,
water, crop, livestock).
Supply with cards
where all prioritized
practises are written.
They then prioritize
these in a list under
each category, based on
what to try first, second
and so on - make sure
the criteria used for
these choices are
recorded. Come back
in plenary, present and
get overall choices
summarised for all
small groups
See Community
level
prioritization of
practices Excel
worksheet
Flipchart
paper, kokis,
cards with all
prioritized
practices
written out,
pres-stick
Preparation:
Facilitation:
Recording:
11:00 -
11:30am
TEA
Fruit (apples, oranges, biscuits, juice and water, paper cups
(lots) and plates… Generous helpings - and lots of juice if it is
hot. Find someone to be in charge of food and refreshments,
while the rest of the workshop continues
Preparation:
WRC K4/2719 Deliverable 4: Report CoPs and Demonstration Sites established-May 2018
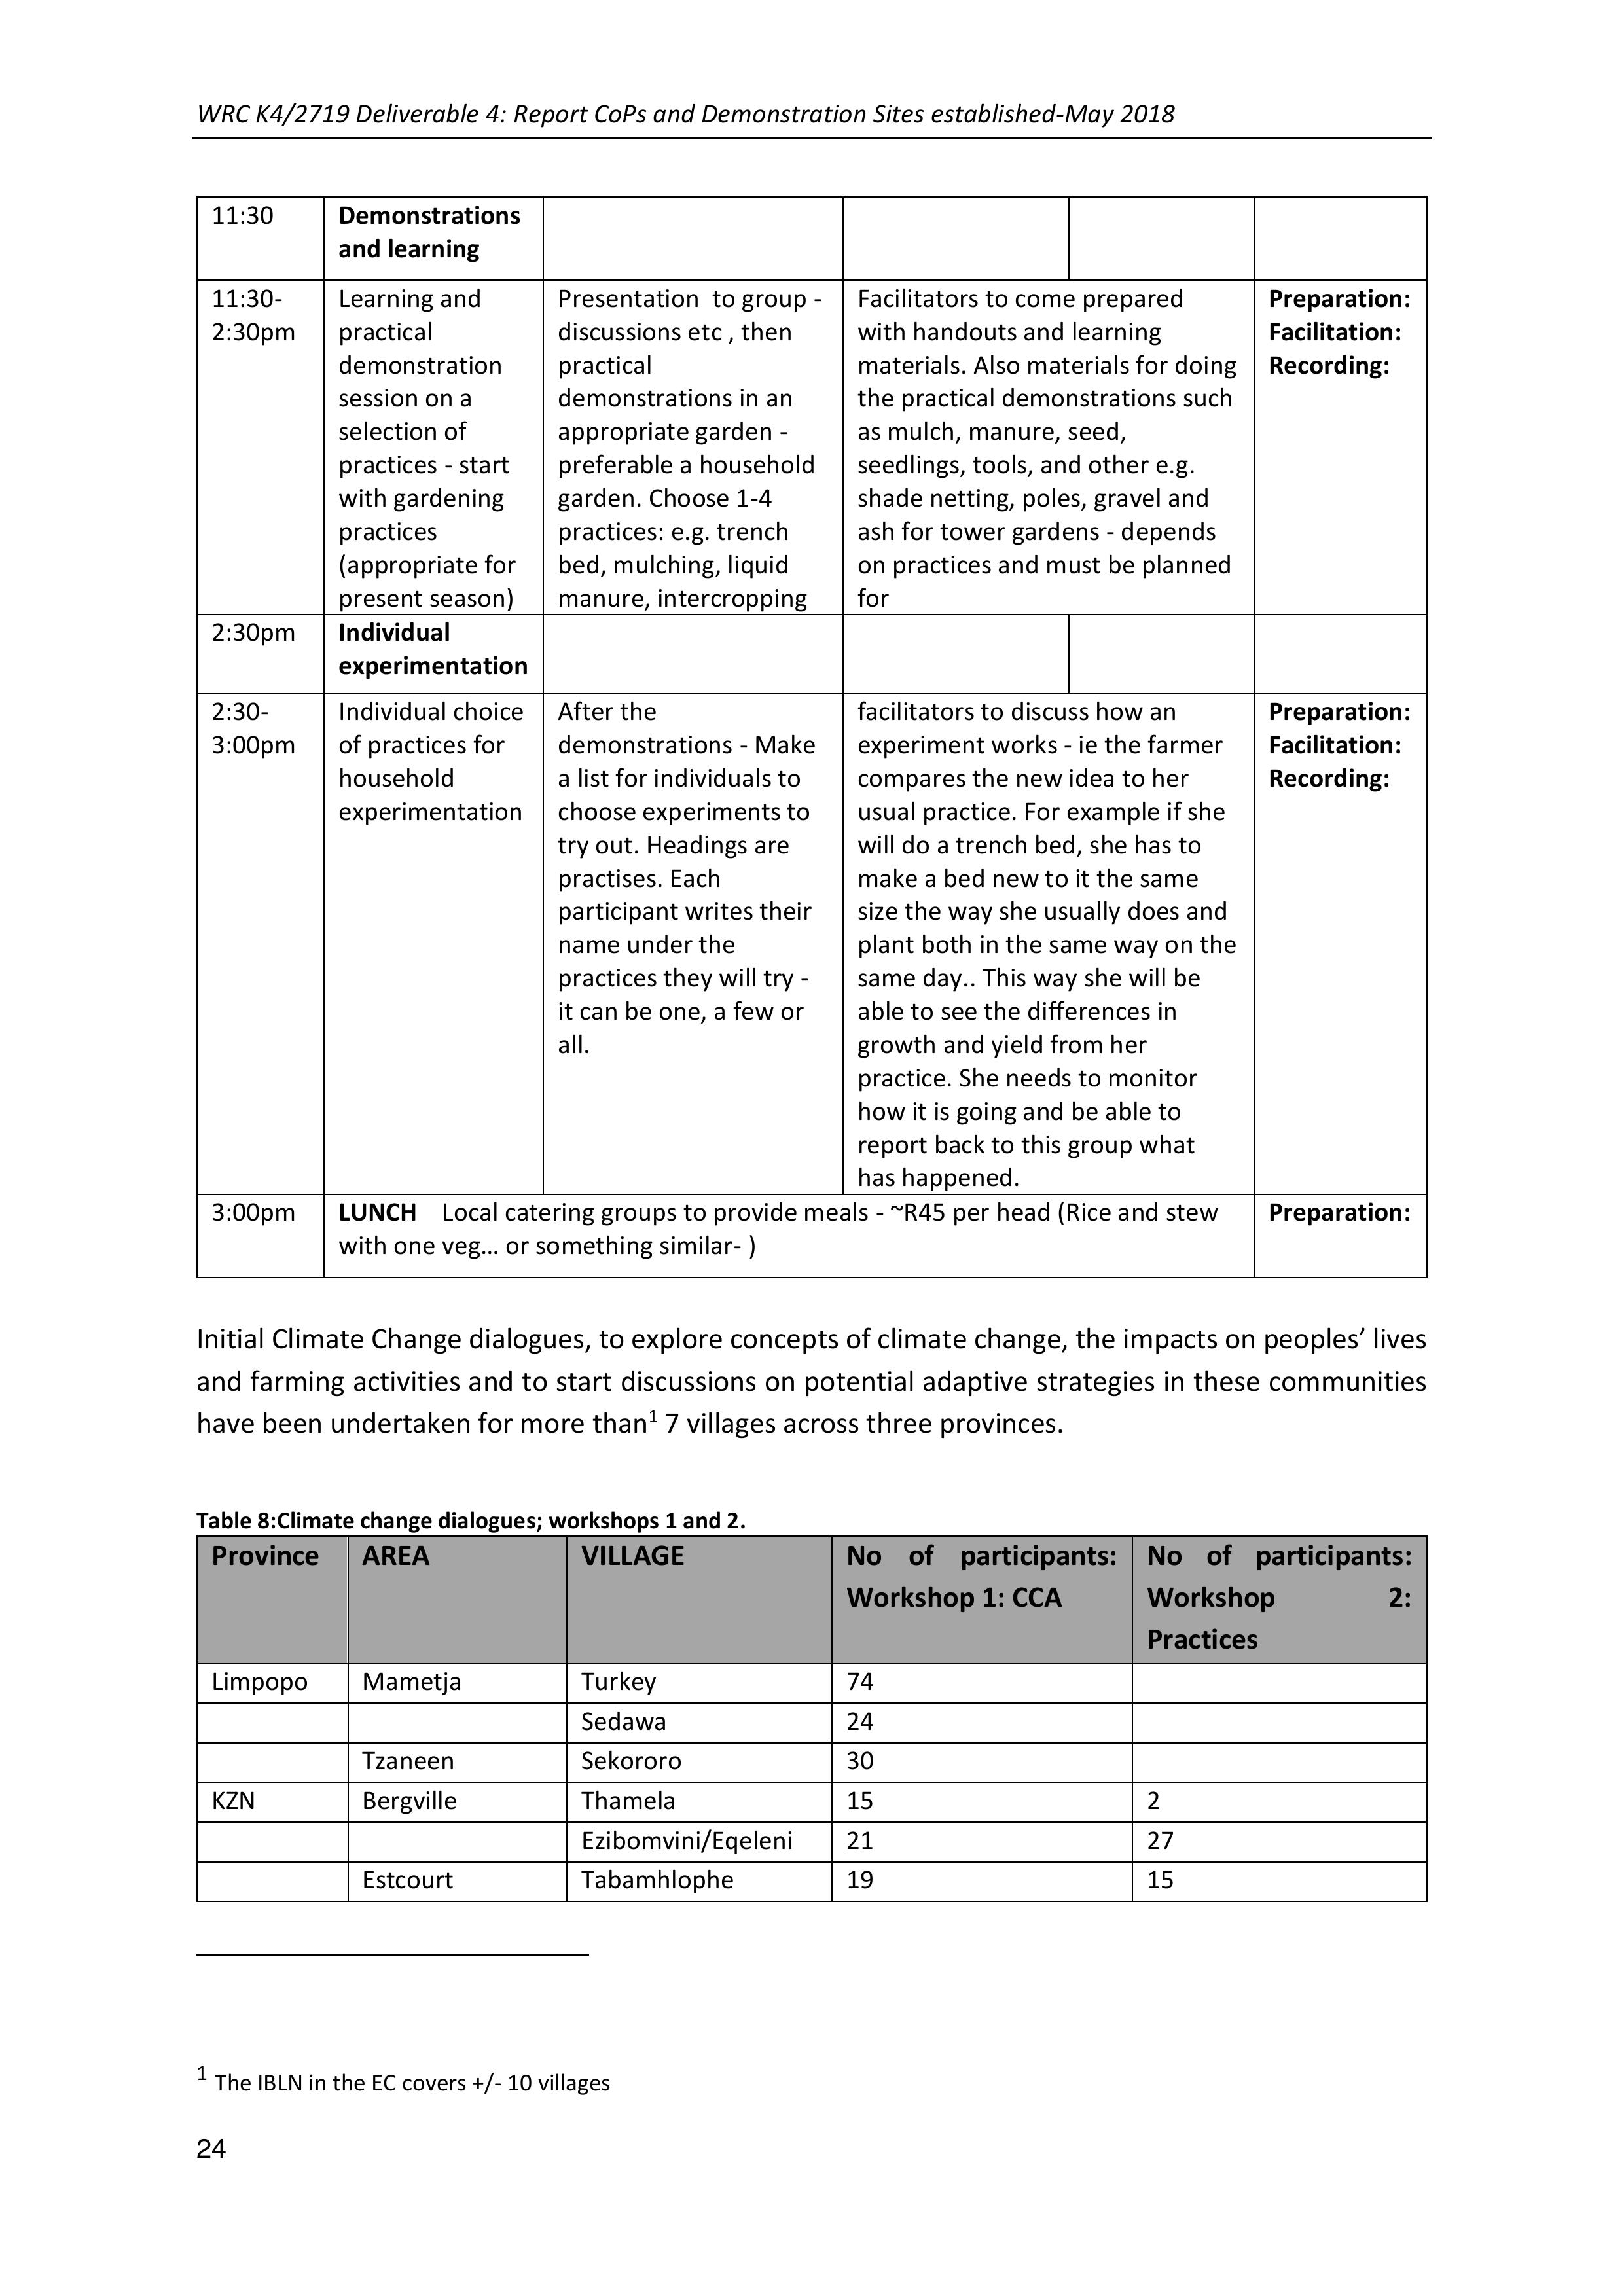
24
11:30
Demonstrations
and learning
11:30-
2:30pm
Learning and
practical
demonstration
session on a
selection of
practices - start
with gardening
practices
(appropriate for
present season)
Presentation to group -
discussions etc , then
practical
demonstrations in an
appropriate garden -
preferable a household
garden. Choose 1-4
practices: e.g. trench
bed, mulching, liquid
manure, intercropping
Facilitators to come prepared
with handouts and learning
materials. Also materials for doing
the practical demonstrations such
as mulch, manure, seed,
seedlings, tools, and other e.g.
shade netting, poles, gravel and
ash for tower gardens - depends
on practices and must be planned
for
Preparation:
Facilitation:
Recording:
2:30pm
Individual
experimentation
2:30-
3:00pm
Individual choice
of practices for
household
experimentation
After the
demonstrations - Make
a list for individuals to
choose experiments to
try out. Headings are
practises. Each
participant writes their
name under the
practices they will try -
it can be one, a few or
all.
facilitators to discuss how an
experiment works - ie the farmer
compares the new idea to her
usual practice. For example if she
will do a trench bed, she has to
make a bed new to it the same
size the way she usually does and
plant both in the same way on the
same day.. This way she will be
able to see the differences in
growth and yield from her
practice. She needs to monitor
how it is going and be able to
report back to this group what
has happened.
Preparation:
Facilitation:
Recording:
3:00pm
LUNCH Local catering groups to provide meals - ~R45 per head (Rice and stew
with one veg… or something similar- )
Preparation:
Initial Climate Change dialogues, to explore concepts of climate change, the impacts on peoples’ lives
and farming activities and tostart discussions on potential adaptive strategies in these communities
have been undertaken for more than
1
7 villages across three provinces.
Table 8:Climate change dialogues; workshops 1 and 2.
Province
AREA
VILLAGE
No of participants:
Workshop 1: CCA
No of participants:
Workshop 2:
Practices
Limpopo
Mametja
Turkey
74
Sedawa
24
Tzaneen
Sekororo
30
KZN
Bergville
Thamela
15
2
Ezibomvini/Eqeleni
21
27
Estcourt
Tabamhlophe
19
15
1
The IBLN in the EC covers +/- 10 villages

WRC K4/2719 Deliverable 4: Report CoPs and Demonstration Sites established-May 2018
25
EC
Alice/Middledrift
Imvotho Bubomi
Learning Network
(IBLN) - across a
number of villages
15
42
Ezibomvini (KZN) CCAworkshop 2
Below is a summary of some of the
discussions undertaken for the 2ndCC
dialogue workshop undertaken in Ezibomvini
(23 March 2018)
The second workshop, aiming at prioritizing
practice options enlisted in the first work
shop and thereafter starting a farmer's level
experimentation process.
Right: 29 Participants in the 2nd CC dialogue
workshop in Ezibomvini (KZN), 23 March
2018
CCA practices that are familiar to farmers
An introduction session over five minutes took place where farmers were to introduce each other
and their farming activities. Following is the summary of the results from the discussions:
•The use drip irrigation to retain moisture for a long time in the soil.
• Grey water harvesting practice.
•Use of cow manure
•Mulching
•Intercropping
•Bed design
•Rain Water harvesting
•Watering the garden before sunrise and after sunset
•Blue death as pest and disease control measure
•Conservation Agriculture (CA).
oCA farmers receive more yields, the level of pests such as stalk borer and cutworm
has decreased. Farmers are saving on inputs.
Review of participants understanding of Climate change
Farmers still remember that previously there was discussion that historically there is a change in
climate as compared to the current situation. The level of rainfall is now lower and temperatures
are high. The increase in temperature has a negative impact on crop growth. There is the high level
of wind which dries the soils. Historically it was only windy in winter and presently it is windy
throughout. There are no wetlands anymore because there is no rain and people are building houses
where there were wetlands.
WRC K4/2719 Deliverable 4: Report CoPs and Demonstration Sites established-May 2018
26
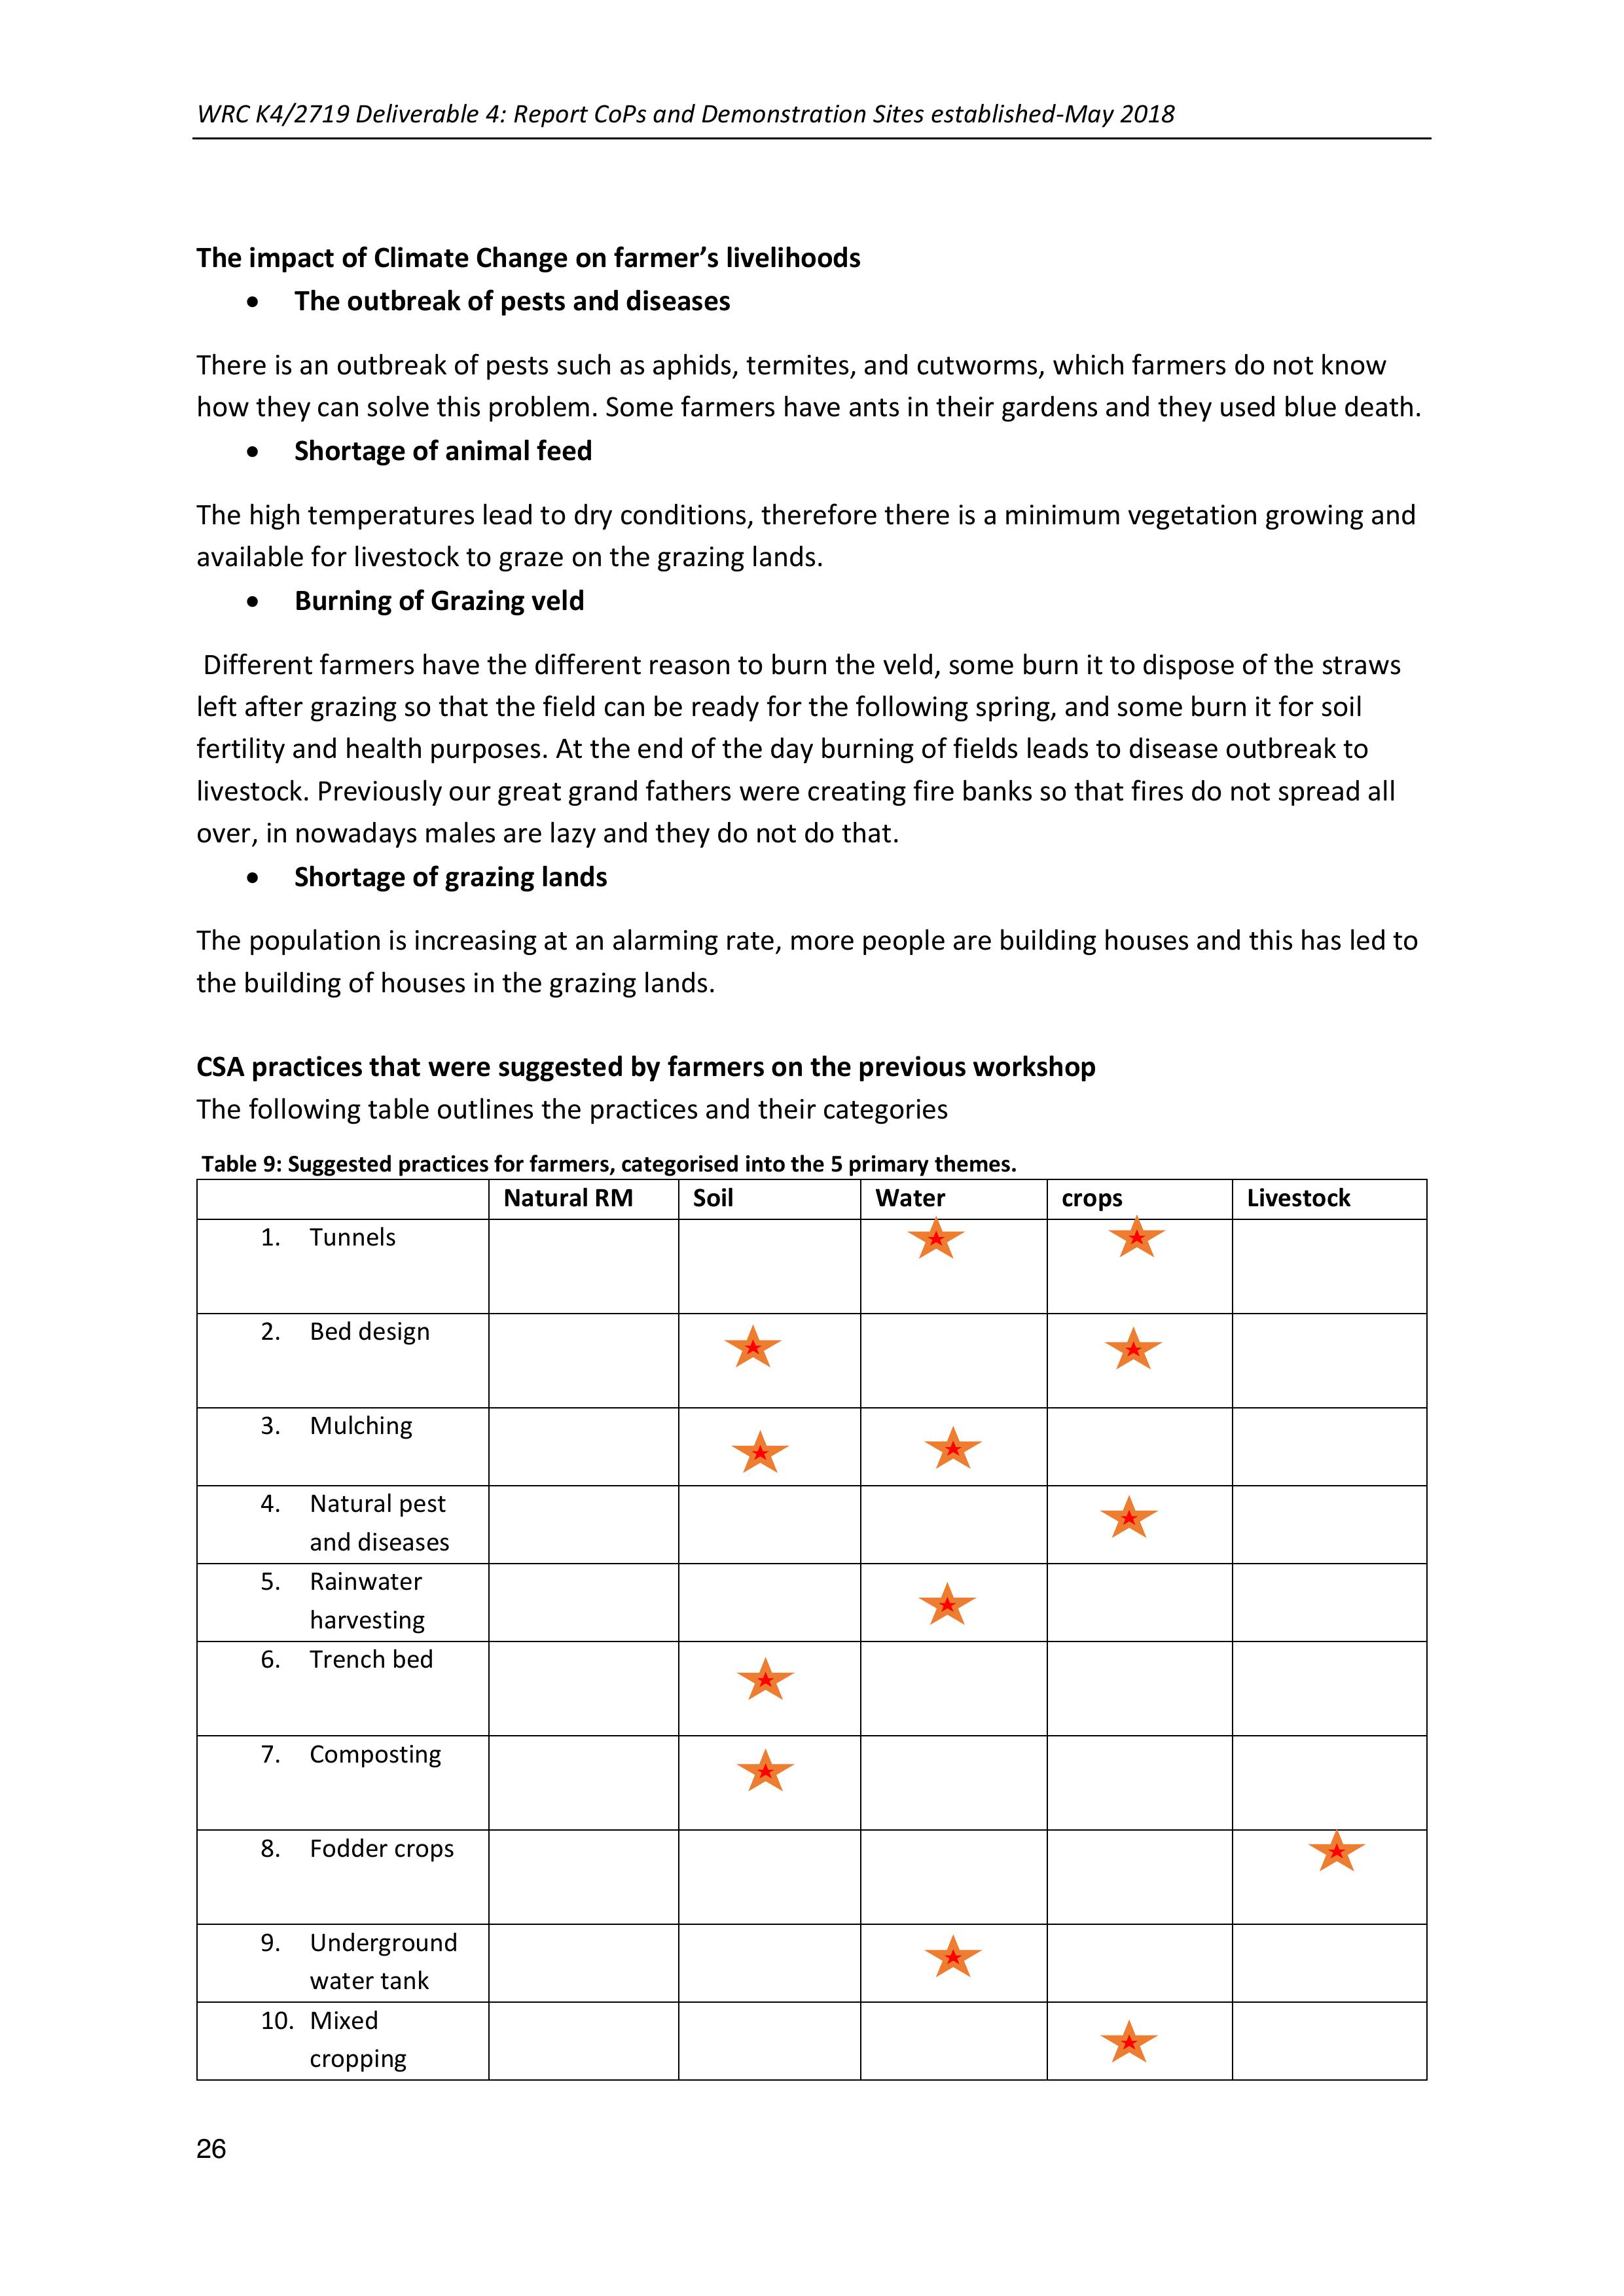
The impact of Climate Change on farmer’s livelihoods
•The outbreak of pests and diseases
There is an outbreak of pests such as aphids, termites, and cutworms, which farmers do not know
how they can solve this problem. Some farmers have ants in their gardens and they used blue death.
•Shortage of animal feed
The high temperatures lead to dry conditions, therefore there is a minimum vegetation growing and
available for livestock to graze on the grazing lands.
•Burning of Grazing veld
Different farmers have the different reason to burn the veld, some burn it to dispose of the straws
left after grazing so that the field can be ready for the following spring, and some burn it for soil
fertility and health purposes. At the end of the day burning of fields leads to disease outbreak to
livestock. Previously our great grand fathers were creating fire banks so that fires do not spread all
over, in nowadays males are lazy and they do not do that.
•Shortage of grazing lands
The population is increasing at an alarming rate, more people are building houses and this has led to
the building of houses in the grazing lands.
CSA practices that were suggested by farmers on the previous workshop
The following table outlines the practices and their categories
Table 9: Suggested practices for farmers, categorised into the 5 primary themes.
Natural RM
Soil
Water
crops
Livestock
1.Tunnels
2.Bed design
3.Mulching
4.Natural pest
and diseases
5.Rainwater
harvesting
6.Trench bed
7.Composting
8.Fodder crops
9.Underground
water tank
10.Mixed
cropping

WRC K4/2719 Deliverable 4: Report CoPs and Demonstration Sites established-May 2018
27
11.Conservation
of wetlands
and streams
12.Burying of
disposable
pampers
13.Reducing
burning of
grazing veld
14.Greywater
Harvesting
Group Prioritisation of practices
After a presentation of practices, farmers prioritized practices as a team. Due to drought conditions
problems the group chose underground water tanks as the first priority. Due to harsh weather
conditions farmers chose tunnels as their second option. The following table shows farmers how
farmer prioritised practices.
Individual choice of practical household experimentation
Farmers were given a variety of seeds. All farmers were given sachets with the amount 5ml
(teaspoon) seeds. The seeds were given to farmers so that they can experiment some of the
practices shared among them in their household.
Out of 29 farmers who were present, 20 farmers considered trench beds as their priority. Farmers
who chose trench bed will therefore also try out mixed cropping and mulching. Most of the farmers
Above: Tema facilitating the prioritization of
practices
Group Priority
1. Underground water tanks
2. Tunnels
3. Trench beds
4. Mulching
5. Pest and disease control
6. Mixed cropping
7. Compost
8. Fodder crops
9. Conserving wetlands and streams

WRC K4/2719 Deliverable 4: Report CoPs and Demonstration Sites established-May 2018
28
from the nine left already has trench beds in their homesteads. The following is the list of
participants who considered a trench bed as their first priority.
Table 10: Individual volunteers for trench bed experimentation in KZN (Bergville)
Name
Village Name
1.Jabulile Nkabinde
Ezibomvini
2.Fikile Hlongwane
Ezibomvini
3.Nonhlahla Zikode
Ezibomvini
4.Landiwe Gamede
Ezibomvini
5.Gcinekile Zikode
Ezibomvini
6.Hlengiwe Ndaba
Ezibomvini
7.Busisiwe Zikode
Ezibomvini
8.Alfred Gumede
Ezibomvin
9. Velephi Zimba
Ezibomvini
10.Sizeni Dlamini
Eqeleni
11.Lndokuhle Hlongwane
Ezibomvini
12.Conastance Hlongwane
Thamela
13.Thulile Zikode
Eqeleni
14.Sibongile Zikode
Eqeleni
15.Dambi Ntuli
Thamela
16.Zanele Hlongwane
Thamela
17.Thokozile Mpambo
Eqeleni
18.Nomalanga Khumalo
Eqeleni
19.Mvelo Zikode
Ezibomvini
20.Sdudla Sibiya
Ezibomvini
Conclusion and Recommendations
•As mentioned earlier, the weather was not favourable for the workshop field
demonstration, therefore the activity was not done. Demonstrations will be done in the
small group within the individual community. This means that the demonstration will not be
done in a collective group of Ezibomvini, EQeleni, and Thamela, but there is going to be an
individual demonstration for each community.
•On the individual prioritization, most farmers demonstrated an interest in trying trench
beds. It is assumed that most farmers are hoping that if they prepare trench beds they will
be in high chances to get a tunnel, more clarity should be made to farmers regarding tunnels
availability after having trench beds.
•Farmers have expectations to be given free tanks, and it was further clarified to them that
the program is based on transferring knowledge.
•Farmers are not certain about individual priorities, therefore, there is a need for an
assessment of individual's needs.
•More demonstrations and workshops are still needed to strengthen farmers understanding
on Climate change and Climate Smart Agriculture Practices.

WRC K4/2719 Deliverable 4: Report CoPs and Demonstration Sites established-May 2018
29
Alice (Eastern Cape) CCA Workshop
This workshop was intended to explore further the particular CSA practices in which farmers were
interested, and with which they wished to experiment with the support of the WRC-CSA project
team. While this aim was achieved to a considerable degree, the large numbers of participants (42
people registered), many of whom had not been involved with Phase I required that some time was
spent introducing the whole concept of CSA. Of the 42 registered participants, in addition to 17
farmers, there were numbers of students some of whom did not remain throughout the day.
However, the attendance by the Head of Department for Crop Production at Fort Cox, and the
Agribusiness Diploma Course leader together with several of their students, suggests a very strong
interest in the concept of CSA in the college. There were also 5 members of the Eastern Cape
Department of Rural Development and Agricultural Reform (DRDAR) extension services in
attendance.
Given the difference in context between the Eastern Cape situation, where the project is working
with a broad network (the IBLN) of agricultural practitioners, including some commercial-scale
emerging farmers, as opposed to in other provinces where the WRC-CSA project works almost
exclusively with small-scale and household farmers, the programme followed was an adaptation of
that followed elsewhere and outlined in Table 7, above. However, the same key features were
covered, and it included a highly participatory practical activity.
The purpose and scope of the WRC-CSA project was explained, including the farmer experimentation
approach which would require close monitoring of both areas subject to CSA practices and control
plots without these practices.
The first session laid the ground for a group activity in which the participants divided into 4 groups,
each with a computer and the pdf version of the WRC- CSA Practices document. Their brief was to
go through the document and identify which practices they would consider most appropriate in their
contexts and why. Each group provided feedback on the outcomes of their discussions with the
practices they had identified captured on Newsprint. There
was discussion concerning the scales at which specific
practices might be appropriate and it transpired that
although most practices were initially considered as only
relevant at smaller scales, they could be scaled up in
different ways to become relevant on a larger scale.
Right: EC Group discussion on CSA Practices
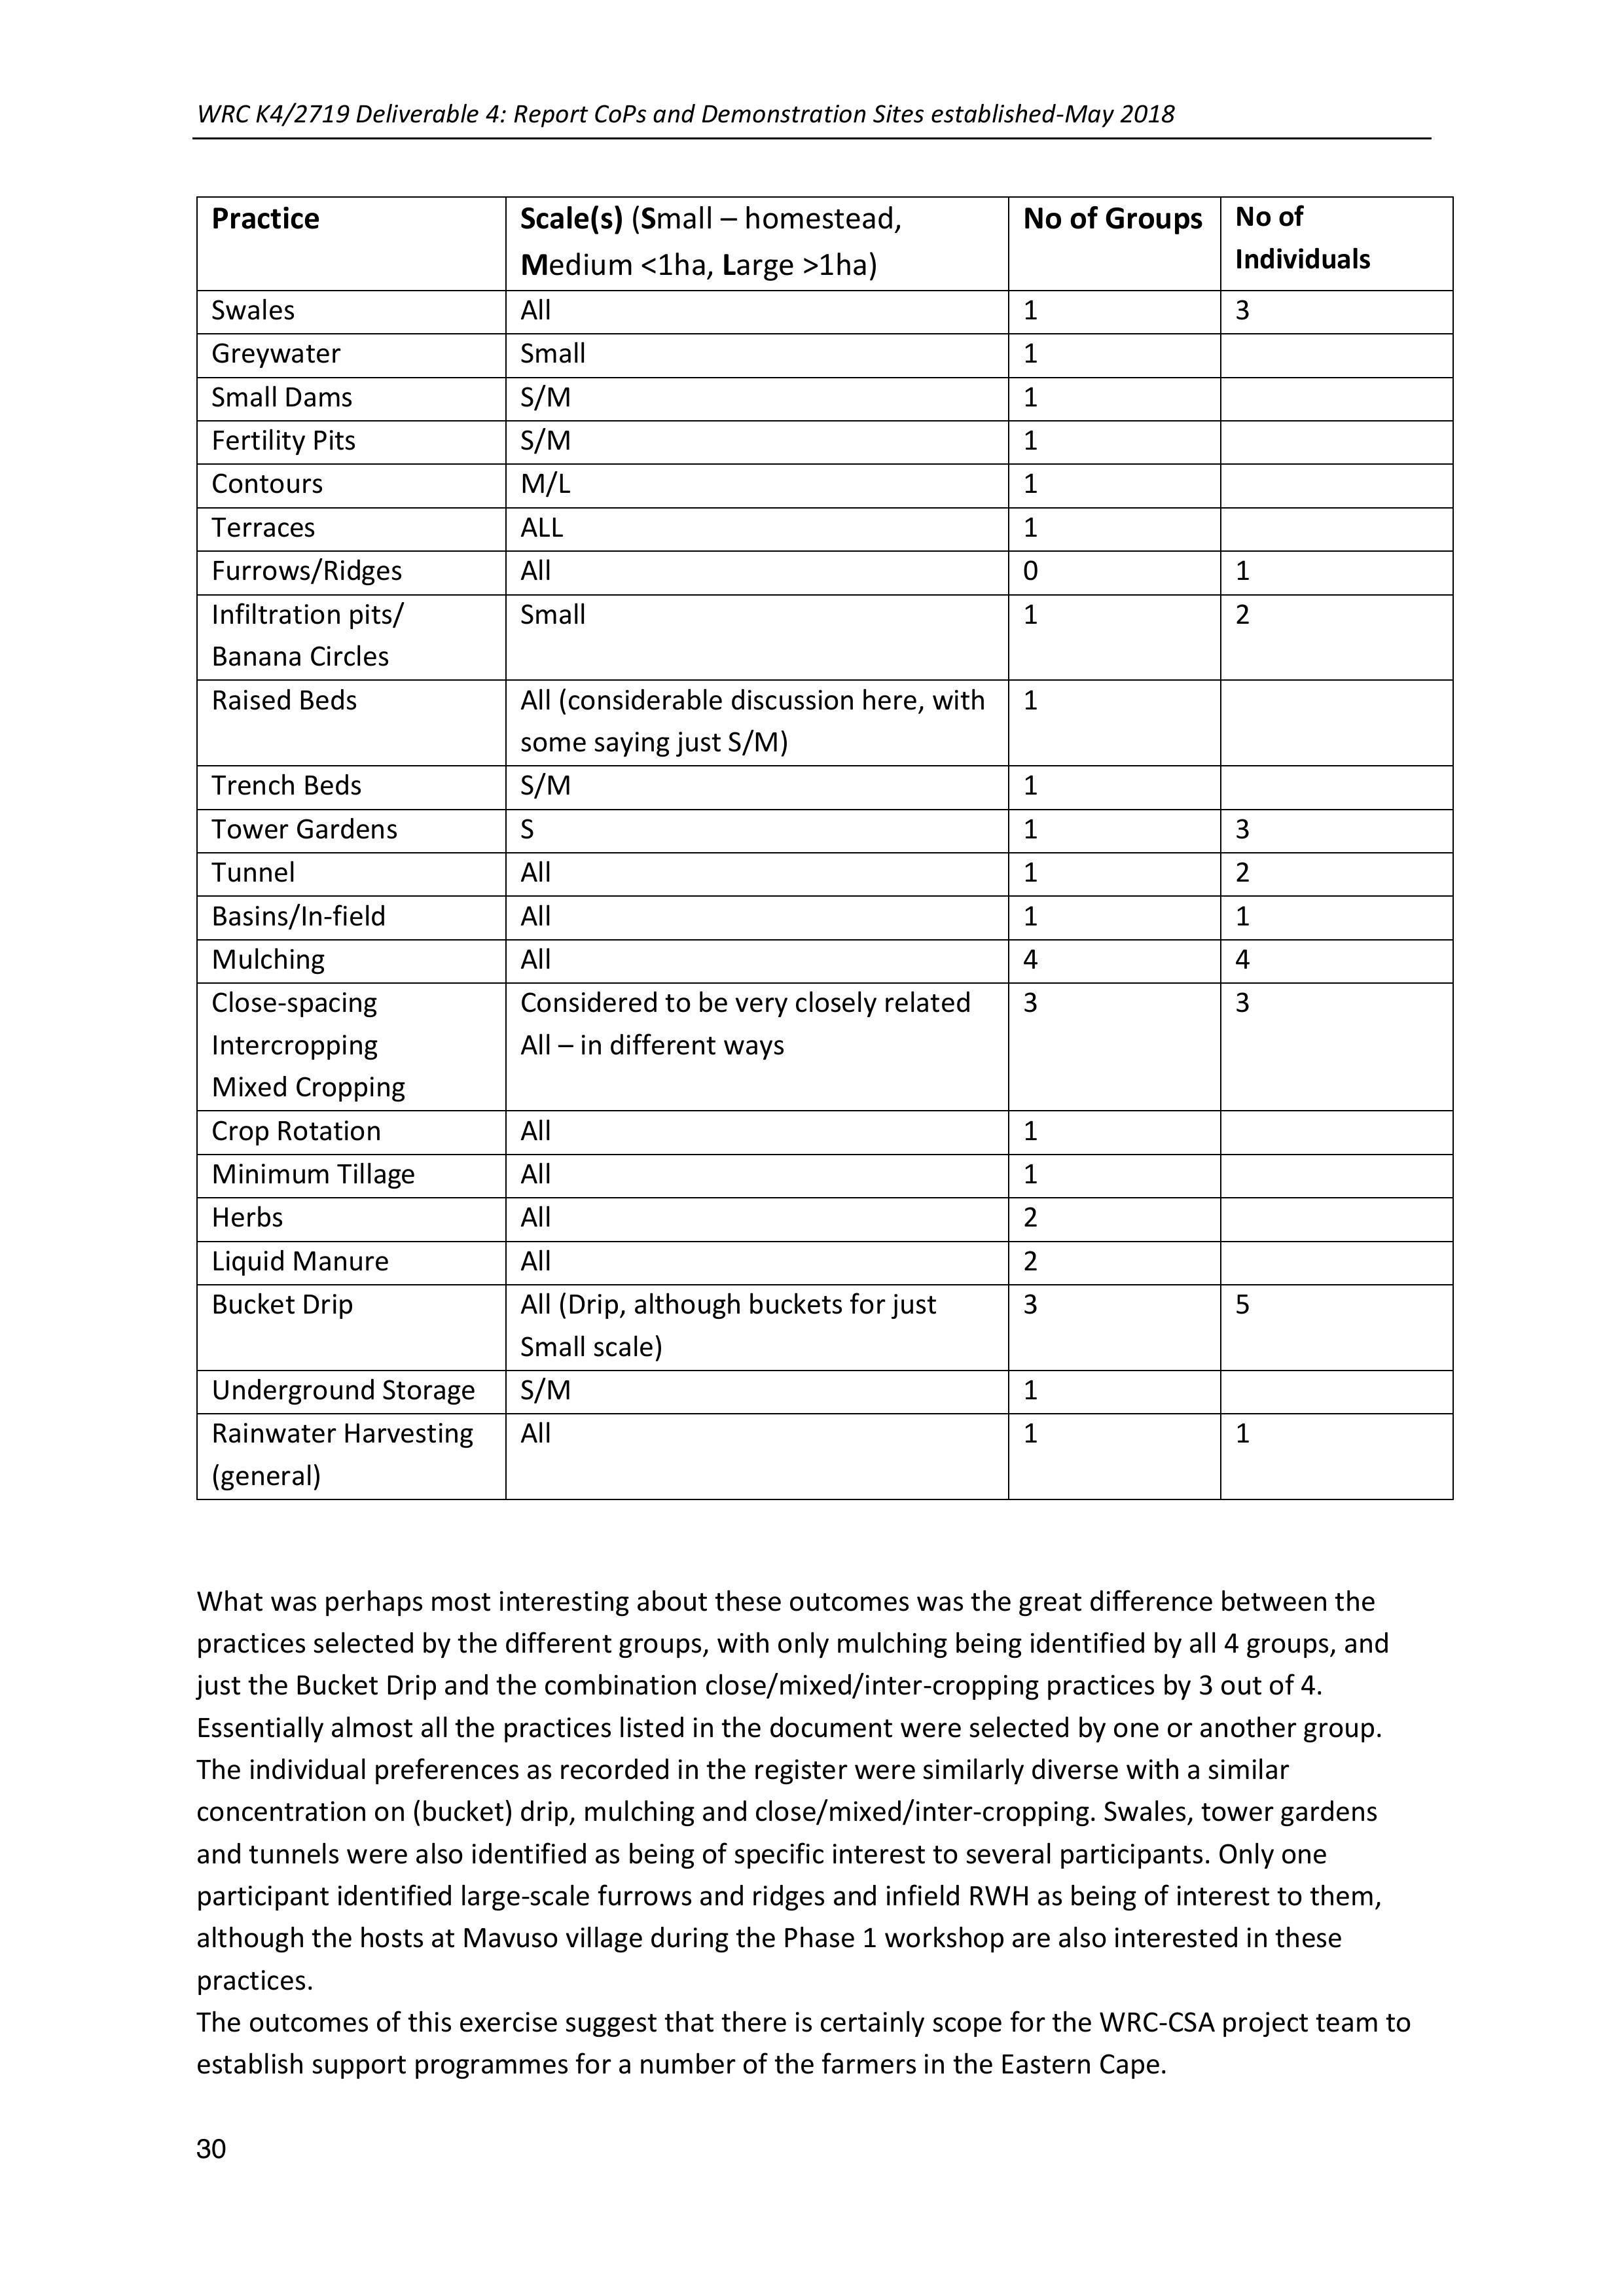
Table 1, below, represents the outcomes of this activity, combined with the numbers of individual
participants who later identified specific practices in which they were interested in the register.
Table 11:CSA Practices: Prioritization by groups and individuals
NOTE: Groups in this case are the small groups in the workshop settingconsisting of homestead
gardeners, cooperative members and more commercial farmers
WRC K4/2719 Deliverable 4: Report CoPs and Demonstration Sites established-May 2018
30
Practice
Scale(s) (Small – homestead,
Medium <1ha, Large >1ha)
No of Groups
No of
Individuals
Swales
All
1
3
Greywater
Small
1
Small Dams
S/M
1
Fertility Pits
S/M
1
Contours
M/L
1
Terraces
ALL
1
Furrows/Ridges
All
0
1
Infiltration pits/
Banana Circles
Small
1
2
Raised Beds
All (considerable discussion here, with
some saying just S/M)
1
Trench Beds
S/M
1
Tower Gardens
S
1
3
Tunnel
All
1
2
Basins/In-field
All
1
1
Mulching
All
4
4
Close-spacing
Intercropping
Mixed Cropping
Considered to be very closely related
All – in different ways
3
3
Crop Rotation
All
1
Minimum Tillage
All
1
Herbs
All
2
Liquid Manure
All
2
Bucket Drip
All (Drip, although buckets for just
Small scale)
3
5
Underground Storage
S/M
1
Rainwater Harvesting
(general)
All
1
1
What was perhaps most interesting about these outcomes was the great difference between the
practices selected by the different groups, with only mulching being identified by all 4 groups, and
just the Bucket Drip and the combination close/mixed/inter-cropping practices by 3 out of 4.
Essentially almost all the practices listed in the document were selected by one or another group.
The individual preferences as recorded in the register were similarly diverse with a similar
concentration on (bucket) drip, mulching and close/mixed/inter-cropping. Swales, tower gardens
and tunnels were also identified as being of specific interest to several participants. Only one
participant identified large-scale furrows and ridges and infield RWH as being of interest to them,
although the hosts at Mavuso village during the Phase 1 workshop are also interested in these
practices.
The outcomes of this exercise suggest that there is certainly scope for the WRC-CSA project team to
establish support programmes for a number of the farmers in the Eastern Cape.
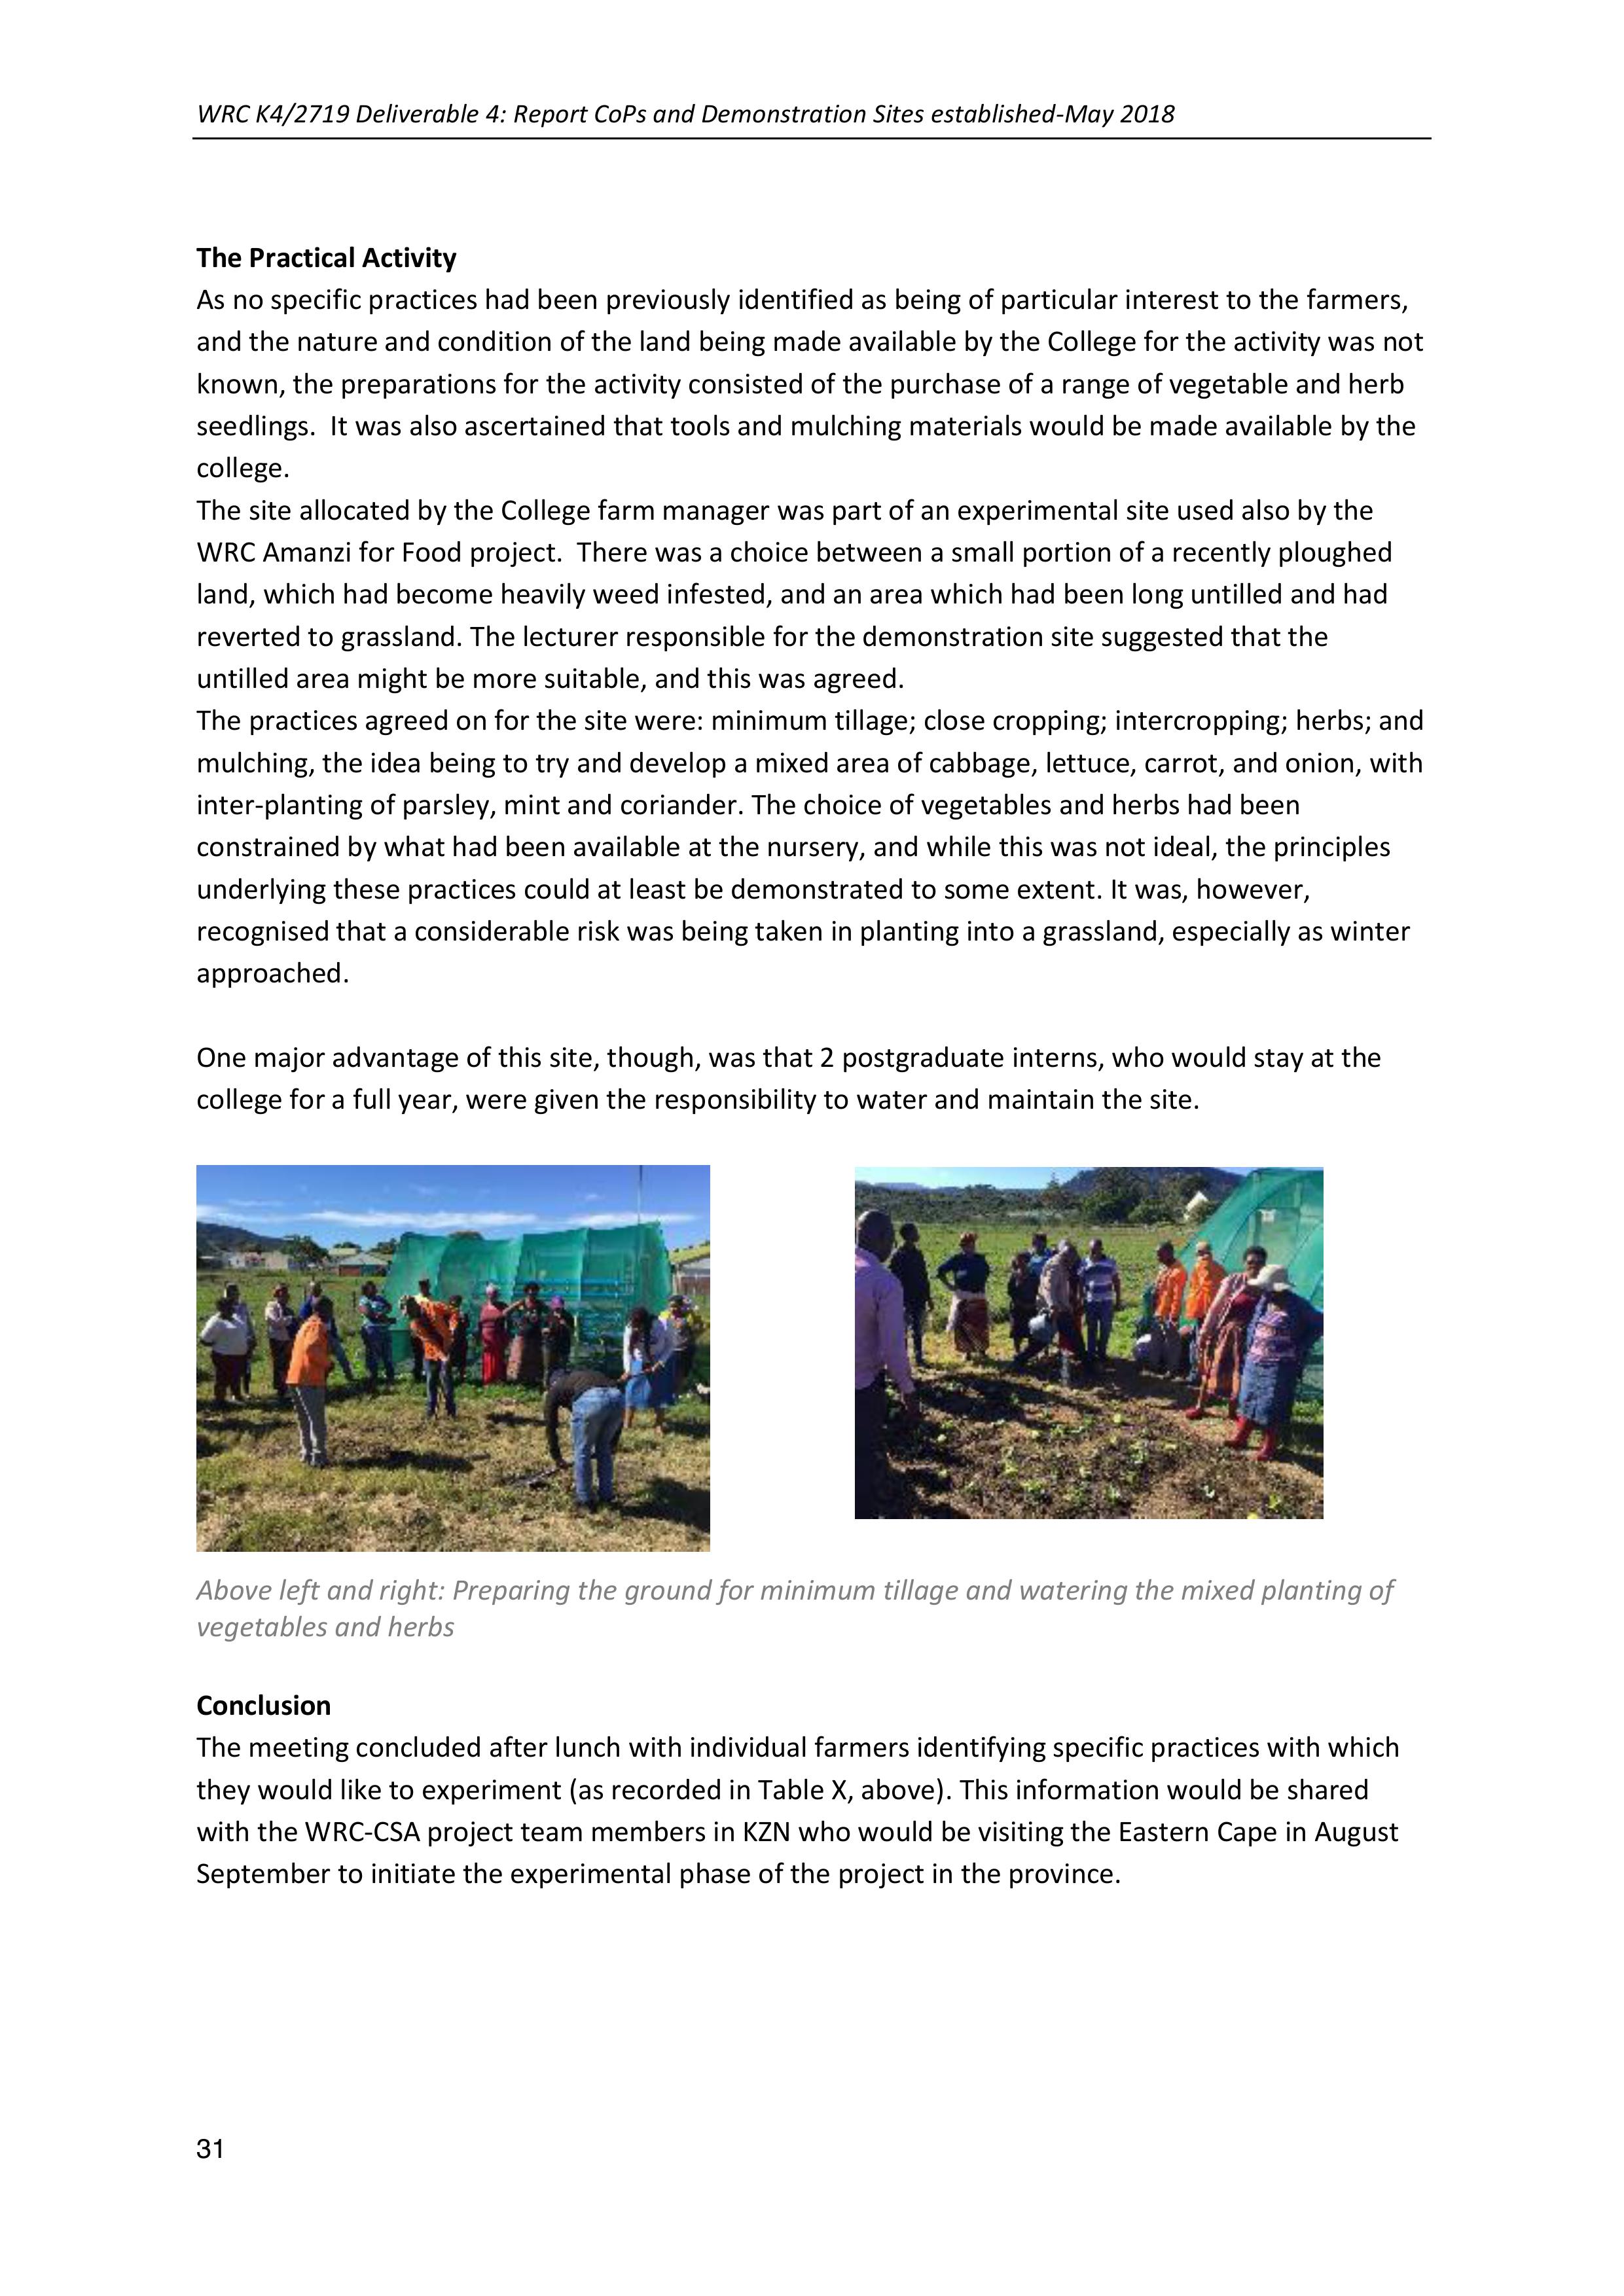
WRC K4/2719 Deliverable 4: Report CoPs and Demonstration Sites established-May 2018
31
The Practical Activity
As no specific practices had been previously identified as being of particular interest to the farmers,
and the nature and condition of the land being made available by the College for the activity was not
known, the preparations for the activity consisted of the purchase of a range of vegetable and herb
seedlings. It was also ascertained that tools and mulching materials would be made available by the
college.
The site allocated by the College farm manager was part of an experimental site used also by the
WRC Amanzi for Food project. There was a choice between a small portion of a recently ploughed
land, which had become heavily weed infested, and an area which had been long untilled and had
reverted to grassland. The lecturer responsible for the demonstration site suggested that the
untilled area might be more suitable, and this was agreed.
The practices agreed on for the site were: minimum tillage; close cropping; intercropping; herbs; and
mulching, the idea being to try and develop a mixed area of cabbage, lettuce, carrot, and onion, with
inter-planting of parsley, mint and coriander. The choice of vegetables and herbs had been
constrained by what had been available at the nursery, and while this was not ideal, the principles
underlying these practices could at least be demonstrated to some extent. It was, however,
recognised that a considerable risk was being taken in planting into a grassland, especially as winter
approached.
One major advantage of this site, though, was that 2 postgraduate interns, who would stay at the
college for a full year, were given the responsibility to water and maintain the site.
Above left and right: Preparing the ground for minimum tillage and watering the mixed planting of
vegetables and herbs
Conclusion
The meeting concluded after lunch with individual farmers identifying specific practices with which
they would like to experiment (as recorded in Table X, above). This information would be shared
with the WRC-CSA project team members in KZN who would be visiting the Eastern Cape in August
September to initiate the experimental phase of the project in the province.

WRC K4/2719 Deliverable 4: Report CoPs and Demonstration Sites established-May 2018
32
7BASELINE INFORMATION
Initial Climate Change dialogues, to explore concepts of climate change, the impacts on peoples’ lives
and farming activities and tostart discussions on potential adaptive strategies in these communities
have been undertaken for more than
2
7 villages across three provinces. In addition, baseline
information was gatheredfrom aa number of these groups. This consisted of individual interviews and
village walkabouts and speaks toproviding information for the farmer typology and aspiration parts
of the decision support process as outlined below.
Figure 1: The Smallholder decision support system process
Household level questionnaires
As a part of the initial community level interactions household interviews are conducted while doing
a village based “walkabout” for the following purposes:
1.To glean information for the DSS around farmer typologies and farmer aspirations; - through
a household questionnaire
2.To assess climate related stressors in the environment; thus to do a basic qualitative
assessment of availability of resources, stress on those resources, farming activities and
vulnerability of households; through more general discussions and photographs.
2
The IBLN in the EC covers +/- 10 villages
•Size
•Resources:physical,
environmental
•Resources: socio-
economic
•Social/institutional
•Management
capacity/technolog
y
Farmer
Typology: A,B,C
•Gardening
•Field cropping
•Livestock
•Trees, incl fruit
Aspiration
•Water
management
•Soil health
management
•Crop
management
•Livestock
management
•Natural resoruce
management
Farming system
•Water flow management
•Infiltration
•greywater management
•RWH
•Irrigaiton
•Soil erosion control
•Irrigation
•increased organic matter
•microclimate management
•crop diversification
(including varieties,
calendars
•improved tillage
•agroforestry
•fodder/feed management
•..........
Practices
•Labour
•Cost
•Ease- techincal
•Productivity
•Soil health
•Water use
efficiency
•Knowledge
Prioritzation -
criteria

WRC K4/2719 Deliverable 4: Report CoPs and Demonstration Sites established-May 2018
33
Household level questionnaires (see APPENDIX 1 for an outline of the questionnaire) were
administered to 6 participants in each province (KZN, Limpopo and EC) as a pilot of the process. The 6
participants in each case were randomly chosen or volunteered and were participants of the climate
change dialogue and impact workshops conducted in these areas.
These participants are not seen as representative of the broader community, but are seen as
representative of the interest group in the community willing to tacklethe issues around their farming
practice and work towards improvements.
The questionnaires touched on a range of topics toassist with a farmer typology classification and also
to assess available resources, farming activities and vulnerabilities of the participants including:
-Basic socio-economic and household information
-Access to services and infrastructure
-Social organisation
-Learning and access to information
-Livelihoods and faming activities
-Income and
-Market access
The socio- economic data for the interviewees has been summarised in the figure below. From the
figure we can make the following observations:
-61% of respondents were female (n=18) and the average age of respondents is 49 years.
-The average household size is around 5 members and the dependency ratio for this groups is
66. This is significantly higher than the national average of 44,5. Dependents in this case
include both children under 15 years of age and pensioners.
-The level of education of these participants is Primary school level – 28%; High school level -
56% and tertiary level – 16%. This generally higher level of education is reflected also in the
inclusion of younger adults in this group of participants
-80% of participants belong to social organisations; including learning groups Village Savings
and Loan Associations, school gardening groups and cooperatives
-Regarding incomes, 67% of the households from this group receive social grants and 61%
receive salaries. The average monthly household income is however still low at R3 992. For
households without employment this is MUCH lower at R947/month.
-Access to electricity is common (89%), but access to water is much more restricted with
access to municipal water through household taps and communal standpipes being 50% and
33% respectively. This does not mean water is freely available, especially in KZN and
Limpopo where municipal systems fail often and for extended periods of time.
-56% of these participants have some form of rainwater storage; drums or Jo-Jo tanks (2000l)
are the most common and 11% have their own boreholes (participants from Limpopo only)

WRC K4/2719 Deliverable 4: Report CoPs and Demonstration Sites established-May 2018
34
Figure 2:Baseline information for CCA workshop participants
An important component of the information, for the purposes of the farmer typologies and the DSS is
the scale of operation. This is different depending on the local situation in the villages – for those that
have undergone betterment planning with tightly laid out villages and fieldsa distance from the
homestead (Limpopo, EC) - most households only have access to small household gardens; for those
within communal tenure areas that have developed independently provide household gardens and
homestead fields between 0,1-1ha). Larger fields are generally only accessible though more formal
arrangements such as cooperatives.
For this sub-group of participants 72% have access to 0,1-1ha of land, 11% have access to 1-2ha of
land and 17% have access to >2ha. Those that have gardens make up 67% of the participants. 61% of
participants keep livestock, but only 16% own cattle.
0 2 4 6 810 12 14 16 18 20
no. of participants
Age (in 10yrs)
Primary school
Tertiary
Savings group
Farmer 's cooperative
No. of children
Grants
Other livelihood activities
Standpipe
RWH storage
Fencing
no.
of
parti
cipa
nts
Gen
der
(F)
Age
(in
10yr
s)
Hou
seho
ld
head
Pri
mar
y
scho
ol
High
scho
ol
Tert
iary
Lear
ning
grou
p
Savi
ngs
grou
p
Scho
ol
gard
enin
g
grou
p
Far
mer
's
coop
erati
ve
No.
of
adul
ts in
HH
No.
of
chil
dren
Dep
end
ancy
ratio
Gran
ts
Sala
ry
Othe
r
livel
ihoo
d
activ
ities
Tap
wat
er
Stan
dpip
e
Bore
hole
RW
H
stor
age
Elec
trici
ty
Fenc
ing
Trai
ning
and
advi
ce
Total 18 11.0 4.99510 310 7263.5 2.25 0.612 114 9 6 210 17 15 16
Baseline infromation for households interviewed in the CCA
process; Nov-Dec 2017 (Limpopo, KZN)

WRC K4/2719 Deliverable 4: Report CoPs and Demonstration Sites established-May 2018
35
Farming related information is summarised in the figure below.
Figure 3: Household, scale of farming and income information for CCA participants
Most of the participants farm by hand, or rent tractors or oxen. Those with direct access (ownership)
are only 17% -and these participants invariably come from households where members are
employed.
Overall vulnerability in farming is HIGH as people have access to small pieces of land, generally rely on
dryland cropping, farm by hand and own small numbers of livestock. Cattle ownershipis becoming
less common with only around 16% of households owning cows. Participants farm mostly for food
production to feed their families, and only around 28% sell produce.
Farmer typologies
Rural dwellers in South Africa, most of whom live under communal tenure arrangements comprise
around 19 million people –around 34% of the South African population. The vast majority of these
people are not actively farming -around 85%. There are presently only around 35 000 commercial
farmers still active.
There are a number of different models for approaching farmer segmentation and a few examples are
already available. Smallholder farmers fall within different categories of resource availability,
capabilities and aims for their farming. The segmentation approach sets out the basis for providing
targeted support to the different segments of the farming community; according to their own
aspirations and abilities. Such models can be useful in the DSS being developed.
0246810 12 14 16 18
Salary
Income (in R1000)- unemployed
1-2 ha
Gardens
Other livelihood activities
Fencing
Traction; incl animal
Training and advice
Salary
Incom
e from
veg
sales
Incom
e (in
R1000
)-
unemp
loyed
0,1 - 1
ha 1-2 ha>2haGarde
ns
Field
size
(0,1-
1ha)
Other
livelih
ood
activiti
es
Fruit
trees
Fencin
g
Hand
tools
Tractio
n; incl
animal
Market
access
Traini
ng and
advice
Total 1811 52 13 23 12 1049 15 10310 16
Household, income and farming information for household
interviews_CCA baseline_Nov-Dec 2017

WRC K4/2719 Deliverable 4: Report CoPs and Demonstration Sites established-May 2018
36
One such model has been developed for the GrainSA Smallholder Farmer Innovation Programme in
Conservation Agriculture. The outline of this typology is presented in the table below. By far the
largest category of rural dwellers are the non- commercial and semi-commercial smallholders who
make up around 2,5 million people. Commercial smallholders in loose value chains make up around
250 000 people and those in tight value chains only around 10 000.
3
Table 12: Farmer segmentation in the Bergville smallholder farming system
Category
Non-commercial
smallholders
Semi-commercial
smallholders
Commercial
smallholders in
loose value chains
Commercial
smallholders in
tight value chains
% of people in
each category
72
23
5
-
Farmer priorities
Most production
consumed by the
household and
additional food is
bought in
Production is
intensified. Selling
becomes more
significant and
supplements
household income.
Consumption and
sale in various
percentage mixes
but moving to more
sales.
Primarily for sale-
working within
existing well
defined commodity
value chains
Gender
Mostly women
(89%)
Mostly women
(96%)
Women, men (40%
♀60%♂)
Mostly men
Resources
Low external input
systems are used
with a minimum
of bought inputs
Mixed (low and
external) input
systems are used
with a minimum of
bought inputs
Mixed (low and
external) input
systems are used
with greater
reliance bought
inputs
Mostly high
external input
systems
Traction
Hand cultivation
Hand cultivation,
animal traction
Animal traction,
tractors
Tractors
Land size
≤ 0.1ha
0.1-1ha.
1-2.5ha
>2ha
Farm
productivity,
including labour
access
Extremely low
Low to high
Low to high
Low to high
Access to
improved
agricultural tech
and information
Very limited
Limited
Limited
Good
Access to
financial
services
Very limited if at
all
Very limited if at all
Very limited
Informal and some
formal through
buyers
Local
organisation
Almost non
existent
Almost non existent
Informal farmers
groups
Farmers
associations and
cooperatives
Agribusiness
support
Very limited.
Very limited.
Informal but
growing
Reasonable
3
Cousins, B. (2015). Through a glass darkly: towards agrarian reform in South Africa, in: Ben Cousins and Cherryl Walker (eds), 2015. Land
Divided, Land Restored. Land Reform in South Africa for the 21st Century. Auckland Park: Jacana (250-269).

WRC K4/2719 Deliverable 4: Report CoPs and Demonstration Sites established-May 2018
37
Engagements
with markets
Very little;
entirely informal
Limited and still
informal for the
most part
Both informal and
formal
Can be good due
to value chain
farming bundles
Environmental
performance
Generally not
considered
Generally not
considered, some
adoption of
conservation and
sustainable practices
Generally not
considered, some
adoption of
conservation and
sustainable
practices
Some adoption of
conservation and
sustainable
practices
Crop mix
Staple crops
Crop livestock
mixes focussing on
4-5 commodities
Staple crops, some
cash crops, crop
livestock mixes –
focussing on 3-4
commodities
Staple crops, some
cash crops, crop
livestock mixes –
focussing on 2-3
commodities
Mostly cash crops –
focusing on 1,
maybe 2
commodities
Livelihood (Food
Security, Total
monthly
income, assets,
poverty
likelihood,
perceived well
being)
Food Security: low
Monthly Income:
R0-R2000
Assets: minimal
Poverty
Likelihood; High
Food Security: low-
medium
Monthly
Income:R2001-
R4000
Assets: minimal-
starting to build
Poverty Likelihood:
medium
Food Security:
medium-high
Monthly
Income:>R4000
Assets: reasonable
Poverty Likelihood:
low
Food Security: high
Income:
Assets
Poverty Likelihood
This model provides a good starting point for the development of a farmer typology for interventions
in climate change adaptation and similar categories have been used in our process.
The CC baseline survey provides for a number of vulnerability indicators. As a starting point an analysis
of incomes of the interviewed households is summarised in the table below
Table 13: Baseline information related to incomes
MONTHLY INCOMES (in Rands)
Village
Name & Surname
Grants
Salary
Income
from veg
sales
Total income
Ave per
village
Sekororo/
Lorraine
Chenne Mailula
R2 000,00
R2 000,00
Lydia Sechube
R1 600,00
R1 600,00
Dimakatso
Thobejane
R380,00
R380,00
Masine Morerwa
R15 000,00
R15 000,00
Mdimi Shai
R1 760,00
R4 740,00
R6 500,00
Flora Maimela
R1 600,00
R1 600,00
R4 513,33
Tabamhlophe
Winnie Dlamini
R380,00
R4 620,00
R5 000,00
Zanele Ngobese
R8 000,00
R8 000,00
R6 500,00
Eqeleni
Ntombakhe Zikode
R1 140,00
R1 140,00
R1 140,00
Ezibomvini
Nombono Dladla
R600,00
R600,00
Zodwa Zikode
R600,00
R600,00

WRC K4/2719 Deliverable 4: Report CoPs and Demonstration Sites established-May 2018
38
Phumelele
Hlongwane
R1 530,00
R730,00
R2 260,00
R1 153,33
Alice/Middledrift
area
(+/- 10 villages)
Pheza Makisi
R9 000,00
R1 000,00
R10 000,00
Bongiwe Mxonywa
R380,00
R380,00
Xolisa Dwane
R7 000,00
R7 000,00
Mncadi Mabandla
R1 140,00
R4 000,00
R860,00
R6 000,00
Mandisa Mama
R760,00
R1 040,00
R1 800,00
Siyabulela
Gungqceni
R760,00
R1 240,00
R2 000,00
R4 530,00
AVERAGE MONTHLY INCOME
(excluding zero incomes)
R971,54
R5 955,00
R2 318,00
R3992,00
From the table above the following points come to the fore:
1.72% of Households interviewed receive social grants and this is the only household income
for 33% of these respondents. The average ’income’ from grants is R972/ month
2.44% of Households interviewed receive a salary as part of their monthly income. The
average household income from salaries is R5 955/month. The number of households where
there is employment in this interview groups is proportionally much higher than the average
in rural communities around South Africa, where reliance on grants can be as high as 70-
80%.
3.Even so only 28% of these respondents earn an income from farming, with 11% (or two
individuals of 18) earning their entire income from farming. Average income from farming
(both sale of vegetables and field crops) is R2 320/month.
4.Corroboration of information from project related baseline surveys ( see the textbox below)
indicate average income in Tabamhlophe to be around R1 567/month per household. This is
similar to the data obtained for the Bergville area – which is close by. For Bergville there is a
whopping 89% unemployment among the project participants and 72% rely entirely on
grants for their income and 75% of households earn between R0-R2 000/month.
5.In the villages in Limpopo and EC where there is a somewhat higher proportion of
employment, the average monthly incomes are around R4 500/month per household

WRC K4/2719 Deliverable 4: Report CoPs and Demonstration Sites established-May 2018
39
The information around incomes indicate a HIGH LEVEL of vulnerability for rural dwellers engaged in
farming activities. Only about 1/3 of participants make any income from their farming activities and
these incomes are generally subsidised from social grants or other employment.
LIVELIHOODS SURVEYS IN KZN (2017)
In Tabamhlophe, the Lima RDF fieldworker, Lindelwa Ndaba conducted a baseline survey with her 13
participants in the Food Security learning group she is training and mentoring. From this survey the
average monthly income for these participants is R1 567.
In Bergville (which includes Eqeleni and Ezimbomvini) the MDF fieldworkers led by Phumzile Ngcobo
conducted a seasonal review of the Conservation Agriculture support programme in August 2017.
This survey includes information about income sources and incomes for these participants. For a
sample of 21 participants the following information was summarised:
-Income sources are social grants (72%), employment (11%), remittances (7%) and
farming (10%)
-Overall incomes per household are extremely low, with 75% of households earning
between R0-R2000/month. The remaining 25% earn >R3 000 /month. The average
income is R1875/hh/month – a reduction from last year which was around
R2450/hh/month
-Maize and beans used for hh food supply; 53% of participants now have enoughfor 7-
12months, increased from around 33% last season
Child
support
grant 55%
Pension
17%
Employme
nt
11%
Remittanc
es
7%
Farming
10%
SOURCES OF INCOME
1-3months…
4-6months
39%
7-9months
38%
10-12months
15%
HOUSEHOLD FOOD SUPPLY THROUGH CA

WRC K4/2719 Deliverable 4: Report CoPs and Demonstration Sites established-May 2018
40
The WRC baseline survey further explored incomes for male and female headed households. A third
category consisting of both male andfemaleheadedhouseholds of working age (thus having no old
age grants) emerged. The small table below summarises the incomes
Average monthly income per household
Male headed(39%)
R7 071
Female and male headed (33%)
R 2 068
Female headed (28%)
R 940
Thus, female headed households in these rural areas labour under a VERY HIGH LEVEL of vulnerability
due to their very low levels of income (ave R940/hh/month). Households that cannot access old age
grants make up another category of vulnerability (ave R2 068/hh/month). With an average household
size of 5 members, it is clear that the ability of these households to commit resources towards climate
change adaptation would be severely limited.
The inclusion of other livelihood and vulnerability indicators then assisted us to build a tentative and
initial farmer typology for the smallholder farmersinvolved.This typology is outlined in the table
below.
Both typologies A and B can be considered to have a HIGH LEVEL of vulnerability. Typology C indicates
a much smaller group of smallholder farmers who have better or more reliable access to infrastructure
and support, are generally better educated, have access to larger fields and more livestock and farm
primarily for income generation purposes. They fund these farming enterprises primarily through
incomes earned from employed members within the household, or a combination of employment and
social grants (including pensions). These farmers are also more likely to belong to cooperatives and
farmers associations and to have access to formal market linkages.
Table 14: Farmer typology for the WRC-CCA process
FARMER TYPOLOGY
A (44%)
B (18%)
C (39%)
Basic socio-
economic and
household
information
Gender
100% Female
farmers
80% Female
farmers
5-15% female
farmers
Age range
33-66yrs
27-48yrs
31-78yrs
Household head
Female
Female/male
Male
Dependency ratio
0,7
1
0,5
Livelihood
activities
Employment
Unemployed
Unemployed/
employed
Employed
Small businesses
80%(Selling in
schools, sewing
etc)
0%
0%
Grants
1-3
1-3
1-3
Farming activities
Gardens, fields,
livestock
Gardens, fields,
livestock
Fields, livestock
0,1- 1ha
100%
100%
1-2ha
50%
>2ha
50%

WRC K4/2719 Deliverable 4: Report CoPs and Demonstration Sites established-May 2018
41
Levels of income
(per hh/month)
R0-R1999
R940
R2000- R4999
R2 100
>R5000
R7 000
Access to services
and infrastructure
Electricity
80%
80%
100%
Water -taps (hh)
0%
50%
100%
Standpipes (100-
400m)
80%
RWH
30%
67%
67%
Farming
infrastructure
Hand tools
Hand tools
Tractors, planters
Social organisation
Groups (for
learning, school
gardening etc)
80%
80%
80%
Saving clubs
100%
60%
Cooperatives
100%
Learning and
access to
information
Level of education
Grade 4-Grade 12
Grade 7-grade 12
Grade 11- Diploma
Market access
Informal
15%
15%
67%
Formal
0%
0%
83%
Farming income
Food only
100%
40%
Food plus income
60%
Mainly income
100%
This typology is specific for people actively involved in rural development programmes/projects.
A few interesting points come to the fore:
1.TYPOLOGY A: Woman headed households are by far the most vulnerable. In this survey all
the most vulnerable households are woman headed households; where the household head
is unemployed, farming only for food production (0,1-1ha, both gardens and fields), have
limited access to water and engages also in other small business activities such as sewing. All
the members of this group belong to savings clubs and have a slightly lower average level of
education than the other two groups.
2.TYPOLOGY B: This category consists mainly of economically active women without access to
old age pensions in their households. They rely on grants and some employment within the
household for their income and have somewhat easier access to water and farm for both
food and income (0,1-1ha, both gardens and fields) – although these incomes are quite low.
3.TYPOLOGY C: This group consists primarily of gainfully employed households with
reasonable incomes and can thus afford membership of cooperatives that provide access to
larger fields and irrigation (1-2ha and >2ha fields). They farm mainly for income generation,
have better access to markets and a higher average education level than the other two
categories.
Categories that do not vary much across the typologies includes:
-Access to tools and farming equipment - a very few individuals in Typology C own tractors
and implements, but most participants rely on hand tools and some animal traction.
-Access to electricity is the same across all three typologies
-Farmers engage in gardening, field cropping and animal husbandry across all three
typologies.

WRC K4/2719 Deliverable 4: Report CoPs and Demonstration Sites established-May 2018
42
-Participants across all three categories have equal access to social grants
-The dependency ratio (no of children and pensioners compared to the number of working
aged adults in a household) is quite a bit higher than the national average for 2016 which
was 44,5, at 66. There are however fewer children living in these households than would be
expected, but more economically dependent adults. Again, this situation is the most severe
for Typology A; the poorest households.
Scale of operation
This appears to be more dependent on the area and presently:
-In Limpopo all participants were working in gardens only
-In KZN most participants worked in both gardens and fields depending on the type of village-
in the more urban, planned villages with smaller demarcated plots – only gardens and in
areas where communal tenure arrangements have allowed for fields close to home – then
gardens and fields
-In EC; A 10ha cooperative plot shared by 6 individuals producing crops under irrigation
(vegetables and field crops)
Table 15:Summary of scale of operation for present participants in the WRC-CCA process
Province
Village Name
Description
Scale of
operation
Livestock
Ave income
for village
Ave
monthly
income
from
farming
Limpopo
Sekororo
Village + fields
(further away)
0,1-1ha
Gardens only
None
R4 513 (2/6
employed)
R2000 (1/6)
KZN
Tabamhlophe
Village (no
fields)
0,1-1ha
Gardens only
Chickens
R6 500 (2/2
employed)
R0
Eqeleni
Informal village
(fields around
homesteads)
0,1-1ha
Gardens
Fields (0,1-
1ha)
Chickens,
goats, cattle
R1 140 (1/1
unemployed)
R0
Ezibomvini
Informal village
(fields around
homesteads)
0,1-1ha
Gardens
Fields (0,1-
1ha)
Chickens
goats, pigs,
cattle
R1 153 (3/3
unemployed)
R780 (1/3)
EC
Alice
Cooperative
~10ha -
irrigated
Fields (0,1-
1ha, 1-2ha,
>2ha)
Chickens,
goats, pigs,
cattle
R4 530 (4/6
employed)
R2954 (4/6)
This points towards the main category of farmers to be supported through the DSS being those with
access to household gardens and small livestock such as chickens, goats and pigs and thosewith access
to small (0,1-1ha) dryland fields.
Other categories that still need some attention in terms of a coherent set of CSA practices are
1.Irrigated fields and
2.Grazing management for livestock (cattle)

WRC K4/2719 Deliverable 4: Report CoPs and Demonstration Sites established-May 2018
43
Walkabouts
Walkabouts in this contextare informal village walks consisting of the facilitators of theprocess and
volunteers or key informants from the local community who have been engaging the climate change
dialogues and can broadly be considered a Rapid Rural Appraisal process.
The village walks included in the CC baseline survey fulfil a number of purposes:
-To provide facilitators with a perspective on the general state of resource availability, access
and use in a locality (soil, water, natural resources, infrastructure)
-To provide a qualitative assessment of the potential impacts of CC in the area
-To assess the local farming practices and
-To record and assess potential good practice (indigenous / traditional practices) for climate
smart agriculture
-To review the implementation of CSA practices in the area (if relevant) and
-To interview individual householders for vulnerability and livelihood information
Below are a selection of household visits during walkabouts in Tabamhlope (KZN, Ezibomvini (KZN)
and Mavuso (EC). The full reports can be found in Appendices 2,3 and 4.
Tabamhlophe
Below are images illustrating the walkabout in Mrs Ntuli’s household. She has recently moved into the
area and has joined the farmers’ learning group in the community. What hasdriven Mrs Ntuli in
participating in this learninggroup was thatshe has a son who is not well andthe doctors have
recommended that she gives him fresh vegetables to boost his health. She also attends a church in
the community that feeds the homeless people;
this hasplayeda huge role in herlifeas it
encourages her to take care of her garden so she
can give to the needy people within her
community. She also began to keep chickens with
an intention of selling to generate income as her
husband is the only one working in the household.
Right: Mrs Ntuli next to her shade house which
contains 6 trench beds where she produces,
spinach, carrots, tomatoes, peppers and beetroot

WRC K4/2719 Deliverable 4: Report CoPs and Demonstration Sites established-May 2018
44
Above left and right; She uses submerged 2litre bottles for slow subsurface irrigation in her shade
house and keeps a small flock of broilers for sale in corrugated iron hut constructed for the purpose.
The second household wevisited was Mrs Dlamini’s. She has been part of the LIMA learning group
since inception and has made trench beds in her home garden and intercropped her vegetables. She
grows cabbages, lettuce, carrots and beetroot in her trench beds. Mrs Dlamini uses 2 litre bottles to
water her garden by burying them half way into the soil. She has a Jo-Jo tank for RWH.
RIght: Mrs Dlamini’s Jo-
Jo tank. Ditches are
evident to try and deal
with run-off and erosion
close to the house.
Far right: In
intercropped trench bed
with 2l bottles for slow
even irrigation
Ezibomvini
Household 1: Mrs. Phumelele Hlongwane
A 38 year old mother of 6, Mrs Phumelele Hlongwane is passionately involved in her farmingactivities.
In her garden she grows a variety of crops inclusive of; cabbages, spinach, tomatoes, potatoes, and
green peppers. She also keeps livestock inclusive of, 6 goats, 2 pigs and a flock of indigenous chickens.
Apart from her household garden she also plants in her field of 1 ha where she grows potatoes, sweet
potatoes and maize. MrsHlongwane joined the CA learning group in 2014 and is currently a
community facilitator of the learning group. From her vegetable produce she sells the surplus to her
community members.

WRC K4/2719 Deliverable 4: Report CoPs and Demonstration Sites established-May 2018
45
Right; The pig pen
Far right: A patch
of beans
struggling in the
hot dry conditions
prevalent this
season
Below is a case study done for Phumelele Hlongwane that has been published in “SA Grain”the
February 2018 edition of the GrainSA newsletter, as well as the Adaptation Network Newsletter
(January 2018)
Case Study GrainSA SFIP: Conservation Agriculture builds a better life
for Mrs Phumelele Hlongwane (Bergville)
Authors: Phumzile Ngcobo1, Erna Kruger
1Mahlathini Development Foundation. 2Forresters Lane Pietermaritzburg, 3201.
www.mahlathini.org. Cell: (+27)828732289
Phumelele Thembisile Hlongwane is a 38 year old woman and a mother of 6 from Bergville
Emmaus- Ezibomvini village. She says her passionstems from agriculture’s ability to enable
her to be self reliant, in her case the key is diversification. She has a vegetable garden in her
homestead planted toa wide varietyof crops including brassicas, cabbage, spinach,
tomatoes, potatoes and green peppers. She owns livestock; 03 cattle,6 goats, 2 pigs and a
flock of indigenous chickens. She also plants her fields to field crops such as potatoes, sweet
potatoes, maize, dry beans and soy.
”Maka Ndoza”, as she is affectionately known joined the Grain SA CA project in 2014 and is
now the community facilitator of her Ezibomvini learning group. She is a member of thevillage
savings and loan association, along with other members of her learning group. Here the save
and take small loans for inputs and other livelihood necessities.She is also one of the pioneers
of the programme’s local farmer centre model which she runs jointly with her sister in law
Zodwa Zikode, who is also a member of the learning group.

WRC K4/2719 Deliverable 4: Report CoPs and Demonstration Sites established-May 2018
46
Phumelele Hlongwane shares that the primary aim of the farmer centre is to be able to provide
production inputs to farmers in quantities and at costs they can
afford. The farmer centre providing seed, fertilizer and chemicals
has really come into good use as according to her the rates of
agriculture activity in her community have improved because
quantities sold at the farmercentre start from as little as 1 kg up
to entire bags of seed/ fertilizer. “Many people in the village had
stopped planting because theycould not afford inputs” said
Phumelele further supporting the importance of the farmer
centre.
The returns derived from the farmer Centre are not large and are
also quite seasonal. To date they have made a profit of around
R300-R600/ monthfrom sales, most of which has been re-
invested to continue to buy stock.
Right: Offerings form the local farmer centre also includes some
local produce, to augment the sale of inputs in the slow periods
The small table below indicates sales and shows also the seasonality of these
Table 1:Ezibomvinifarmercentrerecords fromDecember2016 toApril2017
Date
Fertilizer
Herbicide
Top dresser
Seed
Total
December
2016
R2758
R1400
R480(LAN)
R630(UREA)
R1161(maize)
R80(beans)
R6509
January
2017
R0
R280
R1692(UREA)
R360(beans)
R72(maize)
R2404
February
2017
R24
R0
R336(UREA)
R80(beans)
R440
March 2017
R0
R0
R36(UREA)
R0
R36
April 2017
R0
R0
R0
R0
R0
While her vegetable garden yields some income for her, this is
periodic because she only sells surplus, leaving her
predominant source of incometo social grants for five of her
six children. Field crops also are primarilyfor household
consumption.
Right: Phumelele’s vegetable garden (November 2016)

WRC K4/2719 Deliverable 4: Report CoPs and Demonstration Sites established-May 2018
47
Conservation Agriculture Experimentation
Phumelele’s trials were continued in this season. The layout of her plots are shown below for
the 2016/2017 season. She is practicing crop rotation as well as intercropping and planting of
cover crop mixes; both summer (sunflower,millet, sunn hemp) and winter (saia oats, fodder
rye and fodder radish).
Figure 1: Phumelele Hlongwane’splots layout for 2016/2017 growing season
Yield results
In the 2015-2016 season, Phumelele out performed almost all the other smallholders and
managed to get rather impressive yields at a time when most other farmers’ crops failed. She
experimented with a number of different crop combinations in her CA plots. Her maize control
was also a CA plot, but with use of her own fertilizer and seed options. Her experimental plots
included:
•Intercropping of maize with beans
•Intercropping of maize with cowpea
•Planting cover crops in between rows of maize (relay cropping)
•Intercropping maize with lablab
•Planting a single crop of maize (control)
•Planting a single crop of Lab-lab (Dolichos) beans and
•Intercropping of maize with Lab-lab beans
Phumelele followedwith a rotation schedule of the same experimentsinthe 2016-2107
season.
(10)
M + B
(5)
M
Control plot
(8)
M + CP
(6) sunhemp,
millet and
sunflower
(3)
M + B
Contr
ol plot
(9)
M + B
(7)
M
(4)
LL
(2) M +
runoff plot
(1)
M
Legend: M – Maize; B – Beans; CP – Cowpea; LL – Lab lab

WRC K4/2719 Deliverable 4: Report CoPs and Demonstration Sites established-May 2018
48
Left to right: Phumelele standing in front of her maize and bean intercrop plot, taken on 17 Jan
2017. Her Lab-Lab plot and a SCC plot where she grew sunflower separately and millet and
sunn hemp together.
The table below shows yield comparisons for Phumelele’s experimental plots.
Table 2:MaizeyieldsfromdifferentexperimentalplotsinPhumlele Hlongwane’s
(Ezibomvini)field
2015/2016 season
2016/2017 Season
Plot no
Crops Planted
Maize Yields
(t/ha)
Crops
planted
Maize Yields
(t/ha)
Change in
yield (t/ha)
10
Maize +Beans
8,3
Maize +
Beans
8,8
0,5
9
Maize +Cowpea
8,7
Maize +
Beans
8,9
0,2
8
Maize + Beans
10,4
Maize +
Cowpea
7,7
-2,7
7
Maize +Cowpea
6,9
Maize
6,5
-0,5
3
M +SCC+WCC
8,7
Maize +
Beans
10,1
1,4
1
Maize +Beans
6,9
Maize
6,2
-0,7
The small table below indicates yield averages over the last two seasons.
Table 3:Summary ofdifferent cropyieldsin PhumeleleHlongwane’sexperimental
plots.
t/ha
2016
2017
Maize (Control)-CA
7,8
9,7
Maize Trial CA - combined
6,93
8,3
Beans
0,25
1,81
Sunflower
0,3
0,8
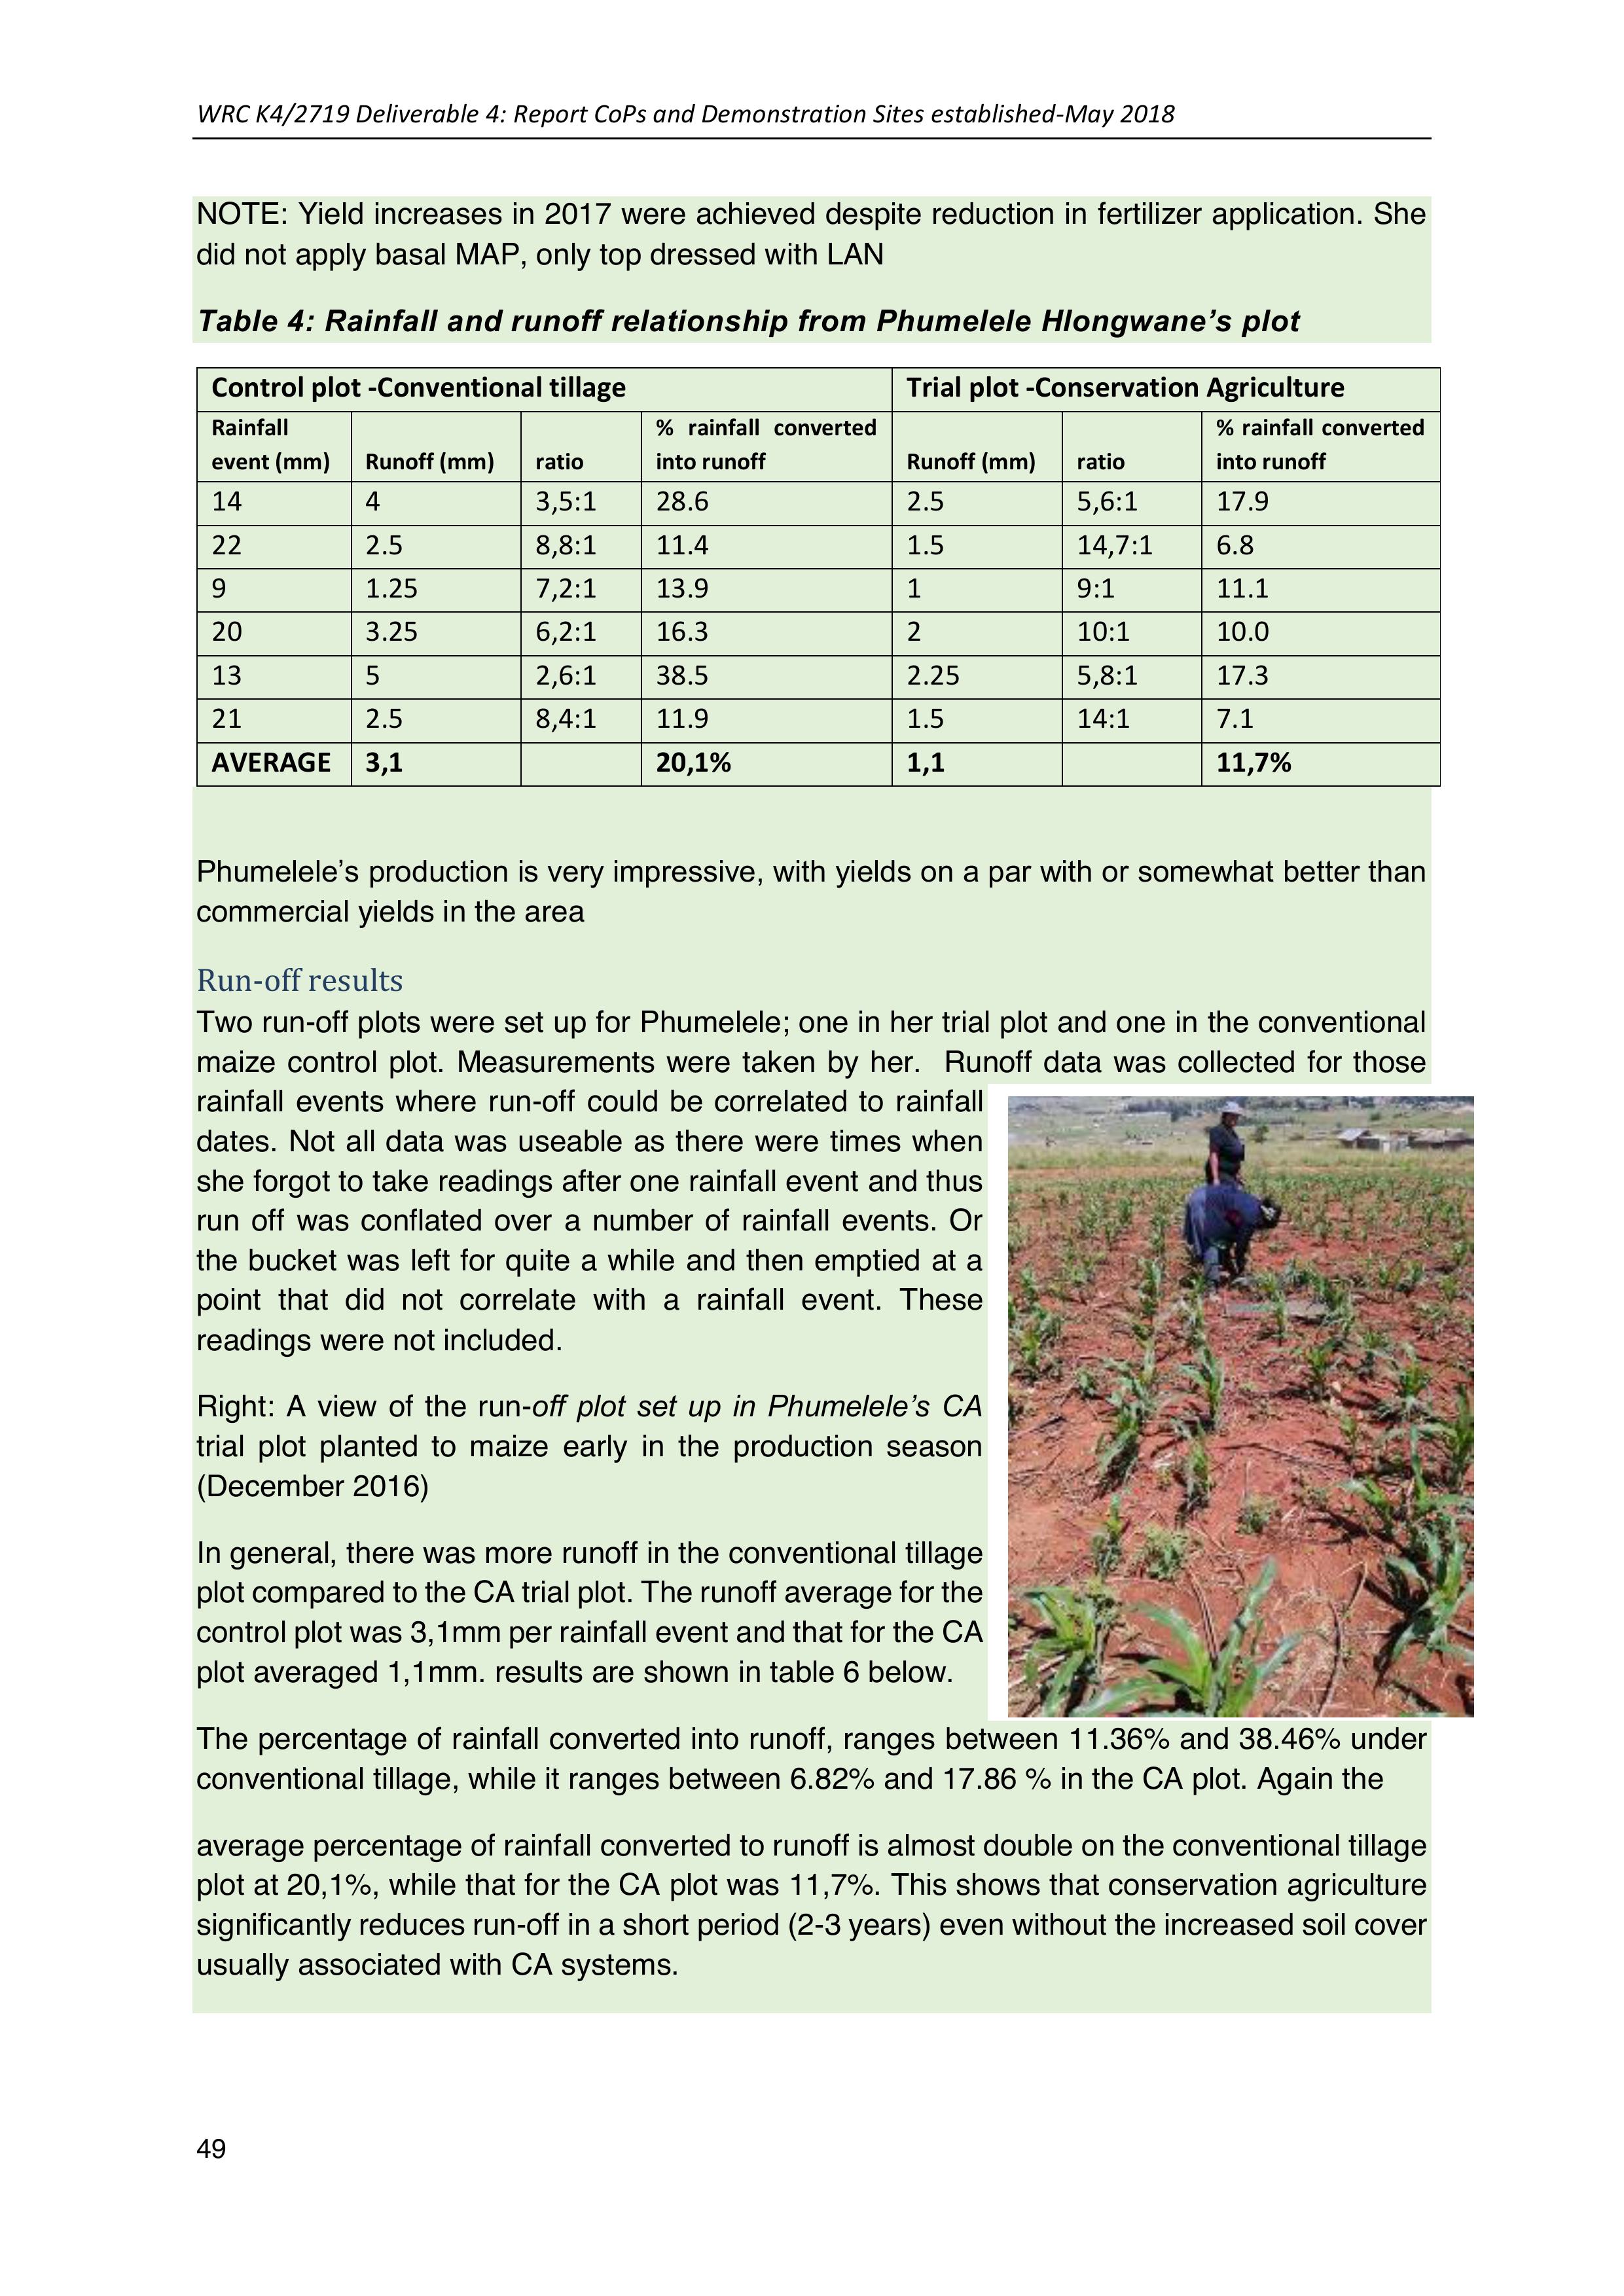
WRC K4/2719 Deliverable 4: Report CoPs and Demonstration Sites established-May 2018
49
NOTE: Yield increases in 2017 were achieved despite reduction in fertilizer application. She
did not apply basal MAP, only top dressed with LAN
Table 4:Rainfallandrunoffrelationship fromPhumeleleHlongwane’splot
Phumelele’s production is very impressive, with yields on a par with or somewhat better than
commercial yields in the area
Run-off results
Two run-off plots were set up for Phumelele; one in her trial plot and one in the conventional
maize control plot. Measurementswere taken by her. Runoff data was collected for those
rainfall events where run-off could be correlated to rainfall
dates. Not all data was useable as there were times when
she forgot to take readings after one rainfall event and thus
run off wasconflated over a number of rainfall events. Or
the bucket was left for quite a while and then emptied at a
point that did not correlate with a rainfall event.These
readings were not included.
Right: A view of the run-off plot set up in Phumelele’s CA
trial plot planted to maize early in the production season
(December 2016)
In general, there was more runoff in the conventional tillage
plot compared to the CA trial plot. The runoff average for the
control plot was 3,1mm per rainfall event and that for the CA
plot averaged 1,1mm. results are shown in table 6 below.
The percentage of rainfall converted into runoff, rangesbetween 11.36% and 38.46% under
conventional tillage, while it ranges between 6.82% and 17.86 % in the CA plot. Again the
average percentage of rainfall converted to runoff is almost double on the conventional tillage
plot at 20,1%, while that for the CA plot was 11,7%. This shows that conservation agriculture
significantly reduces run-off in a short period (2-3 years) even without the increased soil cover
usually associated with CA systems.
Control plot -Conventional tillage
Trial plot -Conservation Agriculture
Rainfall
event (mm)
Runoff (mm)
ratio
% rainfall converted
into runoff
Runoff (mm)
ratio
% rainfall converted
into runoff
14
4
3,5:1
28.6
2.5
5,6:1
17.9
22
2.5
8,8:1
11.4
1.5
14,7:1
6.8
9
1.25
7,2:1
13.9
1
9:1
11.1
20
3.25
6,2:1
16.3
2
10:1
10.0
13
5
2,6:1
38.5
2.25
5,8:1
17.3
21
2.5
8,4:1
11.9
1.5
14:1
7.1
AVERAGE
3,1
20,1%
1,1
11,7%
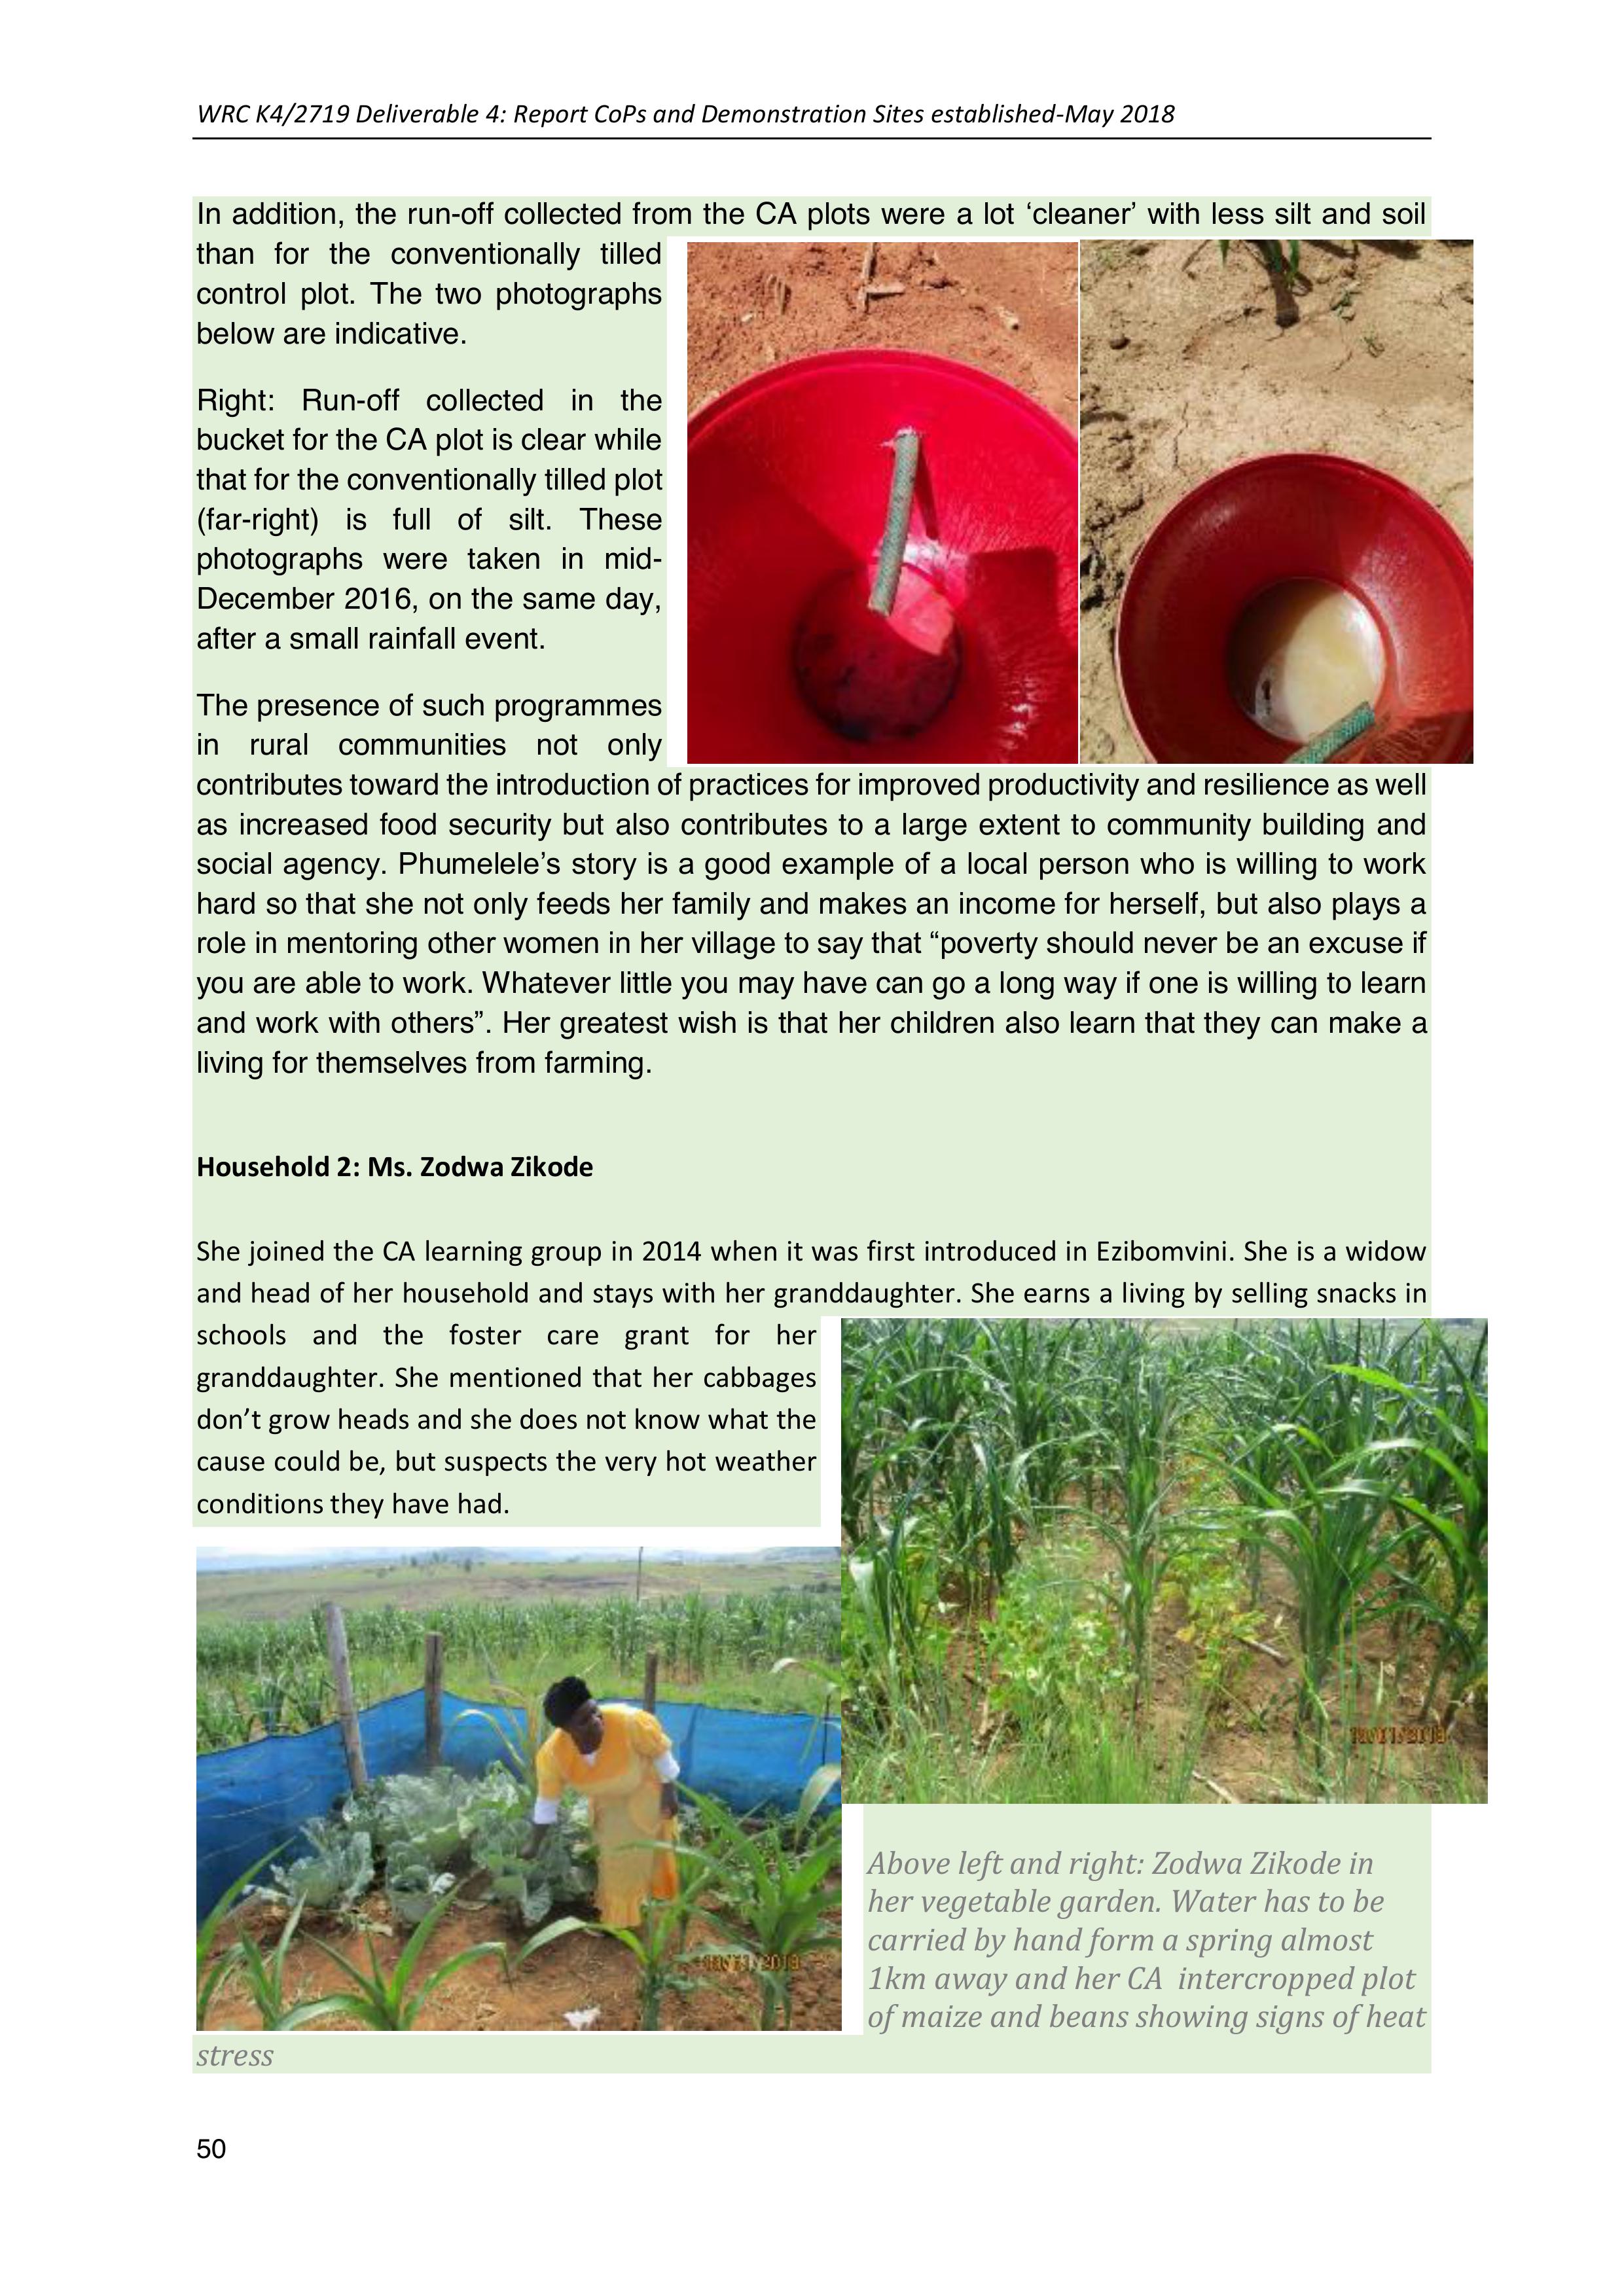
WRC K4/2719 Deliverable 4: Report CoPs and Demonstration Sites established-May 2018
50
In addition, the run-off collected from the CA plots were a lot ‘cleaner’ with lesssilt and soil
than for the conventionally tilled
control plot. The two photographs
below are indicative.
Right: Run-offcollected in the
bucket for the CA plot is clear while
that for the conventionally tilled plot
(far-right) is full of silt. These
photographs were taken in mid-
December 2016, on the same day,
after a small rainfall event.
The presence of such programmes
in rural communities not only
contributes toward the introduction of practices for improved productivity and resilience as well
as increased food security but also contributes to a large extent to community building and
social agency. Phumelele’s story is a good example of a localperson who is willing to work
hard so that she not only feeds her family and makes an income for herself, but also plays a
role in mentoring other women in her village to say that “poverty should never be an excuse if
you are able to work. Whatever little you may have can go a long way if one is willing to learn
and work with others”. Her greatest wish is that her children also learn that they can make a
living for themselves from farming.
Household 2: Ms. Zodwa Zikode
She joined the CA learning group in 2014 when it was first introduced in Ezibomvini. She is a widow
and head of her household and stays with her granddaughter. She earns a living by selling snacks in
schools and the foster care grant for her
granddaughter. She mentioned that her cabbages
don’t grow heads andshe does not know what the
cause could be, but suspects the very hot weather
conditions they have had.
Above left and right: Zodwa Zikode in
her vegetable garden. Water has to be
carried by hand form a spring almost
1km away and her CA intercropped plot
of maize and beans showing signs of heat
stress
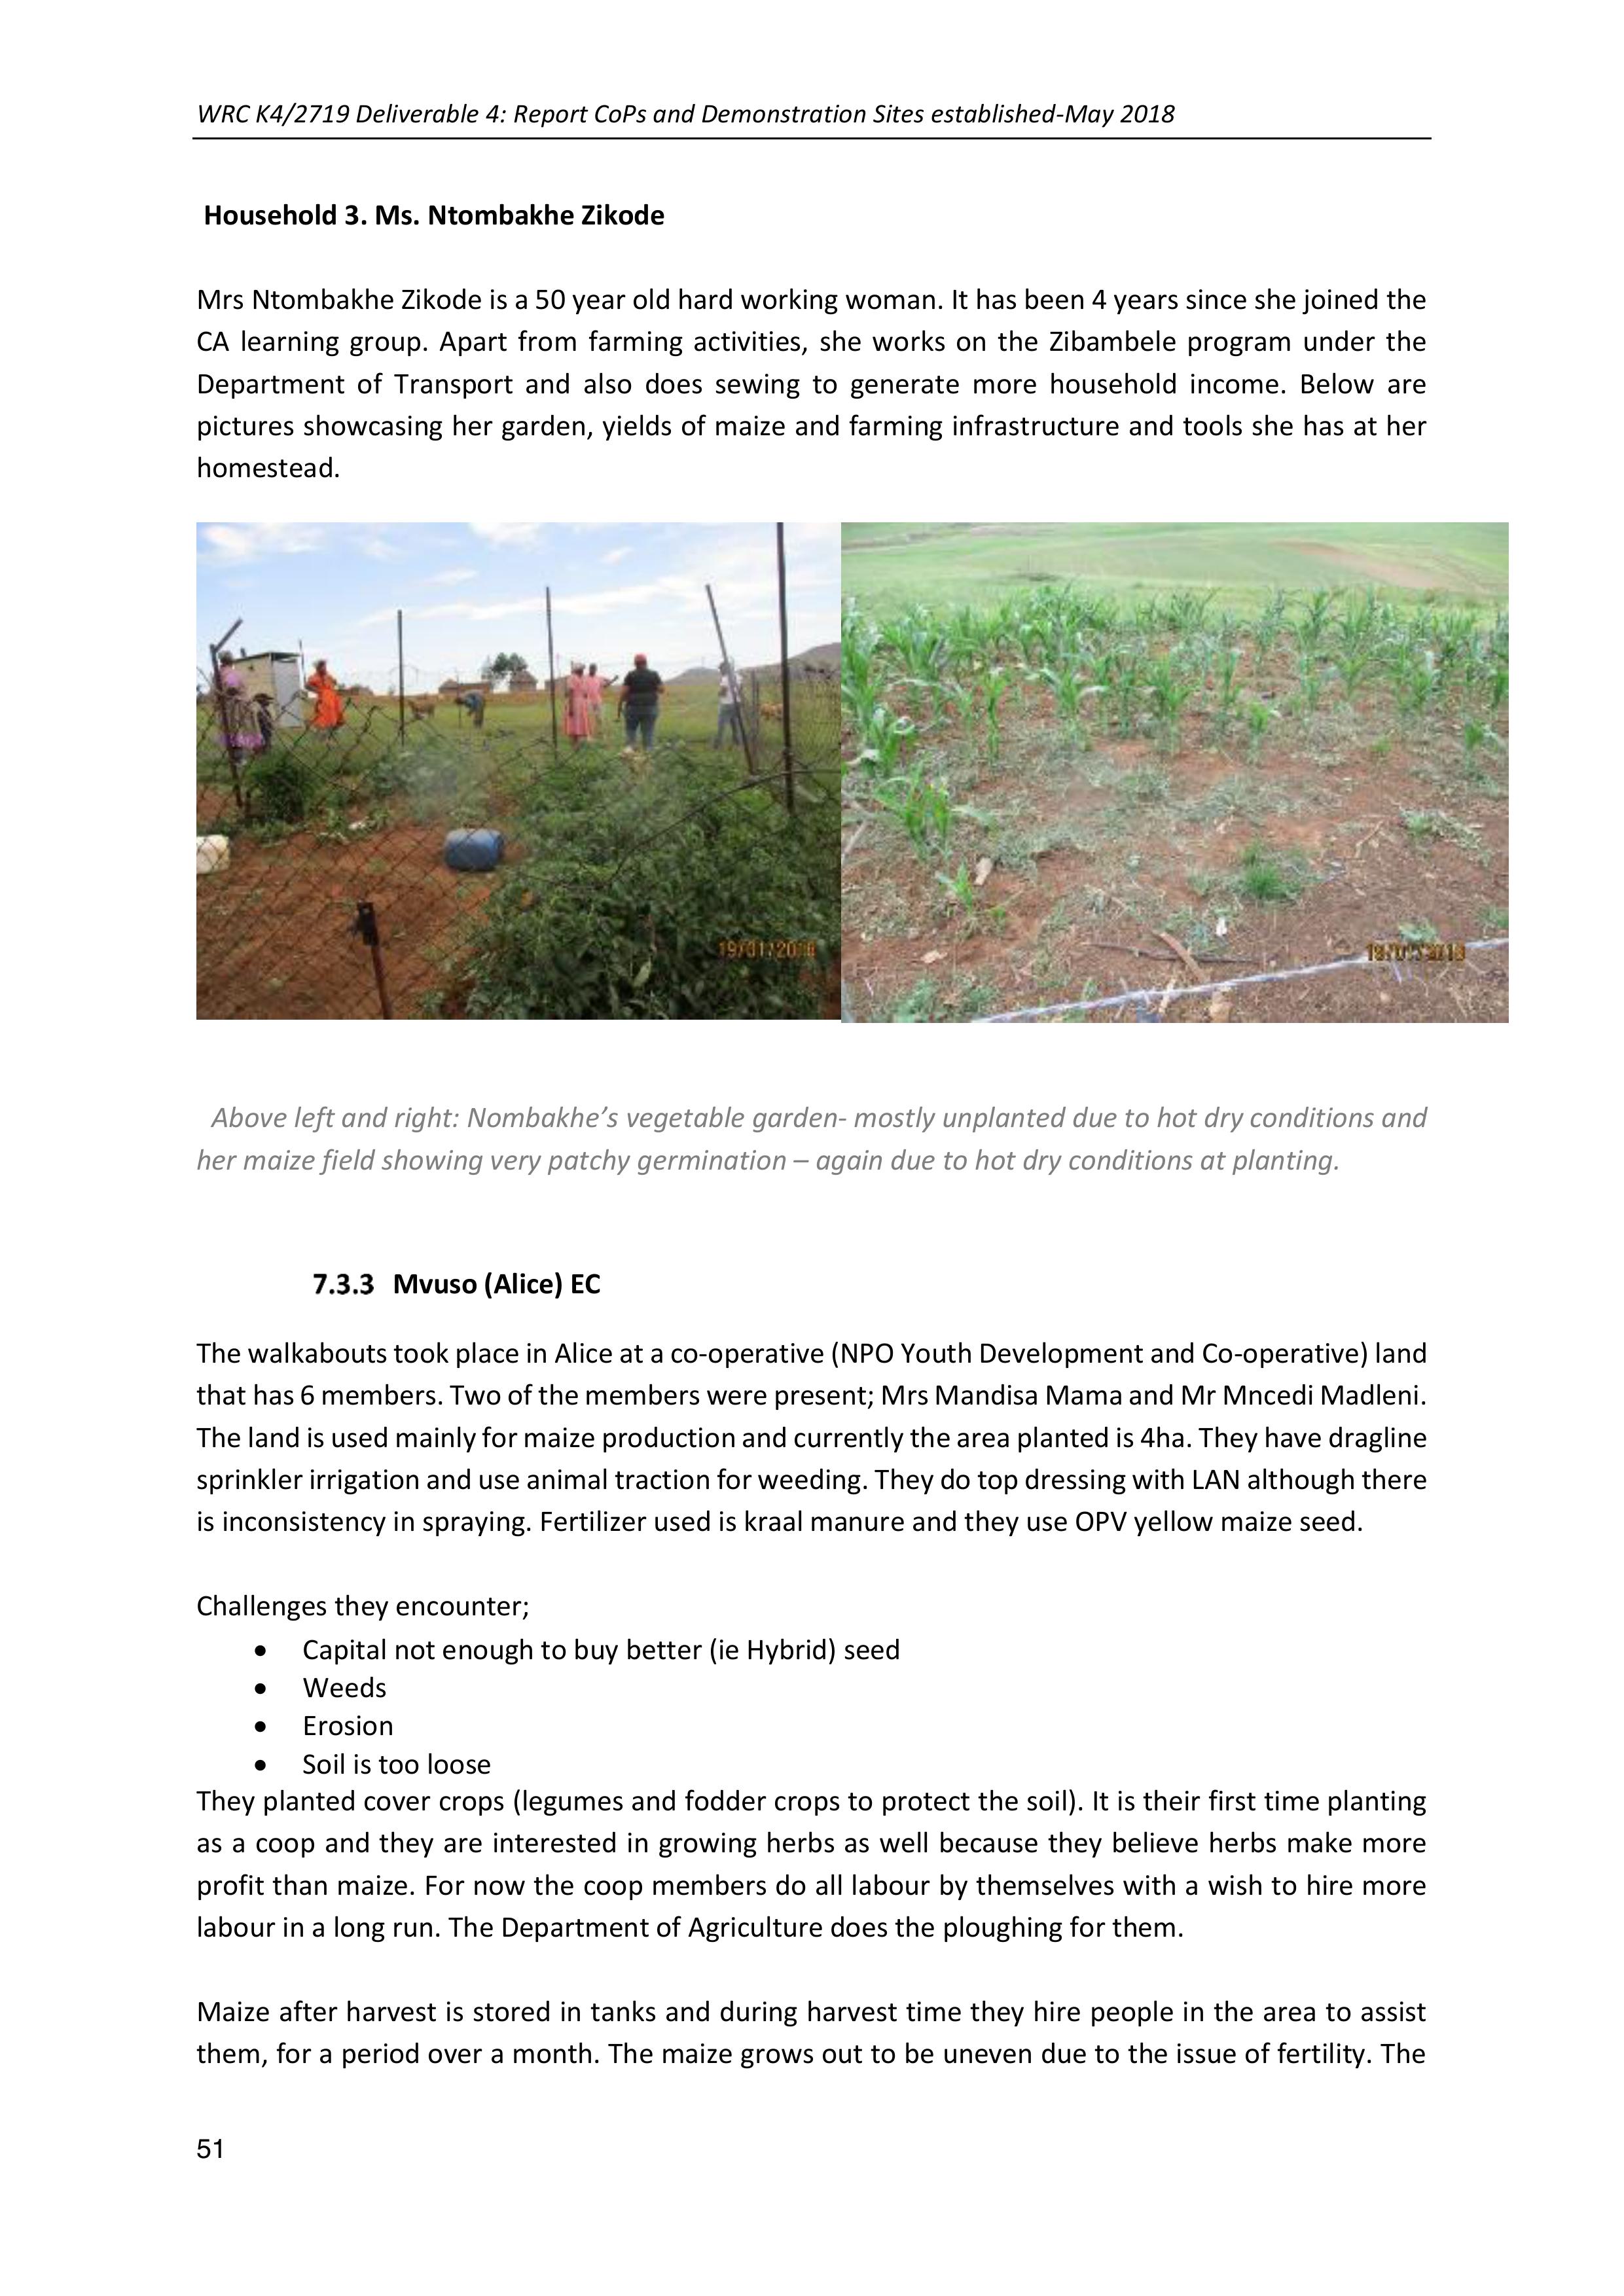
WRC K4/2719 Deliverable 4: Report CoPs and Demonstration Sites established-May 2018
51
Household 3. Ms. Ntombakhe Zikode
Mrs Ntombakhe Zikode is a 50 year old hard working woman. It has been 4 years since she joined the
CA learning group. Apart from farming activities, she works on the Zibambele program under the
Department of Transportand also does sewing to generate more household income. Below are
pictures showcasing her garden, yields of maize and farming infrastructure and tools she has at her
homestead.
Above left and right: Nombakhe’s vegetable garden- mostly unplanted due to hot dry conditions and
her maize field showing very patchy germination – again due to hot dry conditions at planting.
Mvuso (Alice) EC
The walkabouts took place in Alice at a co-operative (NPO Youth Development and Co-operative) land
that has 6 members. Two of themembers were present; Mrs Mandisa Mama and Mr Mncedi Madleni.
The land is used mainly for maize production and currently the area planted is 4ha. They have dragline
sprinkler irrigation and use animal traction for weeding. They do top dressing with LAN although there
is inconsistency in spraying. Fertilizer used is kraal manure and they use OPV yellow maize seed.
Challenges they encounter;
•Capital not enough to buy better (ie Hybrid) seed
•Weeds
•Erosion
•Soil is too loose
They planted cover crops (legumes and fodder crops to protect the soil). It is their first time planting
asa coop and they are interested in growing herbs as well because they believe herbs make more
profit than maize. For now the coop members do all labour by themselves with a wish to hire more
labour in a long run. The Department of Agriculture does the ploughing for them.
Maize after harvest is stored in tanks and during harvest time they hire people in the area to assist
them, for a period over a month. The maize grows out to be uneven due to the issue of fertility. The

WRC K4/2719 Deliverable 4: Report CoPs and Demonstration Sites established-May 2018
52
planted area is affected by erosion – soil being deposited on grassed water way, soil losing nutrients,
depth of soil decreases over time which results in decreased in production. The germination was not
so good due to high temperatures. Stover sold for silage - this is done for economic benefit. They
rotate the maize with herbs and cabbage.
The farmers were advised todo furrow irrigation to evenly distribute water and allow for the use of
rain water.
Above left and right: The irrigated maize plots for the cooperative members. Uneven germination and
yellowing is visible –onedue to high temperatures at planting and the other due to run-off and soil
loss.
Each one of these walkabouts have through discussion, generated ideas for CSA practices that would
be useful at that site. These are then presented to the focus group for discussion and combined with
other suggested practices, including local or traditional practices noticed for prioritization by the
participants.
For futureuse, a form has been designed for summarising information from the walkabouts- See
appendix 5
8COMMUNITY LEVEL PRIORITIZATION OF PRACTICES FOR
EXPERIMENTATION
This exercise concludes the 2nd day of the first Climate Change dialogue workshop at community
level and provides for an action plan and some initial farmer experimentation ideas. This is then
be followed up by a 2nd workshop session where more in-depth prioritization is done and each
individual in the group chooses a basket of CSA practices to work with.
The table below outlines the practices mentioned by each group, those introduced by the
facilitation team as options (in red) and also those prioritized for experimentation by members of
that learning group (community of practice)
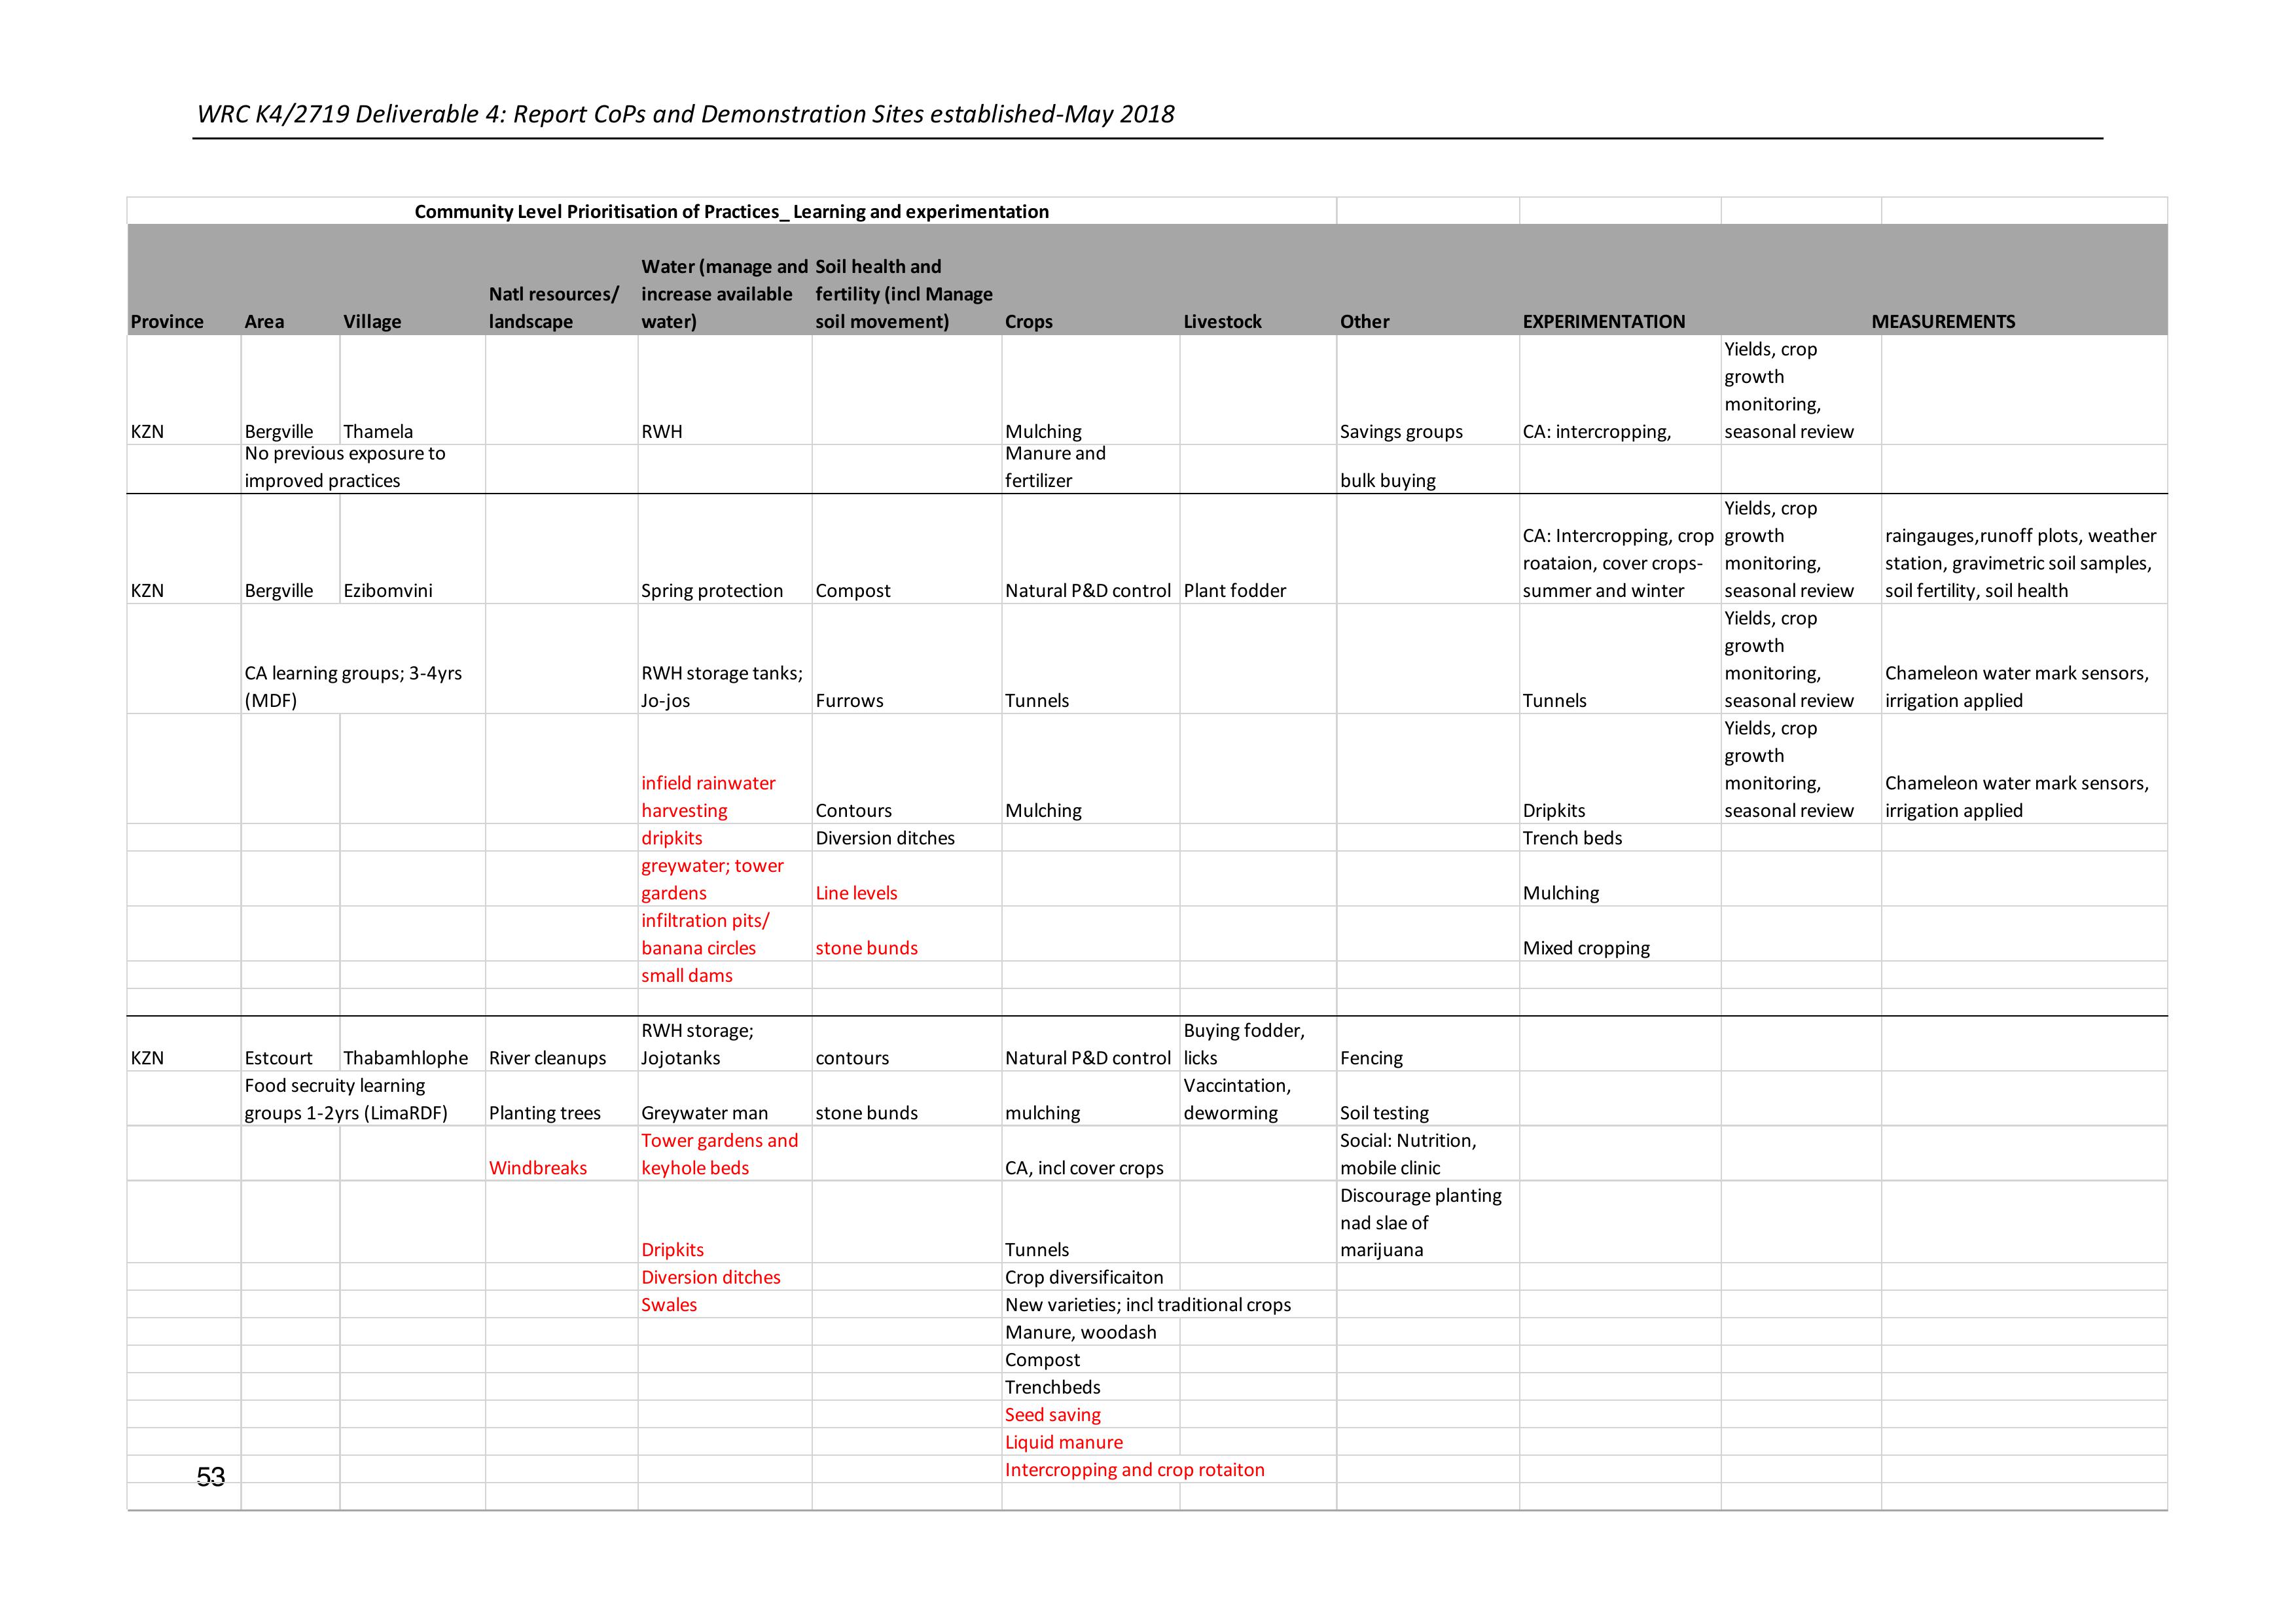
WRC K4/2719 Deliverable 4: Report CoPs and Demonstration Sites established-May 2018
53
Province AreaVillage
Natl resources/
landscape
Water (manage and
increase available
water)
Soil health and
fertility (incl Manage
soil movement)
CropsLivestock OtherEXPERIMENTATION
KZN Bergville
ThamelaRWHMulchingSavings groupsCA: intercropping,
Yields, crop
growth
monitoring,
seasonal review
Manure and
fertilizerbulk buying
KZNBergvilleEzibomviniSpring protectionCompostNatural P&D controlPlant fodder
CA: Intercropping, crop
roataion, cover crops-
summer and winter
Yields, crop
growth
monitoring,
seasonal review
raingauges,runoff plots, weather
station, gravimetric soil samples,
soil fertility, soil health
RWH storage tanks;
Jo-jos
Furrows Tunnels
Tunnels
Yields, crop
growth
monitoring,
seasonal review
Chameleon water mark sensors,
irrigation applied
infield rainwater
harvesting
Contours Mulching
Dripkits
Yields, crop
growth
monitoring,
seasonal review
Chameleon water mark sensors,
irrigation applied
dripkitsDiversion ditches
Trench beds
greywater; tower
gardens
Line levels
Mulching
infiltration pits/
banana circles
stone bunds
Mixed cropping
small dams
KZNEstcourtThabamhlopheRiver cleanups
RWH storage;
Jojotanks
contoursNatural P&D control
Buying fodder,
licks
Fencing
Planting treesGreywater manstone bundsmulching
Vaccintation,
deworming
Soil testing
Windbreaks
Tower gardens and
keyhole beds
CA, incl cover crops
Social: Nutrition,
mobile clinic
Dripkits Tunnels
Discourage planting
nad slae of
marijuana
Diversion ditchesCrop diversificaiton
SwalesNew varieties; incl traditional crops
Manure, woodash
Compost
Trenchbeds
Seed saving
Liquid manure
Intercropping and crop rotaiton
Community Level Prioritisation of Practices_ Learning and experimentation
No previous exposure to
improved practices
CA learning groups; 3-4yrs
(MDF)
Food secruity learning
groups 1-2yrs (LimaRDF)
MEASUREMENTS

WRC K4/2719 Deliverable 4: Report CoPs and Demonstration Sites established-May 2018
54
Province AreaVillage
Natl resources/
landscape
Water (manage and
increase available
water)
Soil health and
fertility (incl Manage
soil movement)
CropsLivestock OtherEXPERIMENTATION
EC ALICE UBLN
Remove aliensRWH storageFurrows and ridgesTrenchbeds
Conserve fodder
(hay)
Value
addition(cooking and
preservaiton
Plant vetiverDripkits
Multipurpose plants
incl flowers
Decrease stock
nos
Crop diversity for
nutrition
Intercropping nad
crop rotation
Vaccination
Mulch
Drought resistant
crops
Natural P&D control
CA
LIMPOPOTzaneen Sekororo
Plant treesRWH storageFurrows and ridgesMulchingCotrolled grazingEntrepreneurship
Manage cutting
of trees
Grey water man:
towergardens and
keyhole beds
Intercropping and
rop rotation
Decrease stock
nos
Job creation
earth damsNatural P&D controlSave fodder (hay)Savings groups
diversion ditches
Multipurpose
plants, incl flowers
Growing fodder
for livestock
biogas digesters
Undergounrd RWH
storage
Tunnels
Planting calendars -
winter( for bolting)
Dripkits
Heat resistant
cultivars
Indigenous varieties
Liquid manure
Trench beds
Eco-circles
Herbs
CA
Shallow trenches
Seed saving
MEASUREMENTS
A4F lerning network 2-3yrs

WRC K4/2719 Deliverable 4: Report CoPs and Demonstration Sites established-May 2018
55
Province AreaVillage
Natl resources/
landscape
Water (manage and
increase available
water)
Soil health and
fertility (incl Manage
soil movement)
CropsLivestock OtherEXPERIMENTATION
LIMPOPO Mametje
Turkey (Sedawa
Ext)
Plant trees
More boreholes and
dams
Furrows and ridgesTunnels
Plant fodder for
livestock
Rather use electricity
than firewood
CA: Intercropping, crop
roataion, cover crops-
summer and winter
Yields, crop
growth
monitoring,
seasonal review
raingauges,runoff plots, weather
station, gravimetric soil samples,
soil fertility, soil health
Manage cutting
of trees
Greywater
management
Stone bundsTrenchbeds
Save stover for
fodder
NGOs and Govt to
assist
Tunnels
Yields, crop
growth
monitoring,
Chameleon water mark sensors,
irrigation applied
Manage firesDrip irrigation
Use crop residues and
manre
MulchingBuy fodderDonations of seedDripkits
Yields, crop
growth
monitoring,
Chameleon water mark sensors,
irrigation applied
take care of
indigenous plants
Tower gardens and
keyhole beds
CA Access to healthcareTrenchbeds
Propagation of
trees
Household
gardening
techinques
Set up Coops for
Govt support
Mulching
Use animal tractionMixed cropping
MEASUREMENTS
No previous exposure to
improved practices

WRC K4/2719 Deliverable 4: Report CoPs and Demonstration Sites established-May 2018
56
For each village/group –a combined set of practicesto be introduced, both through learning and
mentoring and farmerexperimentation has been compiled from all the information in the group
sessions as well as the walkabouts.This is also negotiatedwith other stakeholders in each area and
includes organisation presently implementing a project/programme. This means that the climate
smart agricultural component can be overlaid onto existing rural development projects to increase
the depth and scope of these programme.
The table below summarises these practices for each of the 7 villages.
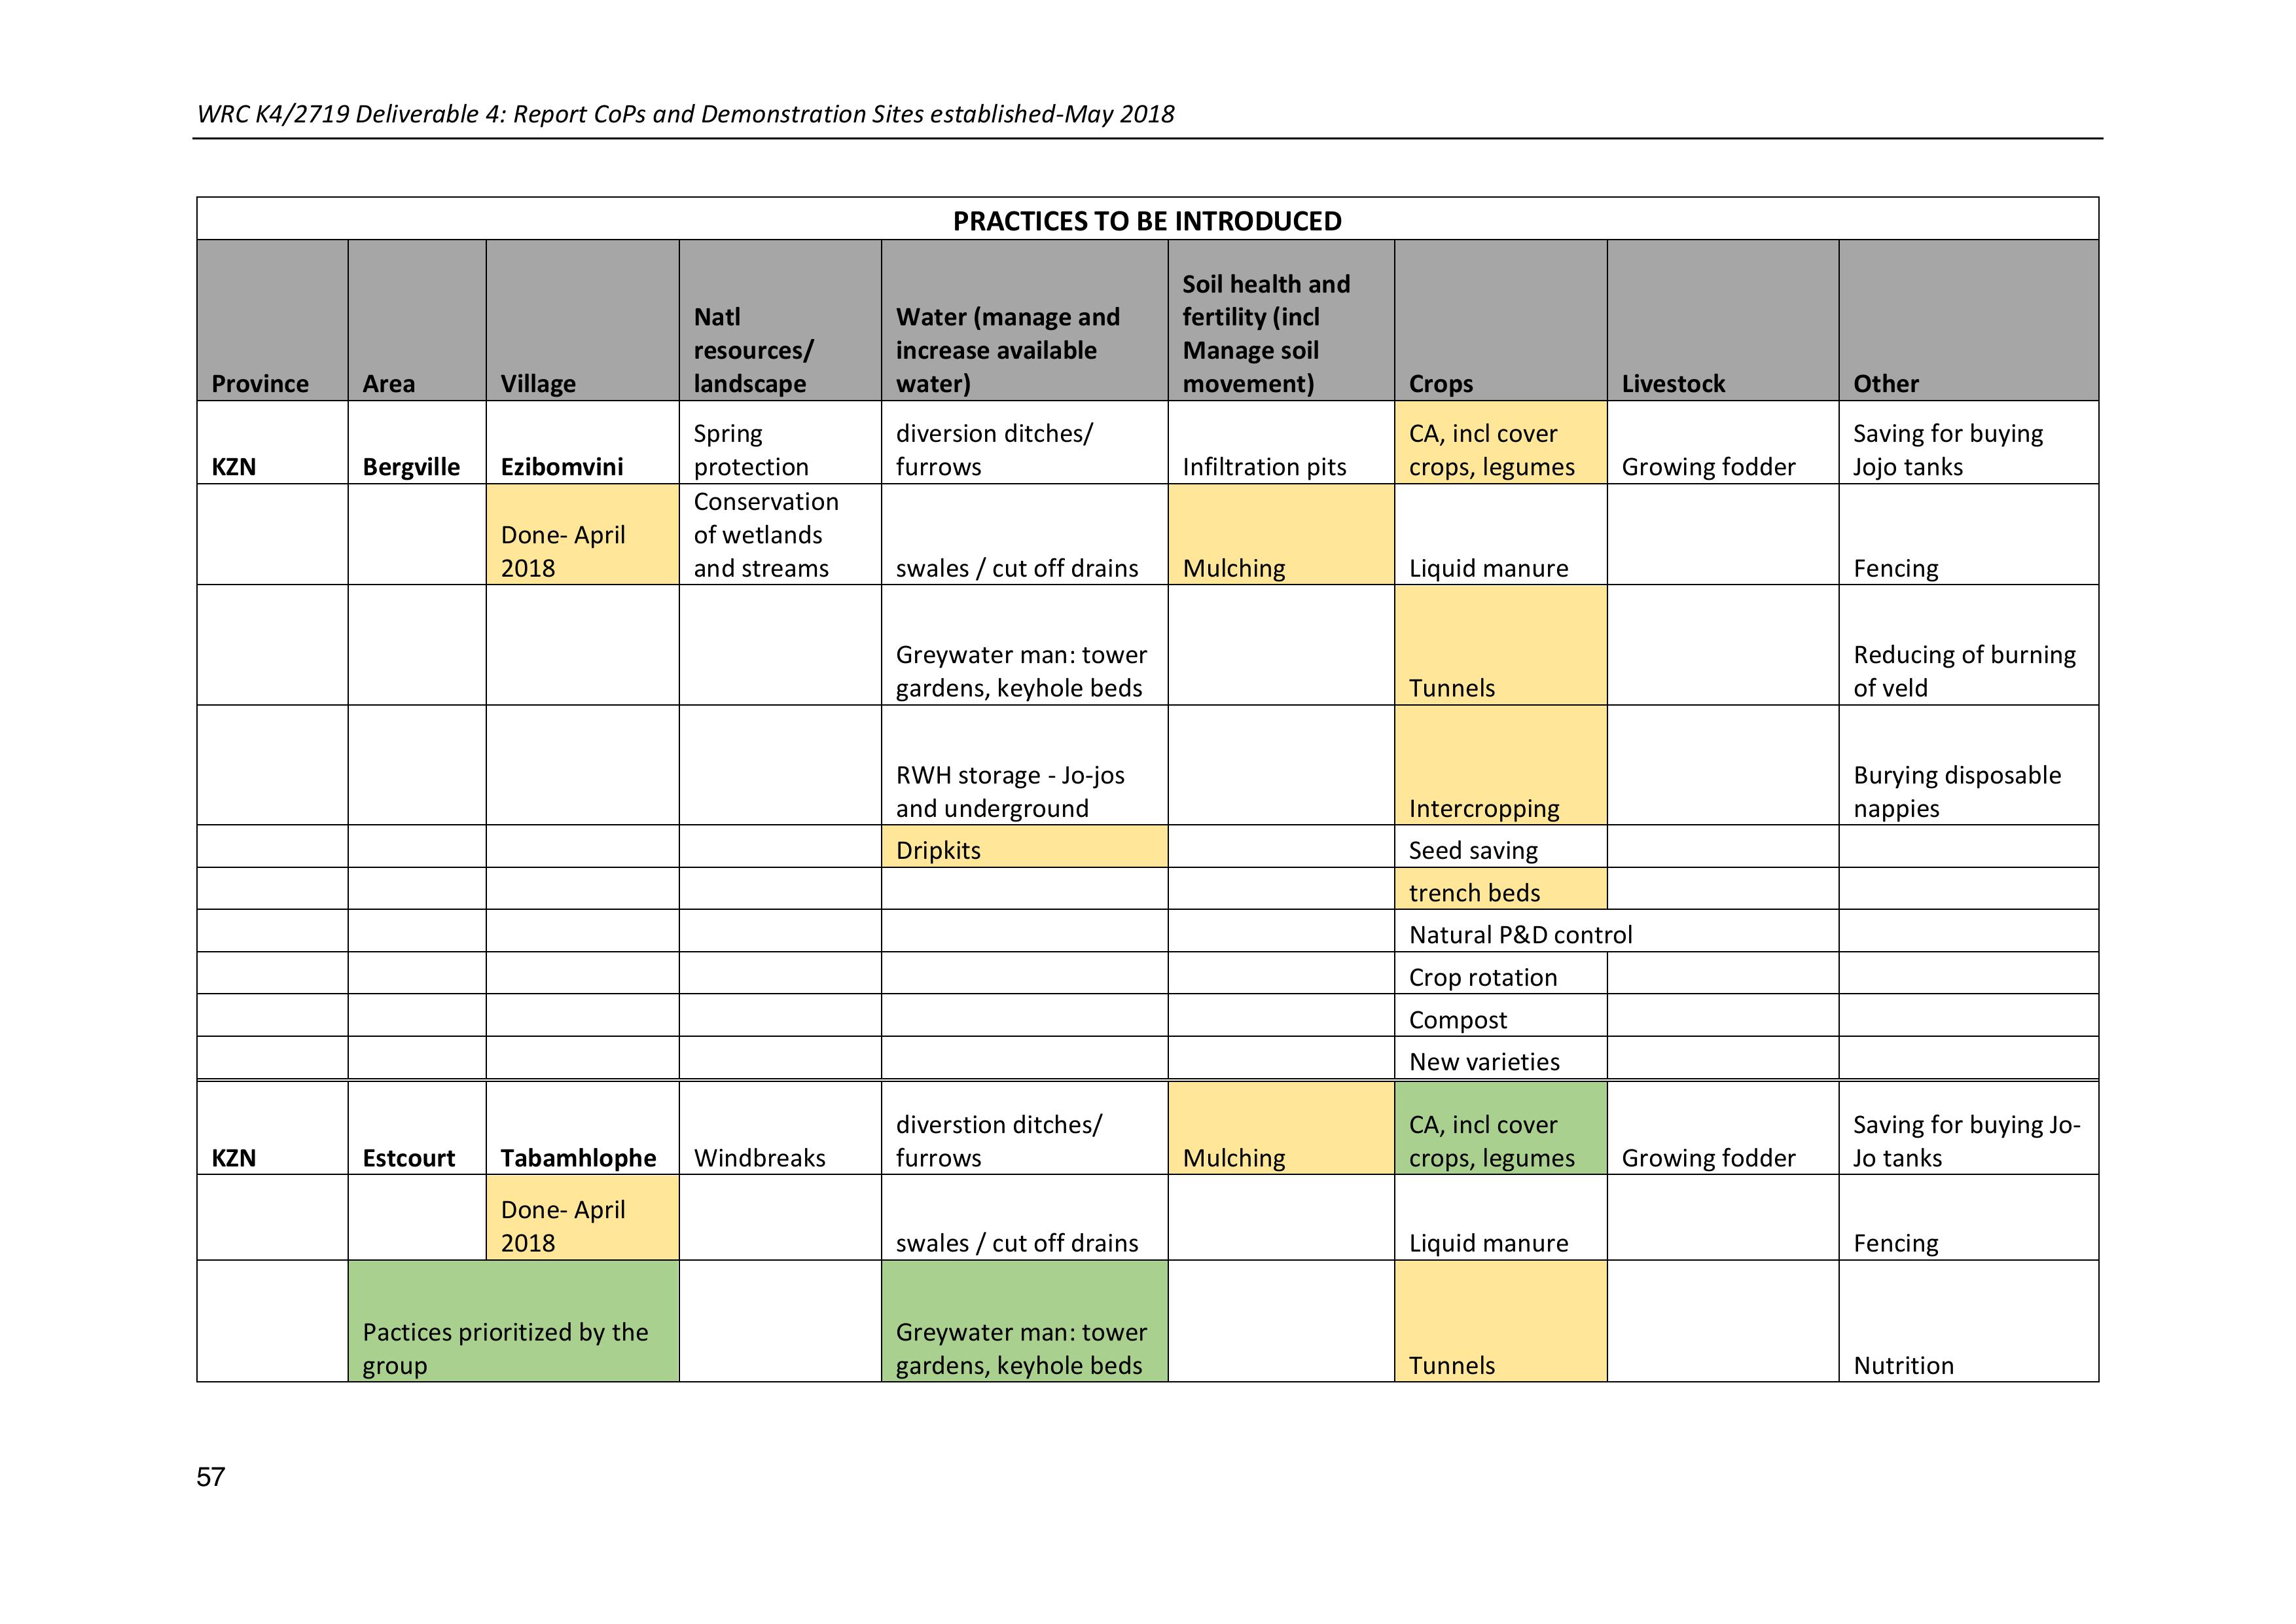
WRC K4/2719 Deliverable 4: Report CoPs and Demonstration Sites established-May 2018
57
PRACTICES TO BE INTRODUCED
Province
Area
Village
Natl
resources/
landscape
Water (manage and
increase available
water)
Soil health and
fertility (incl
Manage soil
movement)
Crops
Livestock
Other
KZN
Bergville
Ezibomvini
Spring
protection
diversion ditches/
furrows
Infiltration pits
CA, incl cover
crops, legumes
Growing fodder
Saving for buying
Jojo tanks
Done- April
2018
Conservation
of wetlands
and streams
swales / cut off drains
Mulching
Liquid manure
Fencing
Greywater man: tower
gardens, keyhole beds
Tunnels
Reducing of burning
of veld
RWH storage - Jo-jos
and underground
Intercropping
Burying disposable
nappies
Dripkits
Seed saving
trench beds
Natural P&D control
Crop rotation
Compost
New varieties
KZN
Estcourt
Tabamhlophe
Windbreaks
diverstion ditches/
furrows
Mulching
CA, incl cover
crops, legumes
Growing fodder
Saving for buying Jo-
Jo tanks
Done- April
2018
swales / cut off drains
Liquid manure
Fencing
Pactices prioritized by the
group
Greywater man: tower
gardens, keyhole beds
Tunnels
Nutrition
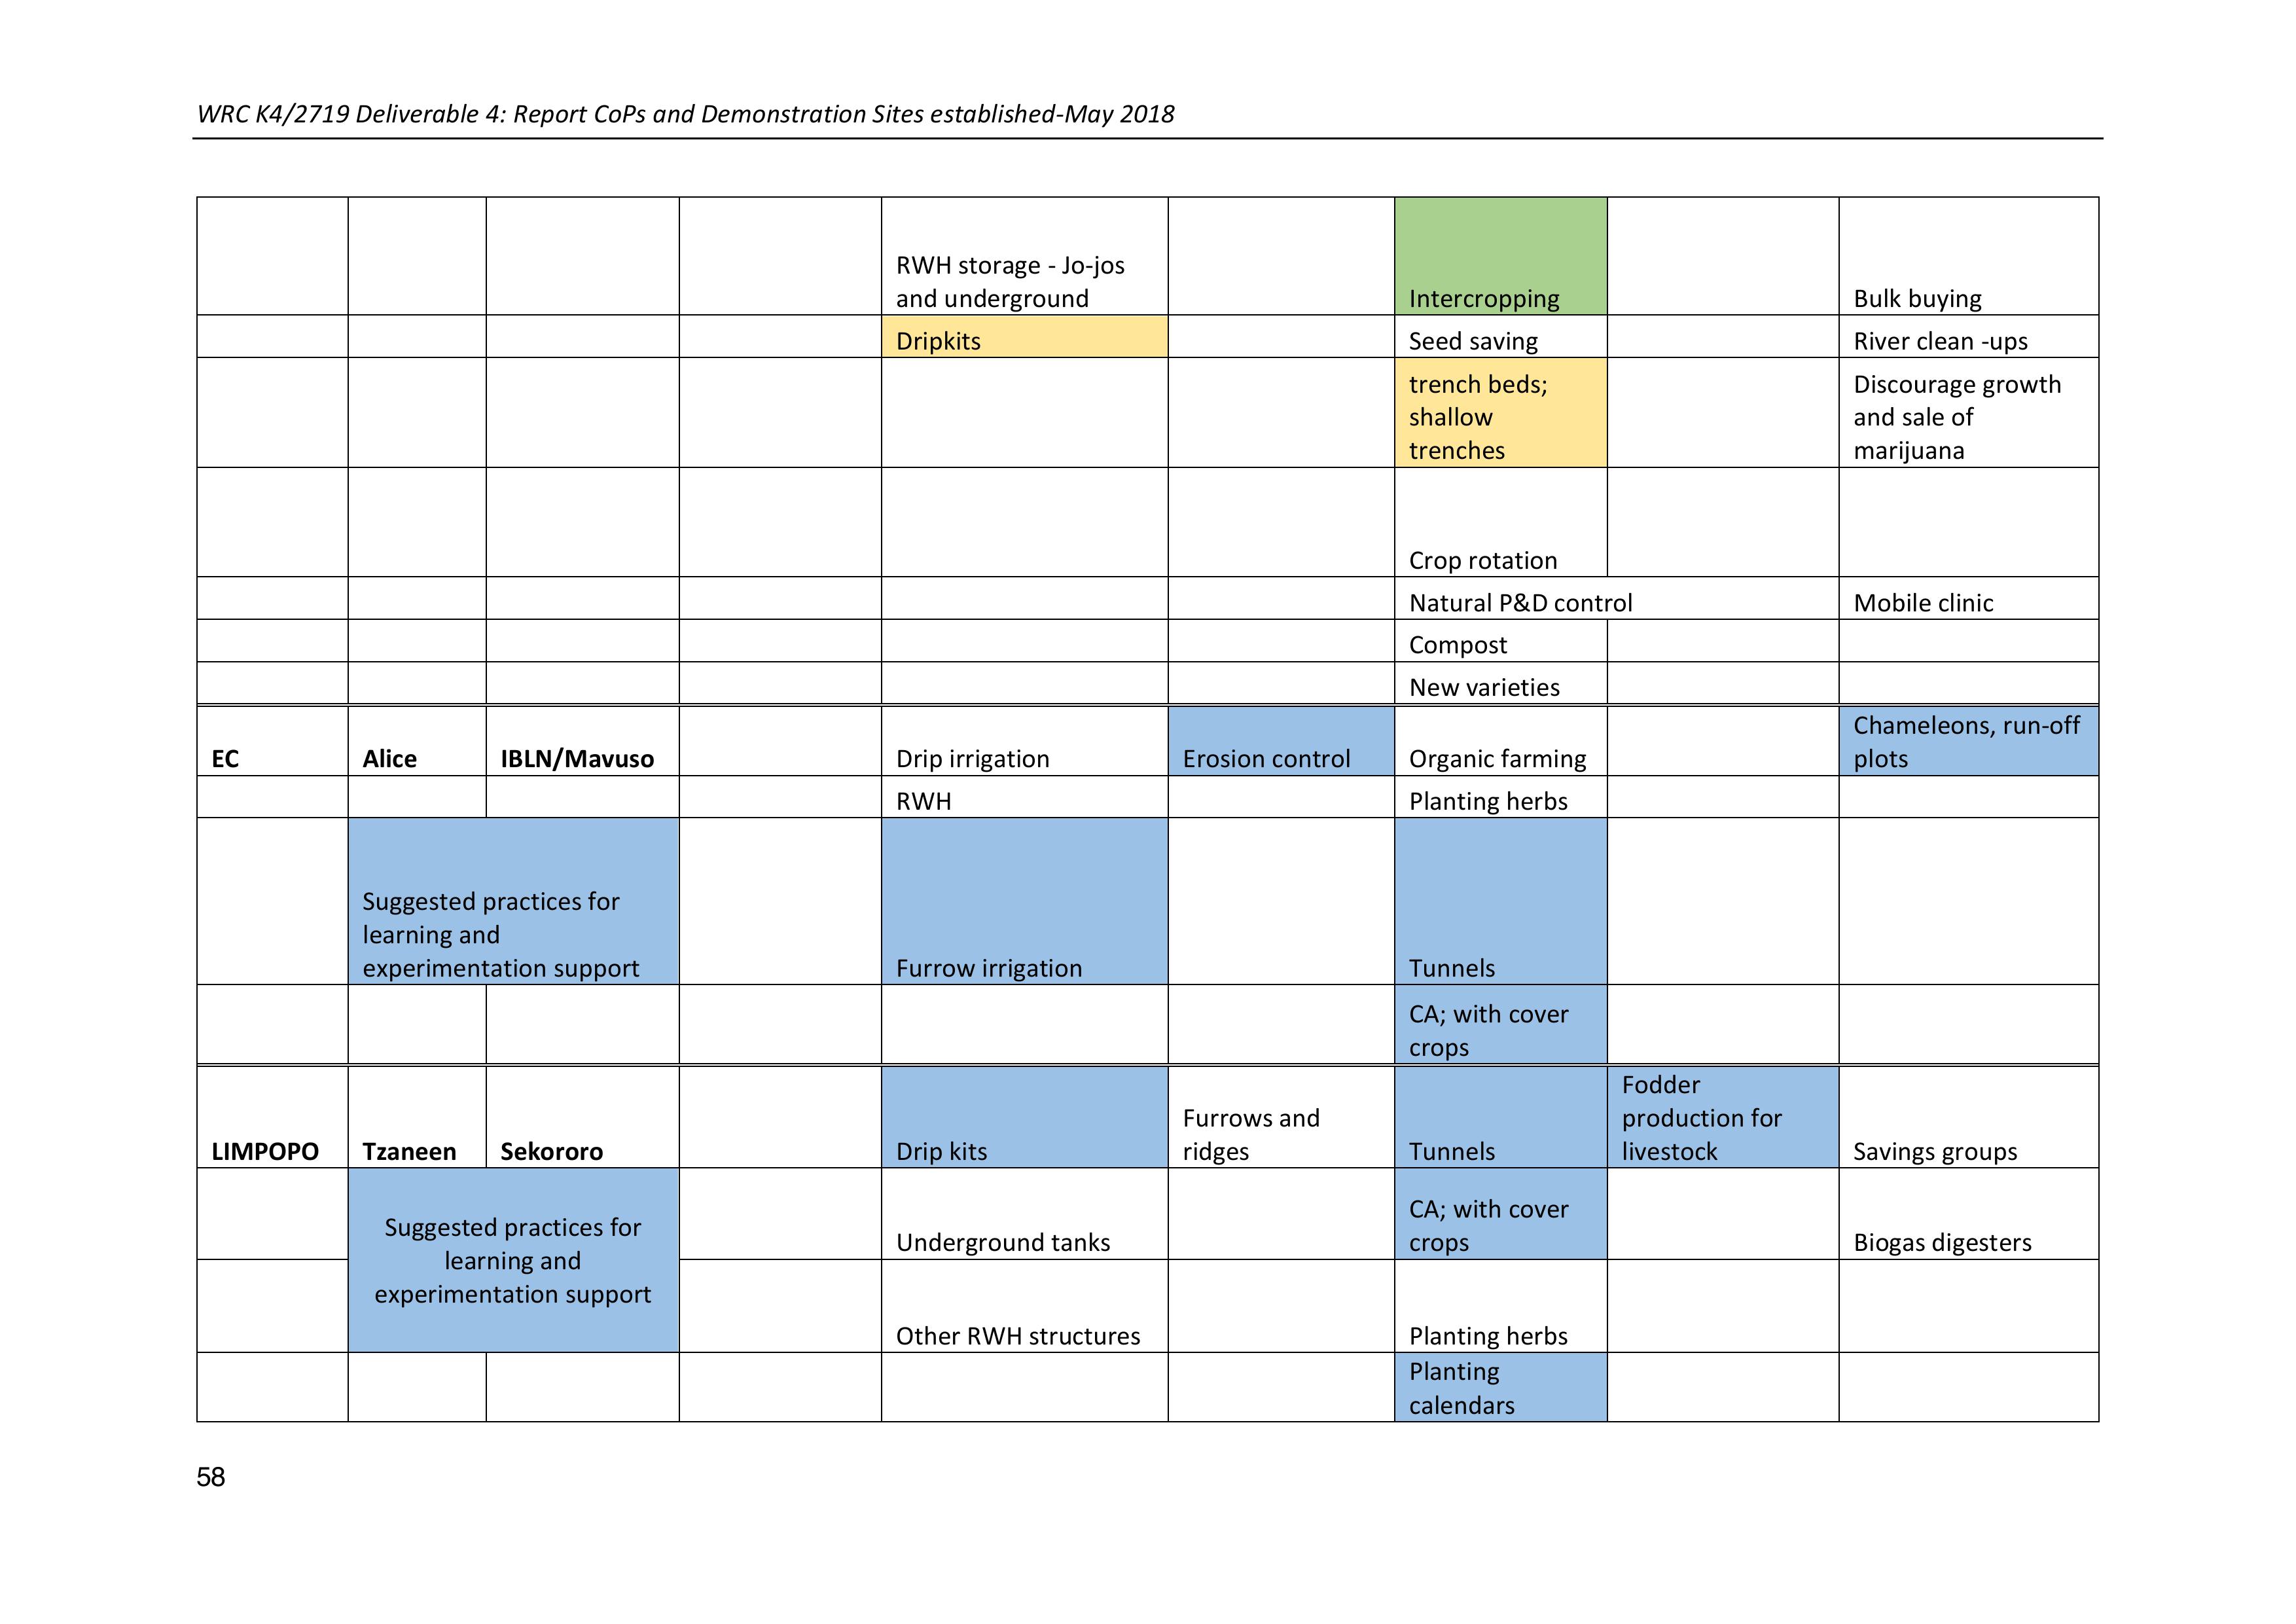
WRC K4/2719 Deliverable 4: Report CoPs and Demonstration Sites established-May 2018
58
RWH storage - Jo-jos
and underground
Intercropping
Bulk buying
Dripkits
Seed saving
River clean -ups
trench beds;
shallow
trenches
Discourage growth
and sale of
marijuana
Crop rotation
Natural P&D control
Mobile clinic
Compost
New varieties
EC
Alice
IBLN/Mavuso
Drip irrigation
Erosion control
Organic farming
Chameleons, run-off
plots
RWH
Planting herbs
Suggested practices for
learning and
experimentation support
Furrow irrigation
Tunnels
CA; with cover
crops
LIMPOPO
Tzaneen
Sekororo
Drip kits
Furrows and
ridges
Tunnels
Fodder
production for
livestock
Savings groups
Suggested practices for
learning and
experimentation support
Underground tanks
CA; with cover
crops
Biogas digesters
Other RWH structures
Planting herbs
Planting
calendars

WRC K4/2719 Deliverable 4: Report CoPs and Demonstration Sites established-May 2018
59
Shallow
trenches
Natural P&D
control
Seed saving
LIMPOPO
Mametje
Turkey
Drip kits
Furrows and
ridges
Tunnels
Fodder
production for
livestock
Suggested practices for
learning and
experimentation support
Infiltration pits
CA; with cover
crops
contours, wales,
diversion ditches
trench beds,
eco-circles,
shallow
trenched
Done- April
2018
Natural P&S
control
Liquid manure
Tower gardens
Soil fertility
management
Seed saving and
seedling
production
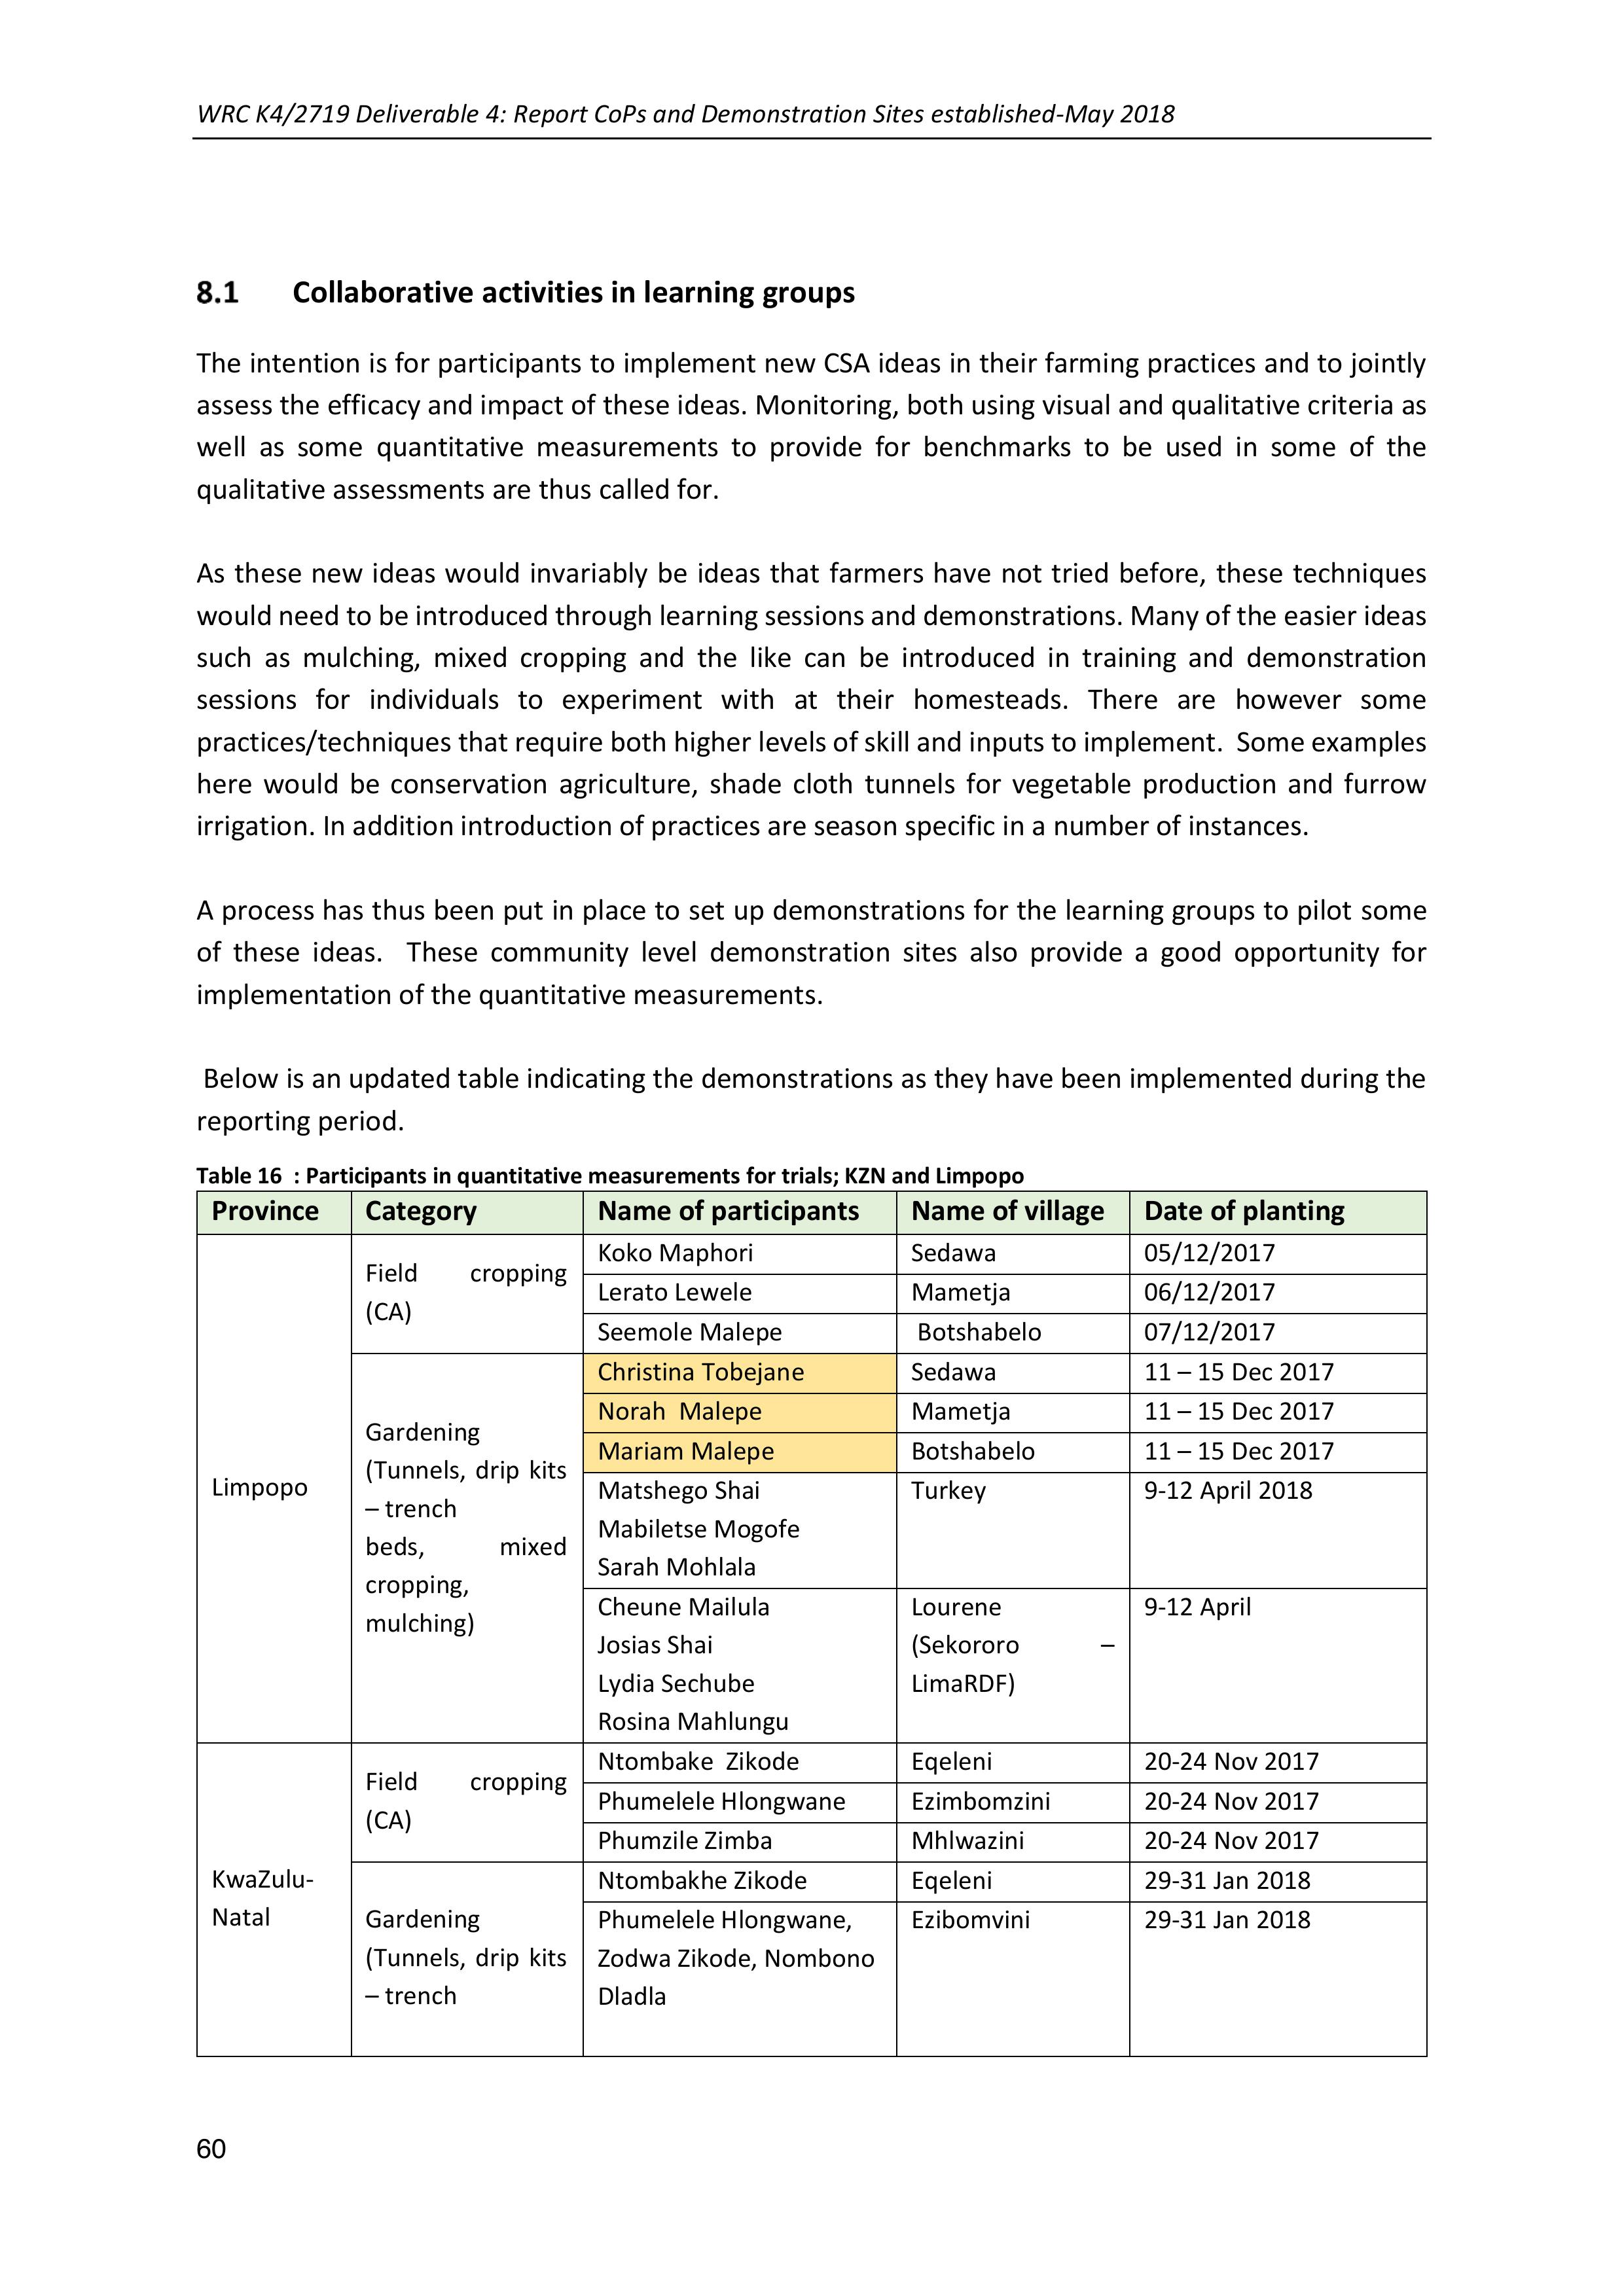
WRC K4/2719 Deliverable 4: Report CoPs and Demonstration Sites established-May 2018
60
Collaborative activities in learning groups
The intention is for participants to implement new CSA ideas in their farming practices and to jointly
assess the efficacy and impact of these ideas. Monitoring, both using visual and qualitative criteria as
well as some quantitative measurements to provide for benchmarks to be used insome of the
qualitative assessments are thus called for.
As these new ideas would invariably be ideas that farmers have not tried before, these techniques
would need to be introduced through learning sessions and demonstrations. Many of the easier ideas
such as mulching, mixed cropping and the like can be introduced in training and demonstration
sessions for individuals to experiment with at their homesteads. There are however some
practices/techniques that require both higher levels of skill and inputs to implement. Some examples
here would be conservation agriculture, shade cloth tunnels for vegetable production and furrow
irrigation. In addition introduction of practices are season specific in a number of instances.
A process has thus been put in place to setup demonstrations for the learning groups to pilotsome
of these ideas. These community level demonstration sites also provide a good opportunity for
implementation of the quantitative measurements.
Below is an updated table indicating the demonstrations as they have been implemented during the
reporting period.
Table 16: Participants in quantitative measurements for trials; KZN and Limpopo
Province
Category
Name of participants
Name of village
Date of planting
Limpopo
Field cropping
(CA)
Koko Maphori
Sedawa
05/12/2017
Lerato Lewele
Mametja
06/12/2017
Seemole Malepe
Botshabelo
07/12/2017
Gardening
(Tunnels, drip kits
– trench
beds, mixed
cropping,
mulching)
Christina Tobejane
Sedawa
11 – 15 Dec 2017
Norah Malepe
Mametja
11 – 15 Dec 2017
Mariam Malepe
Botshabelo
11 – 15 Dec 2017
Matshego Shai
Mabiletse Mogofe
Sarah Mohlala
Turkey
9-12 April 2018
Cheune Mailula
Josias Shai
Lydia Sechube
Rosina Mahlungu
Lourene
(Sekororo –
LimaRDF)
9-12 April
KwaZulu-
Natal
Field cropping
(CA)
Ntombake Zikode
Eqeleni
20-24 Nov 2017
Phumelele Hlongwane
Ezimbomzini
20-24 Nov 2017
Phumzile Zimba
Mhlwazini
20-24 Nov 2017
Gardening
(Tunnels, drip kits
– trench
Ntombakhe Zikode
Eqeleni
29-31 Jan 2018
Phumelele Hlongwane,
Zodwa Zikode, Nombono
Dladla
Ezibomvini
29-31 Jan 2018

WRC K4/2719 Deliverable 4: Report CoPs and Demonstration Sites established-May 2018
61
beds, mixed
cropping,
mulching)
Thembi Xaba, Zanele
Ngobese/Winnie
Dlamini, Gugu
Majola/Nokuthula Sibisi
Mdwebu –
Tabamhlophe
_LimaRDF
29-31 Jan 2018
To Ntuli (Uthando
LukaGogo Group)
Good Homes-
Tabamhlophe-
LimaRDF
29-31 Jan 2018
EC
Field cropping
(CA, furrow
irrigation
Ms Mandisa Mama and
Mr Mncedi Madleni
Xolisa Dwane
Siyabulela Gcungqami
Mavuso
Mxumbu
Mxumbu
Aug-Sept 2018
Gardening
Tunnels, drip kits
– trench
beds, mixed
cropping,
mulching)
Infiltration pits
Swales
Contours
Lingiswa Mangaliso
Xoliswa Mangcola
Xolisa Dwane
Siyabulela Gcungqami
Busisiwe Mgangxela
Bulelani Jantjie
Sibusiso Globinampku
Aviwe Biko
Abongile Mfecane
Nomasoma Njacu
Phindiwe Msesiwe
Alice
Healdtown
Mxumbu
Mxumbu
Mqayise
Mayipase
Ilizwi lamafama
Ilizwi lamafama
Ilizwi lamafama
Ilizwi lamafama
Ilizwi lamafama
End April 2018, Aug-
Sept 2018
Experimentation with vegetable production and tunnels
Criteria for selection of the participants who would implement these demonstrations, at their
homesteads, but with and for the groups were discussed with the learning group participants and the
following criteria were used:
•Should be likeable
•Should be a volunteer
•Should be home most of the time
•Must be an active gardener
•Must reside in the close proximity of a source of water
•The source of water should somewhat be reliable
•Must be good with people
•Must have a vision for the benefit of the group
•Willingness to make tunnels
Training sessions in building of the shade cloth tunnels were held in KZN (end Jan 2018) and Limpopo
(mid April 2018). The organisationSocio Technical Interfacing assisted with supply of the kits for the
tunnels and drip irrigation as well as providing the three- day training in construction. A total of 8
demonstration tunnels, with 3 sets of drip kits each have been built in each province.
A fewpictures are shown below indicative of the three- day process for each group. The report for the
Bergville tunnel construction process in included in Appendix 7.
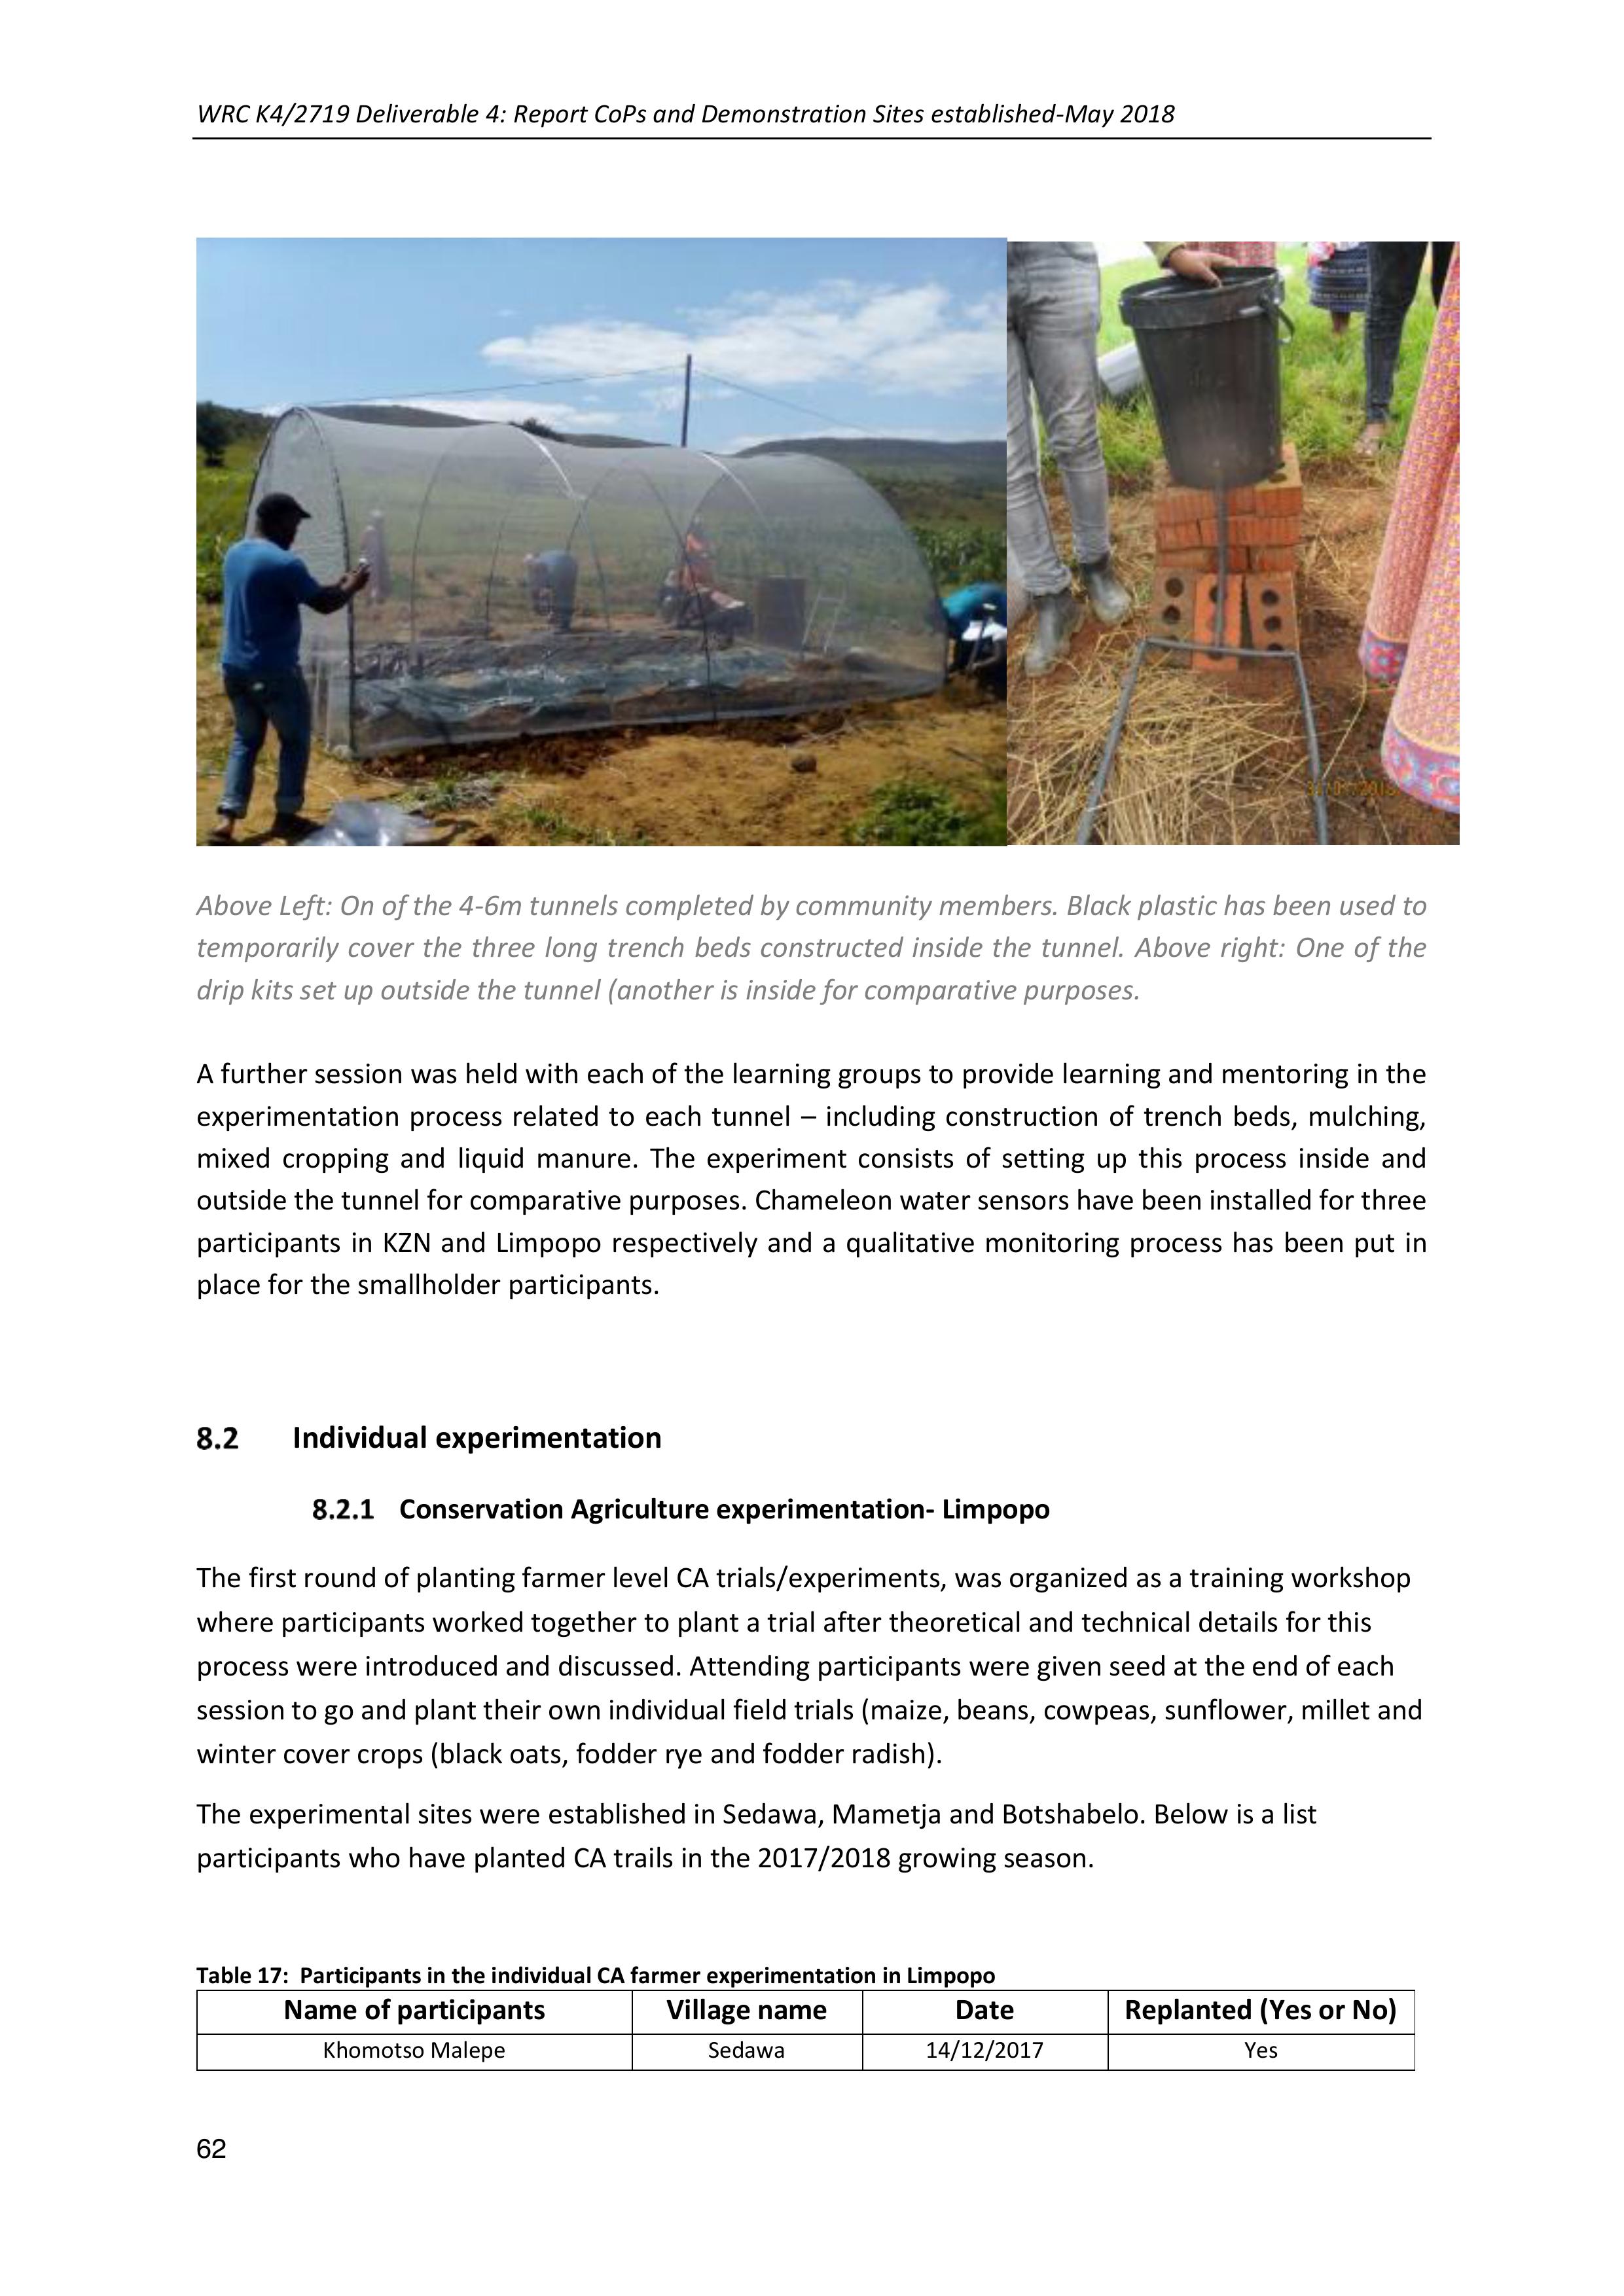
WRC K4/2719 Deliverable 4: Report CoPs and Demonstration Sites established-May 2018
62
Above Left: On of the 4-6m tunnels completed by community members. Black plastic has been used to
temporarily cover the three long trench beds constructed inside the tunnel. Above right: One of the
drip kits set up outside the tunnel (another is inside for comparative purposes.
A further session was held with each of the learning groups to provide learning and mentoring in the
experimentationprocess related to each tunnel –including constructionof trench beds, mulching,
mixed cropping and liquid manure. The experiment consists of setting up this process inside and
outside the tunnel for comparative purposes. Chameleon water sensors have been installed for three
participants in KZN and Limpopo respectively and a qualitative monitoringprocess has been put in
place for the smallholder participants.
Individual experimentation
Conservation Agriculture experimentation- Limpopo
The first round of planting farmer level CA trials/experiments, was organized as a training workshop
where participants worked together to plant a trial after theoretical and technical details for this
process were introduced and discussed. Attending participants were given seed at the end of each
session to go and plant their own individual field trials (maize, beans, cowpeas, sunflower, millet and
winter cover crops (black oats, fodder rye and fodder radish).
The experimental sites were established in Sedawa, Mametja and Botshabelo. Below is a list
participants who have planted CA trails in the 2017/2018 growing season.
Table 17: Participants in the individual CA farmer experimentation in Limpopo
Name of participants
Village name
Date
Replanted (Yes or No)
Khomotso Malepe
Sedawa
14/12/2017
Yes
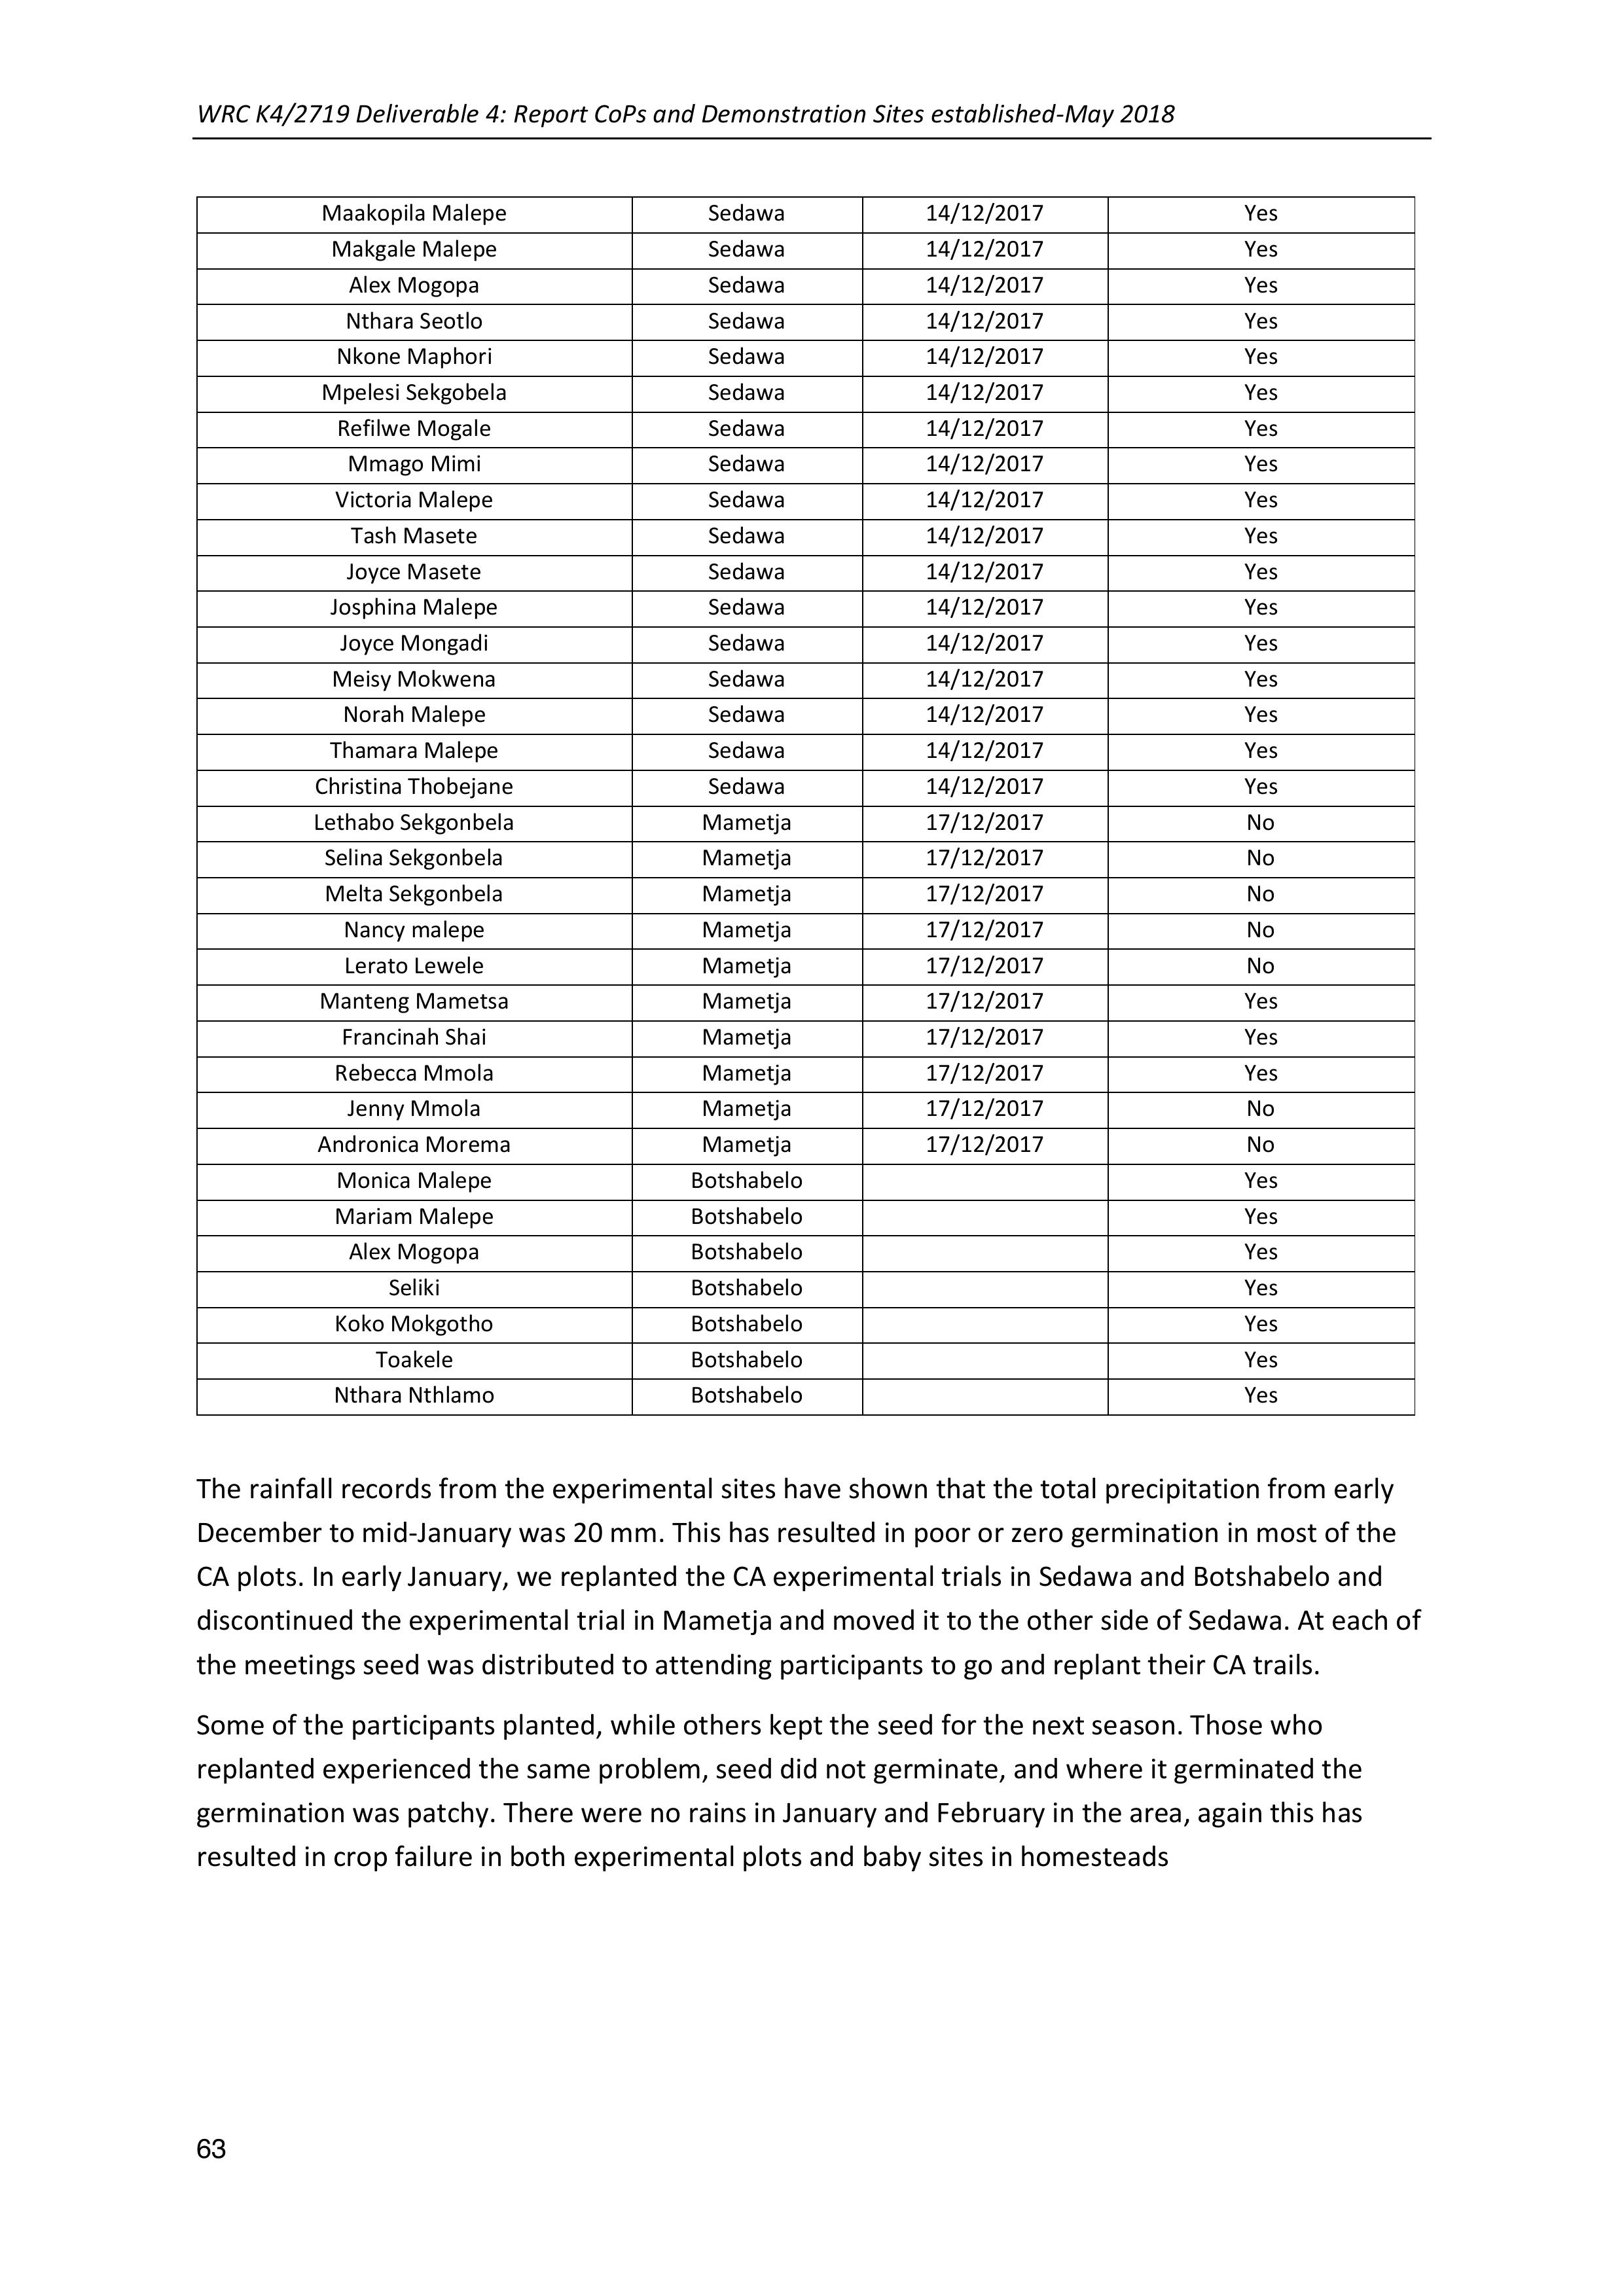
WRC K4/2719 Deliverable 4: Report CoPs and Demonstration Sites established-May 2018
63
Maakopila Malepe
Sedawa
14/12/2017
Yes
Makgale Malepe
Sedawa
14/12/2017
Yes
Alex Mogopa
Sedawa
14/12/2017
Yes
Nthara Seotlo
Sedawa
14/12/2017
Yes
Nkone Maphori
Sedawa
14/12/2017
Yes
Mpelesi Sekgobela
Sedawa
14/12/2017
Yes
Refilwe Mogale
Sedawa
14/12/2017
Yes
Mmago Mimi
Sedawa
14/12/2017
Yes
Victoria Malepe
Sedawa
14/12/2017
Yes
Tash Masete
Sedawa
14/12/2017
Yes
Joyce Masete
Sedawa
14/12/2017
Yes
Josphina Malepe
Sedawa
14/12/2017
Yes
Joyce Mongadi
Sedawa
14/12/2017
Yes
Meisy Mokwena
Sedawa
14/12/2017
Yes
Norah Malepe
Sedawa
14/12/2017
Yes
Thamara Malepe
Sedawa
14/12/2017
Yes
Christina Thobejane
Sedawa
14/12/2017
Yes
Lethabo Sekgonbela
Mametja
17/12/2017
No
Selina Sekgonbela
Mametja
17/12/2017
No
Melta Sekgonbela
Mametja
17/12/2017
No
Nancy malepe
Mametja
17/12/2017
No
Lerato Lewele
Mametja
17/12/2017
No
Manteng Mametsa
Mametja
17/12/2017
Yes
Francinah Shai
Mametja
17/12/2017
Yes
Rebecca Mmola
Mametja
17/12/2017
Yes
Jenny Mmola
Mametja
17/12/2017
No
Andronica Morema
Mametja
17/12/2017
No
Monica Malepe
Botshabelo
Yes
Mariam Malepe
Botshabelo
Yes
Alex Mogopa
Botshabelo
Yes
Seliki
Botshabelo
Yes
Koko Mokgotho
Botshabelo
Yes
Toakele
Botshabelo
Yes
Nthara Nthlamo
Botshabelo
Yes
The rainfall records from the experimental sites have shown that the total precipitation from early
December to mid-January was 20 mm. This has resulted in poor or zero germination in most of the
CA plots. In early January, we replanted the CA experimental trials in Sedawa and Botshabelo and
discontinued the experimental trial in Mametja and moved it to the other side of Sedawa. At each of
the meetings seed was distributed to attending participants to go and replant their CA trails.
Some of the participants planted, while others kept the seed for the next season. Those who
replanted experienced the same problem, seed did not germinate, and where it germinated the
germination was patchy. There were no rains in January and February in the area, again this has
resulted in crop failure in both experimental plots and baby sites in homesteads

WRC K4/2719 Deliverable 4: Report CoPs and Demonstration Sites established-May 2018
64
Above left and right:Seomole Malepe’s field in Botshabeloshowing patchy germination and very little
growth at the end o Jan 2018
However, the situation was different for those who have access to irrigation, their crops have
germinated and grown very well. There was no replanting done at Turkey village.
Above left to right MpelesiSekgobela’s homestead in Sedawa village–Her intercrop trial early
in the season -showing maize-bean and maize-cowpea intercrops, her maize singe crop block
later in the season and Mrs Sekgobela standingin an intercrop plot of maize and summer
cover crops (millet and sunflower)
In addition 3 researcher managed trial plots were also established to take samples and set up
instrumentation for more quantitative measurement. The trials were established in 3 fields, situated
in Sedawa (Koko Maphori), Mametja (at Lerato Lewele) and Botshabelo (Seemole Malepe).
The trials were planted by members of the learning group, and this was organized in the form of a
workshop of CA as the trial sites are to be used as demonstration sites. Soil fertility samples were
taken at these plots, as well as gravimetric water soil samples. Run-off plots and rain gauges were
also installed.
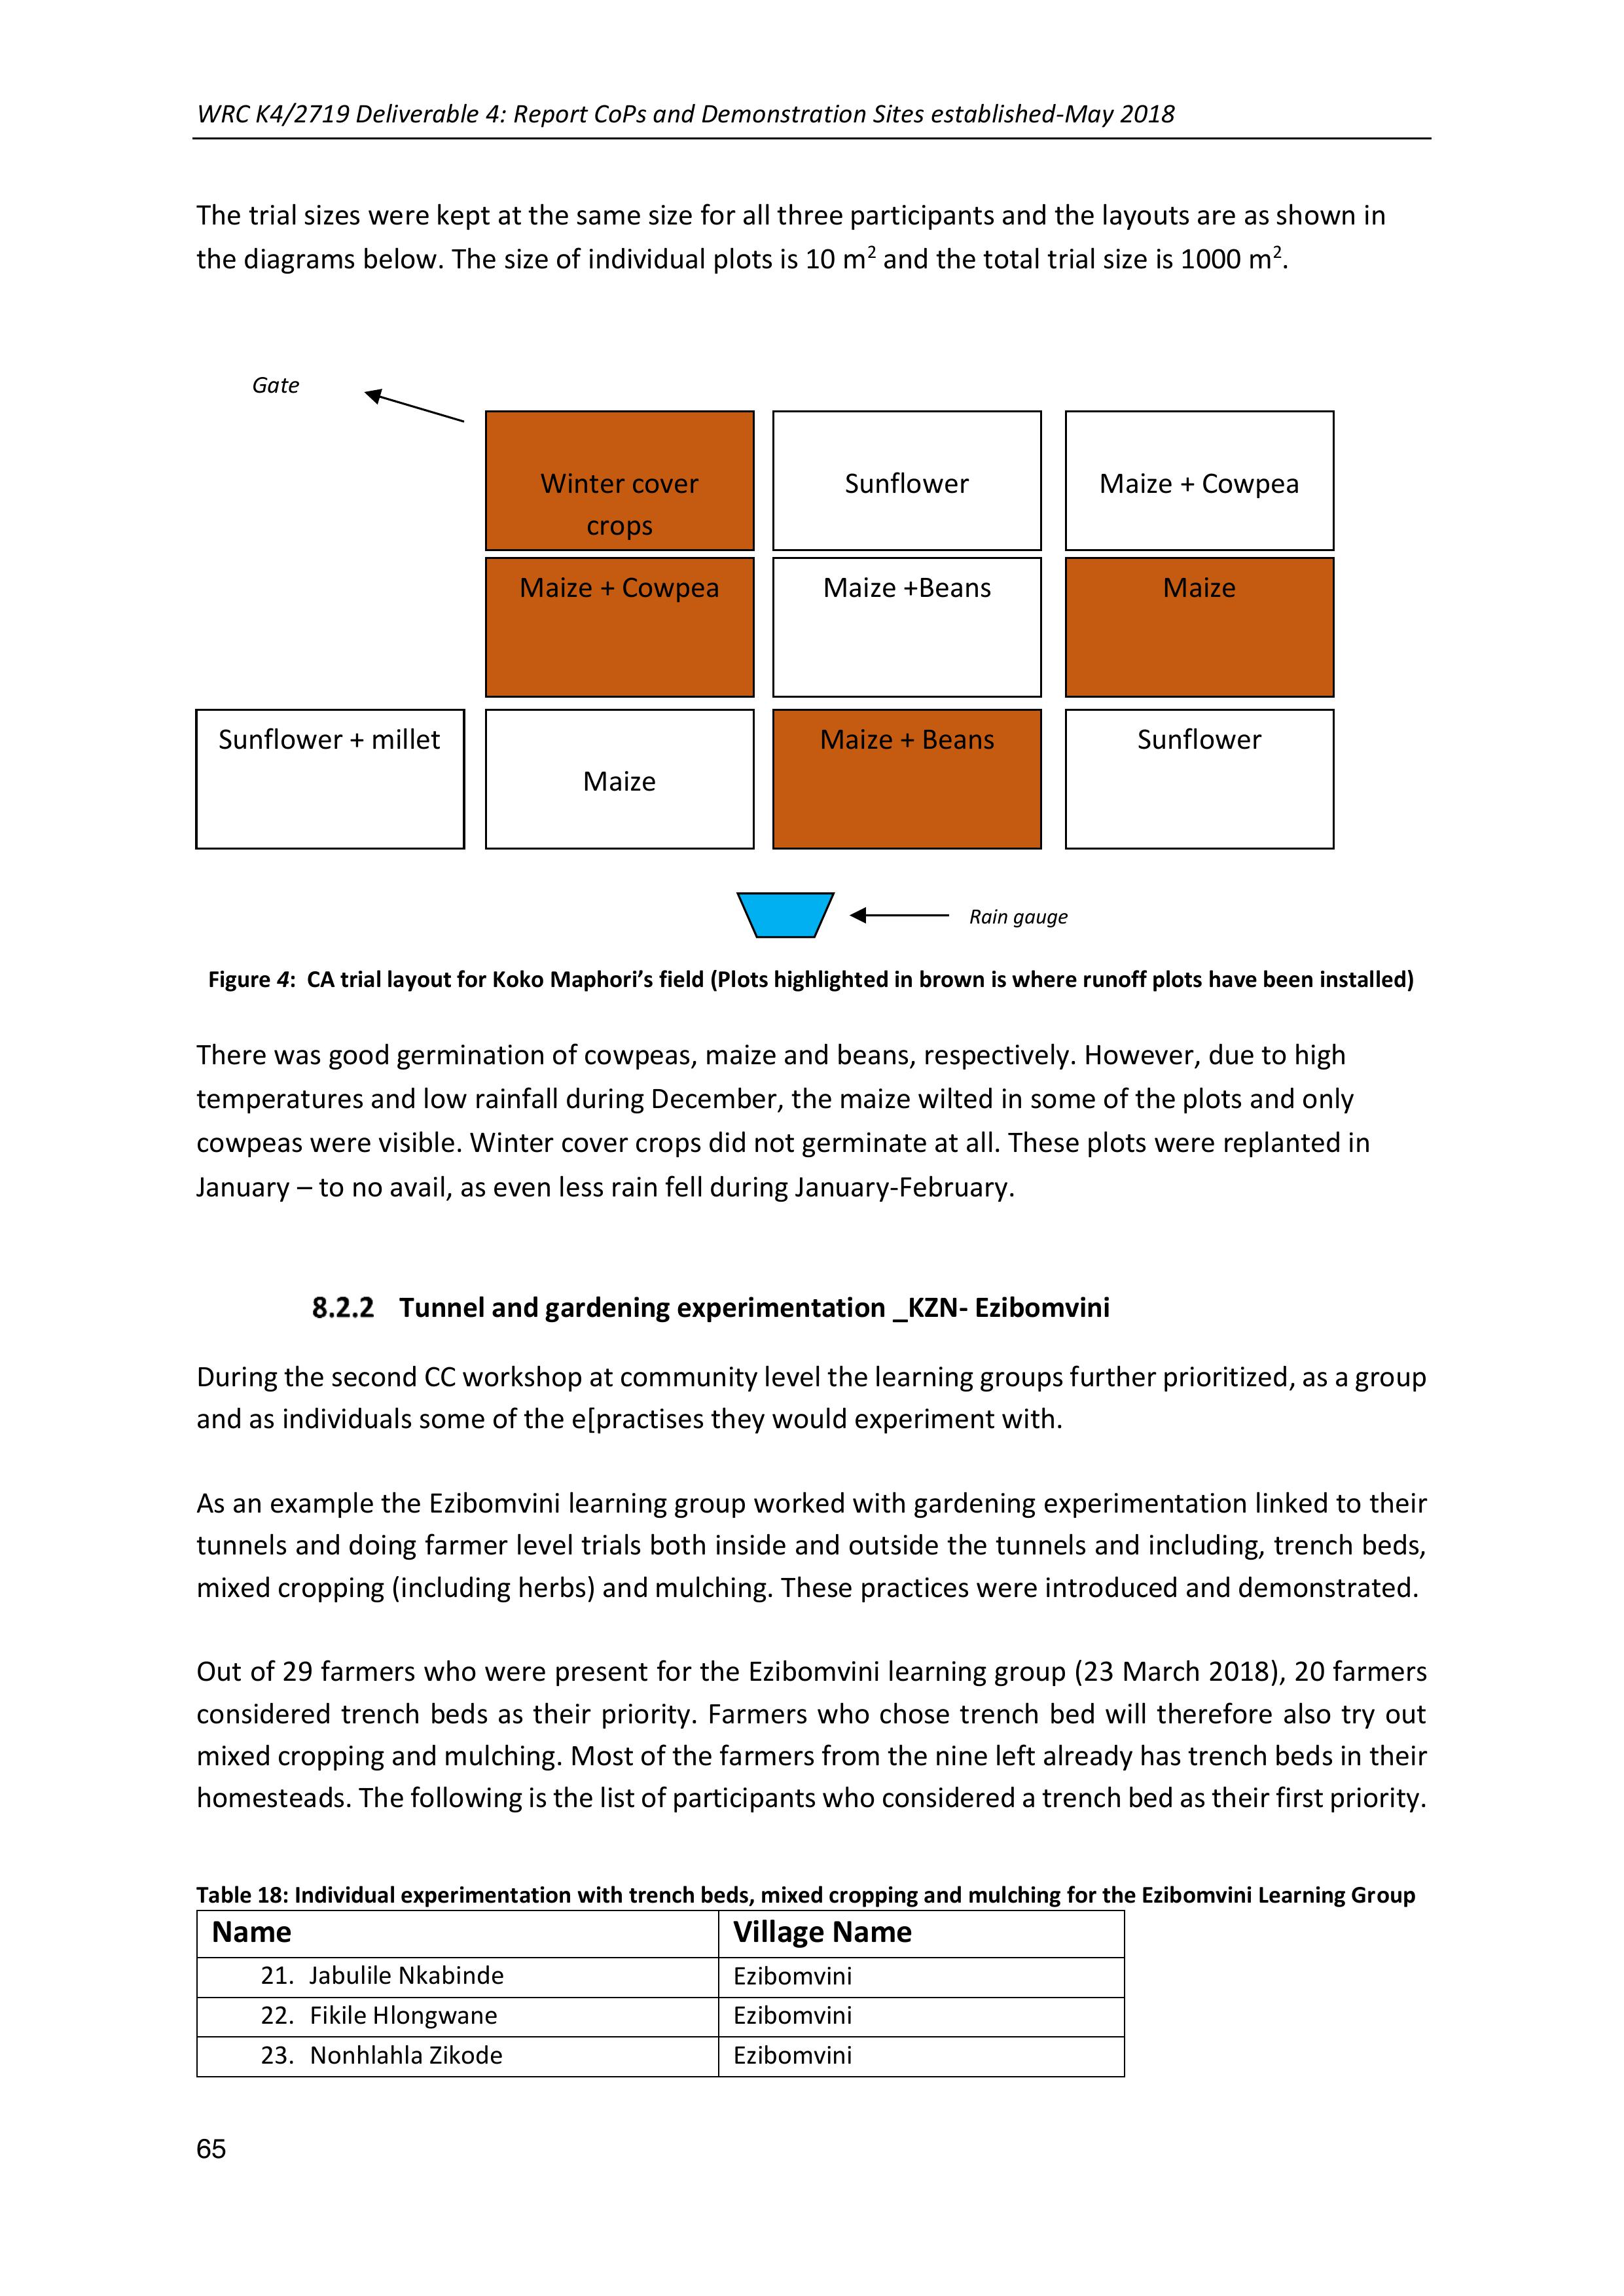
WRC K4/2719 Deliverable 4: Report CoPs and Demonstration Sites established-May 2018
65
The trial sizes were kept at the same size for all three participants and the layouts are as shown in
the diagrams below. The size of individual plots is 10 m2 and the total trial size is 1000 m2.
Figure 4: CA trial layout for Koko Maphori’s field (Plots highlighted in brown is where runoff plots have been installed)
There was good germination of cowpeas, maize and beans, respectively. However, due to high
temperatures and low rainfall during December, the maize wilted in some of the plots and only
cowpeas were visible. Winter cover crops did not germinate at all. These plots were replanted in
January – to no avail, as even less rain fell during January-February.
Tunnel and gardening experimentation _KZN- Ezibomvini
During the second CC workshop at community level the learning groups further prioritized, as a group
and as individuals some of the e[practises they would experiment with.
As an example the Ezibomvini learning group worked with gardening experimentation linked to their
tunnels and doing farmer level trials both inside and outside the tunnels and including, trench beds,
mixed cropping (including herbs) and mulching. These practices were introduced and demonstrated.
Out of 29 farmers who were presentfor the Ezibomvini learning group (23 March 2018), 20 farmers
considered trench beds astheir priority.Farmers who chose trench bed will therefore also try out
mixed cropping and mulching. Most of the farmers from the nine left already has trench beds in their
homesteads. The following is the list of participants who considered a trench bed as their firstpriority.
Table 18: Individual experimentation with trench beds, mixed cropping and mulching for the Ezibomvini Learning Group
Name
Village Name
21.Jabulile Nkabinde
Ezibomvini
22.Fikile Hlongwane
Ezibomvini
23.Nonhlahla Zikode
Ezibomvini
Winter cover
crops
Sunflower
Maize + Cowpea
Maize + Cowpea
Maize +Beans
Maize
Maize
Maize + Beans
Sunflower
Sunflower + millet
Gate
Rain gauge
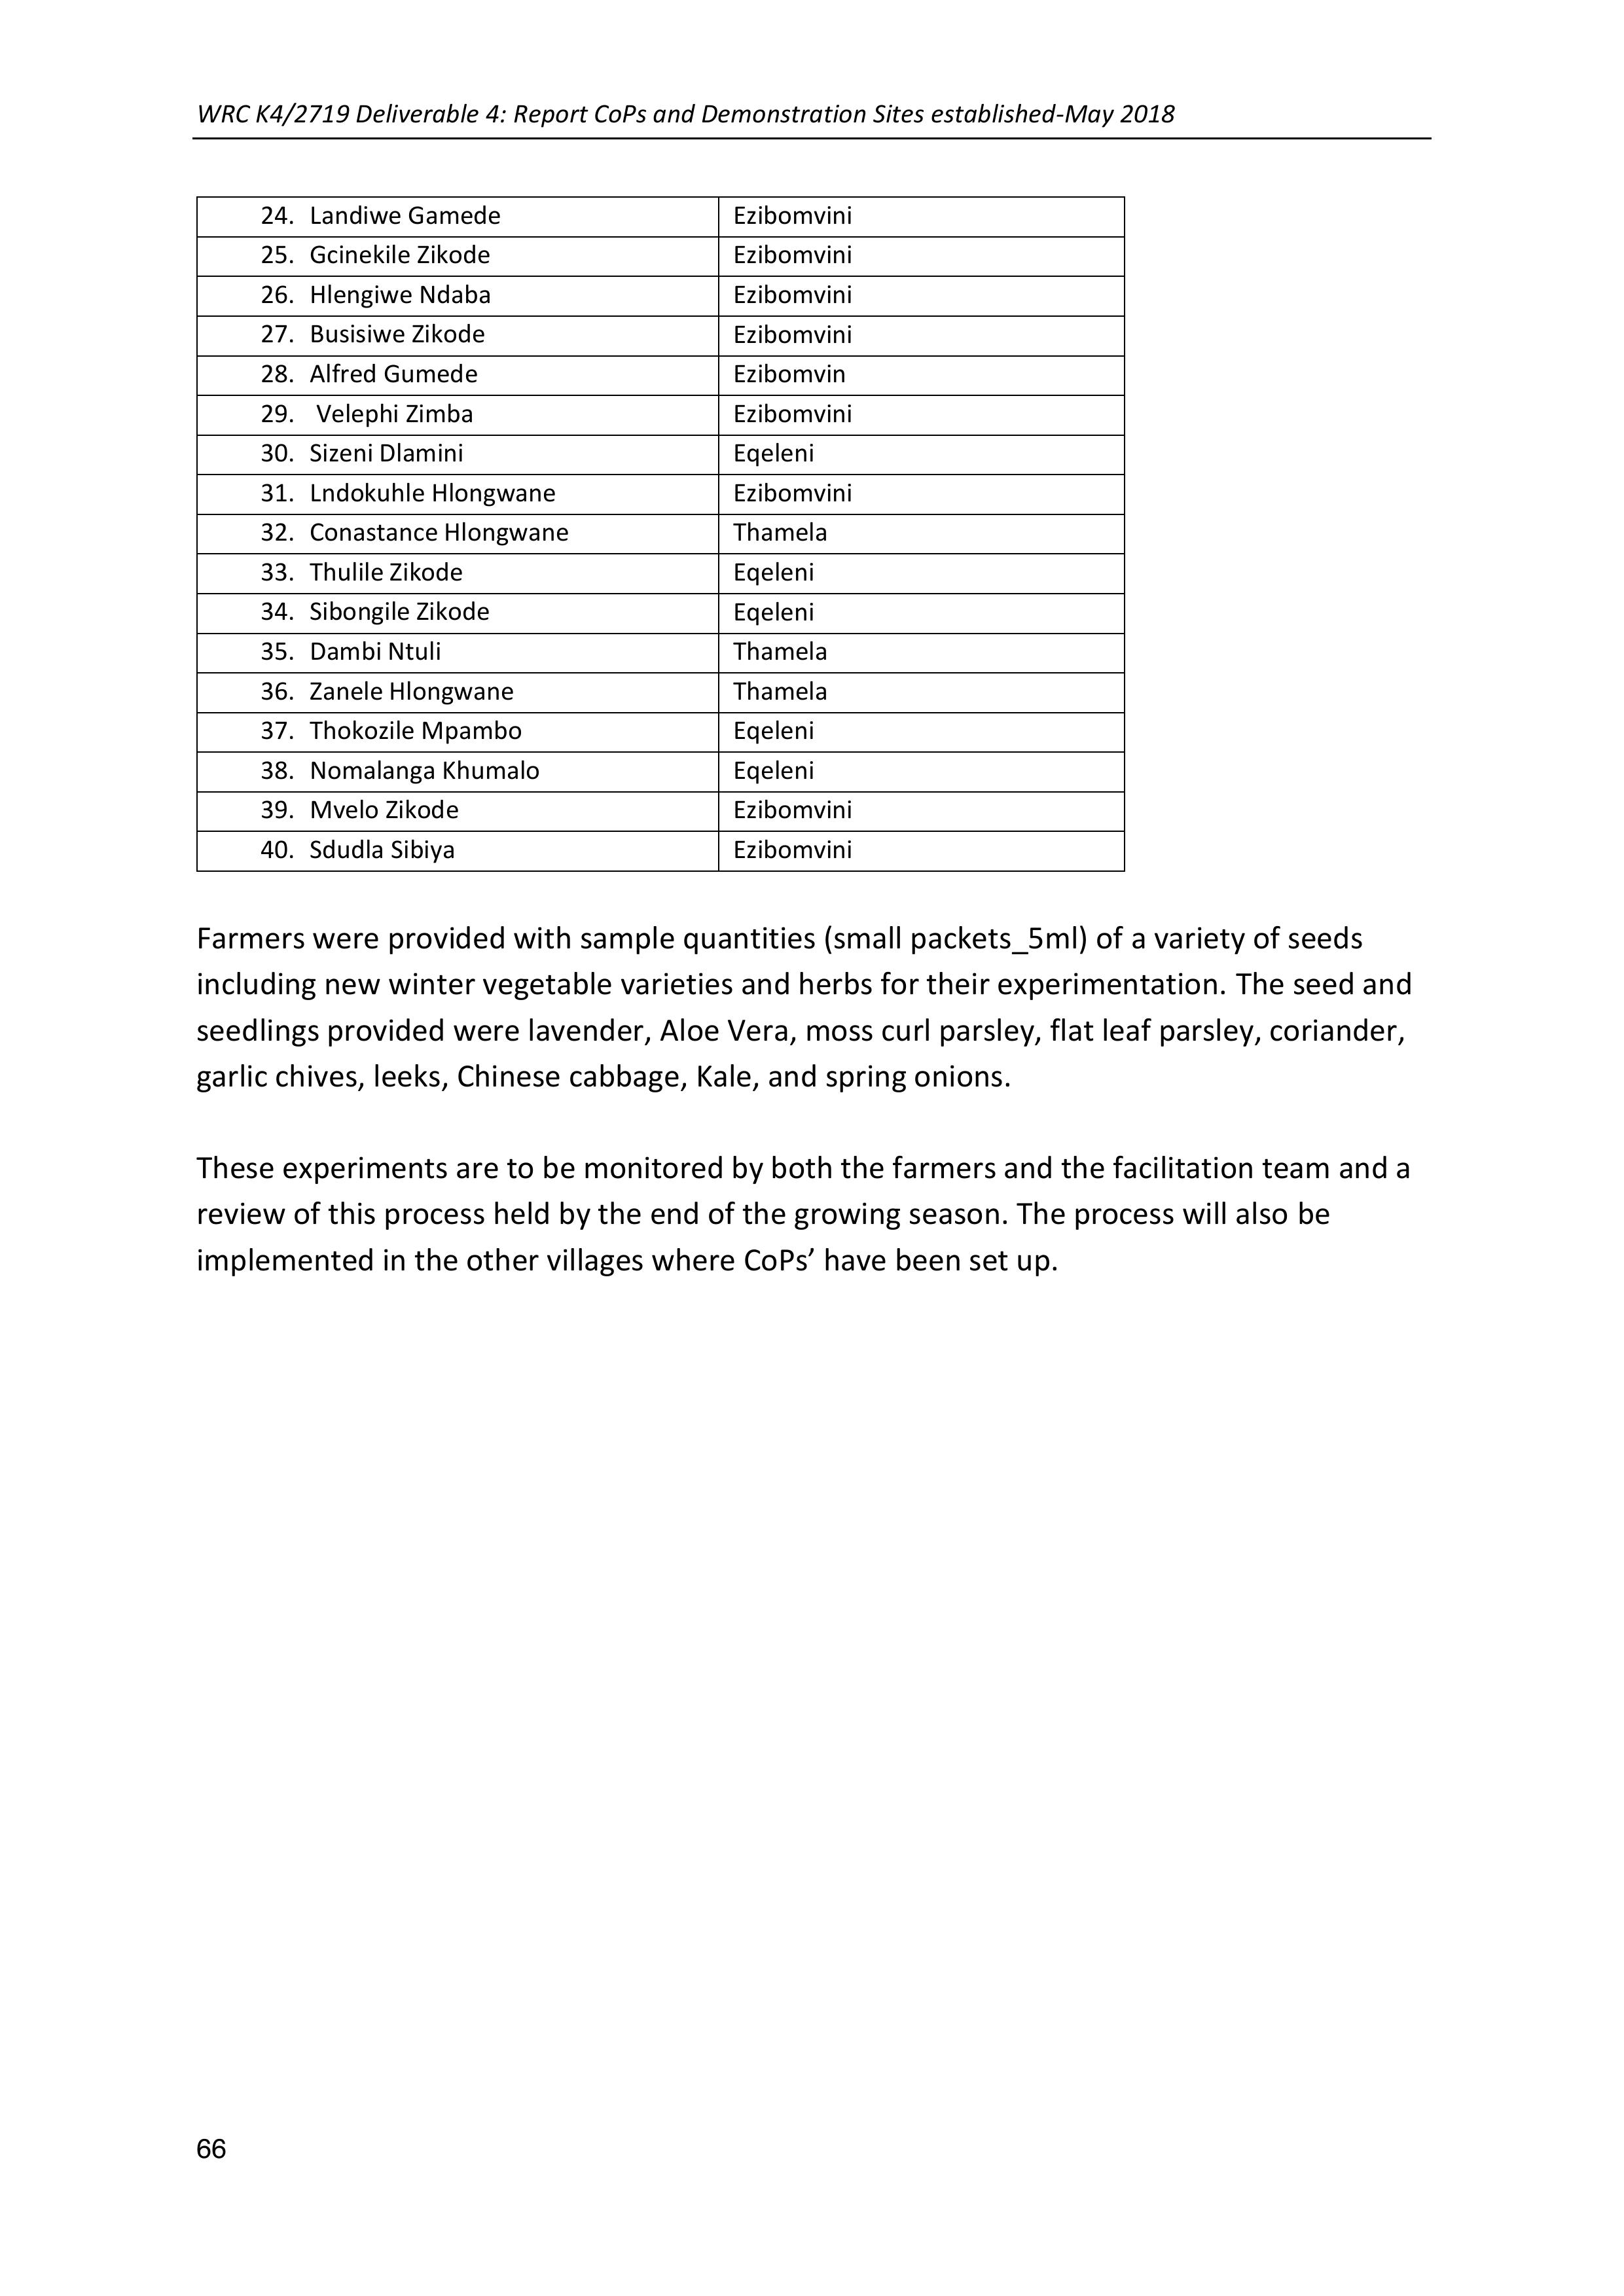
WRC K4/2719 Deliverable 4: Report CoPs and Demonstration Sites established-May 2018
66
24.Landiwe Gamede
Ezibomvini
25.Gcinekile Zikode
Ezibomvini
26.Hlengiwe Ndaba
Ezibomvini
27.Busisiwe Zikode
Ezibomvini
28.Alfred Gumede
Ezibomvin
29. Velephi Zimba
Ezibomvini
30.Sizeni Dlamini
Eqeleni
31.Lndokuhle Hlongwane
Ezibomvini
32.Conastance Hlongwane
Thamela
33.Thulile Zikode
Eqeleni
34.Sibongile Zikode
Eqeleni
35.Dambi Ntuli
Thamela
36.Zanele Hlongwane
Thamela
37.Thokozile Mpambo
Eqeleni
38.Nomalanga Khumalo
Eqeleni
39.Mvelo Zikode
Ezibomvini
40.Sdudla Sibiya
Ezibomvini
Farmers were provided with sample quantities (small packets_5ml) of a variety of seeds
including new winter vegetable varieties and herbs for their experimentation. The seed and
seedlings provided were lavender, Aloe Vera, moss curl parsley, flat leaf parsley, coriander,
garlic chives, leeks, Chinese cabbage, Kale, and spring onions.
These experiments are to be monitored by both the farmers and the facilitation team and a
review of this process held by the end of the growing season. The process will also be
implemented in the other villages where CoPs’ have been set up.
WRC K4/2719 Deliverable 4: Report CoPs and Demonstration Sites established-May 2018
67
9CAPACITY BUILDING AND PUBLICATIONS
Capacity building has been undertaken on three levels:
•Community level learning
•Organisational capacity building
•Post graduate students
Community level learning
This has been discussed at lengthin previous sections. In summary learning workshop have been
conducted in 7 villages across three provinces (EC, KZN and Limpopo) with a total of 208 participants
including a number of topics including; scientific and community level understanding of climate
change and weather variability, impact of climate changeon production, adaptive measures,
introduction to a range of CSA practices, farmer level experimentation and practical learning for a
range of CSA practices
Organisational capacity building
Within 3 NGOs (MDF, Lima RDf and AWARD) capacity of field staff to facilitate and work with climate
change concepts and facilitation of CSA at community level has been enhanced through:
•Collaborative design of workshop outlines and facilitation processes
•Training sessions in CC and CSA facilitation, including appropriate CSA practices
•Mentored facilitation of CC and CSA workshops
•Field staff managed facilitation of learning events
•Setting up of CoPs and
•Attendance at stakeholder CoP processes related to this work (Agroecology network in
Limpopo, Rangeland management cross visit with UCPP in Eastern Cape and regenerative
agriculture symposium in the Free State.
•In addition inputs have been provided for the Conservation Agriculture policy document for
DAFF
Post graduate students
Below is a summary of the postgraduate studies and progress made for 2017-2018
•Finalisation of theses:
oSanelise Tafa: Agric Economic Masters- University of Fort Hare; July 2017. Farm level
cost-benefit analysis of conservation agriculture for maize smallholder farmers in
Okhahlamba Municipality in Kwa-Zulu Natal Province, South Africa.
▪Paper: Farm Level Cost-Benefit Analysis: The evaluation of economics of
conservation agriculture in Bergville Town in Kwa-Zulu Natal Province of
South Africa ( Invitation to present: Center for Integrated Agricultural
Systems (CIAS) at the University of Wisconsin- “The Agroecology of
Development: Community Solutions in Post-Apartheid South Africa” event
on November 9th, 2017)

WRC K4/2719 Deliverable 4: Report CoPs and Demonstration Sites established-May 2018
68
oKhethiwe Mthethwa: B Agric Honours – Univeristy of KwaZulu Natal. November
2017. Investigating the sustainability of adoption of conservation agriculture by
small-scale farmers in Bergville
•Progress: Final proposals and research methodology
oPalesa Motaung: M Agric -University of Pretoria. Evaluating the restorative effect of
conservation agriculture on the degraded soils of the upper Drakensburg area of
Bergville, KwaZulu-Natal using qualitative versus quantitative soil health indicators
oMazwi Dlamini: MPhil - UWC_PLAAS. Factors influencing the adoption and non-
adoption of Conservation Agriculture in smallholder farming systems, and the
implications of these for livelihoods and food security in Bergville, Kwazulu-Natal
•Progress: Initial proposals and research methodology
oKhethiwe Mthethwa: M Agric – University of KwaZulu Natal; January 2018. The
contribution of Climate Smart Agriculture (CSA) practices in adapting to climate
change: The case of smallholder farmers in KwaZulu Natal.
Sanelise Tafa:
Summary of Paper
On-farm economic benefits between conservation and conventional agriculture are not
thought to be very pronounced. General inferences can be made, however, a comprehensive
assessment of the net private benefits from greater use of conservation tillage is necessary.
With the use of Gross Margin as well as appraisal indicators such as Net Present Value,
Benefit Cost Ratio and Internal Rate of Returns, the study revealed that there are more
incentives for adoption of conservation agriculture over conventional agriculture. The study
therefore recommends that the promotion of conservation agriculture should be
encouraged and this is promising more incentives in the long-run
He used the following conceptual framework for his economic analysis
Discounted cost
Inputs costs
Labour
Fertilise
r
Pesticid
e
Seed
Conservation
agriculture
adoption&
Outcome
Productivit
y change
Reverse to
soil
degradatio
Discounted benefits
Comparison (NPV, BCR, IRR)
Figure 1: conceptual framework on cost benefit of conservation agriculture
Source: Adapted from Pannell et al. (2014)

WRC K4/2719 Deliverable 4: Report CoPs and Demonstration Sites established-May 2018
69
Using interviews with 6 smallholder farmers in the Bergville area as well as quantitative and
qualitative data from Mahlathini’s GrainSA conservation Agriculture, smallholder innovation
programme he achieved the following results – as indicated in the three tables below
Table 1: The average yield from the sampled respondents of 2013-2015
Year
Conservation agriculture (t/ha)
Conventional agriculture
(t/ha)
2013
3.26
3.39
2014
4.12
5.4
2015
4.45
3.05
Source: Kruger (2016)
Table 2: Comparison of Cost and Benefits of trial plot and control plot
Variable
cost
Trial Plots (Rands/0.14ha)
Control plots (R/0.8ha)
Q
P/Unit
Total Cost
% of
cost
Q
P/Unit
Total Cost
% of cost
Maize seed
3.5
104
364
16%
4.8
104
499,2
11%
Fertiliser
35
9.2
322
14%
93
5
465
10%
Herbicide
0.42
109
45,78
2%
Pesticide
0.014
875
12,25
1%
Ploughing
0.8
645
516
11%
Labour
5
250
1250
56%
10
250
2500
53%
Discing
0.8
537.5
430
9%
Sowing
5
50
250
11%
0.8
376.25
301
6%
Sub-total
2244,03
100%
Sub-total
4711,2
100%
Contingency at
4%
89,7612
Contingency at
4%
188,448
Total Cost
2154,2688
Total Cost
4522,752
Gross
Revenue
3,94
2500
9850
3,35
2500
8375
Gross Margin
7695,7312
3852,248
Source: Author’s own computation
Table 3: The results of CBA
Tillage system
Parameter
10-year period
Discounted at 8%
10-year period Discounted
at 10.5%
Conservation
agriculture
NPV
52694
46550
IRR
25%
25%
BCR
3,85
3,78
Conventional
agriculture
NPV
20446
18177
IRR
35%
35%
BCR
1,56
1,55
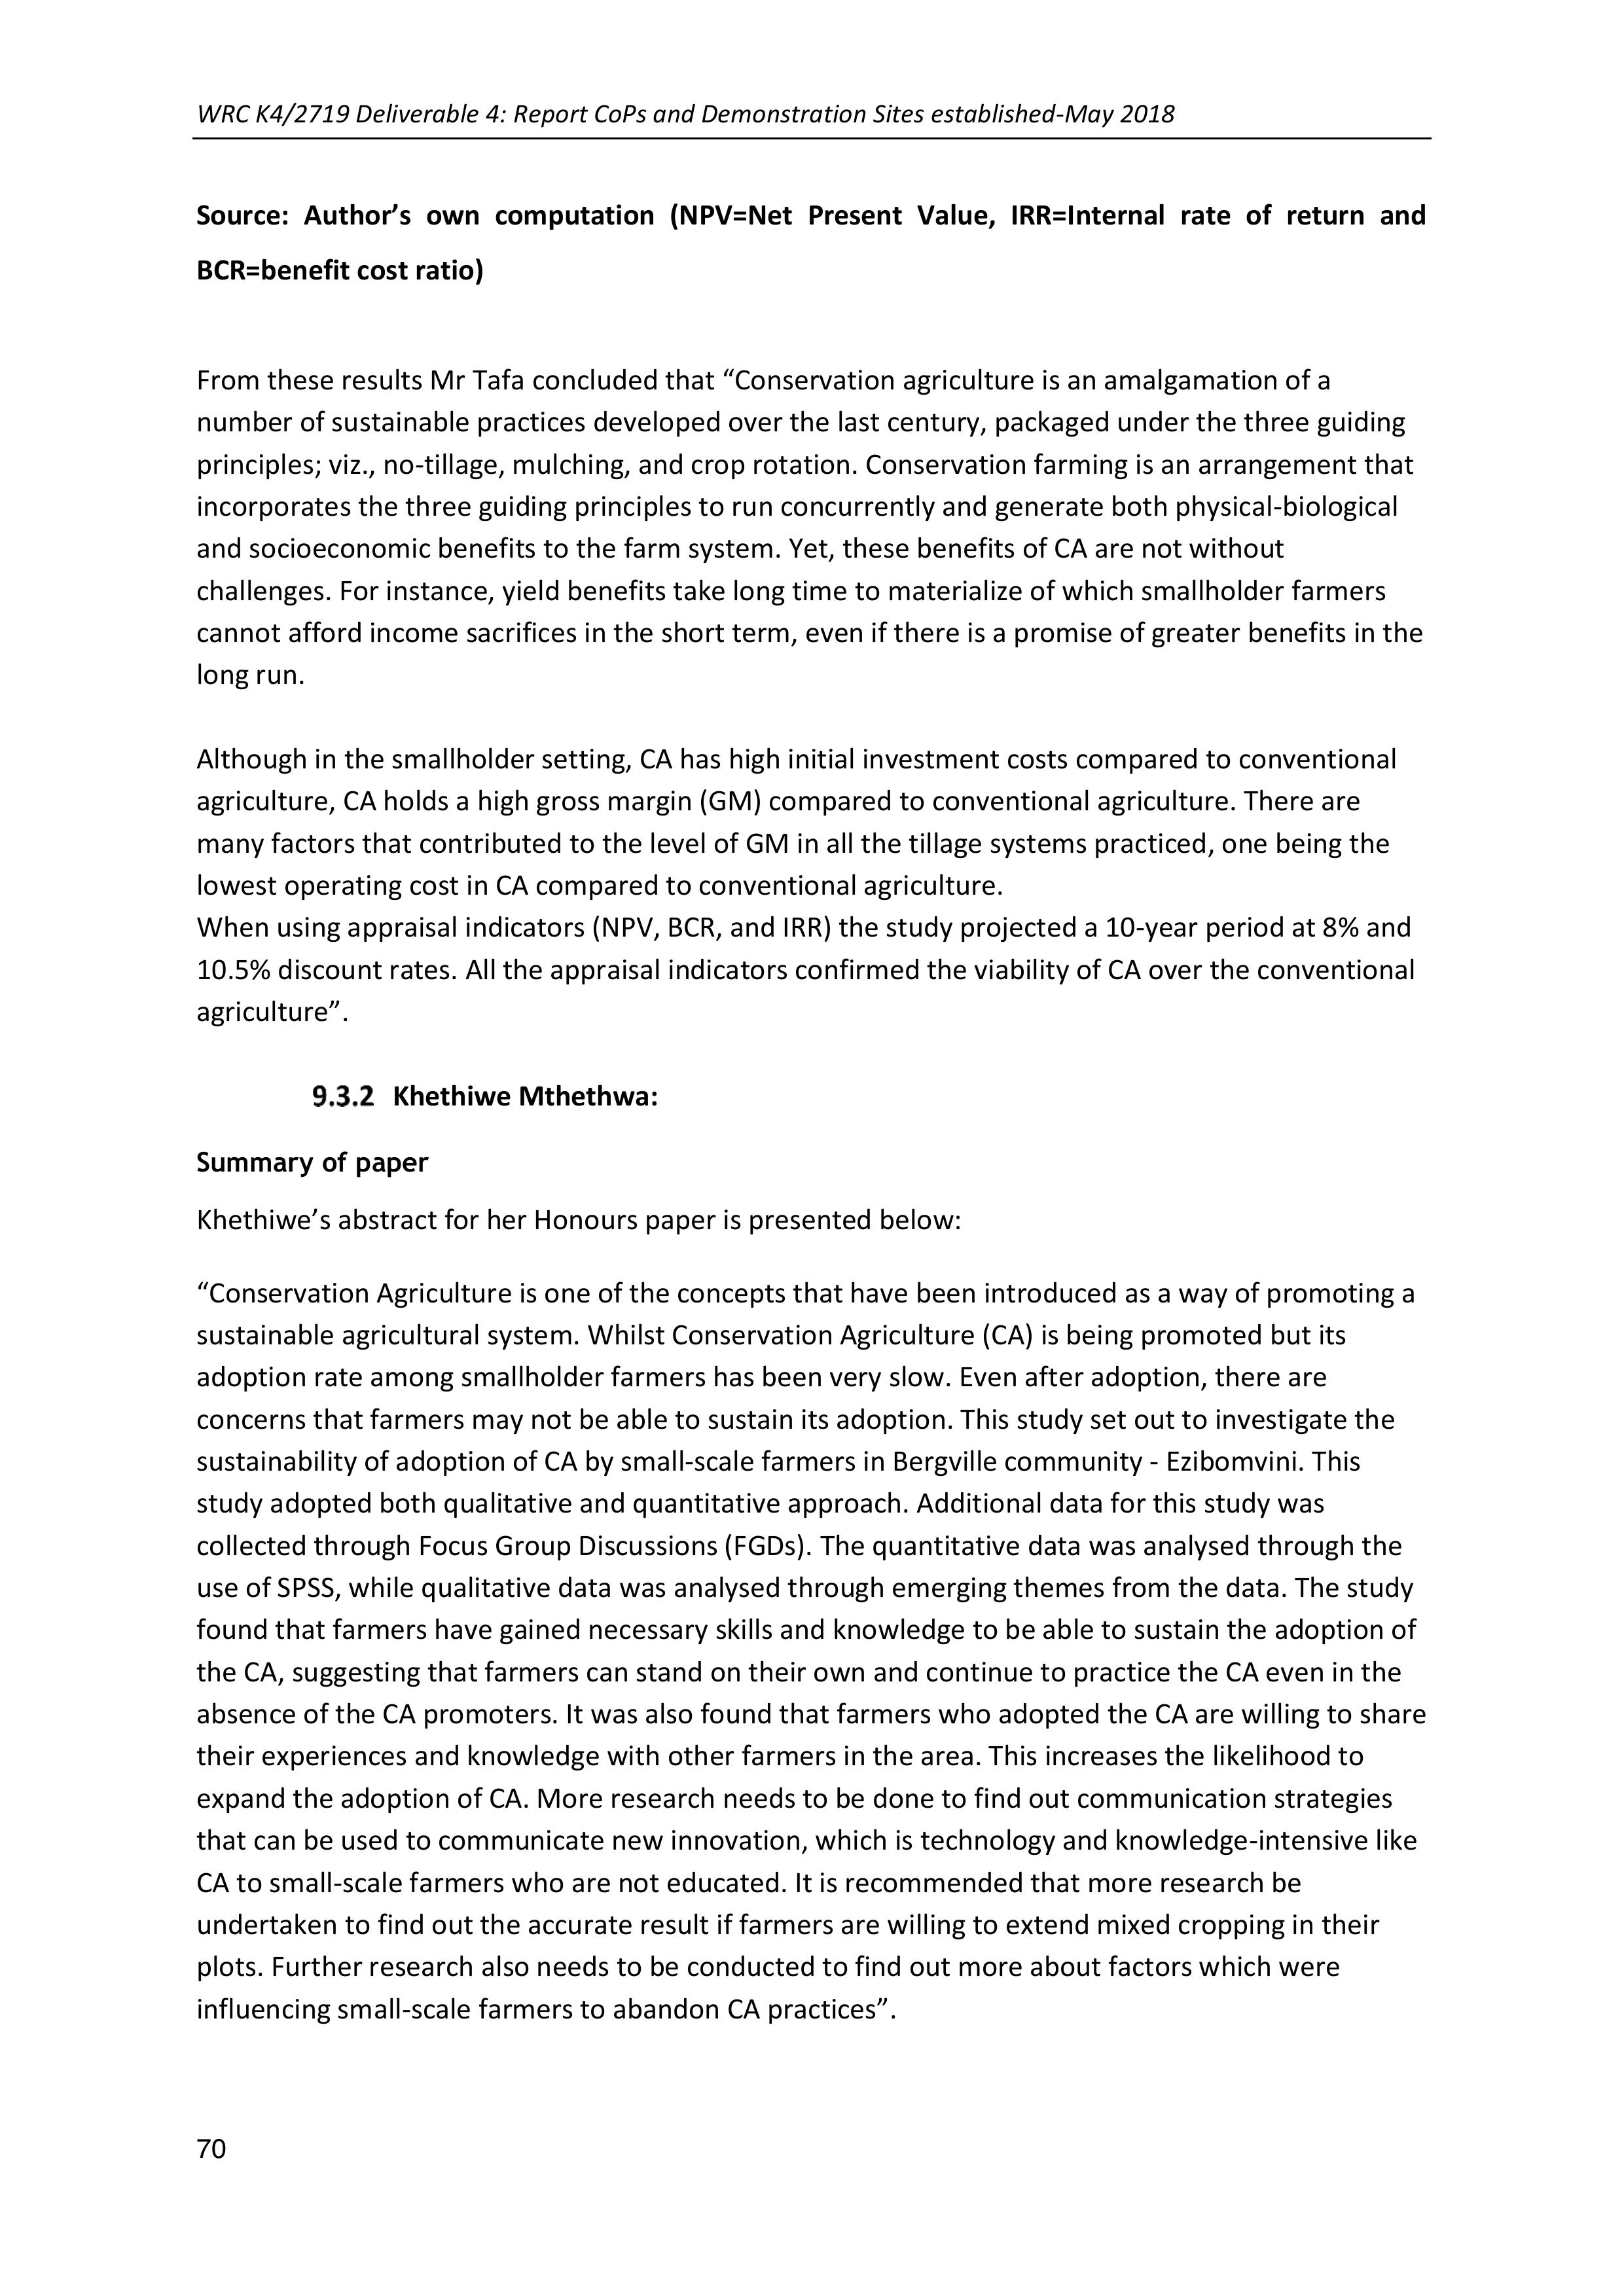
WRC K4/2719 Deliverable 4: Report CoPs and Demonstration Sites established-May 2018
70
Source: Author’s owncomputation (NPV=Net Present Value, IRR=Internal rate of return and
BCR=benefit cost ratio)
From these results Mr Tafa concluded that “Conservation agriculture is an amalgamation of a
number of sustainable practices developed over the last century, packaged under the three guiding
principles; viz., no-tillage, mulching, and crop rotation. Conservation farming is an arrangement that
incorporates the three guiding principles to run concurrently and generate both physical-biological
and socioeconomic benefits to the farm system. Yet, these benefits of CA are not without
challenges. For instance, yield benefits take long time to materialize of which smallholder farmers
cannot afford income sacrifices in the short term, even if there is a promise of greater benefits in the
long run.
Although in the smallholder setting, CA has high initial investment costs compared to conventional
agriculture, CA holds a high gross margin (GM) compared to conventional agriculture. There are
many factors that contributed to the level of GM in all the tillage systems practiced, one being the
lowest operating cost in CA compared to conventional agriculture.
When using appraisal indicators (NPV, BCR, and IRR) the study projected a 10-year period at 8% and
10.5% discount rates. All the appraisal indicators confirmed the viability of CA over the conventional
agriculture”.
Khethiwe Mthethwa:
Summary of paper
Khethiwe’s abstract for her Honours paper is presented below:
“Conservation Agriculture is one of the concepts that have been introduced as a way of promoting a
sustainable agricultural system. Whilst Conservation Agriculture (CA) is being promoted but its
adoption rate among smallholder farmers has been very slow. Even after adoption, there are
concerns that farmers may not be able to sustain its adoption. This study set out to investigate the
sustainability of adoption of CA by small-scale farmers in Bergville community - Ezibomvini. This
study adopted both qualitative and quantitative approach. Additional data for this study was
collected through Focus Group Discussions (FGDs). The quantitative data was analysed through the
use of SPSS, while qualitative data was analysed through emerging themes from the data. The study
found that farmers have gained necessary skills and knowledge to be able to sustain the adoption of
the CA, suggesting that farmers can stand on their own and continue to practice the CA even in the
absence of the CA promoters. It was also found that farmers who adopted the CA are willing to share
their experiences and knowledge with other farmers in the area. This increases the likelihood to
expand the adoption of CA. More research needs to be done to find out communication strategies
that can be used to communicate new innovation, which is technology and knowledge-intensive like
CA to small-scale farmers who are not educated. It is recommended that more research be
undertaken to find out the accurate result if farmers are willing to extend mixed cropping in their
plots. Further research also needs to be conducted to find out more about factors which were
influencing small-scale farmers to abandon CA practices”.
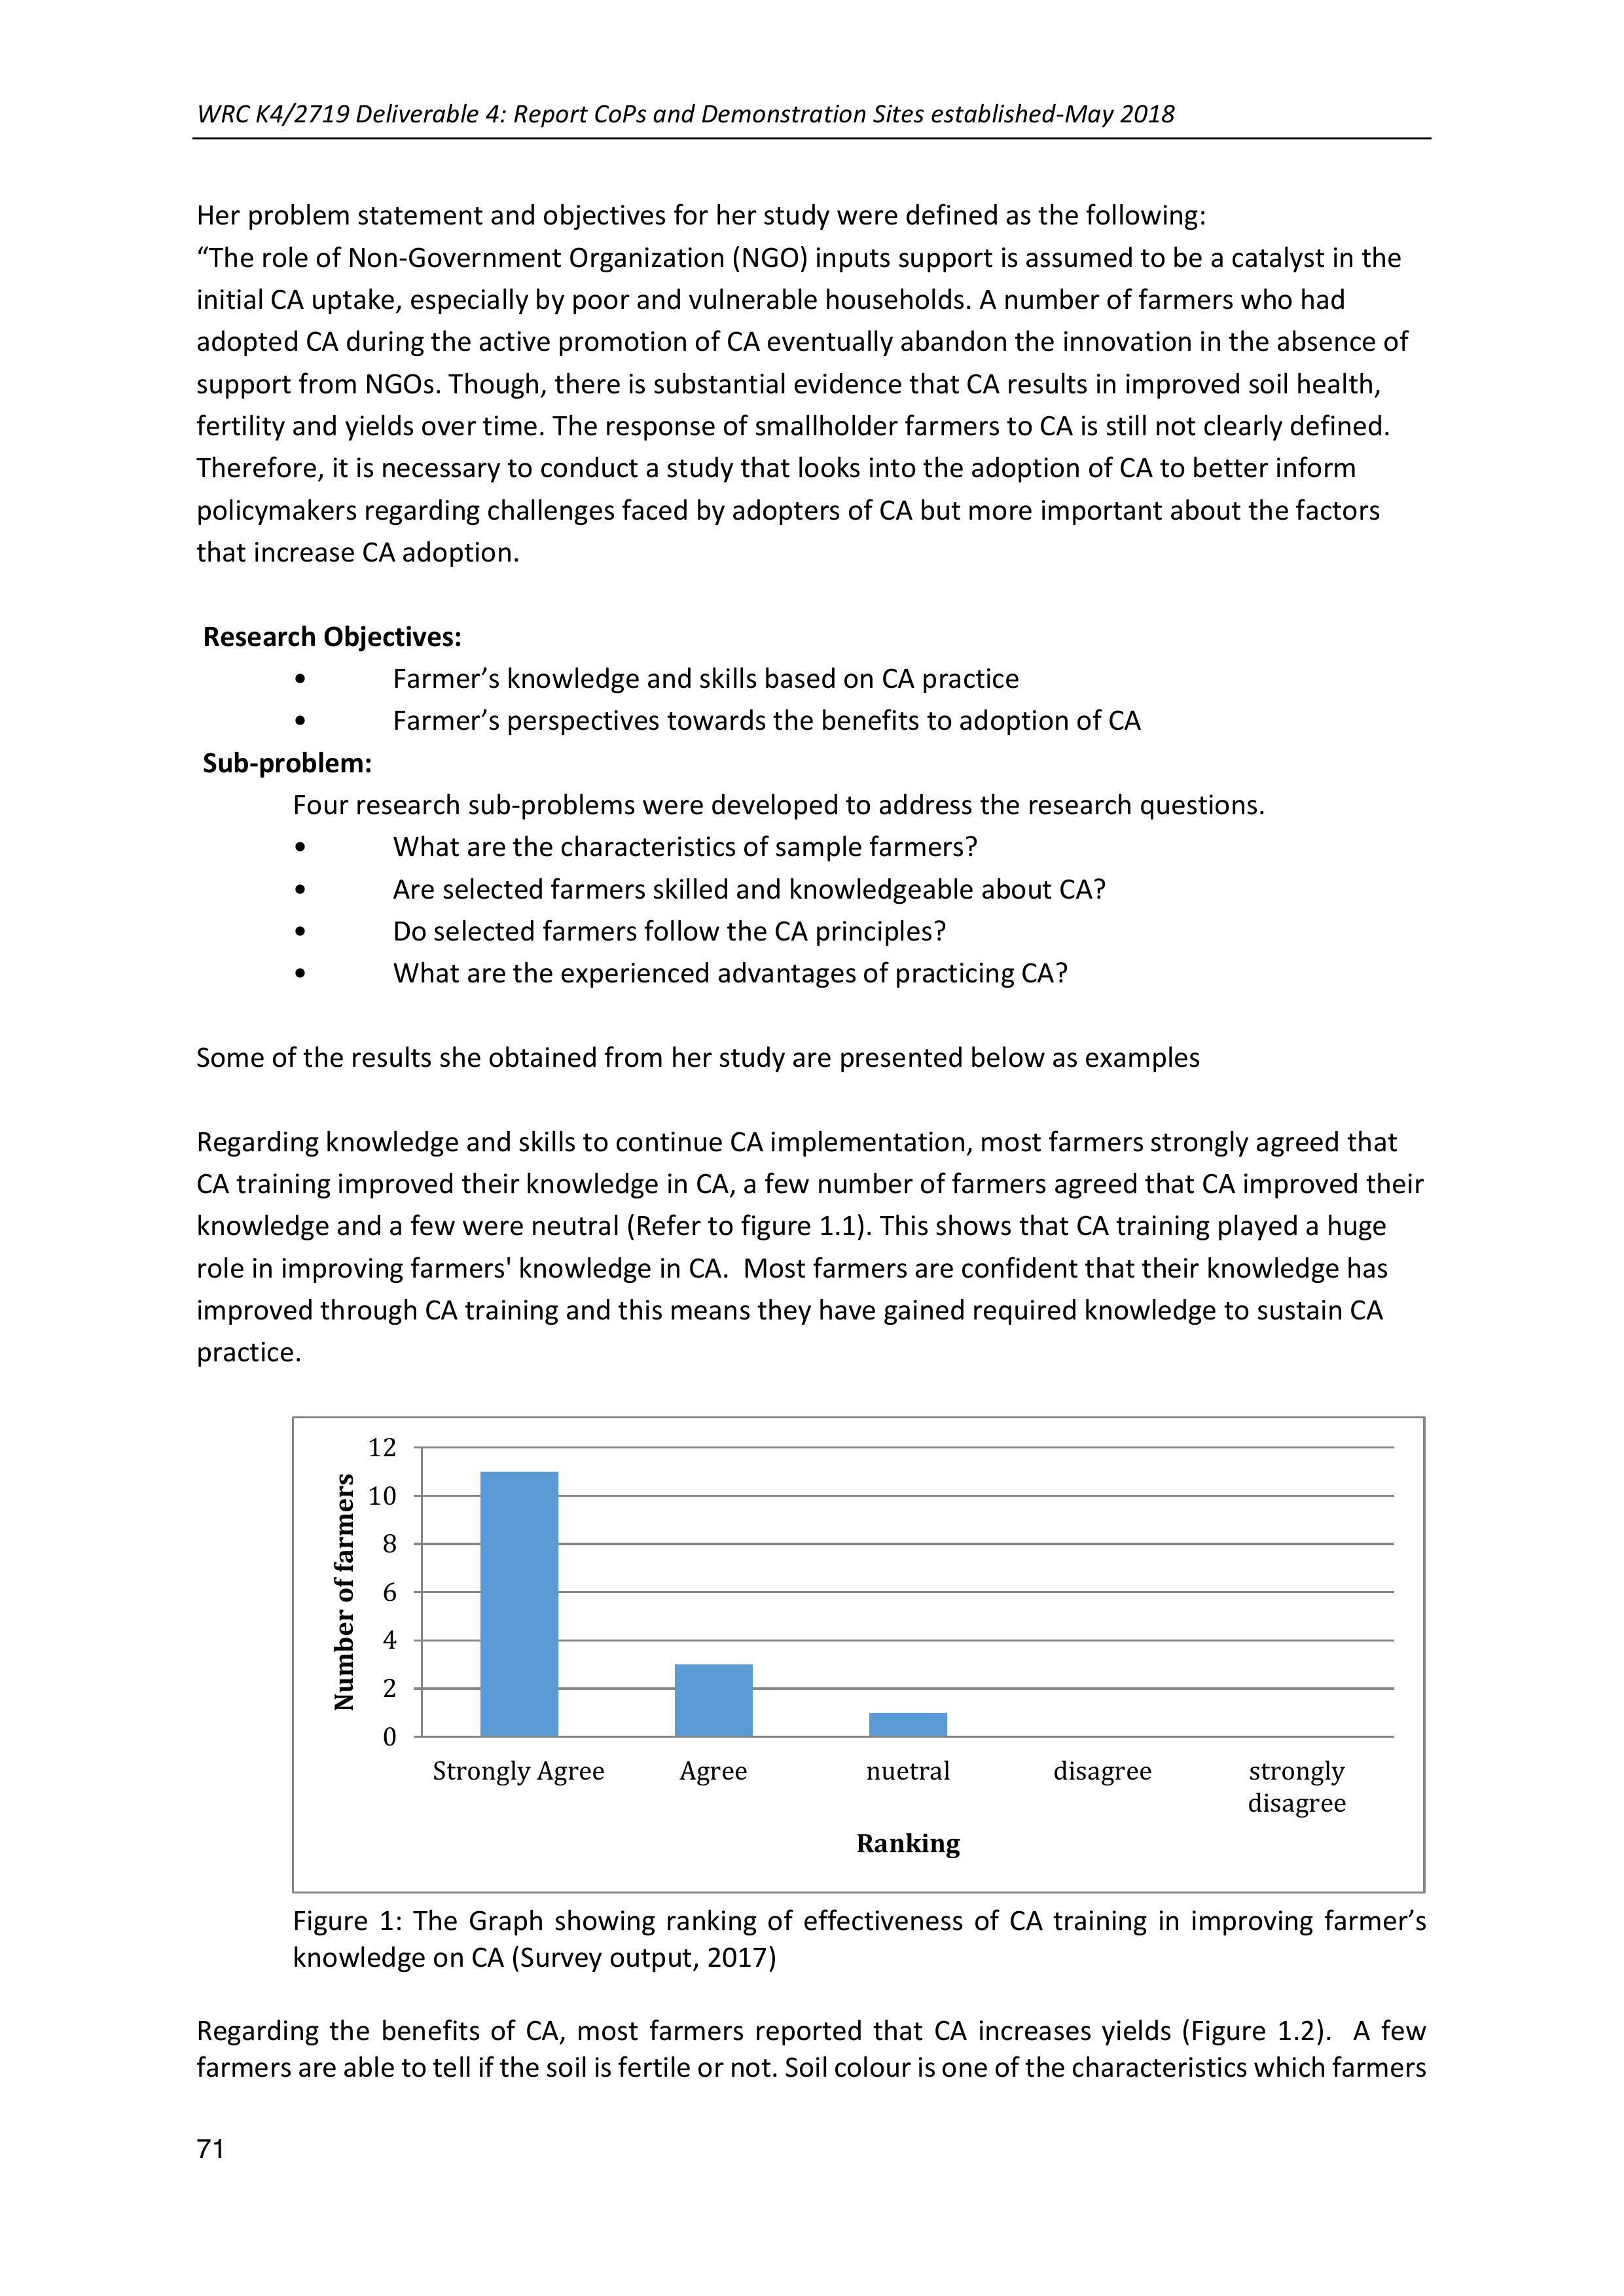
WRC K4/2719 Deliverable 4: Report CoPs and Demonstration Sites established-May 2018
71
Her problem statement and objectives for her study were defined as the following:
“The role of Non-Government Organization (NGO) inputs support is assumed to be a catalyst in the
initial CA uptake, especially by poor and vulnerable households. A number of farmers who had
adopted CA during the active promotion of CA eventually abandon the innovation in the absence of
support from NGOs. Though, there is substantial evidence that CA results in improved soil health,
fertility and yields over time. The response of smallholder farmers to CA is still not clearly defined.
Therefore, it is necessary to conduct a study that looks into the adoption of CA to better inform
policymakers regarding challenges faced by adopters of CA but more important about the factors
that increase CA adoption.
Research Objectives:
•Farmer’s knowledge and skills based on CA practice
•Farmer’s perspectives towards the benefits to adoption of CA
Sub-problem:
Four research sub-problems were developed to address the research questions.
•What are the characteristics of sample farmers?
•Are selected farmers skilled and knowledgeable about CA?
•Do selected farmers follow the CA principles?
•What are the experienced advantages of practicing CA?
Some of the results she obtained from her study are presented below as examples
Regarding knowledge and skills to continue CA implementation, most farmers strongly agreed that
CA training improved their knowledge in CA, a few number of farmers agreed that CA improved their
knowledge and a few were neutral (Refer to figure 1.1). This shows that CA training played a huge
role in improving farmers' knowledge in CA. Most farmers are confident that their knowledge has
improved through CA training and this means they have gained required knowledge to sustain CA
practice.
Figure 1: The Graph showing ranking of effectiveness of CA training in improving farmer’s
knowledge on CA (Survey output, 2017)
Regarding the benefits of CA, most farmers reported that CA increases yields (Figure 1.2). A few
farmers are able to tell if the soil is fertile or not. Soil colour is one of the characteristics which farmers
0
2
4
6
8
10
12
Strongly AgreeAgreenuetraldisagreestrongly
disagree
Number of farmers
Ranking
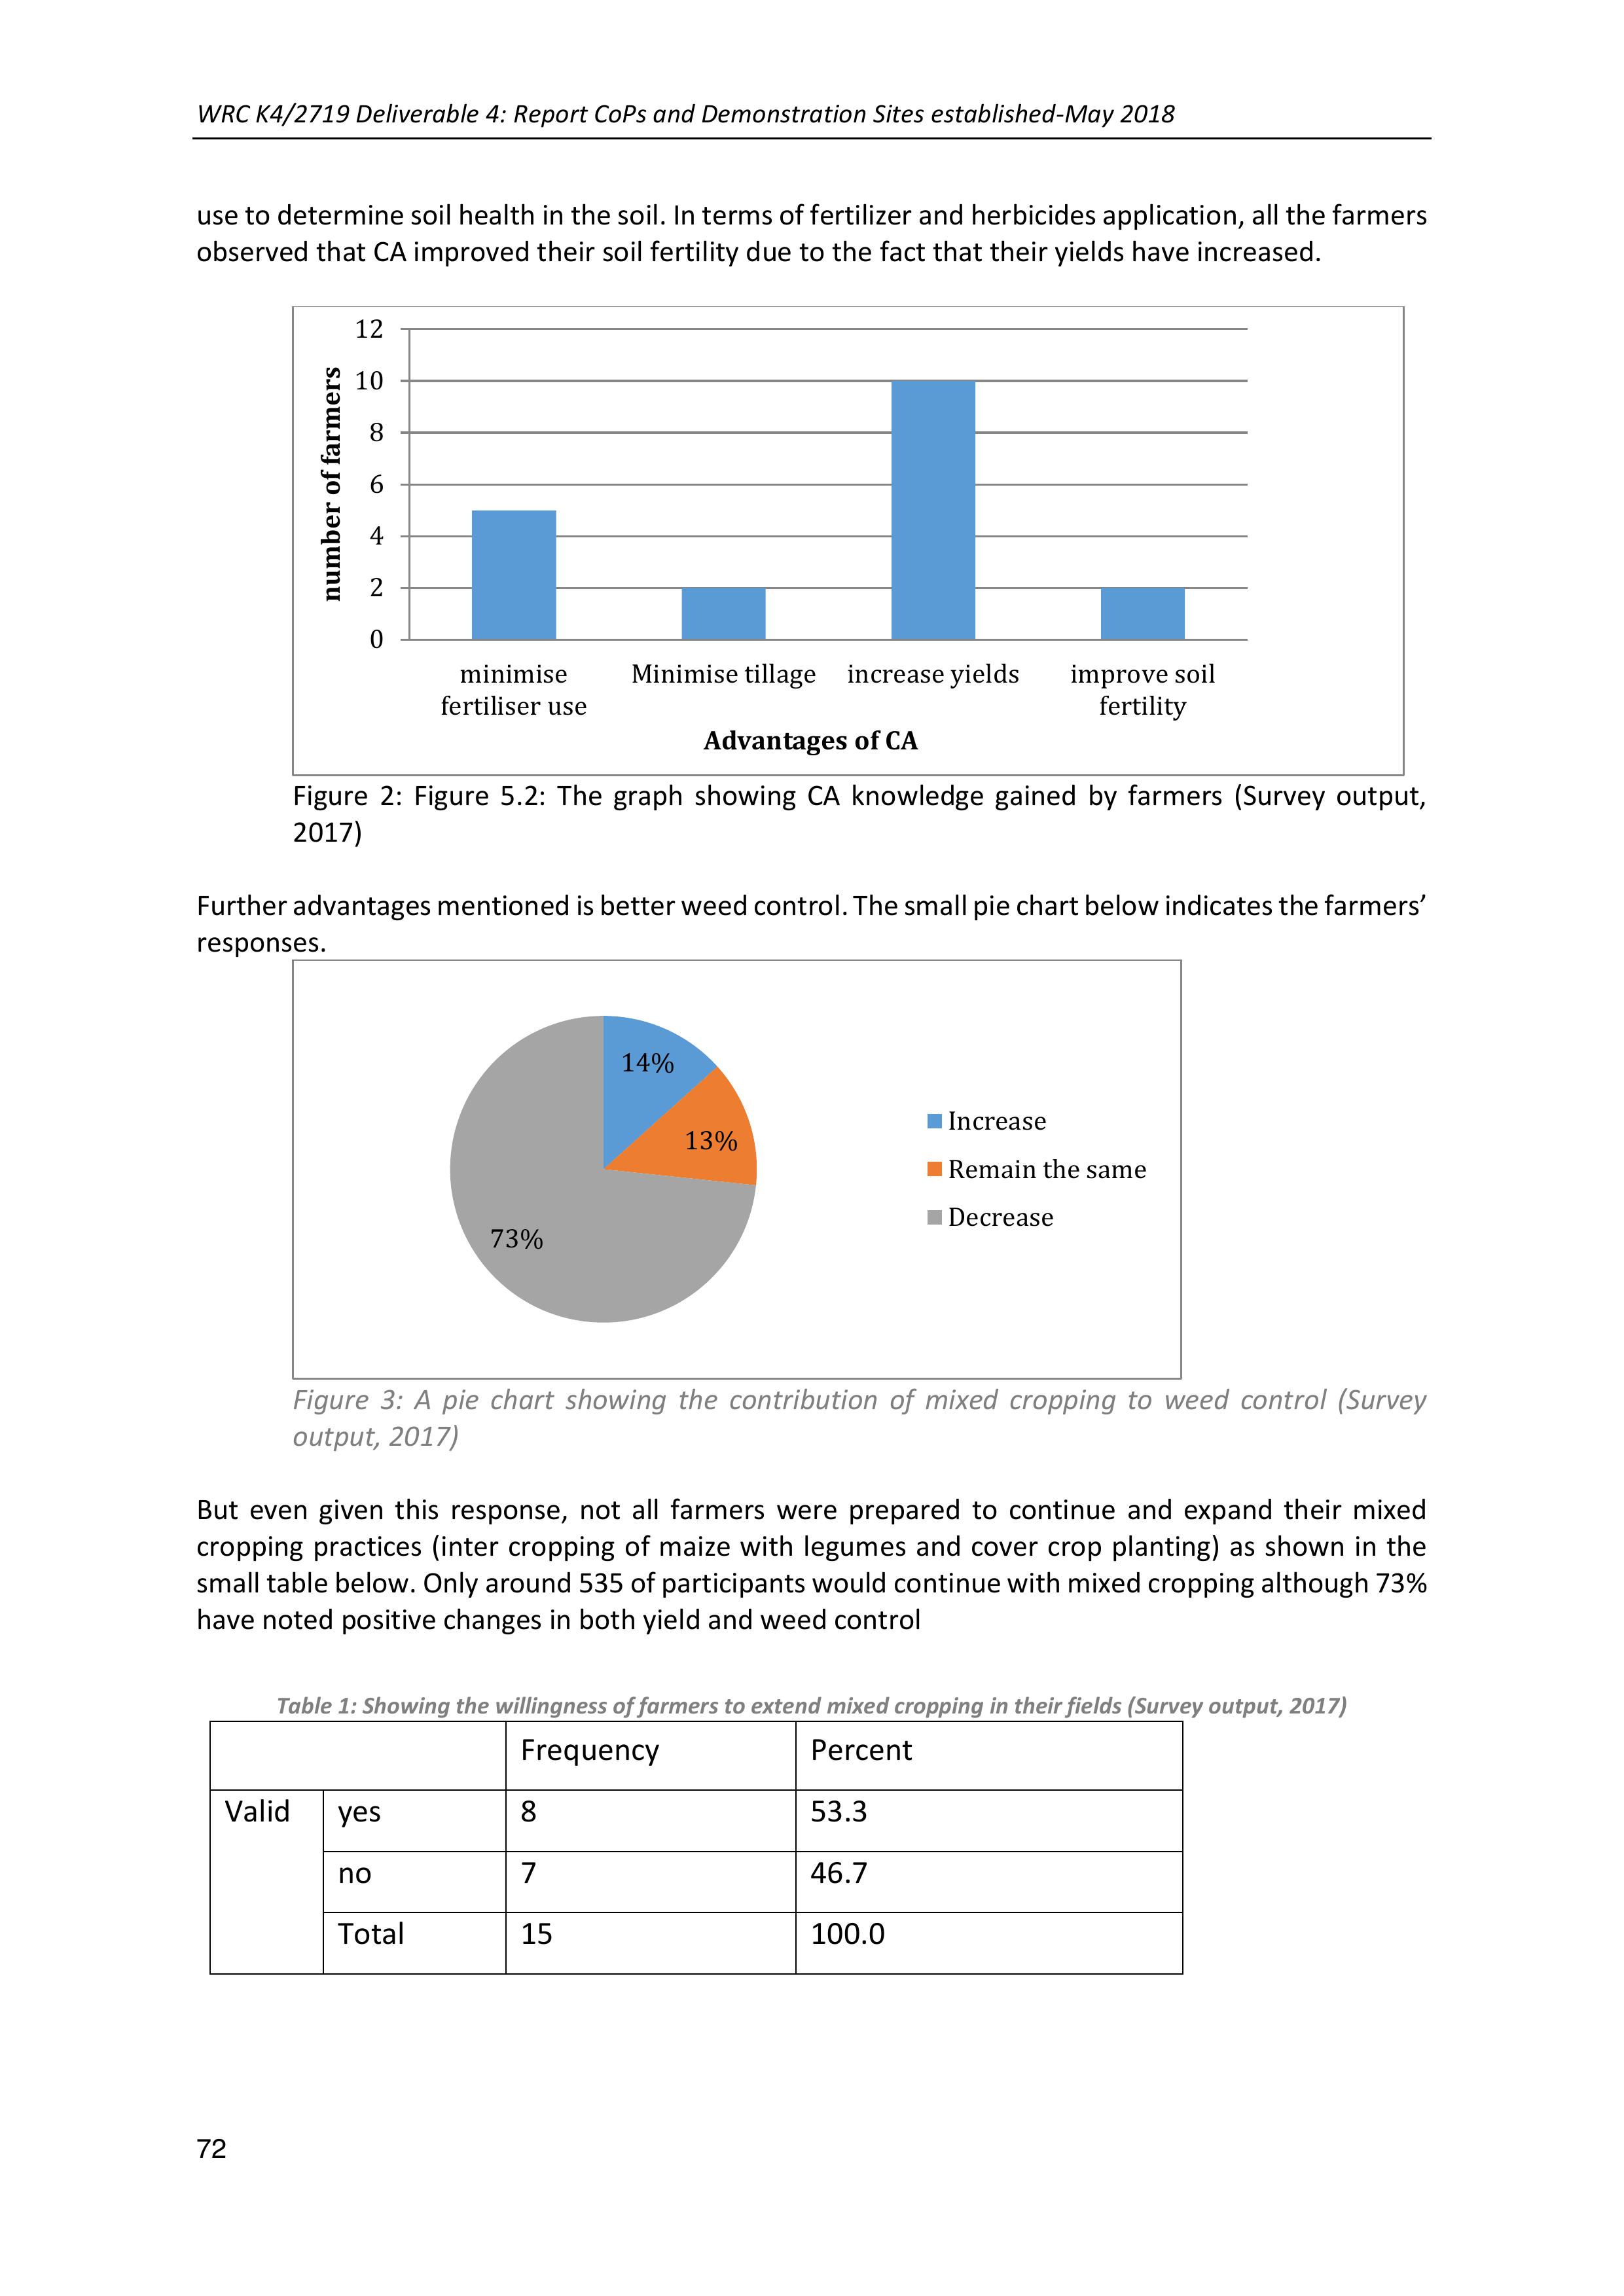
WRC K4/2719 Deliverable 4: Report CoPs and Demonstration Sites established-May 2018
72
use to determine soil health in the soil. In terms of fertilizer and herbicides application, all the farmers
observed that CA improved their soil fertility due to the fact that their yields have increased.
Figure 2: Figure 5.2: The graphshowing CA knowledge gained by farmers (Survey output,
2017)
Further advantages mentioned is better weed control. The small pie chart below indicates the farmers’
responses.
Figure 3: A pie chart showing the contributionof mixed cropping to weed control (Survey
output, 2017)
But even given this response, not all farmers were prepared to continue and expand their mixed
cropping practices (inter cropping of maize with legumes and cover crop planting) as shown in the
small table below. Only around 535 of participants would continue with mixed cropping although 73%
have noted positive changes in both yield and weed control
Table 1: Showing the willingness of farmers to extend mixed cropping in their fields (Survey output, 2017)
Frequency
Percent
Valid
yes
8
53.3
no
7
46.7
Total
15
100.0
0
2
4
6
8
10
12
minimise
fertiliser use
Minimise tillageincrease yieldsimprove soil
fertility
number of farmers
Advantages of CA
14%
13%
73%
Increase
Remain the same
Decrease
WRC K4/2719 Deliverable 4: Report CoPs and Demonstration Sites established-May 2018
73
She concludes that the selected farmers have a capability to maintain the practice of CA now and in
the future. Generally, the selected farmers have a better knowledge and skills of CA, indicating
likelihood that farmers can sustain the CA practice. Considering the principles of CA: minimum soil
disturbance, leaving soil residues and crop diversification, farmers indicated that they are
comfortable with these principles as they minimize the use of inputs, save time and reduce soil
erosion.
She recommended that further research needs to be conducted to find out communication
strategies that can be used to communicate new innovations, which are technology and knowledge-
intensive such as CA, to small-scale farmers who are not educated. More research needs to
conducted with farmers who have abandon CA, to find out more about factors which influenced this
decision.
Khethiwe’s Masters proposal outline
Research Topic
The contribution of Climate Smart Agriculture (CSA) practices in adapting to climate change: The
case of smallholder farmers in KwaZulu Natal.
The specific objectives are:
•To understand the historical experience regarding production calendar compared to current
situation.
•To assess the CSA practices that are currently can be employed by small-scale farmers in
response to the changes.
• To assess the factors influencing the selection of these practices
•To determine the benefits of employing CSA practices regarding climate change adaptation.
Research Methodology
The literature review will be conducted to guide the study through drawing researchable
relationships. Both qualitative and quantitative data will be collected and analyzed. Seasonal Map,
Timeline, Individual field visits, questionnaires and focus group discussions will be used to collect
data. The study will be conducted in Bergville and Ntabamhlophe of KwaZulu Natal. There are three
communities from Bergville which is Ezibomvini, Eqeleni and Thamela. There are two communities in
Ntabamhlophe, which is Good homes and Mdwebu community. A total number of 50 respondents
will be selected, 30 respondents from Bergville and 20 respondents from Ntabamhlophe. The study
will investigate small-scale farmers who are practicing a wide range of practices in their homestead
garden as a result of improving food security for households.
Mazwi Dlamini
Masters proposal outline and methodology.
Mazwi’s abstract for his proposal reads asfollows: “Subsistence agriculture continues to play a
pivotal role in rural areas across developing countries in the world as means to food production and
income generation. South Africa is no exception with white maize a staple food for more than 70%
of the population in the country and yellow maize mostly used for livestock feed, livestock is a big
part of smallholder agriculture (DoA, 2004). Maize plays a big role in South African diets contributing
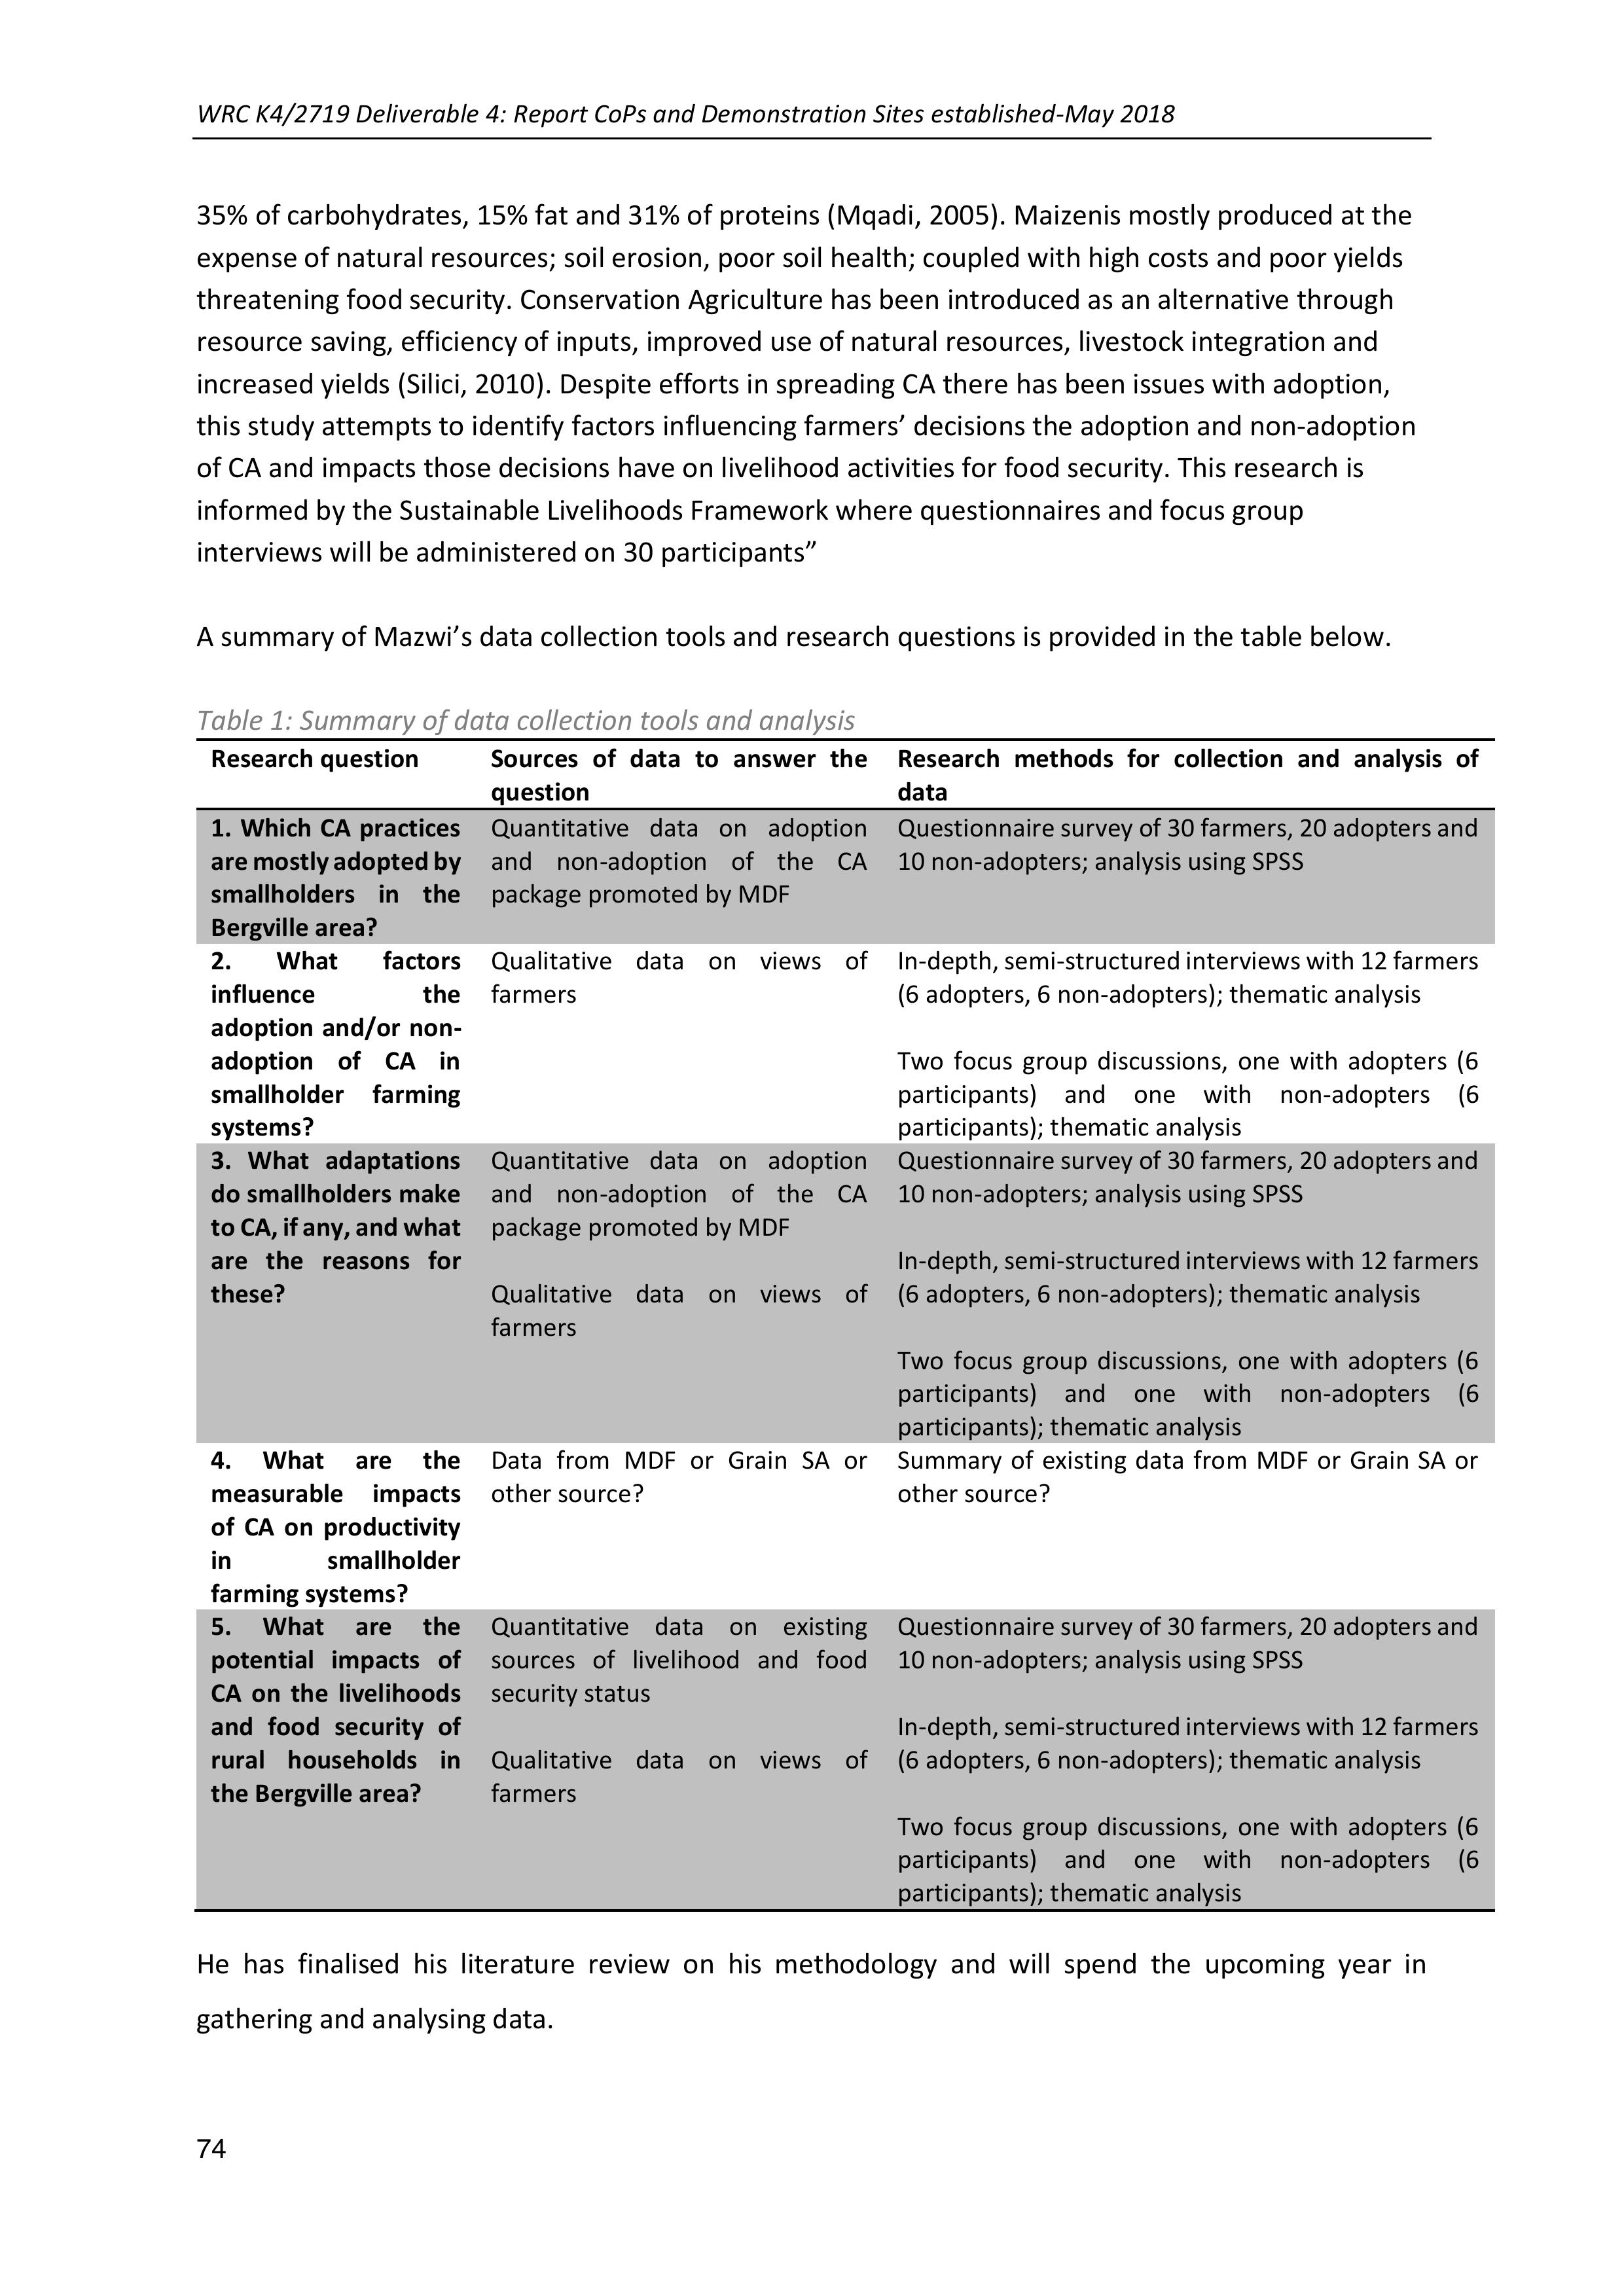
WRC K4/2719 Deliverable 4: Report CoPs and Demonstration Sites established-May 2018
74
35% of carbohydrates, 15% fat and 31% of proteins (Mqadi, 2005). Maizenis mostly produced at the
expense of natural resources; soil erosion, poor soil health; coupled with high costs and poor yields
threatening food security. Conservation Agriculture has been introduced as an alternative through
resource saving, efficiency of inputs, improved use of natural resources, livestock integration and
increased yields (Silici, 2010). Despite efforts in spreading CA there has been issues with adoption,
this study attempts to identify factors influencing farmers’ decisions the adoption and non-adoption
of CA and impacts those decisions have on livelihood activities for food security. This research is
informed by the Sustainable Livelihoods Framework where questionnaires and focus group
interviews will be administered on 30 participants”
A summary of Mazwi’s data collection tools and research questions is provided in the table below.
Table 1: Summary of data collection tools and analysis
Research question
Sources of data to answer the
question
Research methods for collection and analysis of
data
1. Which CA practices
are mostly adopted by
smallholders in the
Bergville area?
Quantitative data on adoption
and non-adoption of the CA
package promoted by MDF
Questionnaire survey of 30 farmers, 20 adopters and
10 non-adopters; analysis using SPSS
2. What factors
influence the
adoption and/or non-
adoption of CA in
smallholder farming
systems?
Qualitative data on views of
farmers
In-depth, semi-structured interviews with 12 farmers
(6 adopters, 6 non-adopters); thematic analysis
Two focus groupdiscussions,one with adopters (6
participants) and one with non-adopters (6
participants); thematic analysis
3. What adaptations
do smallholders make
to CA, if any, and what
are the reasons for
these?
Quantitative data on adoption
and non-adoption of the CA
package promoted by MDF
Qualitative data on views of
farmers
Questionnaire survey of 30 farmers, 20 adopters and
10 non-adopters; analysis using SPSS
In-depth, semi-structured interviews with 12 farmers
(6 adopters, 6 non-adopters); thematic analysis
Two focus groupdiscussions,one with adopters (6
participants) and one with non-adopters (6
participants); thematic analysis
4. What are the
measurable impacts
of CA on productivity
in smallholder
farming systems?
Data from MDF or Grain SA or
other source?
Summary of existing data from MDF or Grain SA or
other source?
5. What are the
potential impacts of
CA on the livelihoods
and food security of
rural households in
the Bergville area?
Quantitative data on existing
sources of livelihood and food
security status
Qualitative data on views of
farmers
Questionnaire survey of 30 farmers, 20 adopters and
10 non-adopters; analysis using SPSS
In-depth, semi-structured interviews with 12 farmers
(6 adopters, 6 non-adopters); thematic analysis
Two focus groupdiscussions,one with adopters (6
participants) and one with non-adopters (6
participants); thematic analysis
He has finalised his literature review on his methodology and will spend the upcoming year in
gathering and analysing data.

WRC K4/2719 Deliverable 4: Report CoPs and Demonstration Sites established-May 2018
75
Palesa Motaung
Masters proposal outline and methodology
Palesa’s hypothesis aims and objectives for her study are outlined below:
Hypothesis
Null Hypothesis:
CA is seen as a method that can build up or restore degraded soil. This process is known to
take 7 years. However, a mixed type of cover cropping system rotated with a cash crop may
shorten the entire process of rehabilitation and restoration to a period of 3 to four years
Alternative Hypothesis:
A leguminous inter-croppingsystem under yearly rotation may be as effective at increasing
the pace at which a multi-specie cover cropping system restores degraded soil.
Aims of the study
1.The aims of study are to determine the impact of inter-cropping sugar beans-maize
and cowpeas-maize on selected soil physical, chemical and biological properties as a
minimum data set
2.Assess the sensitivity of qualitative and quantitative soil quality indices to determine
overall soil health
Specific Objectives Include:
•To select the best combination of crops and management systems that can improve
soil physical properties
•To select the best combination of crops and management systems that can improve
soil chemical properties
•To select the best combination of crops and management systems that can improve
soil biological properties
The study spans across 8 villages all within the Bergville area. These villages were chosen because
they;
•Are all under the CA-Farmer Innovation Programme tointroduce CA to smallholder
farmers
•Are host to farmers who adopted CA either in 2014, 2015 or 2016.
•Are hosts to farmers who are practicingconservation alongside conventional tillage
on maize plots
•Are hosts to farmers who are inter-cropping maize with a legume (soybeans or
cowpeas) and rotating their plots yearly.
Within each village, farmers were selected who planted at least one plot of maize + beans, maize +
cowpeas and maize only plots in the 2016/17 year.
Treatments were chosen for the following reasons:
a)These were the treatments most widely practiced and available amongst the chosen
farmers; i.e. a high proportion of the chosen farmers planted 2/3 or 3/3 of the chosen
treatments in the previous planting season.
b)The chosen treatment allows us to investigate the CA practice of intercropping maize
and a legume versus the conventional practice of mono-cropping
c)An “uncultivated” soil sample will be taken adjacent to the cultivated plots which will
serve as a benchmark for the areas natural soil status.

WRC K4/2719 Deliverable 4: Report CoPs and Demonstration Sites established-May 2018
76
d)Information on whether the farmers have planted cover crops has also been collected
and it may be used to add insight into the possible findings on the soil status
The table below indicates her participant selection.
Table 1: participant selection and criteria
Conservation
Tillage
Convent
ional
Tillage
(control
)
Yield (t/ha)
Other
Treat
ments
Yea
r
Village
Farmer
m
+
b
m
+c
m
maize
undistur
bed
adjacen
t plot
maiz
e
(CA)
maize
(CT)
beans
cover
crops
201
4
Ezibomv
eni
Phumelele
Hlongwane
3
1
4
900m2
Yes
8.27
9.69
1.818
1
201
4
Ezibomv
eni
Nthumeni
Nkabinde
5
1
2
560m2
Yes
2.77
2.05
0.62
0
201
4
Mhlwazi
ni
Zimba
Mantombi
4
4
350m2
Yes
5.58
8
4.089
0.34
2
201
4
Vimbuk
halo
Sbongile
Mpulo
1
1
2
Yes
*515
kg
1.76
0
201
5
Ndunwa
Zondo
Matozo
2
1
1
600m2
Yes
3.79
1.9375
1.02
0
201
5
Stulwan
e
Getty Miya
2
1
1
Yes
1.39
*129.9
9 kg
0.48
1
201
5
Ngoba
Sebenzile
Hlongwane
1
1
810m2
Yes
2.95
0.34
0.22
1
201
5
Ndunwa
Shiwiye
Mazibuko
4
3
2
Yes
2.26
*109.2
kg
0.49
1
201
6
Ezibomv
eni
Ntombenhl
e
Hlongwane
2
2
Yes
5.82
167.2
kg
2.34
0
201
6
Ezibomv
eni
Mantombi
Mabizela
3
1
Yes
2.61
143.39
kg
5.64
0
201
6
Cornfiel
ds
Miya
Mdumeni
2
3
2236m2
Yes
0.27
1
1.34
0
0
201
6
Nsuka-
Zwelish
a
Busi
Hlatshwayo
2
2
Yes
4.76
109.83
kg
2.44
0
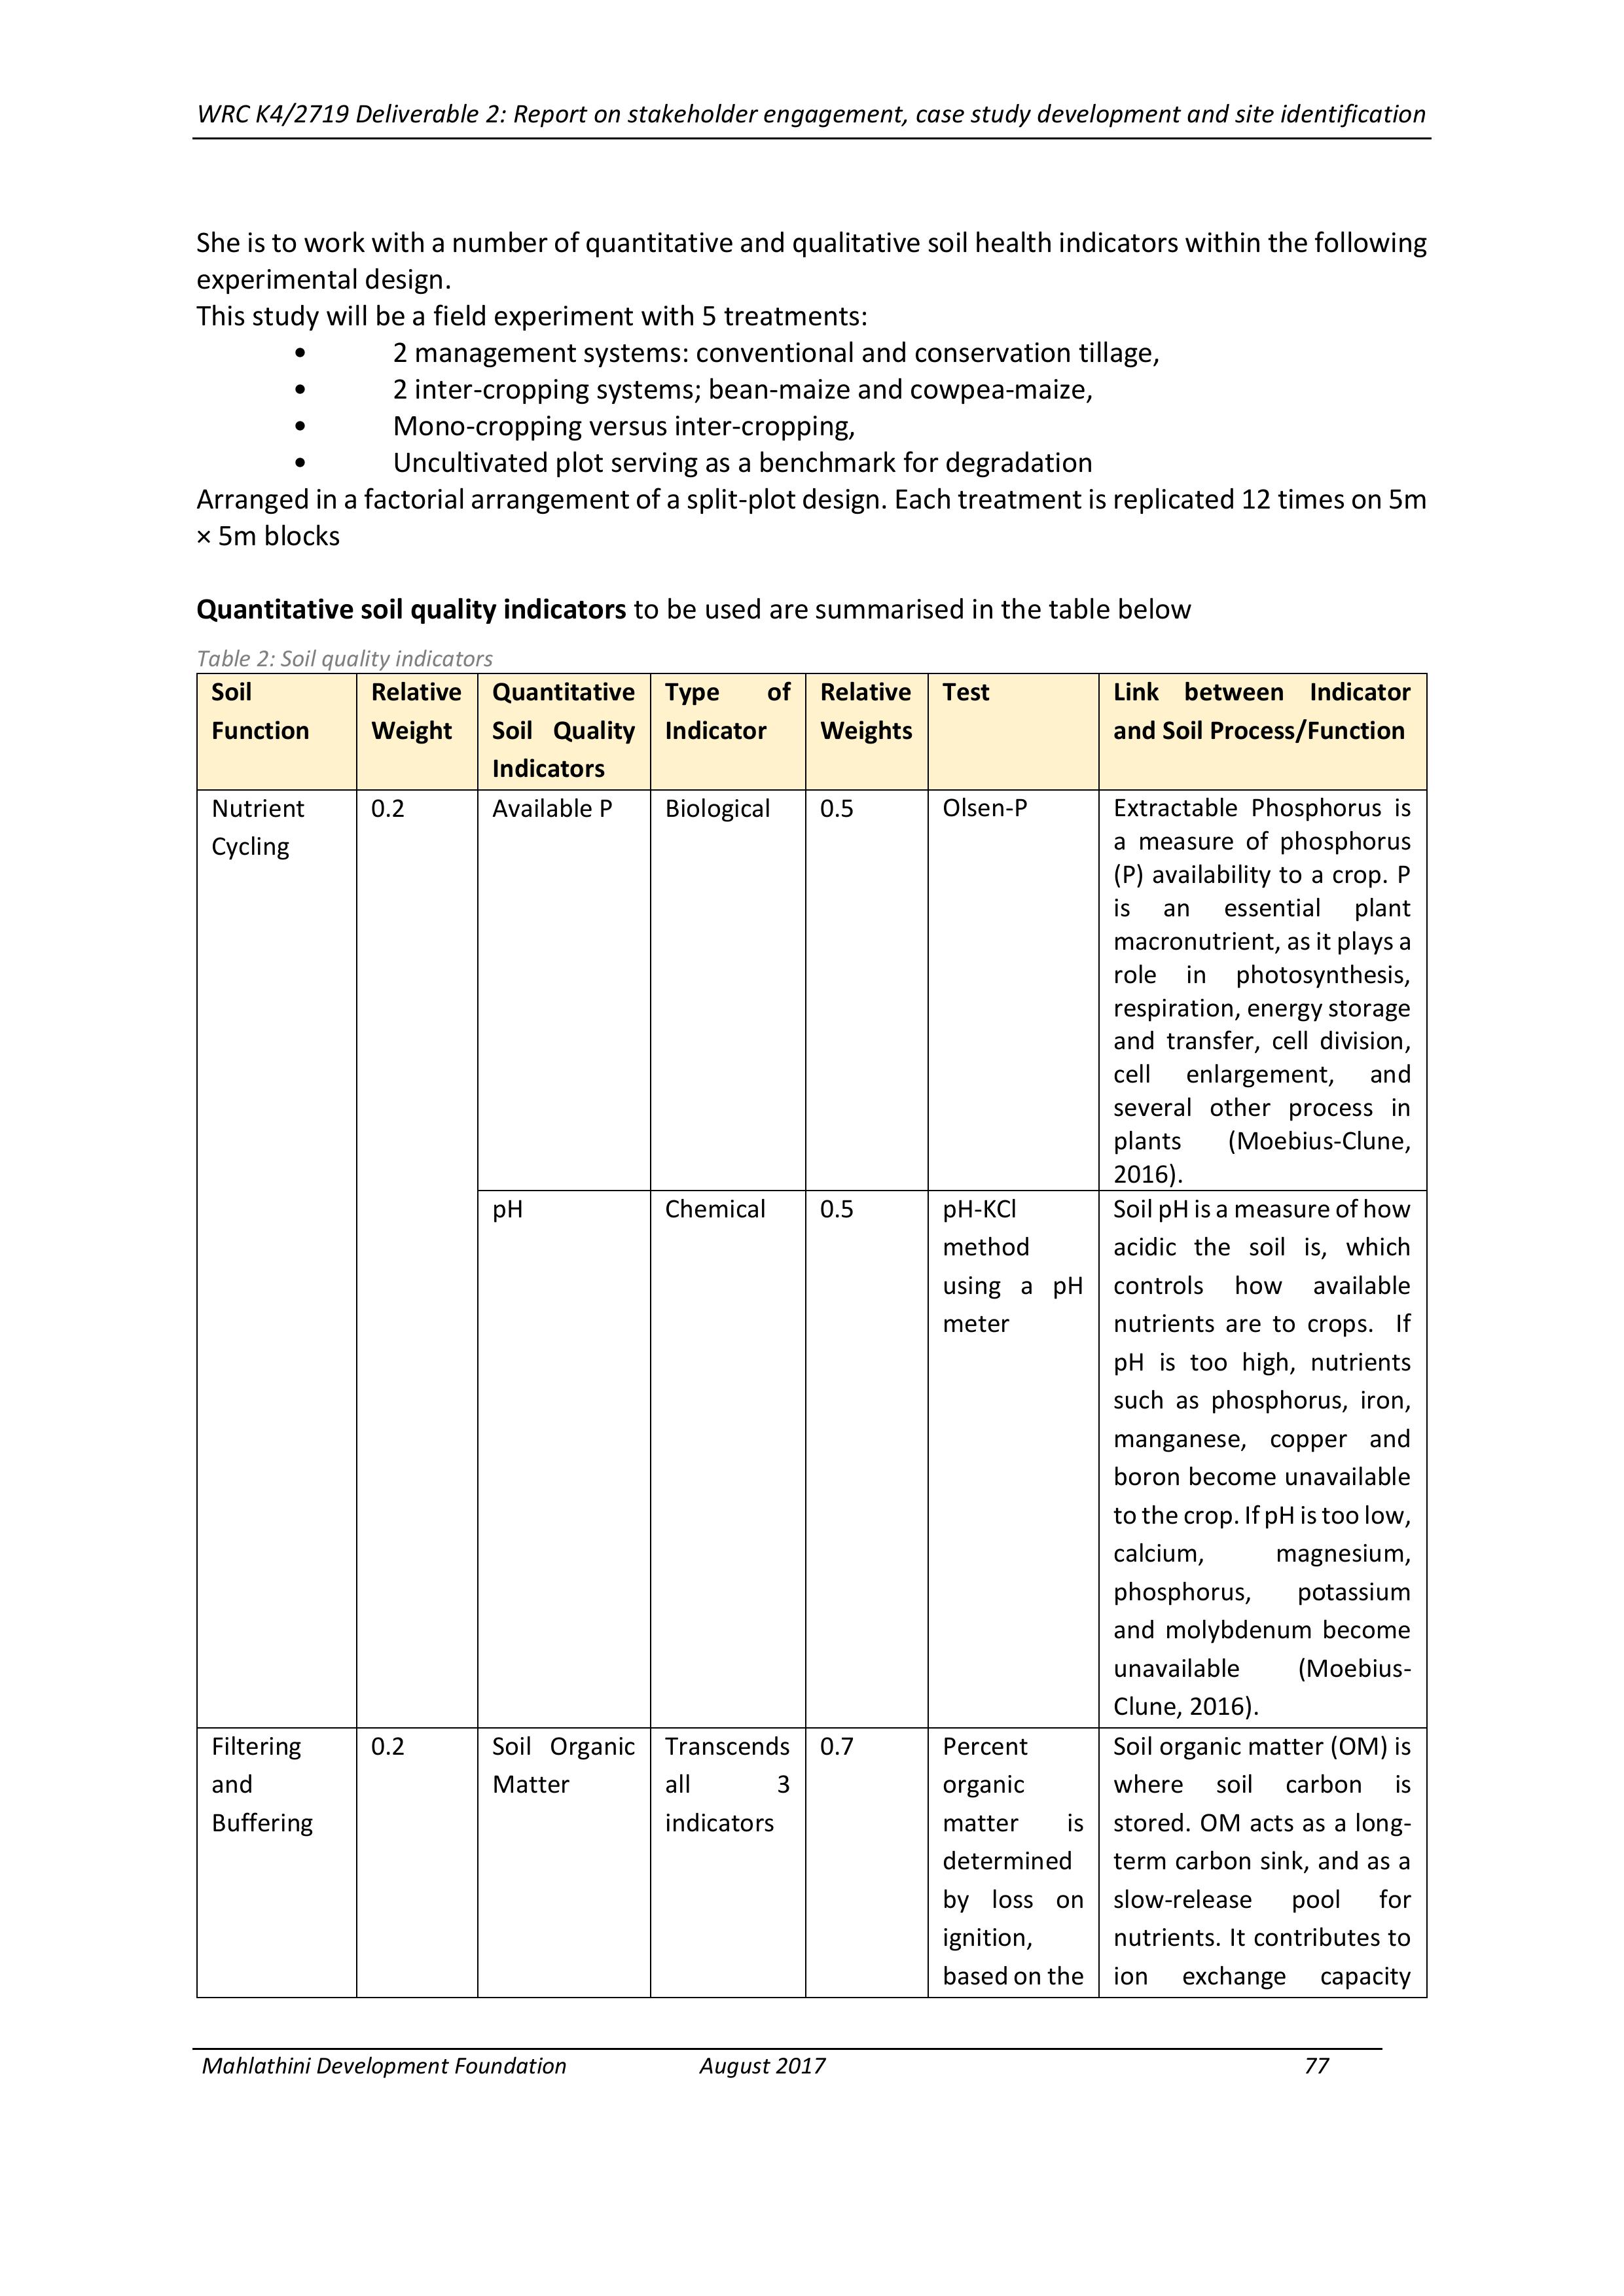
WRC K4/2719 Deliverable 2: Report on stakeholder engagement, case study development and site identification
Mahlathini Development Foundation August 201777
She is to work with a number of quantitative and qualitative soil health indicatorswithin the following
experimental design.
This study will be a field experiment with 5 treatments:
•2 management systems: conventional and conservation tillage,
•2 inter-cropping systems; bean-maize and cowpea-maize,
•Mono-cropping versus inter-cropping,
•Uncultivated plot serving as a benchmark for degradation
Arranged in a factorial arrangement of a split-plot design. Each treatment is replicated 12 times on 5m
× 5m blocks
Quantitative soil quality indicators to be used are summarised in the table below
Table 2: Soil quality indicators
Soil
Function
Relative
Weight
Quantitative
Soil Quality
Indicators
Type of
Indicator
Relative
Weights
Test
Link between Indicator
and Soil Process/Function
Nutrient
Cycling
0.2
Available P
Biological
0.5
Olsen-P
Extractable Phosphorus is
a measure of phosphorus
(P) availability to a crop. P
is an essential plant
macronutrient, as it plays a
role in photosynthesis,
respiration, energy storage
and transfer, cell division,
cell enlargement, and
several other process in
plants (Moebius-Clune,
2016).
pH
Chemical
0.5
pH-KCl
method
using a pH
meter
Soil pH isameasure of how
acidic the soil is, which
controls how available
nutrients areto crops. If
pH is too high, nutrients
such as phosphorus, iron,
manganese, copper and
boron become unavailable
to the crop. If pH is too low,
calcium, magnesium,
phosphorus, potassium
and molybdenum become
unavailable (Moebius-
Clune, 2016).
Filtering
and
Buffering
0.2
Soil Organic
Matter
Transcends
all 3
indicators
0.7
Percent
organic
matter is
determined
by loss on
ignition,
based on the
Soil organic matter (OM) is
where soil carbon is
stored. OM acts as a long-
term carbonsink, and as a
slow-release pool for
nutrients. It contributes to
ion exchange capacity

WRC K4/2719 Deliverable 2: Report on stakeholder engagement, case study development and site identification
Mahlathini Development Foundation August 201778
change in
mass after a
soil is
exposed to
high
temperature
(500°C or
932°F) ina
furnace
(Moebius-
Clune, 2016)
(nutrient storage), nutrient
cycling, soil aggregation,
and water holding
capacity, and it provides
nutrients and energy to
the plant and soil microbial
communities (Moebius-
Clune, 2016). SOC is one of
the most important
constituents of the soil due
to its capacity to affect
plant growthas botha
source of energy and a
trigger for nutrient
availability through
mineralization (USDA-
NRCS, 2009).
Electrical
Conductivity
Chemical
0.3
Electrical
conductivity
meter
EC does not directly affect
plant growth but has been
used as anindirect
indicator of the amount of
nutrients available for
plant uptake and salinity
levels (USDA-NRCS, 2011).
Physical
Stability
and
Support
0.2
Bulk Density
Physical
1.0
The
Cylindrical
Core
Method
(NCRS Soil
quality test
kit guide)
Bulk density is an indicator
of soil compaction. Bulk
density typically increases
with soil depth since
subsurface layers have
reduced organic matter,
aggregation, and root
penetration compared to
surface layers and
therefore, contain less
pore space (USDA-NRCS,
2011).
Biodiversity
and Habitat
0.2
Soil
Respiration
Biological
1.0
[Solvita -
CO2 Burst
Method]
A measure of the
metabolic activity of the
soil microbial community.
It is measured byre-
wetting air dried soil, and
capturing and quantifying
carbon dioxide (CO2)
produced (Moebius-Clune,
2016).

WRC K4/2719 Deliverable 2: Report on stakeholder engagement, case study development and site identification
Mahlathini Development Foundation August 201779
Water
Relations
0.2
Available
Water
Capacity
(AWC)
Physical
0.5
Soil porosity and
particularly macro-
porosity (the number of
large pores) influences the
movement of air and water
in the soil. Soils with good
structure havea high
porosity within and
between (USDA-NRCS,
2011).
Water stable
aggregates
Physical
0.5
Measurement of soil
aggregate stability gives a
useful index of the
susceptibility of the soil to
structural degradation and
visual assessment of the
soil profile isavaluable
method of assessing the
need for physical
remediation (Cameron et
al, 1998).
Qualitative soil quality indicators:
The farmers in Bergville who have adopted CA into their farming practices use a Visual Soil
Assessment Manual for Conservation Agriculture developed by Grain SA with Mahlathini
Development Foundation. The manual looks at properties such as soil type; soil crusting; soil
structure; porosity; depth; presence of mottles; presence of tillage pans and earthworm count. The
manual uses a score between 0 and 2. 0 indicates poor conditions while 2 indicates good conditions.
Table 3 below is a typical checklist found on the Mahlathini Visual Indicator manual.
Table 3: Mahlathini Visual Indicator checklist. Mahlathini Development Foundation
Visual indicator of Soil Quality
Visual Score (VS)
0 = Poor conditions
1 = Moderate conditions
2 = Good conditions
Weighing
VS Ranking
Soil Structure
X3
Soil porosity
2
Soil colour
2
Number and colour of soil mottles
1
Earthworm counts
2
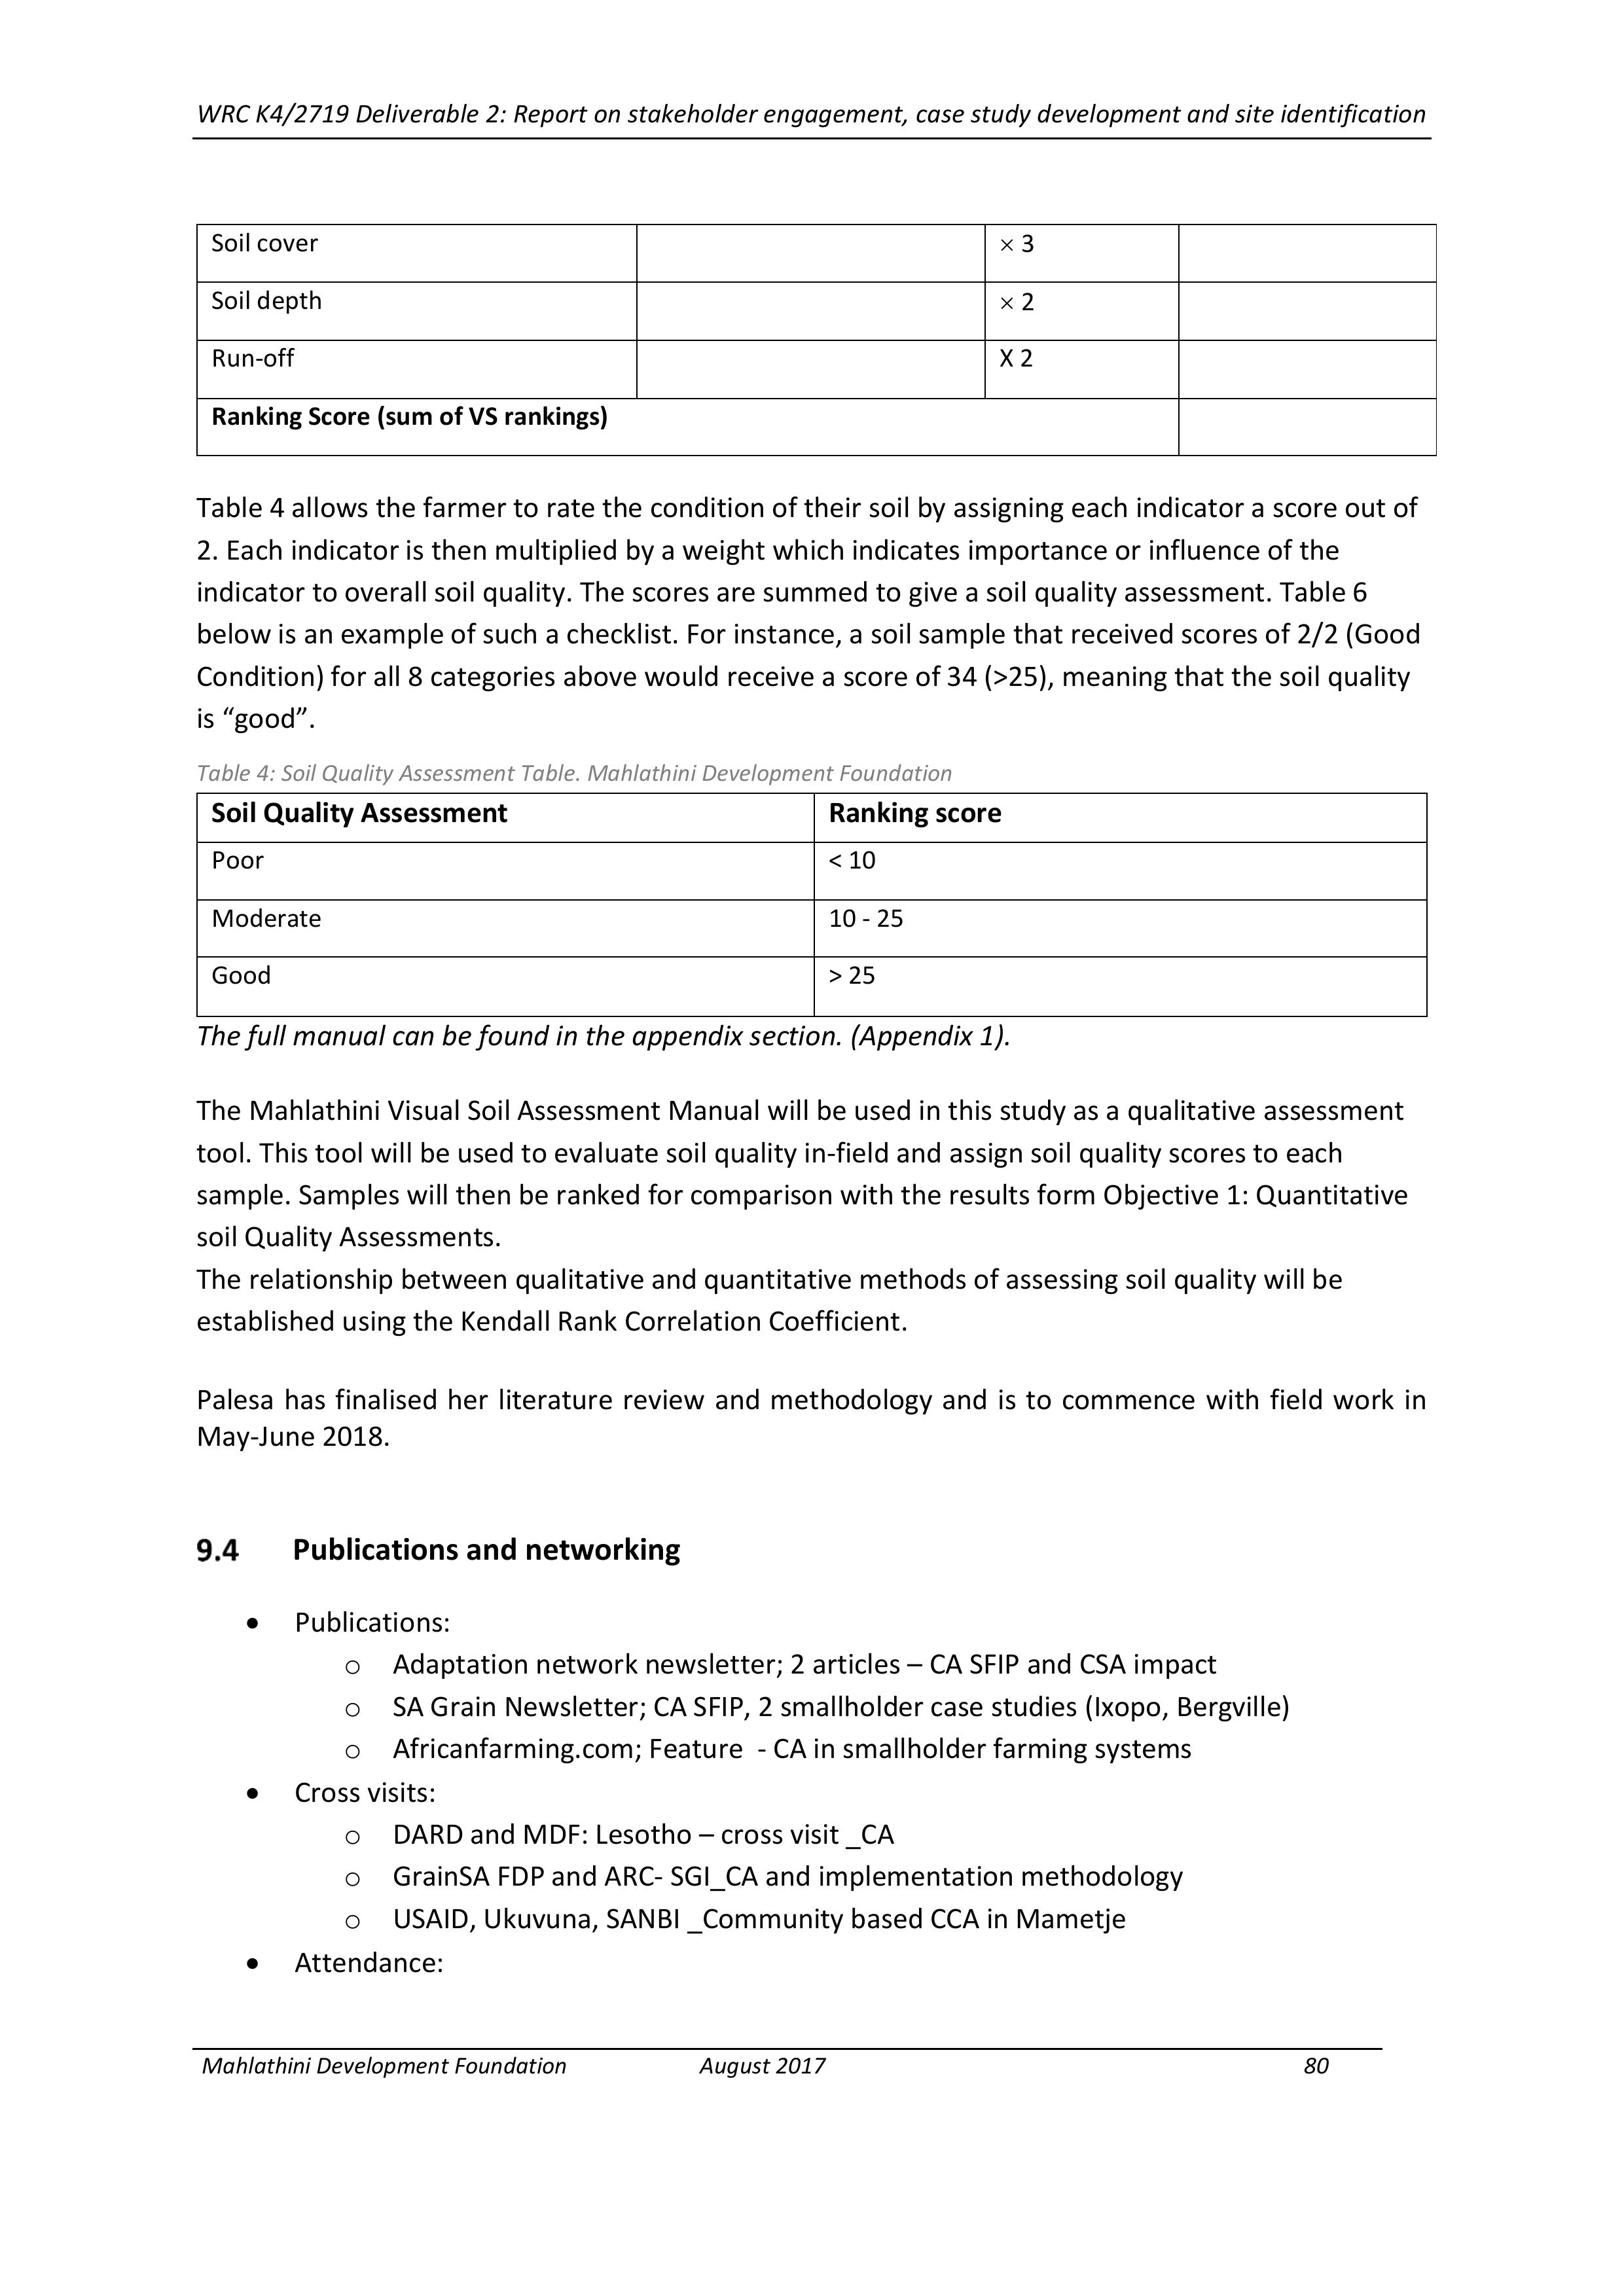
WRC K4/2719 Deliverable 2: Report on stakeholder engagement, case study development and site identification
Mahlathini Development Foundation August 201780
Soil cover
3
Soil depth
2
Run-off
X 2
Ranking Score (sum of VS rankings)
Table 4 allows the farmer to rate the condition of their soil by assigning each indicator a score out of
2. Each indicator is then multiplied by a weight which indicates importance or influence of the
indicator to overall soil quality. The scores are summed to give a soil quality assessment. Table 6
below is an example of such a checklist. For instance, a soil sample that received scores of 2/2 (Good
Condition) for all 8 categories above would receive a score of 34 (>25), meaning that the soil quality
is “good”.
Table 4: Soil Quality Assessment Table. Mahlathini Development Foundation
Soil Quality Assessment
Ranking score
Poor
< 10
Moderate
10 - 25
Good
> 25
The full manual can be found in the appendix section. (Appendix 1).
The Mahlathini Visual Soil Assessment Manual will be used in this study as a qualitative assessment
tool. This tool will be used to evaluate soil quality in-field and assign soil quality scores to each
sample. Samples will then be ranked for comparison with the results form Objective 1: Quantitative
soil Quality Assessments.
The relationship between qualitative and quantitative methods of assessing soil quality will be
established using the Kendall Rank Correlation Coefficient.
Palesa has finalised her literature review and methodology and is to commence with field work in
May-June 2018.
Publications and networking
•Publications:
oAdaptation network newsletter; 2 articles – CA SFIP and CSA impact
oSA Grain Newsletter; CA SFIP, 2 smallholder case studies (Ixopo, Bergville)
oAfricanfarming.com; Feature - CA in smallholder farming systems
•Cross visits:
oDARD and MDF: Lesotho – cross visit _CA
oGrainSA FDP and ARC- SGI_CA and implementation methodology
oUSAID, Ukuvuna, SANBI _Community based CCA in Mametje
•Attendance:
WRC K4/2719 Deliverable 2: Report on stakeholder engagement, case study development and site identification
Mahlathini Development Foundation August 201781
oRangeland Management learning exchange_UCPP_Matatiele
oRegenerative Agriculture_ GrainSA_Reitz
•Presentations:
oCA learning groups and farmer centres presentation –Ubuhlebezwe LM Agricultural
Forum, DRDLR (KZN), Umgungundlovu DM, GrainSA farmers days (x5)
oMadzikane stakeholder forum, Agroecology network, Unmovtho Buboni Learning
Network,
WRC K4/2719 Deliverable 2: Report on stakeholder engagement, case study development and site identification
Mahlathini Development Foundation August 201782