
Sokhulu baseline: September 2024.
The seven villages in the Sokhulu community, including twenty households from each village,
participated in the study by completing face to face surveys in May 2024.UKZN undertook the
survey, using a questionnaire designed jointly between the UKZN and MDF teams. The data from
the seven villages is presented collectively as the Sokhulu community area.
1.1OVERVIEW
84% of households have lived in the area for more than 30 years with a very small percentage
93%) of people who lived there for less than 5 years. This indicates a stable community, despite
the inux of people into the area for work in the mining and forestry operations in the area.
Community members like living in the area for farming (51%), nature (28%), peace and ubuntu
(26%), the safety and lack of crime (12%), for rewood (11%), and for the sports in the area (8%).
The results show an emphasis on harvesting of natural resources for livelihoods in the northern
region and an emphasis on farming in Sokhulu.
The main development challenges mentioned were bad roads and poor infrastructure (60%),
lack of availability of water (43%), and inequality in the area in terms of distribution of benets
(22%). Poverty, the closure of the river mouth and the fencing of gardens were also raised as
issues. Community members also raised the need for business opportunities and skills
development, the provision of services, including water, electricity, schools and healthcare as
well as an improved internet network, the removal of mining companies and a reduction in the
planting of gumtrees, they require dip for livestock, need to reduce crime, and want the equal
distribution of RDP houses. Waste collection and poor waste management was raised as a
challenge in the area.
From the survey, households had an average income of less than R3000 - R4000 per month.
Given that most households are larger than average (Ave 7,8), the per capita income is low.
Based on money spent on food, most households in the region live below the food poverty line
and the general
poverty line.
However,
households
supplement their
food baskets
signicantly from
resources
collected from the
environment (land
and sea). The
picture alongside
indicates the high
reliance on shop
bought food in
Sokhulu (100%), followed by food produced locally (~70%), marine harvesting ((43%) and
school feeding schemes (40%).

76% of household members are aware of climate change, referring to extreme weather
conditions (27%), uctuation in weather patterns (24%), temperature and heat increases (6%),
thunderstorms being much worse than before (5%), and ooding (5%). It is evident in Sokhulu
that the main impacts of climate change are felt in relation to loss offarming potential, through
land and elds damaged by oods, variable rainfall and droughts and the loss of trees, which is
a valuable natural resource, through storms. Other points raised by communities are the
reduction in shade due to loss of trees, loss of life in extreme weather events, roads are
aected, livestock is damaged, and there is no longer enough grass for grazing.
The Sokhulu community is currently not acting proactively to manage climate change
specically (64%), as they lack knowledge about how to deal with climate change (8%). Some
respondents said that they try to plant more trees and conserve nature (7%), they avoid building
next to rivers (3%) and some have stopped farming on their elds (2%), as an adaptation to
climate change. They did not identify deliberate actions being taken by households to increase
agricultural resilience to climate change. Certain practices, including the use of manure as an
organic fertiliser and the selection of crop species suited to local temperature and rainfall
conditions, have been widely implemented. These are not new practices, and have been
adopted to reduce input costs, crop mortality, and enhance yield per unit eort. Communities
have therefore been responding to changing environmental conditions over time. However,
given their awareness of climate change and its impacts, it is evident that knowledge
development and tried and tested practices in response to climate change require attention in
the Sokhulu area.
Community members believe it is important to protect the environment as it gives life (36%), for
future generations and sustainability (20%), it provides food (18%), it provides shade (9%) and
clean air (9%). Respondents stated that because Richards Bay Minerals cuts trees and pollutes
the air, it is very important for them to protect nature to counter this impact.
Respondents reported the following ecosystem goods and services:
•shing and harvesting of mussels (15%)
•wood for building houses and kraals (20%)
•grass for roong and reeds for weaving (5%)
•trees for rewood (36%)
•food (vegetablesand fruits) (13%)
•medicinal purposes and cleansing (26%)
•shade from trees (10%)
The environment supports livelihoods in Sokhulu withthe environmental wage being valuable to
between 20% and 36% of households in dierent ways, which is signicant.
1.2SOCIO-ECONOMIC ASPECTS
In the baselines survey undertaken, 20 households were interviewed in May 2024 in the
following seven villages: eHlawini, eHlanzeni, kwaNtongonya, Ethukwini, eMalaleni,
kwaManzanyama and kwaHolinyoka.
DEMOGRAPHICS

Male and female headed households are reasonably evenly balanced at 49% and 53%
respectively. This is somewhat higher than the national average for 2022 of 45,7% female
headed households in rural KZN. (StatsSA, 2022).
The average household size for the village is 7,8, compared to the national average of 3.4,with
households ranging from between 3-25 individuals. The dependency ratio for these households
is extremely high.
In terms of age, the population in Sokhulu is skewed signicantly towards the age group of
0-18 years.
Age group in years
StasSA %
Sokhulu %
0 -18
28,8
45
19-34
35,1
30
35-59
27,1
20
>60
9
5
The large proportion of children under the age of 18 years in this area is likely a combination of
the community being well settled in the region (little in or out migration) as well as access to
services such as healthcare and schools (specically high schools). This diers signicantly
from the northern villages inside the IWP, where the proportion of children under 18 years is
much lower.
1.3INCOMES AND LIVELIHOODS
Of the 140 households interviewed 138 households (95%) fall below the national poverty
line (R1558/month/capita income). This is because the households have on average 7,8
members and are quite large. This number is skewed by a small percentage of very large
households as reported by respondents. If this is taken into account, then around 66% of
households fall below the poverty line. This is more reasonable when compared with other data,
showing quite a high degree comparatively, of formal employment in the region as well as small
businesses and self-employment.
Income range in Rands
No
Percentage
Cumulative percentage
0-1000
3
2,2
2,2
1001-2000
29
21,0
23,2
2001-3000
29
21,0
44,2
3001-4000
23
16,7
60,9
4001-5000
4
2,9
63,8
5001-6000
9
6,5
70,3
6001-7000
7
5,1
75,4
7001-8000
1
0,7
76,1
8001-9000
4
2,9
79,0
9001-10000
6
4,3
83,3
>10 000
23
16,7
100,0
Total
138
98,6
100,0
The following income categories were mentioned by the participants – own business and small
businesses were considered dierent categories. Own business included farming, forestry
taxis, transport and similar businesses while small businesses were more along the lines of

spazas, resale of clothes and meat and similar activities. A proportion of the community makes
a reasonably substantial income from both farming and forestry (contracted to SAPPI).
Income categories
No of hh (n= 140)
No of individuals
% individuals
Formal employment
31
40
6%
Contract workers
56
56
9%
Own business
28
28
5%
Small business
30
32
5%
Social grants
132
313
94%
Unemployed
124
318
51%
The unemployment rate is very high in this area, indicating that around 88% of households have
unemployed adults living there and 51% of working age adults are unemployed. Levels of
unemployment are much higher than the national average of 32,9% (StatsSA,2024).
Reliance on social grants (pensions and child grants) as an income source is very high, with 94%
of households receiving grants. A number of households mentioned that they receive
remittances from family members who do not live in the area.
Food shortages are common, with 93% of households mentioning that they experience a
shortage of food. Shortages are experienced for some households during winter (40%),
summer (67%) and throughout the year for 9% of households.
1.4AGRICULTURE
Agriculture in the form of cropping and livestock husbandry is extensively practiced across
Sokhulu, albeit at dierent scales. Around 71% of households undertake cropping in gardens
(more intensive with some irrigation) and dryland elds which are largely in the ood plain.
Access to elds in the roughly 400ha of cropping elds on the ood plain is open to all 7 villages,
and access is generational, with a growing rental market as all land has been claimed over the
years, but notall families use their allocations on an ongoing basis.
The table below summarises the extent of agricultural activities in Sokhulu
Table 1: Extent of agricultural activities across Sokhulu, May2024 (n=140)
Activity
% of HH
Units
Comments
Gardens
68% (31% male,
37% female)
100m2-
1000m2
gardens are either quite small and at homestead level or
further away in wetland areas or the ood plain
Fields (ood
plain)
22% (9% male,
13% female)
1ha plots
Fields are in 1ha portions, where farmer mostly have
between 1 and 3 elds.
Fruit
production
19%
1-4 trees per
household
and ~20-100
at eld level.
Trees include oranges, naartjies and bananas – grown at
scale in the ood plain and trees such as avocadoes,
mangoes and lemons planted more frequently at
household level.
Poultry
35%
Ave 14
chickens
Poultry consists of traditional chickens which roam freely
as well as small production units of broilers. Keeping of
layers is not common.
Goats
25%
Ave 12 goats
Goats roam freely, some homesteads have kraals but not
all
Livestock
25%
Ave 10 cattle
(2-50)
Cattle roam freely. Herders are employed. There is conict
in the community from cattle invasion into elds and
gardens.

Crops commonly grown in the area are shown in the table below in decreasing percentages.
Interestingly participants who indicated ‘none’ as their crops, are those whose elds have been
inundated due to the back ooding from the closure of the mouth some eight years ago. This
gives an estimation of the lost elds as being around 23% of the total area. Sweet potatoes,
amadumbe and cabbages are the most common crops grown. In the dryland elds (on the ood
plain) the most common crops grown are
sugar cane, sweet potatoes, amadumbe,
beans,
maize and bananas. It is clear form the
crop choices that farmers in the area
have adapted to cropping in these
wetland conditions with cyclical ooding
and water logging. Crops such as
amadumbe and bananas are planted in
the wetter areas of the elds and can
withstand high levels of water logging.
Irrigated crops consist of the vegetables
such as cabbages, spinach, onions,
lettuce, carrots, beetroot and tomatoes.
Below are a few indicative pictures of farming in the oodplain
Figure 1: Above left: A typical dryland eld in the ood plain planted to sugarcane and bordered with bananas and
Above right: Smaller fenced garden in the lower lying areas, close to sources of water producing crops such as sweet
potatoes, beans, cabbages and onions.
Add pics and examples
CROP
Percentage of respondents
Sseet potatoes
50
cabbage
43
amadumbe
39
spinach
30
onion
27
lettuce
22
None
23
potatoes
19
maize
18
green pepper
14
carrot
14
beetroot
14
tomatoes
12
oranges
10
naartjies
8
sugar cane
8
banana
6

1.5INFRASTRUCTURE
Uncontrolled development and haphazard management of small-scale gum plantations in the
area and these in addition to climate change impactshave led to a drastic decrease in in the
groundwater as well as wetland areas (around 36% reduction) in the last decade.These issues
combined with the RBM mining
and dunes, which has changed
the water ow and
management of the entire area
has had the outcome of
inundation of lower lying areas
leaving some homesteads and
elds under water, with a
drying out of the higher lying
areas with too little access to
water and drying out of
boreholes there.
Figure 2: A typical view of the poorer homesteads in the area. People have come into the area from as far as Manguzi
due to the work opportunities provided through the mines and the timber industry.
Figure 3: A view of a typical homestead in Sokhulu surrounded by a patchwork of gum plantations. In the foreground a
small swamp has formed close to the homestead, a trend that has increased in recent years, thought to be due at
least in part to the huge RBM dunes channelling water into this area both underground and as runo from the dunes.
The ’hill’ in the background is a large, rehabilitated mining dune.
Given that the communities in Sokhulu have access to livelihoods options such as small scale
forestry, eld cropping and livestock, which has provided for a reasonable and in some cases
substantial income for a proportion of the households and that these communities have
ongoing development support (however badly managed) through RBM, the Umfolozi LM and the
Department of Agriculture, the overall situation in terms of livelihoods and poverty here diers
somewhat from villages inside the IMPA. Basic service provision through roads, electricity and
sanitation is more evident in thearea.

The graph below summarises infrastructural considerations in Sokhulu.
As shown in the types of services graph below the following further dierentiation in service
provision can be made:
•Although access to electricity it available to the whole of Sokhulu (97%), use is limited
to around 84% of the community. Use of rewood for both cooking and light is equally
common (88%) and community members also use gas (21%) and parain (7%) for
appliances such as fridges and stoves. Firewood is cut locally from the numerous
plantations surrounding the homesteads and natural bush and forests.
•Water access of 35% at household level relates to access to taps in household yards
(22%) and 10% of households having JoJo tanks for rainwater harvesting. The 63%
without access to water at household level are likely to have some access through
communal standpipes or having to rely on water provision through Municipal water
tankers. In community meetings held the issue of lack of access to water was raised as
an immediate and important concern. It appears that some small borehole dependent
water schemes reticulated to communal standpipes have run dry and that provision of
water by the municipality in these cases has been very intermittent.
•Toilet access of 97% relates pit latrines, either supplied through the municipality,
development projects or home built. Only 3% of households have access to waterborne
sewage – the assumption here is that these household have their own septic tanks, as
there is no sewage network or treatment in the region.
•With respect to housing, 29% of households have had support from government in the
form of RDP houses. This signies a large state intervention in housing support for the
Sokhulu community as this percentage of support is considered substantial when
compared to other rural communities both in the region and in rural areas of KZN more
generally.
•There is no municipal solid water collection process in Sokhulu.
•Cell phone reception in the area is limited with only 34% of community members being
bale to access networks such as Vodacom and MTN.
•With respect to roads, 59% of respondents mentioned that access is provided by gravel
roads and the other 41% responded that there were no roads. Away from the long
stretch of unpaved road providing access into Sokhulu (which is not in a good
condition), the smaller tracks in and around villages have been made by locals for
Electricity
Water in
household
or yard
Toilets RDP
Houses
Waste
collection
Network
connection Roads
Available 97 35 97 29034 56
Not available363 367 98 66 41
0
20
40
60
80
100
Percentage
Access to services

access to surrounding bush and plantations as well as the oodplain. These tracks
haven’t been oicially graded but are rough approximations of roads made through use.
Due to the sandy nature of the region, these can quickly become impassable when
used by heavy vehicles such as tractors with trailers and also whenwet.
The access to services is also reected in the development needs and priorities mentioned by
respondents, as shown in the graph below.
Respondents focused on the need for reliable access to drinking water, job opportunities,
roads, education and opening of the river mouth. A thread passing through all these requests is
the need for equity in provision of services.
1.6SOCIAL ORGANISATION
The proportion of respondents who belong to social groups/organisations is limited to 38%. Of
these the following groups are active in these villages:
33%
Burial societies
72%
Stokvels
21%
Church groups
Eskomtank TapPit
toilets
water
toilets
Govern
ment
self
built All Vodaco
mMtn gravel
Electricity WaterToiletsHouseNetworkRoads
Series1 9710 22 94329 49 17 11 59
0
20
40
60
80
100
Percentage
Types of services
7
60 43
12 715 22
0
10
20
30
40
50
60
70
80
90
100
Percentage
Main development challenges

5%
Women’s groups
Similar to other rural areas, the larger proportion of women belong to these groups and us these
social organisations to provide economic and social safety nets for themselves and their
families.
Both the Local Municipality and the Traditional Councils (TCs) are important in Sokhulu for
access to services and development and conduct meetings in the community which are
reportedly well attended. Development and farming committees are linked to the TCs. Despite
strongparticipation and reliance on these institutions only around 43-56% of respondents felt
that they could trust these institutions. A typical explanation from these community members
revolves around the need of the community to be involved in decision-making, equity across
villages and community members in terms of benet from services and projects and the need
for these leaders to provide feedback and information to community members.
1.7NATURAL RESOURCE MANAGEMENT
Human intervention has substantially impacted on the ecosystems of this ood plain, primarily
through vast expanses of gum plantations (commercial forestry commenced here around 1933),
sugar cane (started around 1959) and dune mining (RBM started these operations in 2004), the
longer-term impacts of which are now becoming evident through both a substantial reduction in
the groundwater and water quality issues in the area and the consequences of channelisation
of the local rivers – the latter which has also impacted heavily on coastal and mangrove
ecosystems and the loss of wetlands.
The Sokhulu traditional council area is based at the southern tip of the Isimangaliso Wetland
Park, with only the previous eMapelani Reserve area incorporated into the reserve itself, a point
that is seemingly not well understood by either the TC or the community members. This area is
further north towards the coast with the conuence of the St Lucia estuary and the Umfolozi
and Umsunduze rivers and is not populated, as people were removed from there when the
Wetland Park was formed in the late 90s’. The Sokhulu villages/isigodi that abut on this area are
Ehlanzeni and Ehluwini, where the Sokhulu Traditional Council oice is housed.
In the past, prior to the establishment of the IWPA, tourism activities created some income for
the broader community. The eMapelani Reserve area is one of the 14 odd land claims that have
been lodged against the park. At the same time, the Sokhulu community trust is beneting from
an annual payment from the reserve. Funds from this payment is meant to support the fenced
communal crop lands (roughly ~200ha) on the oodplain, supporting with tractors for
ploughing, input subsidies and transport of produce from the plain to collection points in the
villages higher up. Presently this committee is under review for misuse of these funds.
Community members have an understanding of their impact on the environment, with close to
90% of respondents feelingthat it is important to protect the environment. All community
members use local resources for grazing of livestock, harvesting reeds and medicinal plants,
harvesting wood (building and rewood) as well as marine resources (shing and coastal
harvesting), mainly for food. As mentioned agricultural production is common in the area.
The largest land use, which covers the vast majority of the area is gum plantations, as shown in
the google earth snapshot of eHlanzeni and the tribal court below, as an example. There are
small cleared areas around homesteads, but the vast majority of the land is covered by
plantations, natural forest/bush patches and small localised bogs and wetlands.
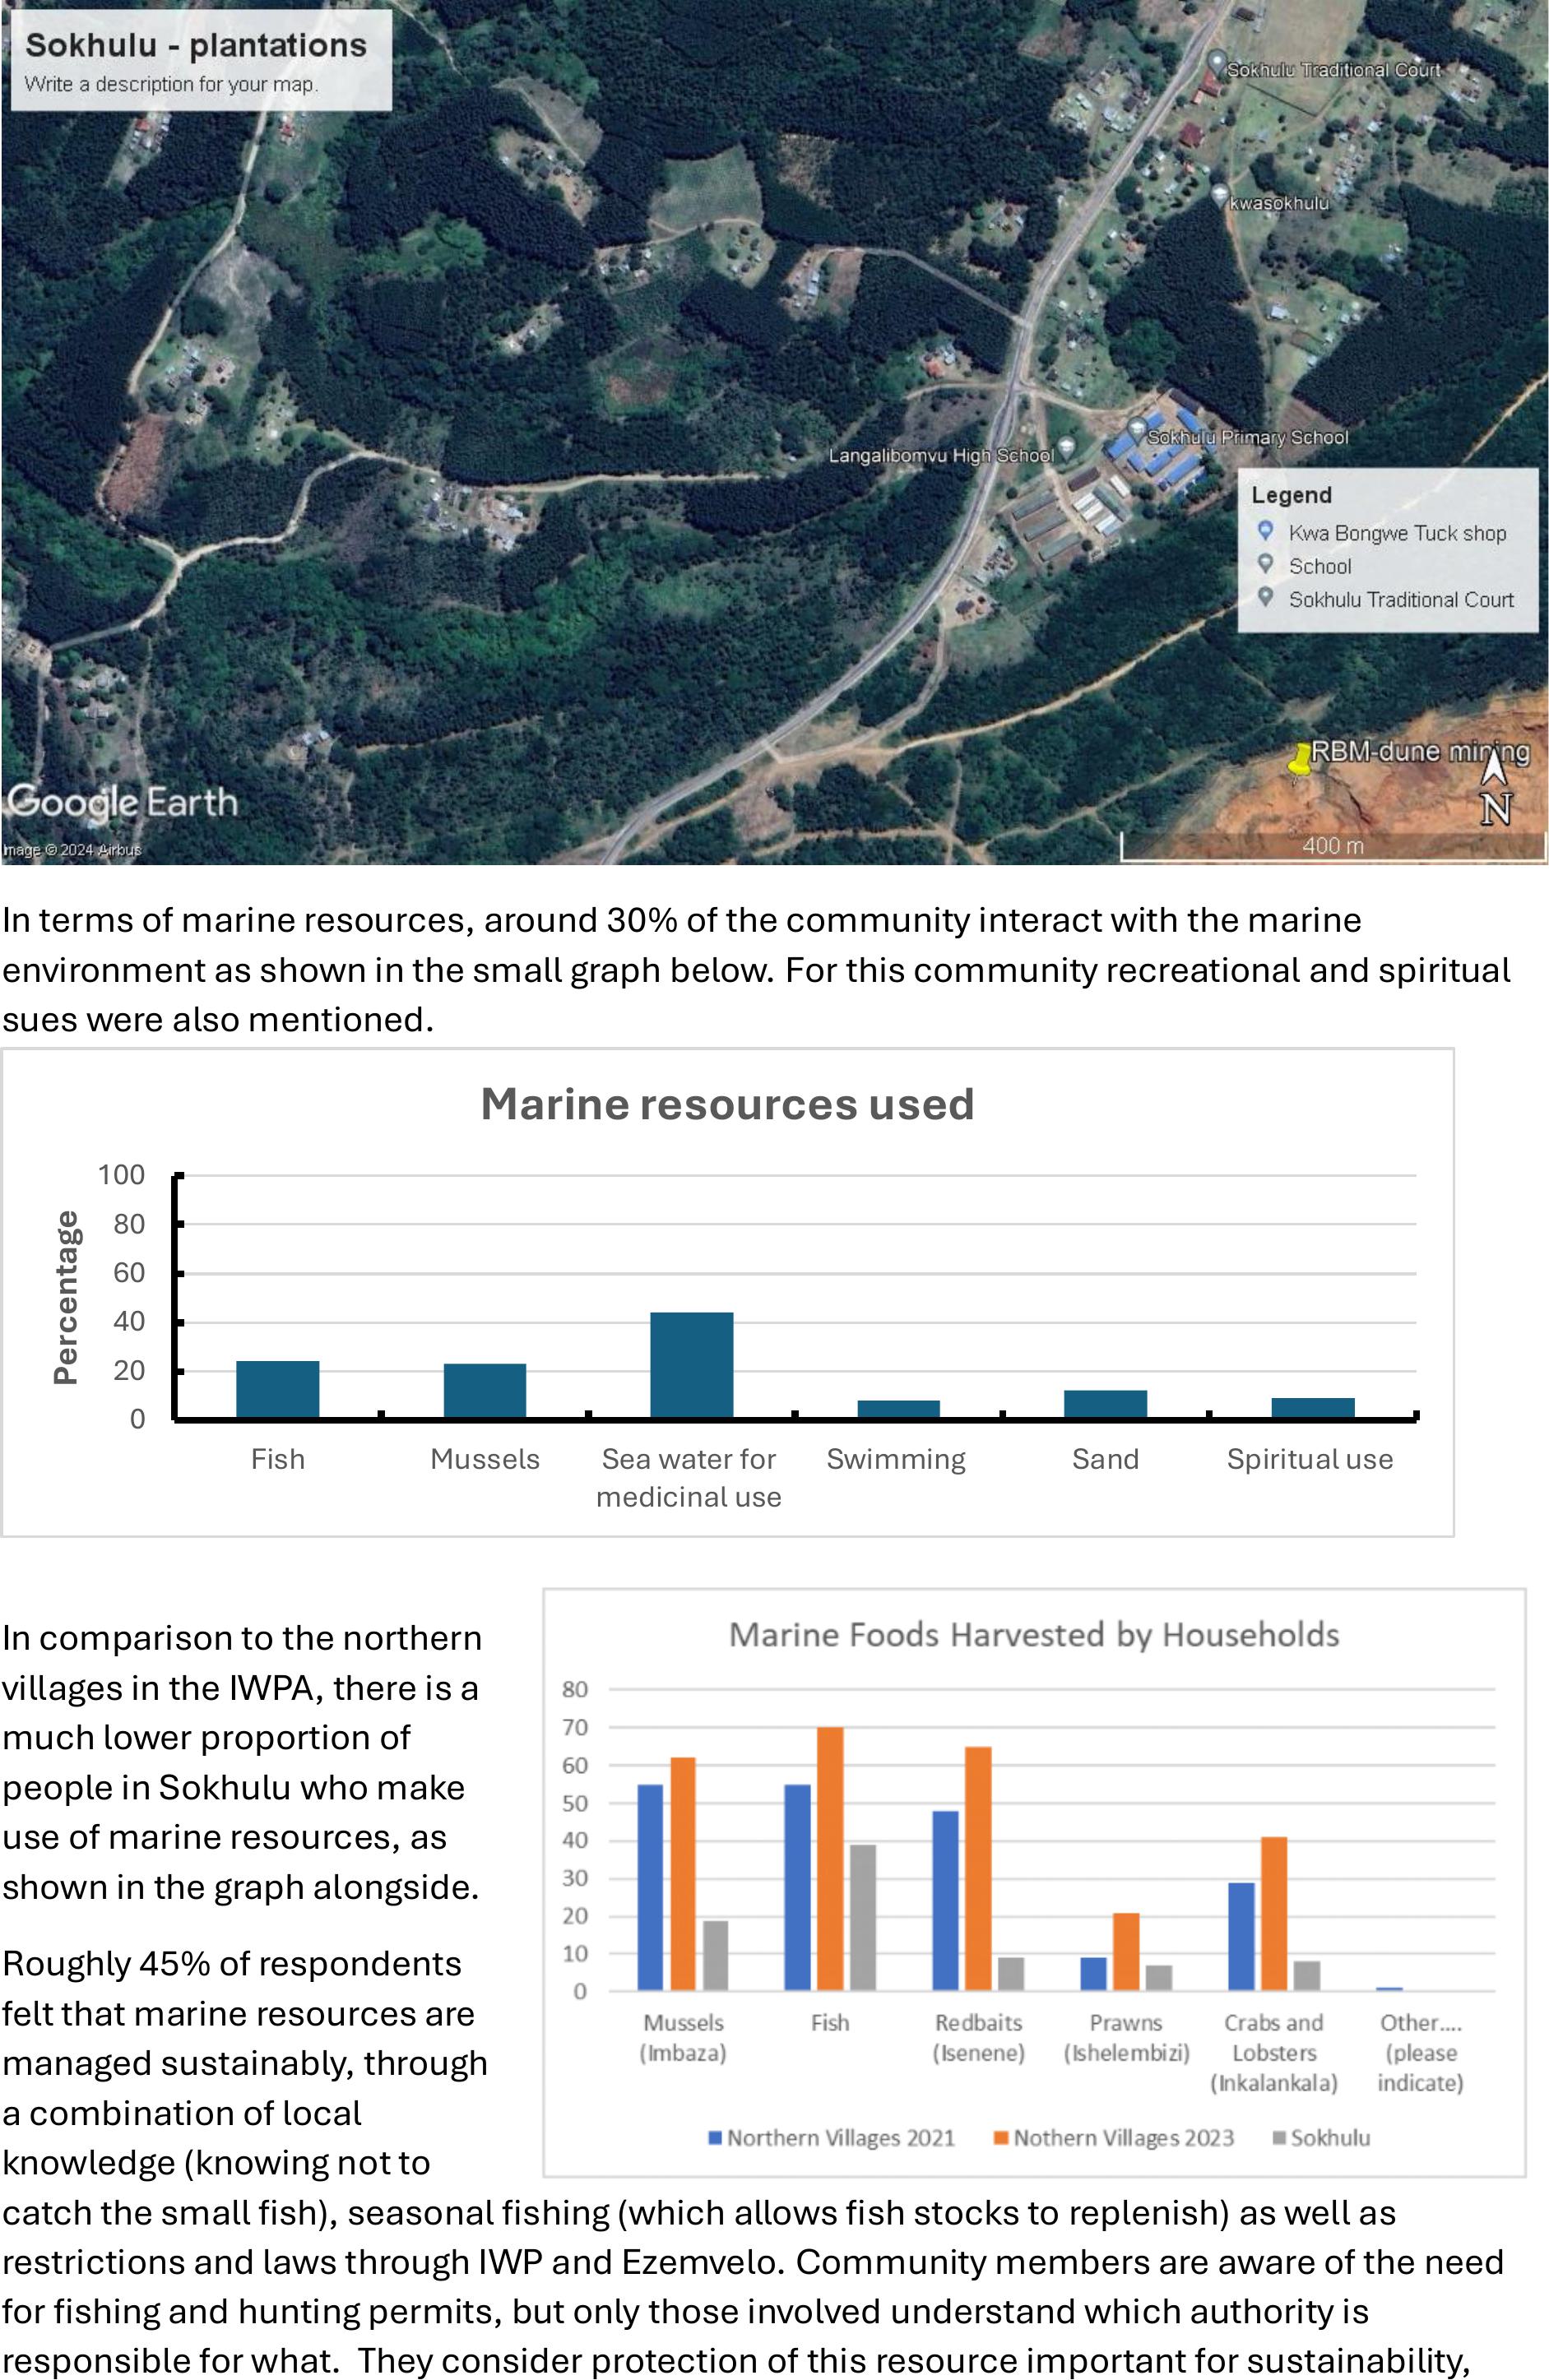
In terms of marine resources, around 30% of the community interact with the marine
environment as shown in the small graph below. For this community recreational and spiritual
sues were also mentioned.
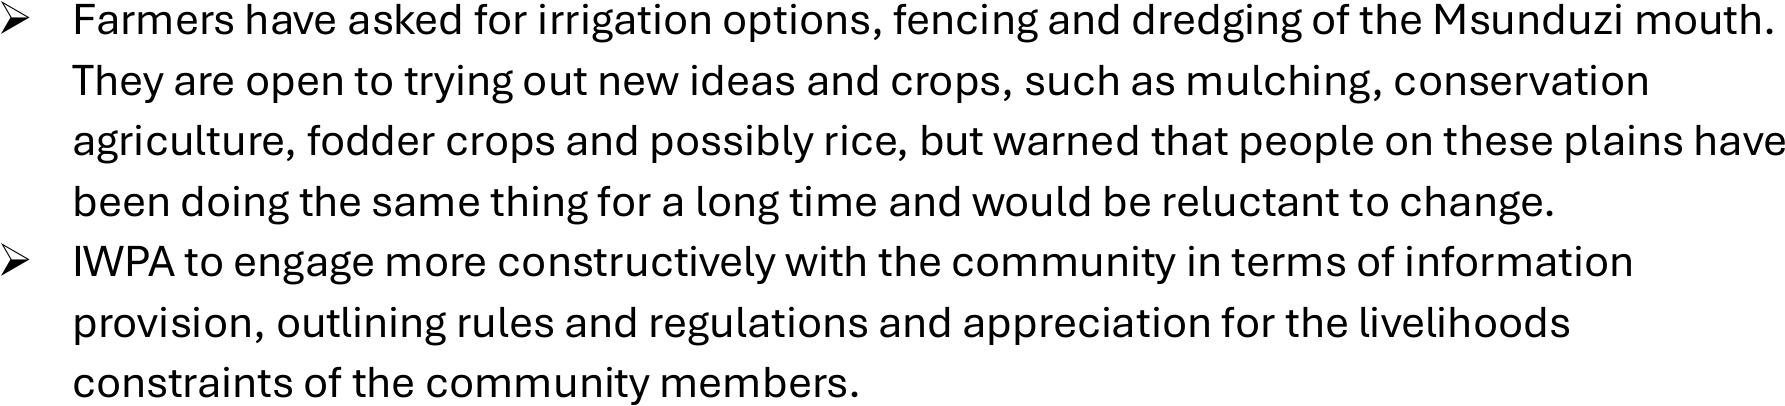
In comparison to the northern
villages in the IWPA, there is a
much lower proportion of
people in Sokhulu who make
use of marine resources, as
shown in the graph alongside.
Roughly 45% of respondents
felt that marine resources are
managed sustainably, through
a combination of local
knowledge (knowing not to
catch the small sh), seasonal shing (which allows sh stocks toreplenish) as well as
restrictions and laws through IWP and Ezemvelo.Community members are aware of the need
for shing and hunting permits, but only those involved understand which authority is
responsible for what. They consider protection of this resource important for sustainability,
0
20
40
60
80
100
FishMusselsSea water for
medicinal use
SwimmingSandSpiritual use
Percentage
Marine resources used

livelihoods and future generations. Mention was made of changes in the marine environment
which included depletion of sh stock due to changes in climate and also due to there being too
many shers. They also mentioned that the mangroves have reduced a lot and what was left has
died back in the last eight years due to the closure of the rive mouth. This has reduced their
function of managing water levels in the lower lying areas as well as reducing the marine
resources such as crabs and certain sh.
In Sokhulu, the villages engage less with IWPA, with only 8% of households obtaining contract
work through IWP management activities, 3% obtaining access to bursaries, 4% stating that
they get support for their gardens, and 70% stating there are no benets. The table below
outlines what community members know about the IWPA.
There is a reasonably large number of community members who believe the IWPA closed the
river mouth (35%). Others believe it was done by Richards Bay Minerals (RBM). In general, there
is an inherent understanding of the cyclical nature ofthe wetland system and the impact of
channelisation on the system. For most community members, but specically the farmer on the
oodplain this is understood as a positive intervention.
1.8RECOMMENDATIONS
➢Working with village-based groups of farmers to explore adaptive measures and
climate resilient agriculture practices and to set up a process of experimentation with
dierent options and ideas to improve the management of water and soil on the
oodplain as well as at the homesteads or the smaller communal gardens.
➢Taking some soil and water samples across the ood plain to ascertain the fertility and
quality of the water (there is suspicion among community members of poisoning of the
water through the RBM mining operations).
➢Comparison of conditions on the oodplain in winter and summer, as well as further
discussions with key informants about channels, patches of natural vegetation, ood
control and scenarios for management. This will need input from agricultural engineers
and hydrologists, as well as some form of mapping.
➢Engagement with the community for awareness raising and information provision
around the functioning of the system, the impacts of closure and opening/dredging of
the river mouth and the impact of dierent land use practices, to better inform more
sustainable landuse practices.
➢Continuation of liaison between MDF and the Wildtrust restoration team to allow for
village-based clearing of unwanted gum plantations and recovering theseareas as
productive land, through agroforestry systems.
Protect our
coast
Protect our
nature
Don’t
know
It closed
the river
mouth
Same as
Wildlife
Hire
people No fishingEmpty
promises
Series1 813 21 35 610 5 5
0
5
10
15
20
25
30
35
40
Percentage
What do you know about IWP
➢Farmers have asked for irrigation options, fencing and dredging of the Msunduzi mouth.
They are open to trying out new ideas and crops, such as mulching, conservation
agriculture, fodder crops and possibly rice, but warned that people on these plains have
been doing the same thing for a long time and would be reluctant to change.
➢IWPA to engage more constructively with the community in terms of information
provision, outlining rules and regulations and appreciation for the livelihoods
constraints ofthe community members.