
1
Progress Report
Version: September2022
Grant code
Project Title
Isimangaliso EbA
Grantee
Wildlands Conservation Trust
Subgrantees
Mahlathini Development FOundation
Project Start Date
01/08/2023
Project End Date
31/07/2027
Reporting Period1
01/01/2024- 25/06/2024
Project Country(ies)
South Africa
Project Cost
Total & percentage
Blue Action Fund Contribution
EUR 146 668
Match Funding
Not applicable
Report Compiled By
Erna Kruger
Date of Submission
25th June 2024
Regular reporting is essential for Blue Action Fund tomonitorthe progress of the projects it
funds. Each project reports biannually through the workplan in conjunction withthe funding
advance request as well as theprogress report. In addition, only on anannual basisthe
progress report should be accompanied by Annexes A- F. Theses progress reports are
needed to:
•Monitorproject progress
•Analyse the overall programme of Blue Action Fund
•Collect information/data to allow Blue Action to report to its own donors
•Communicate project’s impacts and highlights to donors and other stakeholders
•Drawlessons learned and compile these for knowledge exchange on marine
conservation and sustainable livelihoods
•Serve as the basis for a progress call between BlueAction and the grantee
1
This should be a six-month period. With the exception of the information provided in the annexes (which are
only submitted on an annual basis) all contents of the progress report should refer to accomplishments and
developments of the last work period only, i.e. the last six months.
If you are submitting this progressreport withthe annexes constituting the annual report, please indicate the
annual period dates in the annexes.
In case of an annual report, the narrative part corresponding to the first six months of the year is to be found in
the progress report for that period.

2
1)Progress report summary
Below is a summary of activities to be undertaken by MDF (as per the FAR and workplan)
‘Activity 5.4.1
Intensive small-scale farmer training and support. Homestead. Provide intensive small-
scale farmer training and support
Deliverable 5.4.1.a
40-60 small-scale farmers trained and supported (MOV: training/attendance registers).
Deliverable 5.4.1.b
1 x 2.5-day CCA workshop and 5x training days per hub - Intensive regenerative agriculture
trainingand mentorship workshops held at the homesteads and at the Community
Resource Hubsat the beginning of each site intervention: 1 in year 2, 2 in year 3 and 1 in
year 4. (MOV: workshop registers, photographic evidence, course outline). Twenty-five
participants each.
Deliverable 5.4.1.c
15 farmers per site supported with intensive production and water management
infrastructure and support. (MOV: photographic evidence)
Activity 5.4.2
Train the trainer: WILDTRUST Hub staff will be incorporated into all initiation activities to
ensure they are able to maintain the hub demonstration gardens, provide additional
support to community members in between Mathathini staff visits, and provide basic
practical demonstrations off CCA gardening to community members visiting the hubs.
Deliverable 5.4.2.a
Four (4) hub teams trained and mentored to be future CCA mentors (MOV: training
registers, course outline).
Deliverable 5.4.2.b
Four (4) climate-smart demonstration gardens established, one (1) at each hub site,
maintained by Hub staff (MOV: photographic evidence).
Activity 5.4.4
Climate-smart agriculture technique demonstrations. YES youth employed by WILDTRUST,
that are trained as trainers by sub-grantee Mahlathini, train an additional 200+ community
members in mini-demonstrations of climate-smart agriculture techniques during the
project. 4 demonstration days per hub x 5 in total, 50 people at each demonstration
Deliverable 5.4.4
Twohundred and fifty community members trained by YES team in climate-smart
agriculture techniques (MOV: Attendance registers)
Activity 5.4.5
Facilities to support climate-smart agriculture. Establish facilities to support climate-smart
agriculture
Deliverable 5.4.5
Five (5) communal boreholes established at 5 primary community areas forgarden support
anddrinking, and seed tunnels and seedling provisionsupport at each community Hub
(MOV: photographic evidence).
1
2
Activity Not Yet Due; Activity Started -ahead of schedule; Activity started – progress on track; Activity started but progress delayed; Activity start is delayed.
3
Implementation progress on a cumulative basis as of the date of the report.
Project Subcomponents
Status2
Implementation
progress3(%)
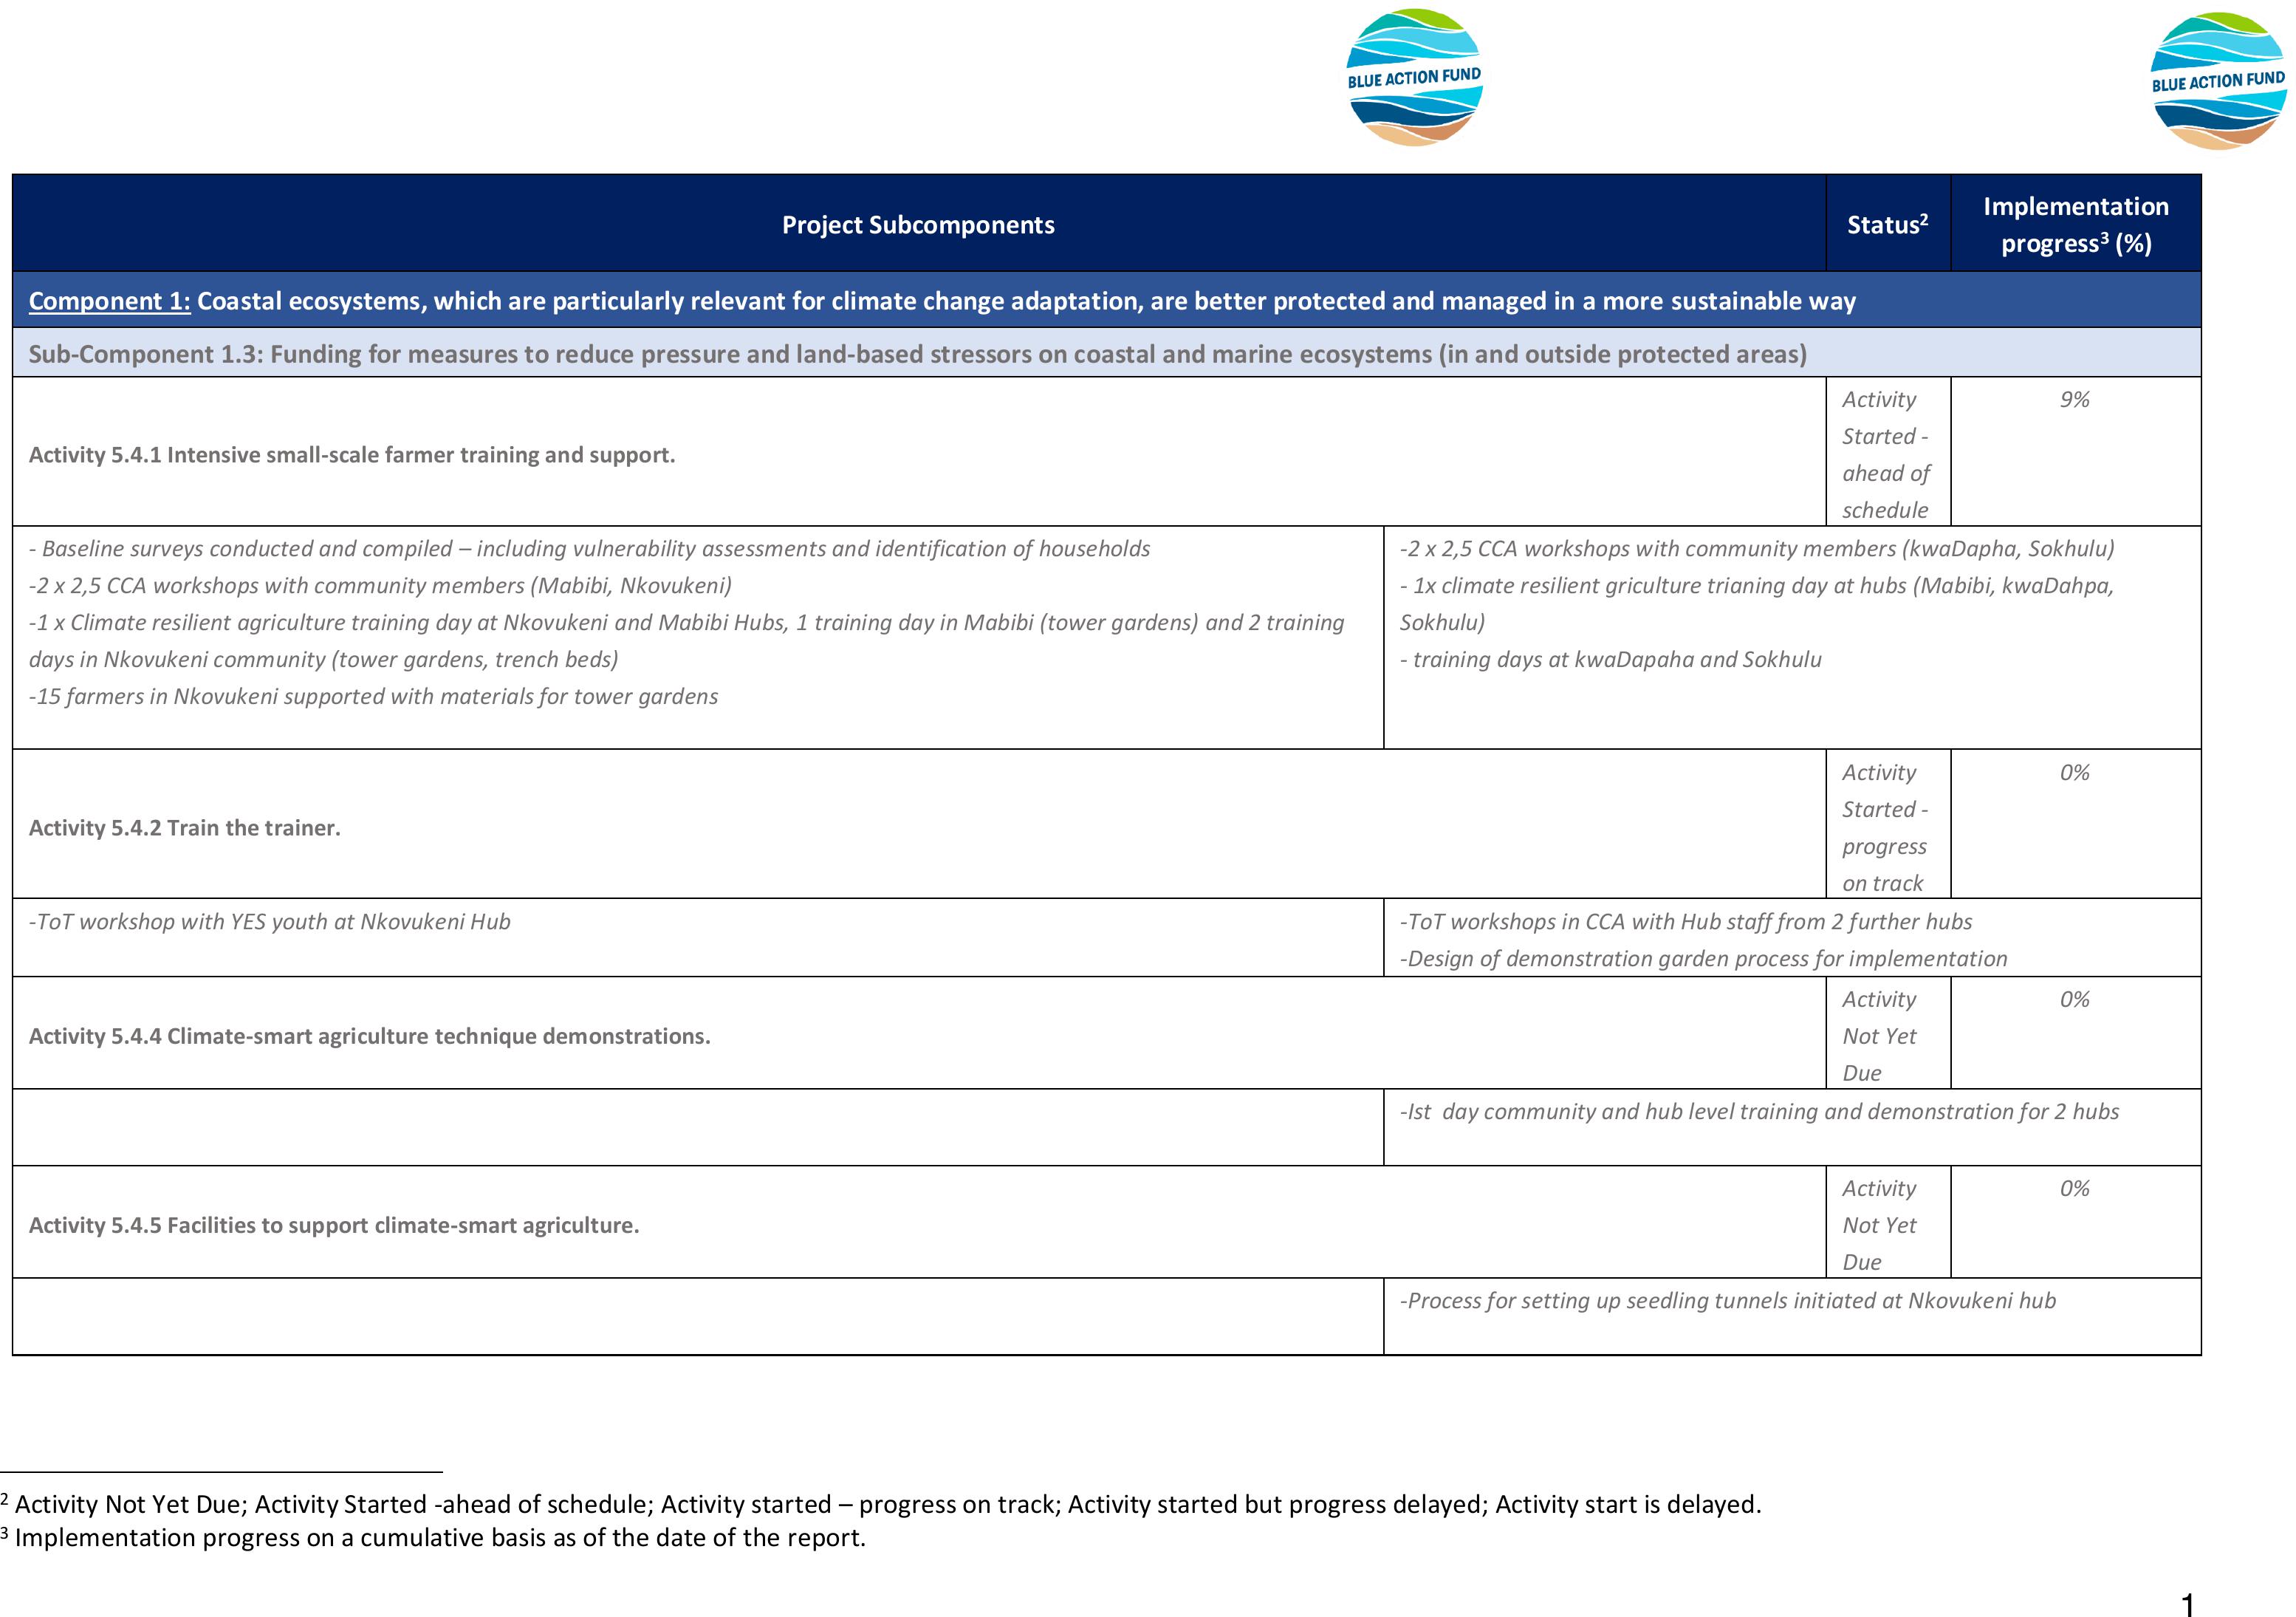
Component 1: Coastal ecosystems, which are particularly relevant for climate change adaptation, are better protected and managed in a more sustainable way
Sub-Component 1.3: Funding for measures to reduce pressure and land-based stressors on coastal and marine ecosystems (in and outside protected areas)
Activity 5.4.1 Intensive small-scale farmer training and support.
Activity
Started -
ahead of
schedule
9%
- Baseline surveys conducted and compiled – including vulnerability assessments and identification of households
-2 x 2,5 CCA workshops with community members (Mabibi, Nkovukeni)
-1 x Climate resilient agriculture training day at Nkovukeni and Mabibi Hubs, 1 training day in Mabibi (tower gardens) and 2 training
days in Nkovukeni community (tower gardens, trench beds)
-15 farmers in Nkovukeni supported with materials for tower gardens
-2 x 2,5 CCA workshops with community members (kwaDapha, Sokhulu)
- 1x climate resilient griculture trianing day at hubs (Mabibi, kwaDahpa,
Sokhulu)
- training days at kwaDapaha and Sokhulu
Activity 5.4.2 Train the trainer.
Activity
Started -
progress
on track
0%
-ToT workshop with YES youth at Nkovukeni Hub
-ToT workshops in CCA with Hub staff from 2 further hubs
-Design of demonstration garden process for implementation
Activity 5.4.4 Climate-smart agriculture technique demonstrations.
Activity
Not Yet
Due
0%
-Ist day community and hub level training and demonstration for 2 hubs
Activity 5.4.5 Facilities to support climate-smart agriculture.
Activity
Not Yet
Due
0%
-Process for setting up seedling tunnels initiated at Nkovukeni hub

1
2)Narrative report (Jan-June 2024)
2.1 Small scale farming training and support: Household and Hub
For each activity, please provide an update on progress during the past work period, including key
accomplishments, impacts, highlights, any delays and issues encountered, key milestones reached, lessons
learned, positive achievements, etc.
2.1.1 Main activities
BAF
number
Date
Description
Persons
Time
5.4.1a and b
2024/01/22-26
Financemeeting in Dbn
Meeting with full TC’s for 4 villages: Enkovokeni,
kwaDapha, Mabibi, Sokhulu
Erna Kruger
Mazwi Dlamini
5 days
5 days
2024/01/28
Finances, admin, narrative report Sokhulu
Erna Kruger
1 day
2024/01/31
Invoicing, narrative report
Erna Kruger
1 day
2024/02/02
Preparation of materials for CCA ToT
Mazwi Dlamini
TemaMathebula
1 day
2 days
2024/02/05
Alignment of baseline survey form with requirements
Mazwi Dlamini
1 day
2024/02/07
IMA, Wildtrust MDF meeting on agricultural interventions
Erna Kruger
Mazwi Dlamini
1 day
2024/02/20
Wildtrust, MDF, IMA mapping meeting
Erna Kruger
Mazwi Dlamini
1 day
2024/02/26-28
Preparation for household mapping and setting up
financial reporting systems
Erna Kruger
Mazwi Dlamini
2 days
2024/02/29
Visit to Sociotech sites in Sokhulu in preparation for
baselines
Mazwi Dlamini
Nqobile Mbokazi
TemaMathebula
1 day
2024/03/01-08
Household mapping and baseline surveys in Nkovukeni,
Mabibi and kwaDapah
Mazwi Dlamini
Nqobile Mbokazi
TemaMathebula
Erna Kruger
8 days
2024/03/14
Monthly BAF finances
Mazwi Dlamini
Erna Kruger
1 day
2024/03/28-30
Nkovukeni vulnerability assessment preparation. SAEON
presentations sharing and pre for workshops, Baseline
reports
Erna Kruger
3 days
2024/04/01-05
Preparation of learning inputs and materials, planning for
CCA workshops, Monthly BAF finances
Erna Kruger
Mazwi Dlamini
TemaMathebula
5 days
2024/04/08-12
Baseline surveys kwaDapha and Mabibi continued, CCA
workshop day 1 Nkovukeni
Mazwi Dlamini
Nqobile Mbokazi
TemaMathebula
Erna Kruger
5 days
2024/04/15-19
Capturingbaselines
Mazwi Dlamini
Nqobile Mbokazi
Erna Kruger
5 days
2024/04/23-26
Baseline reports continued
Erna Kruger
4 days
2025/05/07-09
Collaboration with UKZN for joint baseline survey for
Sokhulu
Erna Kruger
3 days
5.4.1a,b,c
2024/04/26,29-30
and 05/01-03
Preparation for training workshop 1 (materials and inputs
for tower gardens), CCA workshop day 1 Mabibi, CCA
workshop day 2 Nkovukeni.
Mazwi Dlamini
Nqobile Mbokazi
TemaMathebula
Erna Kruger
6 days
2024/05/09, 16
BAF monthly finances and procurement
Erna Kruger
Mazwi Dlamini
2 days
2024/06/19-29
ToT for YES youth in Nkovukeni, 1st demonstration day.
Mabibib CCA workshop day 2, demonstrations and 1st
training day, CCA workshop day 1 and 2 kwaDapha
Mazwi Dlamini
Nqobile Mbokazi
Erna Kruger
11 days

2
2.1.2 Mapping and baseline surveys. Narrative reports:
Further, detailed information was gathered for
3 villages within the iSimangaliso WP to
augment information from initial visits.
Individual household interviews were
conducted between March and April 2024: 19
in Nkovukeni (37% men and 63% women), 25
in kwaDapha (60% men and 40% women)
and 22 in Mabibi (45% men and 55%
women). Interviews were conducted jointly
between MDF andWildtrust hub staff.
Figure 1: Example of a map providing initial household
numbers for Nkovukeni, which was used and refined
during the baseline survey process
The remaining households in each area was
later interviewed by Wildtrust staff and
information from these forms still needs to be
included in the initial analysis undertaken.
For Sokhulu, 8 villages situated outside the southern border of the Isimangaliso WP a joint
survey was designed and administered between UKZN and Mahlathini. Around 200
households were interviewed, and these forms are in the process of being coded for
analysis.
Below are summaries of information presented in the baseline reports submitted to the
WIldtrust.
Demographics
Detailed information was obtained from interviewees regarding adults and children living in
the household, spending more than 4 nights per week at the homestead and eating meals
there. Thepopulation of Nkovukeni is roughly 200 individuals living in 35 households. The
population of Mabibi is roughly 610 individuals living in 111 households. The population of
kwaDapha is roughly 240 individuals living in 45households. The proportion of female
headed households is significant for all three villages, but highest for Mabibi at 59%, average
of Nkovukeni at 49% and lowest at kwaDapha at 32%.
The small table below compares proportions of age groups represented in each village with
the statistical average for rural South Africa.
Table 1: Demographics for the 3 Hub villages in the iSimangaliso WP (April2024)
Age group in years
StasSA %
Nkovukeni %
kwaDapha %
Mabibi %
0 -14
28,8
21
31
28
15-34
35,1
32
39
37
35-59
27,1
41
21
27
>60
9
6
9
8
For Nkovukeni the age groups are skewed towards active adults 35-59 years of age, with
smallerproportions of very young people and pensioners, which is due mostly to the
inaccessibility of the area (no road access), as well as lack of services (healthcare). In
kwaDapha andMabibi the demographics are skewed towards a larger proportion of youth
15-34 years of age, which is mostly an outcome of youth job creation processes in these

3
villages. In effect the families form these areas did not fully relocate when the Park was
formed but have also kept their homesteads in the park going, with the people most able to
benefit from the situation living there. The proportion of homesteads which do not have ties
to homesteads outside of the park is very small, estimated at <10%.
Incomes and livelihoods
The per capita incomes for each household surveyed have been compiled in the table below,
comparedacross three Hub villages.
Table 2: Per capita incomes for household members living inside the iSimangaliso WP, April 2024
Per capita income
Nkovukeni %
kwaDapha %
Mabibi %
<R1 558/month
95%
92%
68%
<R800/month
37%
40%
45%
R800-R1000/ month
21%
24%
18%
R1175-R2260/month
42%
36%
23%
R3100-R7300/month
14%
Female headed household average
R970
R1 192
R1 530
Male headed household average
R1 061
R931
R1 870
The percentage of individuals living below the national upper-bound poverty line is
exceptionally high in Nkovukeni at 95% followed closely by kwaDapha at 92% and Mabibi at
68%. The latest figure for South Africa as a whole was 55%
4
in 2014. The proportion of
households who are considered destitute are indicated in red and constitutes around 40% of
households ineach village. In Mabibi, which is larger and also where more diverse livelihood
activities are undertaken, and whichhas the most access to services around 15% of
households realize a per capita income of >R3000/month. This is not the case for the two
northern villages. Mabibi is the only village of the three where any individuals living in and
attached to these households are employed, as shown in the table below.
Table 3: Source of incomes per village ranked in order of importance, April 2024.
Source of income in order of importance
Nkovukeni
kwaDapha
Mabibi
Pensions
Small businesses-
homestays, spazas
Employment
Contract Wildtrust
Contract Wildtrust
Contract Wildtrust
Contract iSimangaliso
Contract iSimangaliso
Contract iSimangaliso
Child grants
Fishing-contract
Fishing
Small businesses
Pensions
Small businesses
Fishing
Remittances
Remittances
Remittances
Child grants
Pensions
Selling reeds
Selling reeds
Reeds/craft
Local farm produce
Local farm produce
Local farm produce
Food aid.
Food aid
Child grants
The most significant income opportunities are linked to short term job-creation programmes
runby both the Wildtrust and iSimangaliso, employment, small businesses and fishing.
Incomes from cosatal harvesting and fishing. Income generation from use of natural
resources such as fishing (45%), fish kraals – Nkovukeni only, (35%) and coastal harvesting
(65% for Nkovukeni and 32% for kwaDapha) is common in the villages. Only 18% of
households do not engage in these activities. Incomes however are generally low and use is
primarily for food. In addition, fishing is primarily an activity of the men in the village and
coastal harvesting (mussels and red bait) is undertaken by women. Harvesting of reeds and
grass and making of craft is undertaken by around 36% of the households. The few
4
World Bank. Poverty and equity brief. South Africa. April 2023

4
households involved in homestays, presently in kwaDapha, earn significantly higher incomes
than most other potential income sources in these villages.
Food shortages arereasonably common in the community, with around50% of households
suffering from seasonal shortages for 2-4 months of the year and around 17%suffering from
too littleaccess to food on an ongoing basis, in Nkovukeni and kwaDapha but not Mabibi,
where households are more food secure.
Agriculture
The summary table below indicates the percentage of households in each village involved in
a range of agricultural activities.
Table 4: Percentage of households involved in a range of agricultural activities linked to the scale of each, April
2024.
Nkovukeni
kwaDapha
Mabibi
Activity
% of HH
Units
% of HH
Units
% of HH
Units
Household cropping
(dryland)
35%
188m2
32%
150m2
27%
200m2
Vegetable production
(community garden)
59%
200m2
Vegetable production
(household)
18%
200m2
Lake edge gardening
12%
150m2
Fruit production
53%
1-4 trees
52%
1-4 trees
64%
1-4 trees
Poultry
24%
4 chickens
20%
6 chickens
41%
7 chickens
Goats
41%
10 goats
28%
7 goats
9%
4 goats
Livestock
16%
10 cattle
12%
6 cattle
9%
5 cattle
Around 60% of households across the three villages are involved in cropping activities,
primarily drylandor wetland based. A much smaller percentage, roughly 15% undertake
individual vegetable production activities. Cropping areas are extremely small throughout
averaging around 350m2 per household. Access to agricultural inputs, seed and seedlings is
severely limited. Round 56% of households have a few fruit trees in their yards-but harvests
are severely restricted by predation from birds andmonkeys. Livestock production is also
limited with households owning a few chickens (heavy predation), goats and cattle.
Agriculture is predominantly undertaken on a subsistence level for household food
production and local sales of small, sporadic surpluses.
Infrastructure
The table below summarizes access to different levels of infrastructure and services across
the three Hub villages
Table 5: Access to infrastructure and services for 3 Hub villages in iSimangaliso WP, April 2024
Infrastructure type
Description
% HH
% HH
% HH
Nkovukeni
kwaDapha
Mabibi
Fencing
Self-constructed, makeshift
42%
32%
77%
Dwellings
Brick and cement
76%
76%
100%
Reed
35%
56%
14%
Energy
Solar
42%
60%
0%
Electricity
0%
0%
100%
Gas
37%
8%
0%
Candles
32%
32%
0%
Firewood
100%
100%
77%

5
Sanitation
None
68%
51%
0%
Pit latrines
22%
45%
100%
Septic tanks
0%
4%
0%
Water
RWH-200l drums
100%
24%
55%
RWH 2400l Jo-Jos
94%
64%
73%
Communal borehole
68%
24%
100%
Spring
5%
0%
0%
Own borehole
0%
52%
0%
Access
Roads
0%
100%
100%
Lake
100%
Mabibihas the greatest access to services and infrastructures with100% of households
having access toelectricity, water and
sanitation, a situation which is almost
reversed in Nkovukeni and kwaDapaha
which rely heavily on solar, gas and
candles for energy, have around 60% of
households without any sanitation, and
have to rely heavily on rainwater
harvesting for household access to
water. In Nkovukeni there are no
individual boreholes, while around 52%
of households in kwaDapha have their
ownboreholes.
Figure 2: A view of the different types of
households in Nkovukeni –above reed dwellings
and below -well constructed houses with RWH
and fenced yards.
Firewood harvested from the surrounding bush and forests is used extensively in all three
villages, with a 30% reduction in use in Mabibi where households have access to electricity.
As mentioned before, there is no road access to Nkovukeni and people need to cross the
lakeon foot or by boat. Road access to Mabibi andkwaDapha consist of deep sandy tracks,
unsuitable to most vehicles without 4x4 capability.
This table is indicative of why community members in these villages are calling for services
and infrastructure development. The combination of lack of services and infrastructure and
curtailing of resource harvesting and use, without provision of long term and sustainable
alternatives is leading to over-harvesting of resources and severe vulnerability of
households, specifically in the more northern parts of the park.
Relationships with the iSimangaliso MPA are strained. A recurring comment from community
members was that the rules imposed are restrictive and abusive and that control has been
heavy handed in the past. Throughout a call for discussion with the iSimangaliso authorities
and better information provision from them was heard. Community members one the one
hand appreciate the protection of the naturalenvironment, and on the other feel that nature is
seen as more important than people and that they are unable to makea living given the
restrictions on resource use. They appreciate the short -term job opportunities and food
parcels as these have been crucial given the constraints on other land use options in the
area. Requests for support have included more job-opportunities not just for youth,
improvement in living conditions, electricity, toilets, improved road access, a bridge across
the lake, RDP houses and a high school, shops and seeds for planting. Requests also
included support for tourism activities and support for the women’s cooperative to access a

6
tent and chairs for events. There were also a requests to lift the restrictions on agriculture to
allow people to make a living from farming.
2.1.3 Recommendations for intervention from baselines
Below bullet point lists have been prepared from comments and requests from community
members, linked to observations from the field team in the villages.
Nkovukeni
➢Given the small group of young children between the ages of 0-6 years – demand for
a creche may not be very high, but crucially should be combined with additional
support for primary school children (sanitation, housing, energy, nutrition, health and
education)
➢Job opportunities for the age groups of 35-59 years need to be given priority as this is
also the group most reliant on natural resources in the area to survive and the main
breadwinners in these households.
➢Provision of basic sanitation and WASH education and services should be a priority.
➢Significant support with rainwater harvesting is crucial.
➢Support forand development of options for solar energy would alleviate a lot of the
present discomfort.
➢An improved system for provision of fuel for pumping water and distribution of water
to households should be given attention. Presently only those households who can
afford fuel for pumping and who are reasonably close to theborehole have access.
➢An improved system for delivery of gas can make a huge difference.
➢ Systems for provision of monkey and hippo proof fencing/cages for both food
production and poultry husbandry could assist to provide improved yields and better
livelihoods support.
➢Systems for improved water management and grey water management can relieve
someof water shortages at household level.
➢Better land use management in the wetland community garden is important for
improved production and protection of the wetland.
➢Access to the community is an issue that needs innovative solutions, as presently
neither a road nor a bridge across the lake are viable options. Construction of
stabilised paths to allow carts could be one option.
➢iSimangaliso to engage more constructively with the community in terms of
information provision, outlining rules and regulations and appreciation for the
livelihoods constraints of the community members.
kwaDapha
➢Job opportunities for the age groups of 35-59 years need to be given priority as this is
also the group most reliant on natural resources in the area to survive and the main
breadwinners in these households.
➢Provision of basic sanitation and WASH education and services should be a priority.
➢Significant support with rainwater harvesting is crucial, especially for those
households which do not already have JoJo tanks.
➢Support forand development of options for solar energy would alleviate a lot of the
present discomfort.
➢An improved system for delivery of gas can make a huge difference.
➢ Systems for provision of monkey and hippo proof fencing/cages for both food
production and poultry husbandry could assist to provide improved yields and better
livelihoods support.
➢Systems for improved water management and grey water management can relieve
someof water shortages at household level.
➢Taking the pressure off the fishing and coastal resources is a priority.

7
➢iSimangaliso to engage more constructively with the community in terms of
information provision, outlining rules and regulations and appreciation for the
livelihoods’ constraints of the community members.
Mabibi
➢Job opportunities for the age groups of 35-59 years need to be given priority as this is
also the group most reliant on natural resources in the area to survive and the main
breadwinners in these households.
➢Focus on improved agricultural practices for intensification of household food
production is important.
➢Diversification of agricultural activities to improve synergy between soil, water, plants
and animals in this system, to improve production and productivity
➢Significant support with rainwater harvesting is crucial, especially for those
households which do not already have JoJo tanks.
➢Systems for improved water management and grey water management can relieve
someof water shortages at household level.
➢Taking the pressure off the fishing and coastal resources is a priority.
➢iSimangaliso to engage more constructively with the community in terms of
information provision, outlining rules and regulations and appreciation for the
livelihoods’ constraints of the community members
2.1.4 Climate change adaptation workshops
These workshops are undertaken with community groups over a period of 2 to 2,5 days and
includes anassessment of climate change impacts, Seasonality diagrams (temperature and
rainfall) to visualize changes, discussion of scientific and community understanding of
changes that are occurring, practices and activities in the villages in the past, present and
future. This is followed by suggestions for adaptive strategies form the community
augmented by discussions on potential adaptive practices in relation to water, soil crops,
livestock and natural resources. From there community members prioritize practices that
they would like to try out and the process moves into demonstrations and training related to
the practices.
In Nkovukeni the 2-day process also included a process around a participatory vulnerability
assessment.
Nkovukeni CCA workshops (10thand 30th of April 2024)
On day one 18 women participated and on the 2nd day 23 participants (18 women and 5
men) were in attendance.
Nkovukeni CCA workshop : Day 1
Figure 3:
Participants for
the Nkovukeni
CCA focus group
discussion 10th
April 2024

8
Workshop outline
•Community and team introductions: Introduction of the organisation/s and purpose of this
workshop- link to already ongoing activities if possible and introduce visitors and other
stakeholders involved. Climate change as a concept, people's concept of it. And overall
impact, difference between weather and climate.
•Past, present and future:Whole group discussion on what people are presently doing… in
all livelihoods (including farming, resources use, etc) - how does this compare with past and
future
•Presentation on scientific information re CC for the area: SAEON Maputuland
presentation for research conducted around lake Sibaya
•Summary of impacts and possible solutions: Plenary discussion summarising points raised
and further additions regarding climate change impacts and possible adaptive strategies,
(including what people in the area are already trying/doing).
•Participatory poverty assessment: Presentation of summary information for the Nkovokeni
baseline surveys conducted. Plenary discussion around group-based wealth ranking for all
households – to assist in targeting beneficiation from different aspects of the EbA programme
Community and team introductions
MDF outlined their role as support for climate resilient agriculture activities and working with
new ideas and practices that can assist in intensifying production, with the aim also to reduce
the pressure on the natural resources in the area. MDF is one of a number of partners and
sub-projects, including also craft, tourism, small business development, and specific support
to vulnerable women and children.
Community members introduced their daily activities and farming being undertaken in the
village. According to the participants, everyone in the village is planting, mostly in the
gardens next to the lake as there is no water at homestead level. Crops include sweet
potatoes, potatoes, amadumbe (taro), cabbage, onions, spinach, green peppers, carrots,
beetroot, lettuceand tomatoes. These communal gardens need to be fenced and the
community can only afford to do this in a small area, meaning there is presently only one
small garden being actively used. They would like to increase the size of this garden.
Some households also keep livestock like goats, but they die easily, and people are unsure
about whether it is a lack of grazing or other causes. Three households in the village own
livestock. Women need permission from their husbands to sell livestock. Some households
also keep traditional chickens, but they areheavily predated, so they cannot build up their
flocks. Some of the women harvest incema (reeds) and sell these to people in neighbouring
villages. They make grass mats, but there is no market for those. The men do fishing, both in
the lakes and in the seas. There are many fish species, also including lobsters, freshwater
prawns and abalone. Women mainly do harvesting of mussels and red bait and in some
cases crabs – although they are a little afraid of the large ones.
Most households have fruit trees such as mangoes, guavas, oranges, lemons and avocados,
but themonkeys now destroy their harvests almost entirely. People also harvest wild fruit.
Some traditional medicine and bulbs are harvested from the veld and coastal forests, but
availability of these has been decreasing in recent years.
Responses related to participants’ knowledge regarding climate change included that it is
caused by industry and smoke that builds up in the ozone layer. One participant talked about
clouds building up in different places and bringing rain to this village, that is different from the
past. One lady emphasised that everything has changed, rain doesn’t come in July as in the
past andone just has to work out when to plant and also society has changed, women have
children even at the young age of 13yrs, not waiting until their early 20’s as was the case in
the past.
This was followed by a short discussion on the difference between weather and climate,
although from participants’ responses they are already aware of this distinction.

9
Below is a summary of the changes in climate that participants mentioned:
•It is so much hotter, even now in April it is still very hot-difficult to tell the difference between
winter and summer.
•Rainfall at different times, unusual for it to be raining in April, as rain usually ends in February.
•Tides have changed, higher tides than before, even low tide is higher than in the past, so it is
difficult to do the coastal harvesting and more difficult to cross the lake on foot.
•These days in the fishing areas, there are very few fish – even the fish kraals are being
inundated…making them a lot less effective.
•Where the lake meets the sea, more salty water is being pushed up into the lakes, which is
changing the number and types of fish in the lakes themselves.
Past, present and future-trends in land use and livelihoods
PAST
•Before iSimangaliso there were many more households in the area, the villages from
kwaDapha stretching to Nkovokeni were continuous with households throughout. Even though
there are now so few households left, there is still overuse of resources as people come in
from outside.
•In the past when we planted next to the lake, we could deal with the hippos that were present,
by making fires along the lake edge at night. Now that there are more people and more
planting, more hippos are coming, and this strategy does not work anymore.
•Back in the days, when there was flooding along the lake edges and erosion of the sand, we
would make small terraces using logs to catch the soil and create spaces for planting.
•Our diet was different; sorghum, maize, peanuts, jugo beans, cowpeas (now eaten by
monkeys). We used to make a meal with cowpeas, peanuts and chillies. Even made ’vetkoek’
with these ingredients. We also grew cassava (indumbula), sweet potatoes, pumpkin,
amabece (traditional gourds), and harvested indigenous fruit such as Natal Mahogany.
•It has become more and more difficult to grow maize- soil is now washing away.
•We also used to grind our own maize meal –didn’t make puthu, which only came in as a
practise later – used to grind it and make soup/gravy.
•We also used marula to make nuts.
•Also grew imfe (indigenous sweet reed)
•Most of the areas we grew on are now gone or have reverted to forest. Forest has also grown
up in areas where it was not before.
•We also used to build smaller fish traps, not just the few remaining permanent fish kraals.
There was a lot more fish and we used to be able to make a living trading fish caught. When
more and more people started to try and catch fish for sale the fish populations declined.
•We used to use rituals and slaughtering of cattle for calling rain. Also, ceremonies at a big
rock at Kosi Bay mouth. These days, such ceremonies are very uncommon.
PRESENT
•Diseases have increased a lot; HIV/AIDS, high blood pressure, diabetes, COVID, arthritis,
cancer– all due to our diets changing- not eating healthy now.
•People are not planting, mainly because of the animals- people have been discouraged.
•The main problem is not climate change here- as there is still rain. We need some solutions
for animals, so that people can go back to planting.
•There is more rain than in the past, which is good for collecting rainwater as there no
boreholes or taps.
•At the homes the problem is monkeys and bush-pigs– there is also no water which is only
down at the fields, and they would need to fetch water from down at the bottom to garden at
household level.
•There are more people, which has attracted more wild animals. Also now, everyone is doing
their own small plots separately instead of trying to work together in one large area, which was
much easier in terms of management of wild animals. Also, as everything was in one place,
the damage to the environment was smaller.

10
FUTURE
•We will remain here, and others will return.
•We need to be taught about what the solutions are for climate change and what we can do to
continue to survive.
•As you have come here an interviewed us, now we are supposed to come up with a solution
together, not chase us away from here.
Presentation on scientific information
This information was graciously provided by the SAEON team (Ms Sue van Rensburg) and is
attached to this report. In summary, we talked to the scientific understanding of climate
change and showed the cumulative impacts of extensive tree plantations, loss of wetlands
and climate change on the system- drying of lakes (Lake Sibaya water level has dropped by
4,5m) and loss of wetlands (60% reduction in area) leading in some cases through
inappropriate land use and burning – to long-term burning of peat fields in the region. The
modelledprojections are continued drying of the lakes (which are rainfed rather than being
fed by rivers), if large scale reduction in the area under plantations and restoration of
wetlands is not undertaken, despite potentially somewhat increased levels of rainfall.
The participants were somewhat alarmed as to the reasons for the drying of the lakes and
the potential for this to continue. They made a number of remarks about the plantations and
that not that many people are involved there, but those that are would likely not agree to
remove those trees. They mentioned that some people are awareof the dangers of burning
in the wetlands and do not do that in Nkovokeni. It is mostly the herders for the livestock
owners that go about burning veld and other areas and the community has little control over
this practise.
Possible solutions- adaptive strategies
The process started out as list of requests for assistance, but with some explanation of how
MDF is planning to intervene – including trying out new ideas and supporting the more
vulnerable households the following ideas were suggested:
•Awareness programmes, including those planting gum plantations to see if people have a
change of heart and will remove some of those trees.
•Help us with fencing- for hippos and bush pigs.
•We need hand hoes.
•Are you saying you will come up with things to help us, or we must do it? MDF to work
together to work on solutions…
•We are living at the top; water is at the bottom. We need ways to bring water closer to us- we
know it is impossible, but getting water closer to people that will help.
•If there is water closer to our homes, then we wouldn’t need to go down there. What are
options – maybe another borehole, small dams, more Jo-Jos etc.
•In zone 1 there is a borehole that was damaged and is not in use. There is the present
community borehole and there is a 3rd one on the other side- that one is still functional. If we
fix the two existing boreholes and bring water closer to the households that would be a good
solution for us. We do not need to start from scratch.
•Wild Oceans brought the water from the header tanks here to the hub. Maybe if we can find a
way to get the water closer to the households from the hub, that could help as well.
•Possibly introduce new crops like for example broccoli, potatoes, beans, cucumber, okra,
brinjal, macadamia nuts, udhali (pigeon pea) and red onions.
•We would like to try out layer hens for egg production.
•We have heard about grey water but are reluctant to use it…soap will kill the plants. MDF
mentioned that there are ways in which you can work with this- for example clearing the water
with ash –or using stones and sand filters, etc.
Participatory poverty assessment
MDF started this session by discussing the intention of the programme to support the
vulnerable people in the community and the need to understand the poverty status of all
11
households in the village to ensure equitable benefit from the different aspects of the
programme being provided.
The overwhelming response to this was that everyone in the village is poor and a question as
to whether some people would not receive help. One older lady emphasised that people may
be living in a house that looks nice but canhaving nothing inside and not haveenough food
to eat. Another lady mentioned that they once received seed for planting and in that case,
everyone was provided with seed and that they would like that to happen again.
Despite recognising that some of the unhappiness in the recent selection of youth for short
term jobs was due to a difference in understanding and criteria as employed through the
project andused by the community and recognising the importance of having their opinions
included in decision-making, the group did not feel comfortable ranking households into
wealth categories. The group agreed unanimously that MDF should decide on who benefits
and that they trust MDF to make the right decisions. They added that it would be too difficult
for them to make these decisions as everyone wants to be able to benefit and that could
cause tensions in the community.
A summary presentation was then provided on the results from the household survey and
ratified by the participants:
-Around 90% of households in the village live below the national poverty line.
-The most vulnerable households are: Households where most to all adults are unemployed,
women headed households, households with members living with disabilities, young single
mothers, households with a large number of small children between the ages of 0-6yrs and
households where not grants are received (‘Missing middle’ between ages of around 45yrs-
60yrs who do not receive child grants or pensions).
-Households where more than one member has short term contracts through iSimangaliso and
or WildTrust are better off than others in the short term, but it doesn’t help much for longer
term income stability.
-Basic access to services is extremely limited and includes, water, energy, sanitation and roads
(community access)
This led to a lively discussion around gas and electricity. One lady gave an example of the
costs associated with getting a gas bottle replacement – which included a taxi to Manguzi
(~R100), a boat across the lake (~R700) and a porter to their home from the lake (R60),
meaning a payment of R860 on top of the price of a gas bottle. People were very excited
about an option to discuss alternatives, of working together, or getting a gas bottle outlet
closer to their community or through the hub.
With solarenergy the discussion was around the fact that the batteries that they purchased
‘died’ quite quickly and now they have no lighting at night – only charging straight from the
panelduring the day. If there were charging stations for batteries at the hub, that would
assist a lot. The women were keen to discuss options for learning about solar energy,
different charging options, rental of equipment and batteries and solar lights. They mentioned
that they are aware that there is a lot of technology ‘out there’ that they do not know about
but would be grateful to be introduced to.
Nkovukeni CCA workshop: Day 2 (30th April 23 participants)
This day was a combination of a presentation of climate change adaptation proposed
activities and practices across the themes of soil, water, and crop management along with
soil fertility and taking care of indigenous environment as well as a demonstration of one of
the practices; tower gardens (greywater management). The demonstration was undertaken
at a homestead close to the hub.
MDF field and hub staff collectively ferried inputs across the lake in the community boat and
up the steep slopeall the way to the hub; this included gravel, droppers, shade netting,
seedlings, and refreshments.

12
Figure 4:MDF field and WIldtrust hub staff ferrying inputs across the lake
Climate Resilient Agriculture practices
One of the key objectives of the workshops is to build capacity among individuals and the
community of Nkovukeni to effectively respond to climate change challenges. Through the
interactive sessions from these workshops, participants gain insights into various adaptation
strategies such as ecosystem-basedapproaches, technological innovations, and community
engagement initiatives.
The workshop opened with a short recap of workshop 1, which was an introduction to climate
change and its impacts on nature, human life, and rural livelihoods. In the first workshop it
was highlighted that the reality of climate change necessitates a shift in the way people
interact with their environment and has increased the urgency to formulate solutions which
will ensure long term sustainability and resilience.
As the purpose of this workshop was to present possible CRA practices, the group was
asked to share the main factors they consider when preparing for their farming activities. This
exercise was aimed at understanding their thought processes and ideologies that inform their
farming practices. The responses focused primarily on procurement of inputs, water access
and land preparation. When probed on the practices they use when farming, the group
shared that planting is done mainly by hand and they use manureto boost fertility. In terms
of wateraccess, the group shared that this is a major challenge which is why they prefer
planting closer to the lakes and wetlands.
Following the above discussion was the presentation of CRA practices where the core
principles of sustainable farming were outlined which included: low use of external inputs,
maximising diversity, improvement soil healthand fertility, water conservation as well as
collaboration. It was explained to the group that farming goes beyond just obtaining food and
raw materials from the soil, but humans also have a responsibility to replenish the soiland
waterresources if farming activities are to be sustained over time. The team discussed that
climate change effects cannot be mitigated using a one-dimensional approach but require a
holistic approach to strengthen farming resilience. The five-finger model of soil and water
conservation was introduced which includes:
•Water management
•Limiting soil movement
•Crop management
•Soil health and fertility
•Taking care of indigenous plants

13
The discussion around the five-finger model was followed by adetailed presentation of the
CRA practices which were grouped within the five categories. Under water management,
practices included thebuilding of tower gardens, check dams, underground rainwater
harvesting storage tanks, diversion ditches and grey water use amongst others. In terms of
limiting soil movement, practices such as conservation agriculture, diversion ditches, stone
lines, contours and terraces were discussed. Practices under soil fertility included use of
manure, liquid manure, eco circles, trench beds and intercropping with leguminous crops
amongst others. The demonstration of the tower garden was facilitated after this plenary
session.
2.1.5 One day trainings in climate resilient agriculture practices
This process consisted of a group demonstration of the practise followed by another day of
working together on building tower gardens for 2 of the 10 participants who were identified by
the participant group to receive inputs for these tower gardens.
Tower Garden Demonstration
The tower garden demonstration was heldat Mrs Mita
Vumase’s homestead. It was explained that a tower garden
is a vertical planting system which allows planting to be
done in different areas, on the sides and on top. It consists
of a stone/gravel ‘pillar’ at the centre which is where
irrigation is done. The stones help to filter out unwanted
particles and soap from the greywater and spreads the
water throughout the ‘tower’ It is a low-cost system which
allows a farmer to grow a range of leafy vegetables such as
spinach, kale, Chinese cabbage, mustard spinach and
lettuceon the sides. Root vegetables such as beetroot and
onionare grown at the top, as well as green peppers and
tomatoes.
Figure 5: Right; Toward garden constructed with inclusion of leaves and
organic matter to augment infertile, sandy soils of the areas
Due to the sandy soils in the area, one of the tower gardens had a thick layer of organic
matterat the bottom to help keep some of the water in the garden. In another household
there was a lot of dry leaves from trees in the yard that were mixed with soil andput in layers
alternating with soil.
Figure 6: Above: Pictures of the tower garden demonstration session at Mita Vumase’s homesteads

14
The following 10 participants undertook to try out the tower gardens:
1.Elizabeth Ngubane
2.Jabu Ngubane
3.Gloria Zwane
4.Gugu Mathenjwa
5.Mita Vumase
6.Slindile Buthelezi
7.Khanyisile Sibiya
8.Ntombikayise Mlambo
9.Velisiwe Mthembu
10.Violet Sibiya
At the end of the workshop each of the 10 participants received their input packs to build
their tower gardens. These included seedlings, a bag of gravel, poles and shade net.
On Wednesday, the 1st of May the MDF team returned to Nkovukeni to assist some of the
participants who expressed interest in the tower garden. They were requested to collect all
the required materials the day before. Two tower gardens were built, and the shade net bags
were sewn and dropped off at the hub for the seven remaining participants. Hub stuff and the
Enkovukeni
WhatsApp
group was
used to relay
the message
for
volunteers to
collect their
sownnets.
Figure 7:
Materials
divided and
provided to the
9 remaining
volunteer
participants
Figure 8:Left; Voilet
Sibiya,and Right;
Elizabeth Ngubane with
their two tower gardens
planted with seedlings.

15
Mabibi Climate change adaptation workshop (2nd May and 20th -22nd June 2024)
CCA workshop : Day 1 (33 participants)
This was the first set of trainings held in Mabibi after the three levels of community engagement
meetings. Thegroup that attended was made upof twentywomen andthirteen menwhich
included the local induna.
Siphamandla Masuku
the hub supervisor,
was key in setting up
this day where he
contacted local
leadership and helped
to spread the word
with regards to the
workshop details. He
also commandeered
hub staff to assist with
preparing lunch for the
audienceasthe
workshop was a full
working day.
Figure 9: A view of CCA
workshop participants at
Mabibi hub, 2ndMay 2024.
Upon introductions and welcome, the agenda was set a follows:
1.Team and Community Introduction
2.Purpose of the day (workshop)
3.Past, Present and Future
4.Scientific Presentation on Climate Change for this area
5.Seasonality Diagrams
The workshop outline, follows the same steps as that undertaken at Nkovukeni . A workshop
outline is attached in Addendum 1 of this report. Due to a late start, otheractivities happening
in thearea, the programme was again shortened slightly to accommodate the participants.
Team and Community Introduction
MDF team introduced themselves to the community of Mabibi, with emphasis on theirrole;
implementing Climate resilientagricultural practices and new ideas inthe adaptation toclimate
change through intensifying production and reducing pressure on the natural resources on the
environment, more so in the ecologically sensitive iSimangaliso Wetland Park.
According to the community of Mabibi, 90% of the villagers are involved in agricultural activities
where they have gardens, and some have cropping fields which are larger insize compared
to their garden sizes. Popular field crops in the area are cassava, sweet potato, and peanuts.
According to participants there is no specific time to plant cassava; they just plant it whenever
they think there has been enough rainfall at that time. Other crops cultivated inlcudemaize,
cowpeas and amadumbe (taro) as well vegetables such as onions, spinach, tomatoes, carrots,
beetroot, lettuces, and cabbages.
Some of the households have fruit trees such as avocados, naartjies, oranges, mangoes and
some of the indigenous fruits such as Inkuhlu and amahlala. They also have livestock including
goats, pigs, cattle, broilers, and traditional chickens.

16
Men in the villages do fishing in the ocean and in Lake Sibaya. However fishing is seasonal in
this community, they do fishing in September in the lake, but during high tides they fish on the
oceanin a more ongoing way. They get different varieties of fish such as bream,and catfish
and octopus which is said to be used as bait on the hook.
As per the community, climate change is evident through increased unpredictability in weather
patterns. Temperatures have definitely seen an increase; it is getting hotter although there
haven’t been considerable changes in rainfall patterns. There have been organizations in the
area talking to villagers about climate changebefore this. Participants were able to differentiate
between weatherand climate; weatherbeing daily conditions and climatebeing changes in
weather patterns over years.
Past, Present and Future
Past
•In the past therewere crops which villagers used to plant, and they would grow very wellbut
now it is difficult for them to grow (sorghum is one of those crops).
•There were plants that used togrow inthe wild and we would harvest it for household
consumption.
•We used to have wild potatoes.
•We used to see mushrooms but now they have disappeared.
•We used to harvest Sedwane (small tomatoes in the wild)
•All these things above are no longer present in the area.
Present
•We have noticed that it is getting a lot hotter now.
•Winter is having a short span now and not as cold.
•There are still community members who believe in agriculture, they have gardens, and some
have livestock.
•Vegetables can grow well in these areas and livestock have adapted just fine.
•Most men practice fishing in the Lake and the Ocean and there is already fish stock pressure in
the lakes.
•Lake water levels are dropping rather faster than it rains.
•More plantations than before.
Future
•If this climate change carries on like this, we are going to have more frequent droughts.
•Our crops will die due to lack of rain.
•There will be hunger in the community.
•Water sources will dry up even more and faster.
•The cattle pasture will dry up and this will be a huge problem to our livestock as it will increase
mortality rates.
•Fish population will continue to decline.
•There is going to be new and bigger outbreaks of diseases.
Exploration of climate change in this area
Theadapted SAEONpresentation was givenin Mabibi as well, talking tochanges suchas
reduction in lake waterlevel, loss of wetlands and burning of peat, exacerbated by greatly
increased area underplantations, mining operations and destruction of wetlands andflood

17
plains for habitationand farming. This was information
participants are aware of, but they were very alarmed
when they saw the research and how lake Sibaya is
losing water. However, they are still confident thatthe
amount of rainfall they arereceiving each year will not
change.
Figure 10: Mazwi talking to scientific data specific to the area and
what it means for the community and their livelihood activities
Seasonality Diagram (Mapping)
After the Climate Change presentation, seasonality
diagrams were done where small groups of participants
worked on outlining monthly temperatures and rainfall
and changes in these over time.During thediscussion
and the mapping,the participants concluded that they
receive most of their rainfall on
October, November, December,
and January. Then rainfall will
start to decline in February to
July where the rainfall is the
lowest ornone, then it starts to
pick up in August and
September. Regarding
temperature, the graphs show
December and January are the
hottest months, with June and
July with the lowest
temperatures. However, the
community members have
noticed that winters are now
shorter and continue to be
warmer than usual.
Figure 11: Above the small group and
monthly temperature diagram
developed and below, the rainfall
diagram showing different activities
undertaken at different times of the year
The session was closed after
this exerciseand the rest of the
programme is to be covered
during day 2 of the workshop,
towards the end of June 2024.
2.2 Planning for upcoming period (July-December 2024)
Activities to beundertaken:
➢Finalise baselines for Sokhulu in partnership with UKZn (cathy Sutherland and team) and write
baseline narrative report
➢Finalise CCA workshops for 3 hub villages inside the iSimangaliso WP.

18
➢Conduct CCA workshop and training of trainers for 3 hubs and youth - Mabibi and
kwaDapha/Nkovukeni –and plan for implementation of a demonstration garden at 2-3 hubs
(set up garden plans, budgets for inputs and materials, procurement and workplan activities
for each hub and submit to WildTrust)
➢Training in soil and water conservation for Hub staff and communities for 3 hub villages
(include tower gardens, trench beds, micro-tunnels, mixed cropping, mulching, drip irrigation,
composting, crop diversification and seedling production, field cropping (conservation
agriculture) (Min of 3 training days per village)
➢Initiate local mapping of water sources and assessment of present boreholes and provide this
as background documentation to employ a technical expert to site potential community
boreholes.
➢Start on creation of beneficiary lists for JoJo tanks- as well as batch order and delivery
arrangements for these.
➢

19
Addendum 1: CCA workshop outline
Community level climate change adaptation exploration workshop outline
DAY 1
Time
Activity
Process
Notes
Materials
Who
9:00am
INTRODUCTION
9:00-
9:45am
Community
and team
introductions
who is in the room -
Depending on the
size of the group,
this can takea long
time. If time is short,
then just do a quick
round of intro's.
Attendance
register - with
columns for farming
enterprises (sothat
each participant
can tick what they
do) - in English and
Zulu Name tags;
stickers, kokis
Facilitation:
Tema,
Recording:
Nqobile
Purpose of
the day
Introduction of the organisation/s
and purpose of this workshop- link
to already ongoing activities if
possible and introduce visitors and
other stakeholders involved. Climate
change as a concept, people's
concept of it. And overall impact,
difference between weather and
climate...
talk to CC
necessitating
adaptation from us -
we may need to
change how we do
things and what we
do to - This w/s is to
help us explore
options for such
changes
Flip stand,
newsprint, kokis,
data projector,
screen, extension
chords, plugs -
double adaptors.
Black refuse bags
and masking tape
(for blacking out
windows), camera-
and one person to
undertake to take
photos throughout
the day. Extra
batteries for camera
and sim card
Materials:
Tema and
Nqobile
Facilitation:
Tema
Recording:
Nqobile
9.50
PAST, PRESENT, FUTURE
9.50-
11.00am
Discuss
farming
activities as
they have
changed ,
what they
are now and
what may
happen in
the future if
the present
trends
continue
Whole group discussion on what
people are presently doing… in all
livelihoods - how does this compare
with past and future SMALL
GROUPS (5-10people): facilitated
discussion on farming activities
(include the 5 categories) - prompt
for all five and keep conversation
focussed OR
Facilitate a shorter plenary
discussion on how things are
changing( if time is pressing)
Important to note
and record any
discussions around
changes and
adaptations- so
things people are
already doing to
accommodate for
changes - also
where they are not
sure what to do
Small groups; each
needs a facilitator
and recorder
Facilitation:
Tema
Recording:
Nqobile
11:00 -
11:50pm
Summary of
predictions
for the
locality (from
scientific
basis)[15min]
Present to group - using flipchart or
PowerPoint - Keep it simple with
brief bold statements that can be
remembered. Include concepts of
certainty - and CC scenarios -
unmitigated, neutral and mitigated
Facilitation:
Erna
Translation:
Nqobile,
Tema
12:00pm
TEA
Fruit (apples,oranges, biscuits, juice and water, paper cups (lots) and plates…
Generous helpings - and lots of juice if it is hot. Find someone to be in charge of
food and refreshments, while the rest of the workshop continues
Tema
CLIMATE CHANGE patterns
12.30pm
Seasonality
diagrams
[25min]
SMALL GROUPS (5-10people):
facilitated discussion on
temperatures for each month of the
year- in a normal year and then
discuss how this is changing and
going to change. Start with the
hottest month and then the coldest
month as reference points
Do temperature first
or if thegroup is
small and works
quickly include
rainfall then on the
same chart.
Easy to use kebab
sticks bought from
supermarket for
this. Small groups;
each needs a
facilitator and
recorder
Facilitation:
Mazwi/Tema
Recording:
Nqobile
1:00pm
REALITY/IMPACT MAPS

20
1:00-
2:00pm
SMALL GROUPS (5-10people):
facilitated discussion - MIND MAP
of livelihood and farming impacts
(using the 5 categories) using Hotter
(drier) as the starting point -
LINKAGES between cards on the
mind map - make arrows (and
include more cards if need be and
discuss (e.g. hotter soils, lead to
poor germination lead to poor yields
lead to hunger)
Prompt for social,
economic,
environmental
impacts as well if
these don't come up
in the group…
Small groups; each
needs a facilitator
and recorder
Facilitation:
Mazwi
Recording:
Tema,
Nqobile
2:00-
2:30pm
POSSIBLE SOLUTIONS: things
that people know, have changed,
have tried and or are trying to deal
with the changes. Use different
coloured cards to attach these
solutions to the mind map. If
participants are struggling then
rephrase the -ve impact statements
into a +veoutcome and ask what
actions are possible.
Also make a
separate list on
newsprint of names
of people trying
things plus the
innovation they are
trying (this is to
facilitate h/h visits
on day 2)
The cards need to
be written in local
language with
smaller translations
in English written in
on the cards as well
(to avoid the need
for alter
translations)
Facilitation:
Tema
Recording:
Nqobile
2:30-
2:45pm
CLOSURE
REPORT BACKS - of possible
solutions PLANNING FOR DAY
2 - choose 3-4 participants for
household visits and ask for a small
group of other interested individuals
to join. Decideon venue and time
(12 noon) for continuing with
practices
Households to be
within walking
distance hopefully.
Otherwise drive
these 3-4
participants around
and meet for focus
group thereafter
Rapporteurs need
to be chosen from
the group to
summarise the
solutions in the
report backs
[5min/group]
Facilitation:
Tema
Recording:
Nqobile
LUNCH Local catering groups to provide meals -~R45 per head (Rice and stew with one veg…
or something similar- )
Tema
DAY 2
9:00am
VULNERABILITY ASSESSMENT
9:00 am-
9:30am
Recap and
days
program
RECAP: summarise Day 1, the
information we got as what locals
consider climate change and impact
thereof. Link these changes to
impacts with regards to livelihoods
across the 5 categories and the fact
that changes in the way we do
things need to change to account
for the certain hotter and drier
conditions and what can be possibly
done toreduce impact.
use flip charts and
mind maps from
Day 1 to recap
Facilitation:
Mazwi
Recording:
Nqobile
09:30am-
10am
Rich, better
off, poor,
very poor
Focus group discussions around
vulnerability can to supplement
baselines and also to discuss and
look at vulnerability through the
eyes of the community. How do we
define rich, better off, poor,
extremely poor in the village. Write
descriptions on a flip chartand
groups in the 4 categories
Participants need to
explain and identify
vulnerability in their
own unique way
kokis, flip chrt
Facilitation:
Mazwi
Recording:
Nqobile
10:00
am-11:00
am
Different
groups,
different
eyes
Divide the group into smaller groups
according to age and gender –
spend a short while deciding with
the group which sub-groups will
work for them. Subgroup to identify
all households, adding household
heads (male, female, child headed
ect) onto maps of the village. These
household would then be placed on
a wealth group through discussion
Explain that this is
done because
different groupings
are focused
somewhat
differently – different
things are important
or difficult for
women than men for
example, for youth,
for households
without access to
social grants
Kokis, flip chart,
small cut paper,
maps
Facilitation:
All three,
each with a
group

21
11:00
am-11:30
am
Plenary
Subgroups convene and the charts
are discussed together with the aim
of comingup with one wealth
ranking after which the final version
is compared with what the
household survey are saying
Supportingperson
to record all
discussions
PowerPoint
presentation of
Nkovukeni
vulnerability
assessment
Facilitation:
Mazwi
Recording:
Nqobile
11:00
am-12:00
pm
TEA
Fruit (apples,oranges, biscuits, juice and water, paper cups (lots) and plates…
Generous helpings - and lots of juice if it is hot. Find someone to be in chagre of
food and refreshments, while the rest of the workshop continues
Tema
Slide presentation up to income sources - whole group quick ranking of the sources
12:00
pm-13:00
pm
Risk, hazard
and
vulnerability
After presenting the slide – what
makes us vulnerable and discussing
some of the aspects such as access
to resources, seasonality of access
and food availability, land
entitlements, water etc, and also
discussing how things are changing
due to CC (so reduction in
availability, increased hazards and
the impact of these):
a. In each small group participants
name the most important risks,
issues, problems, hazards
b. These are then ranked in order of
importance
Support persons are
to record the
discussions, with
reasons given for
the rankings
Flip chart, kokis
Facilitation:
Tema
All three with
a group,
depending
on the
number of
small groups
13:00-
13:30 pm
4. Potential solutions
Fromthe prioritized list of issues
possible solutions are proposed for
each. This activity ties into the
adaptation strategies developed
through the climate change analysis
process and should provide some
entry points for action.
Link this to practices
for CC adaptation
Facilitation:
Tema
Recording:
Nqobile
13:00 pm
2:00pm
WAY FORWARD
LUNCH Local catering groups to provide meals - ~R45 per head (Rice and stew with one
veg… or something similar- )
Tema
CLIMATE CHANGE PREDICTIONS:
Hotter
1-4 degrees Celcius
For every month of
the year
HIGH probability/
Certainty
Less rain
Similar amount of rain but over a
shorter period of time (fewer rainy
days per season)
This will lead toan
overall drying effect
in the environment
MEDIUM certainty
greater intensity of rainfall
Morerain in spring and or more rain
in summer
Storms
LOW certainty
Longer term
Greater frequency of droughts under scenarios 1 and 2
Scenario 1 -
Business as usual
Scenario 2 -
Stabilise emissions
Scenario 3-Reduce
emissions
Greater frequency of extreme rainfall events under
scenarios 1 and 2