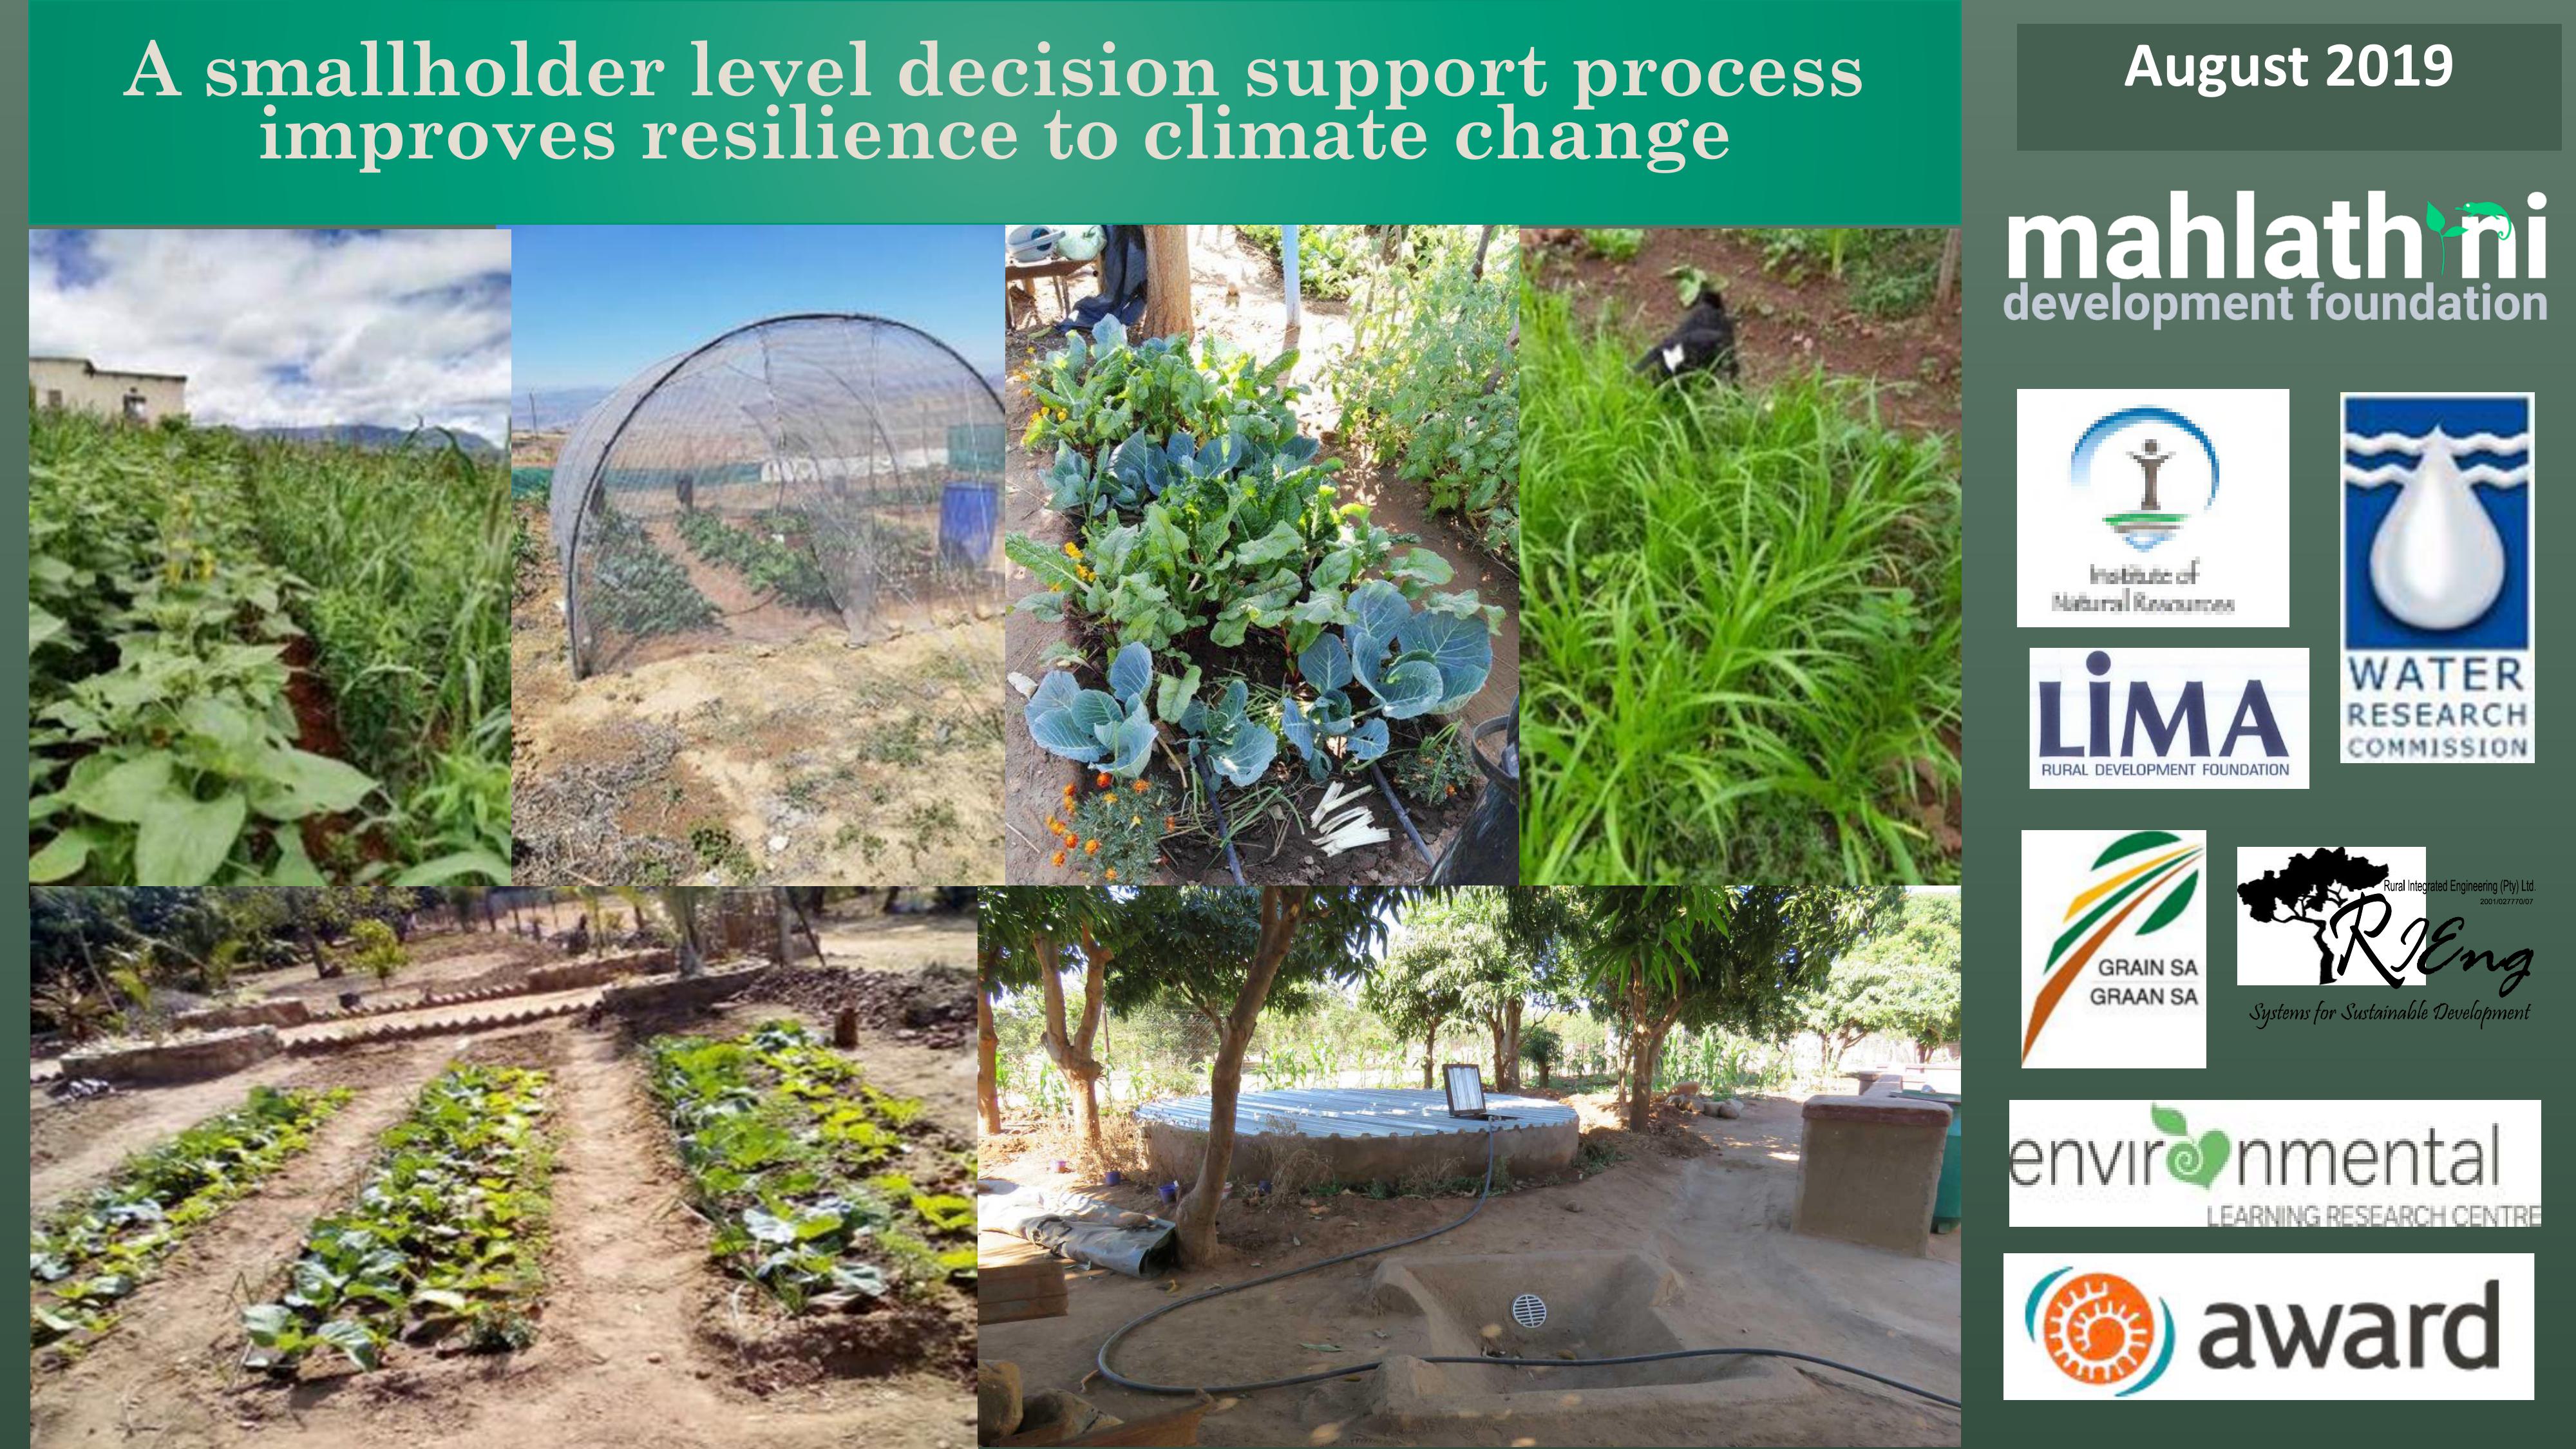
August 2019
A smallholder level decision support process
improves resilience to climate change
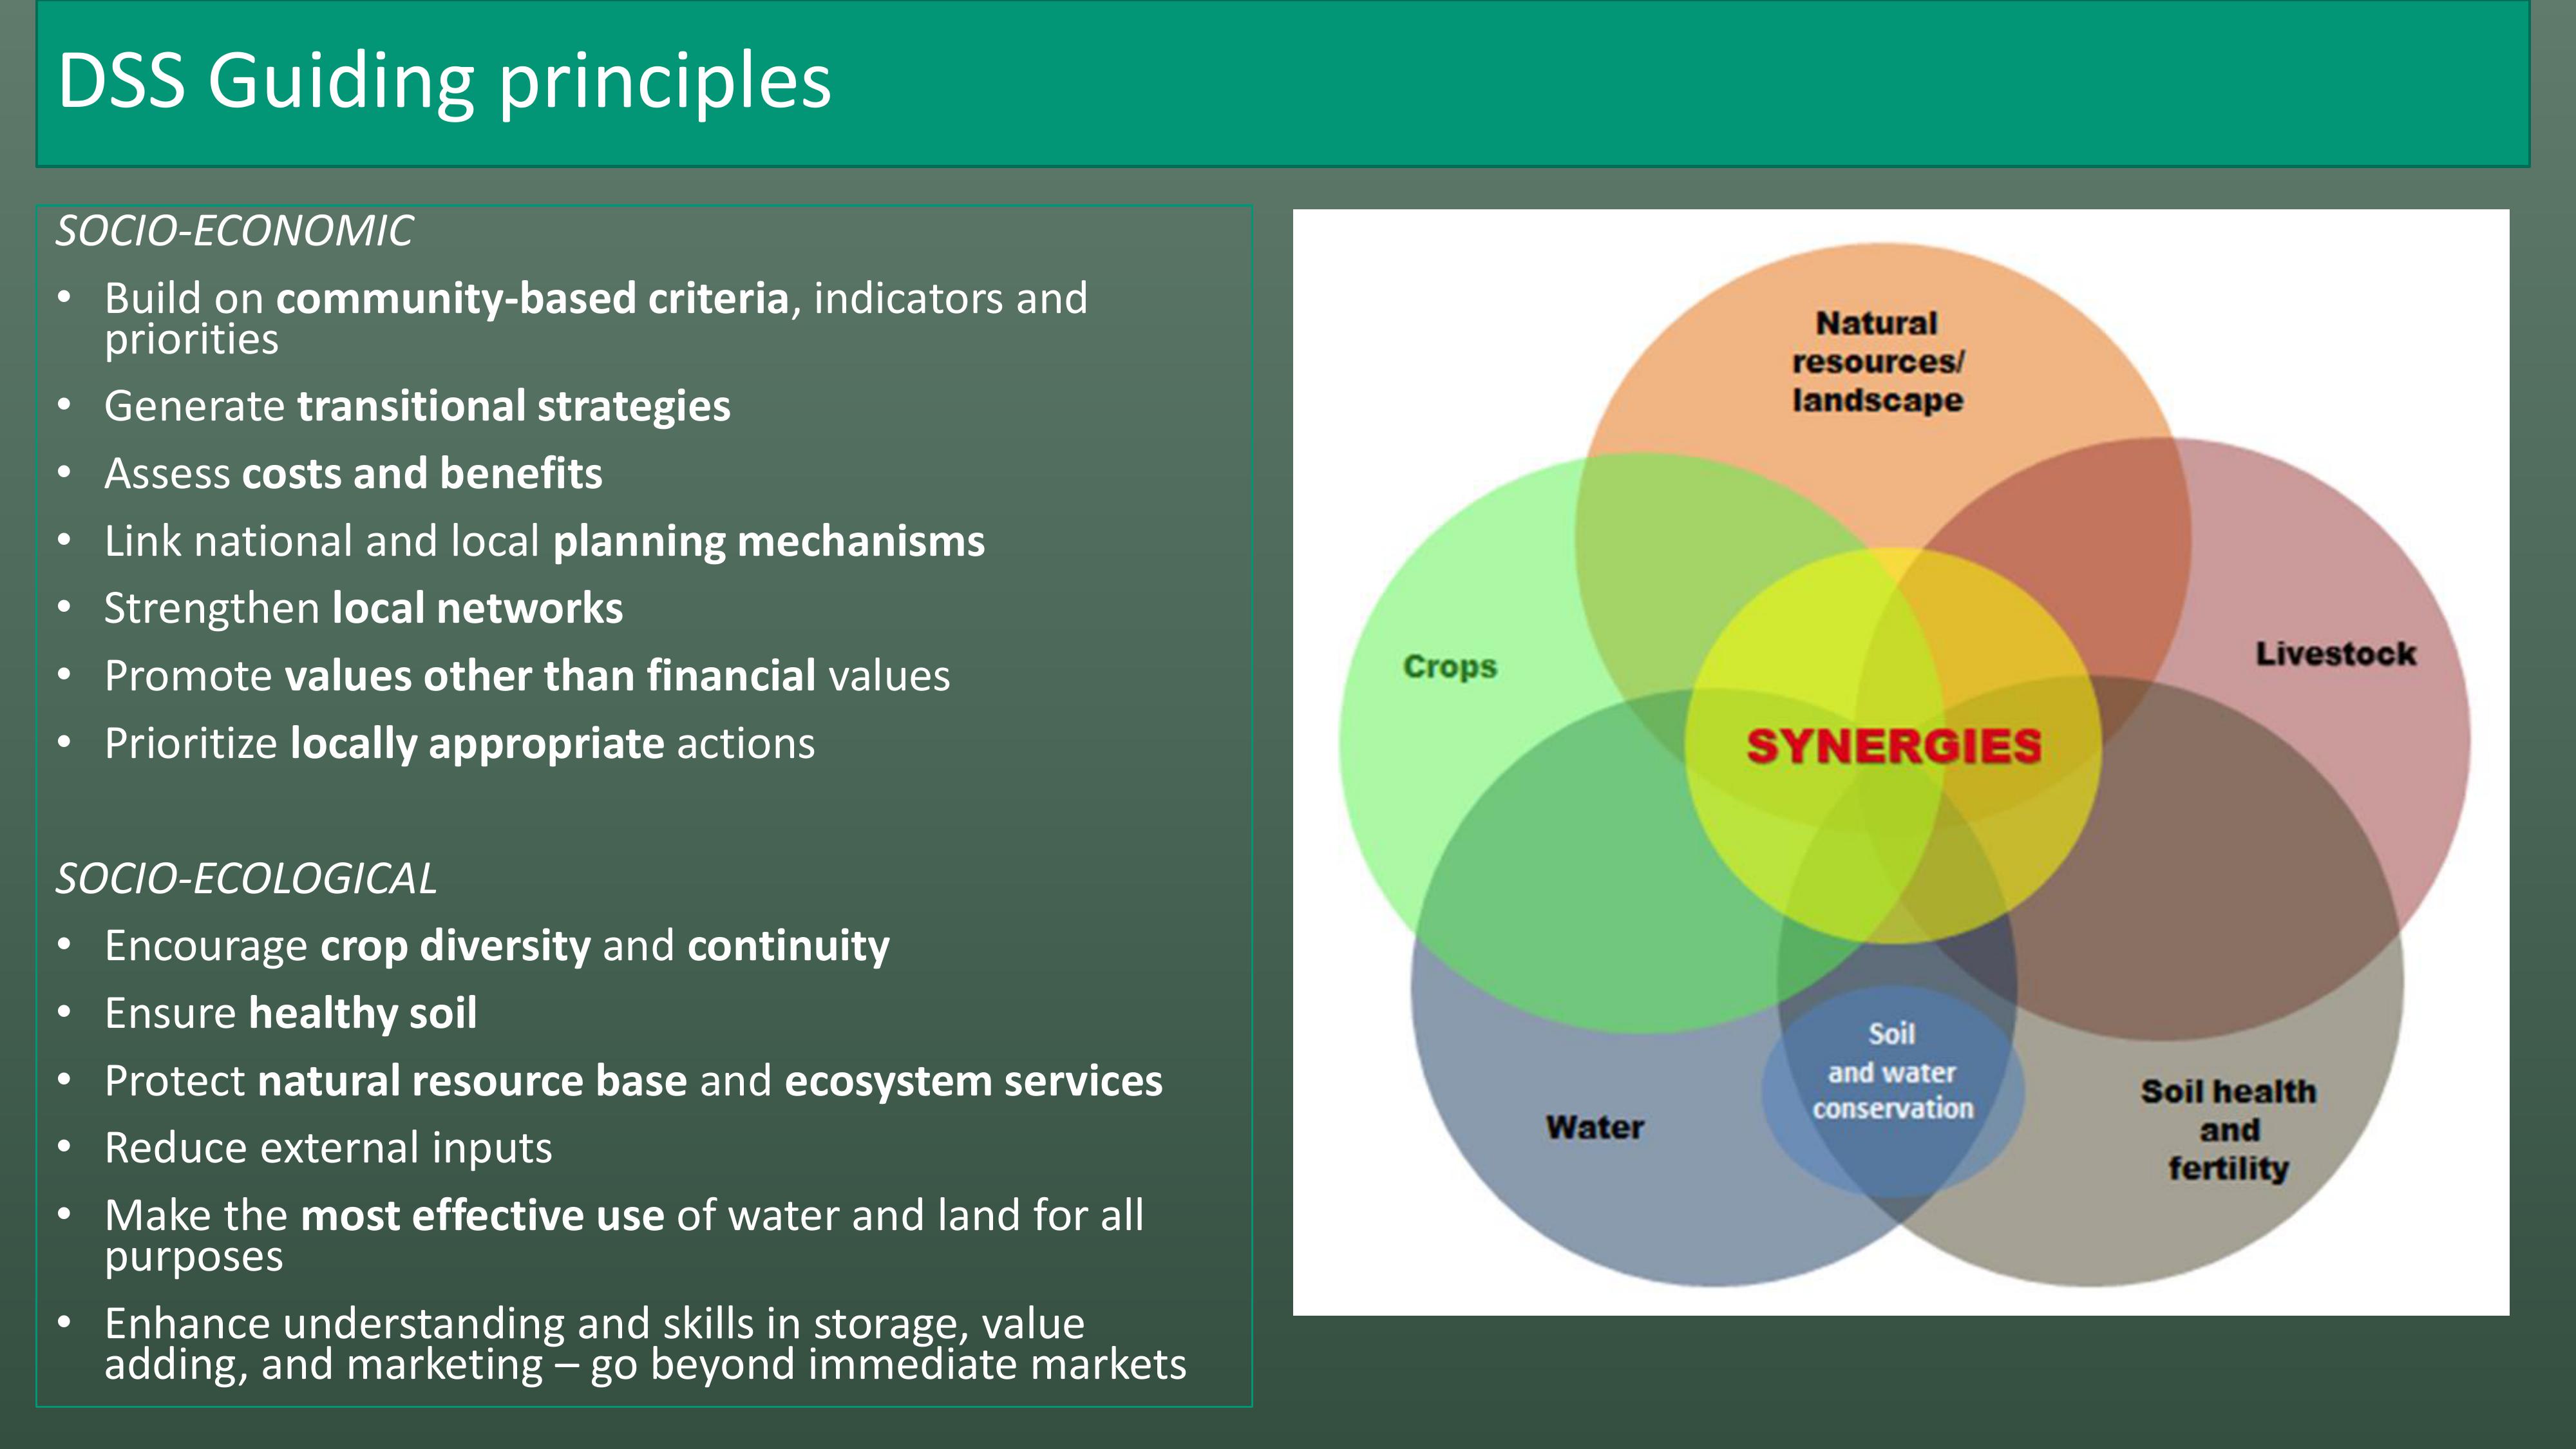
SOCIO-ECONOMIC
•Build on community-based criteria, indicators and
priorities
•Generate transitional strategies
•Assess costs and benefits
•Link national and local planning mechanisms
•Strengthen local networks
•Promote values other than financial values
•Prioritize locally appropriate actions
SOCIO-ECOLOGICAL
•Encourage crop diversity and continuity
•Ensure healthy soil
•Protect natural resource base and ecosystem services
•Reduce external inputs
•Make the most effective use of water and land for all
purposes
•Enhance understanding and skills in storage, value
adding, and marketing –go beyond immediate markets
DSS Guiding principles
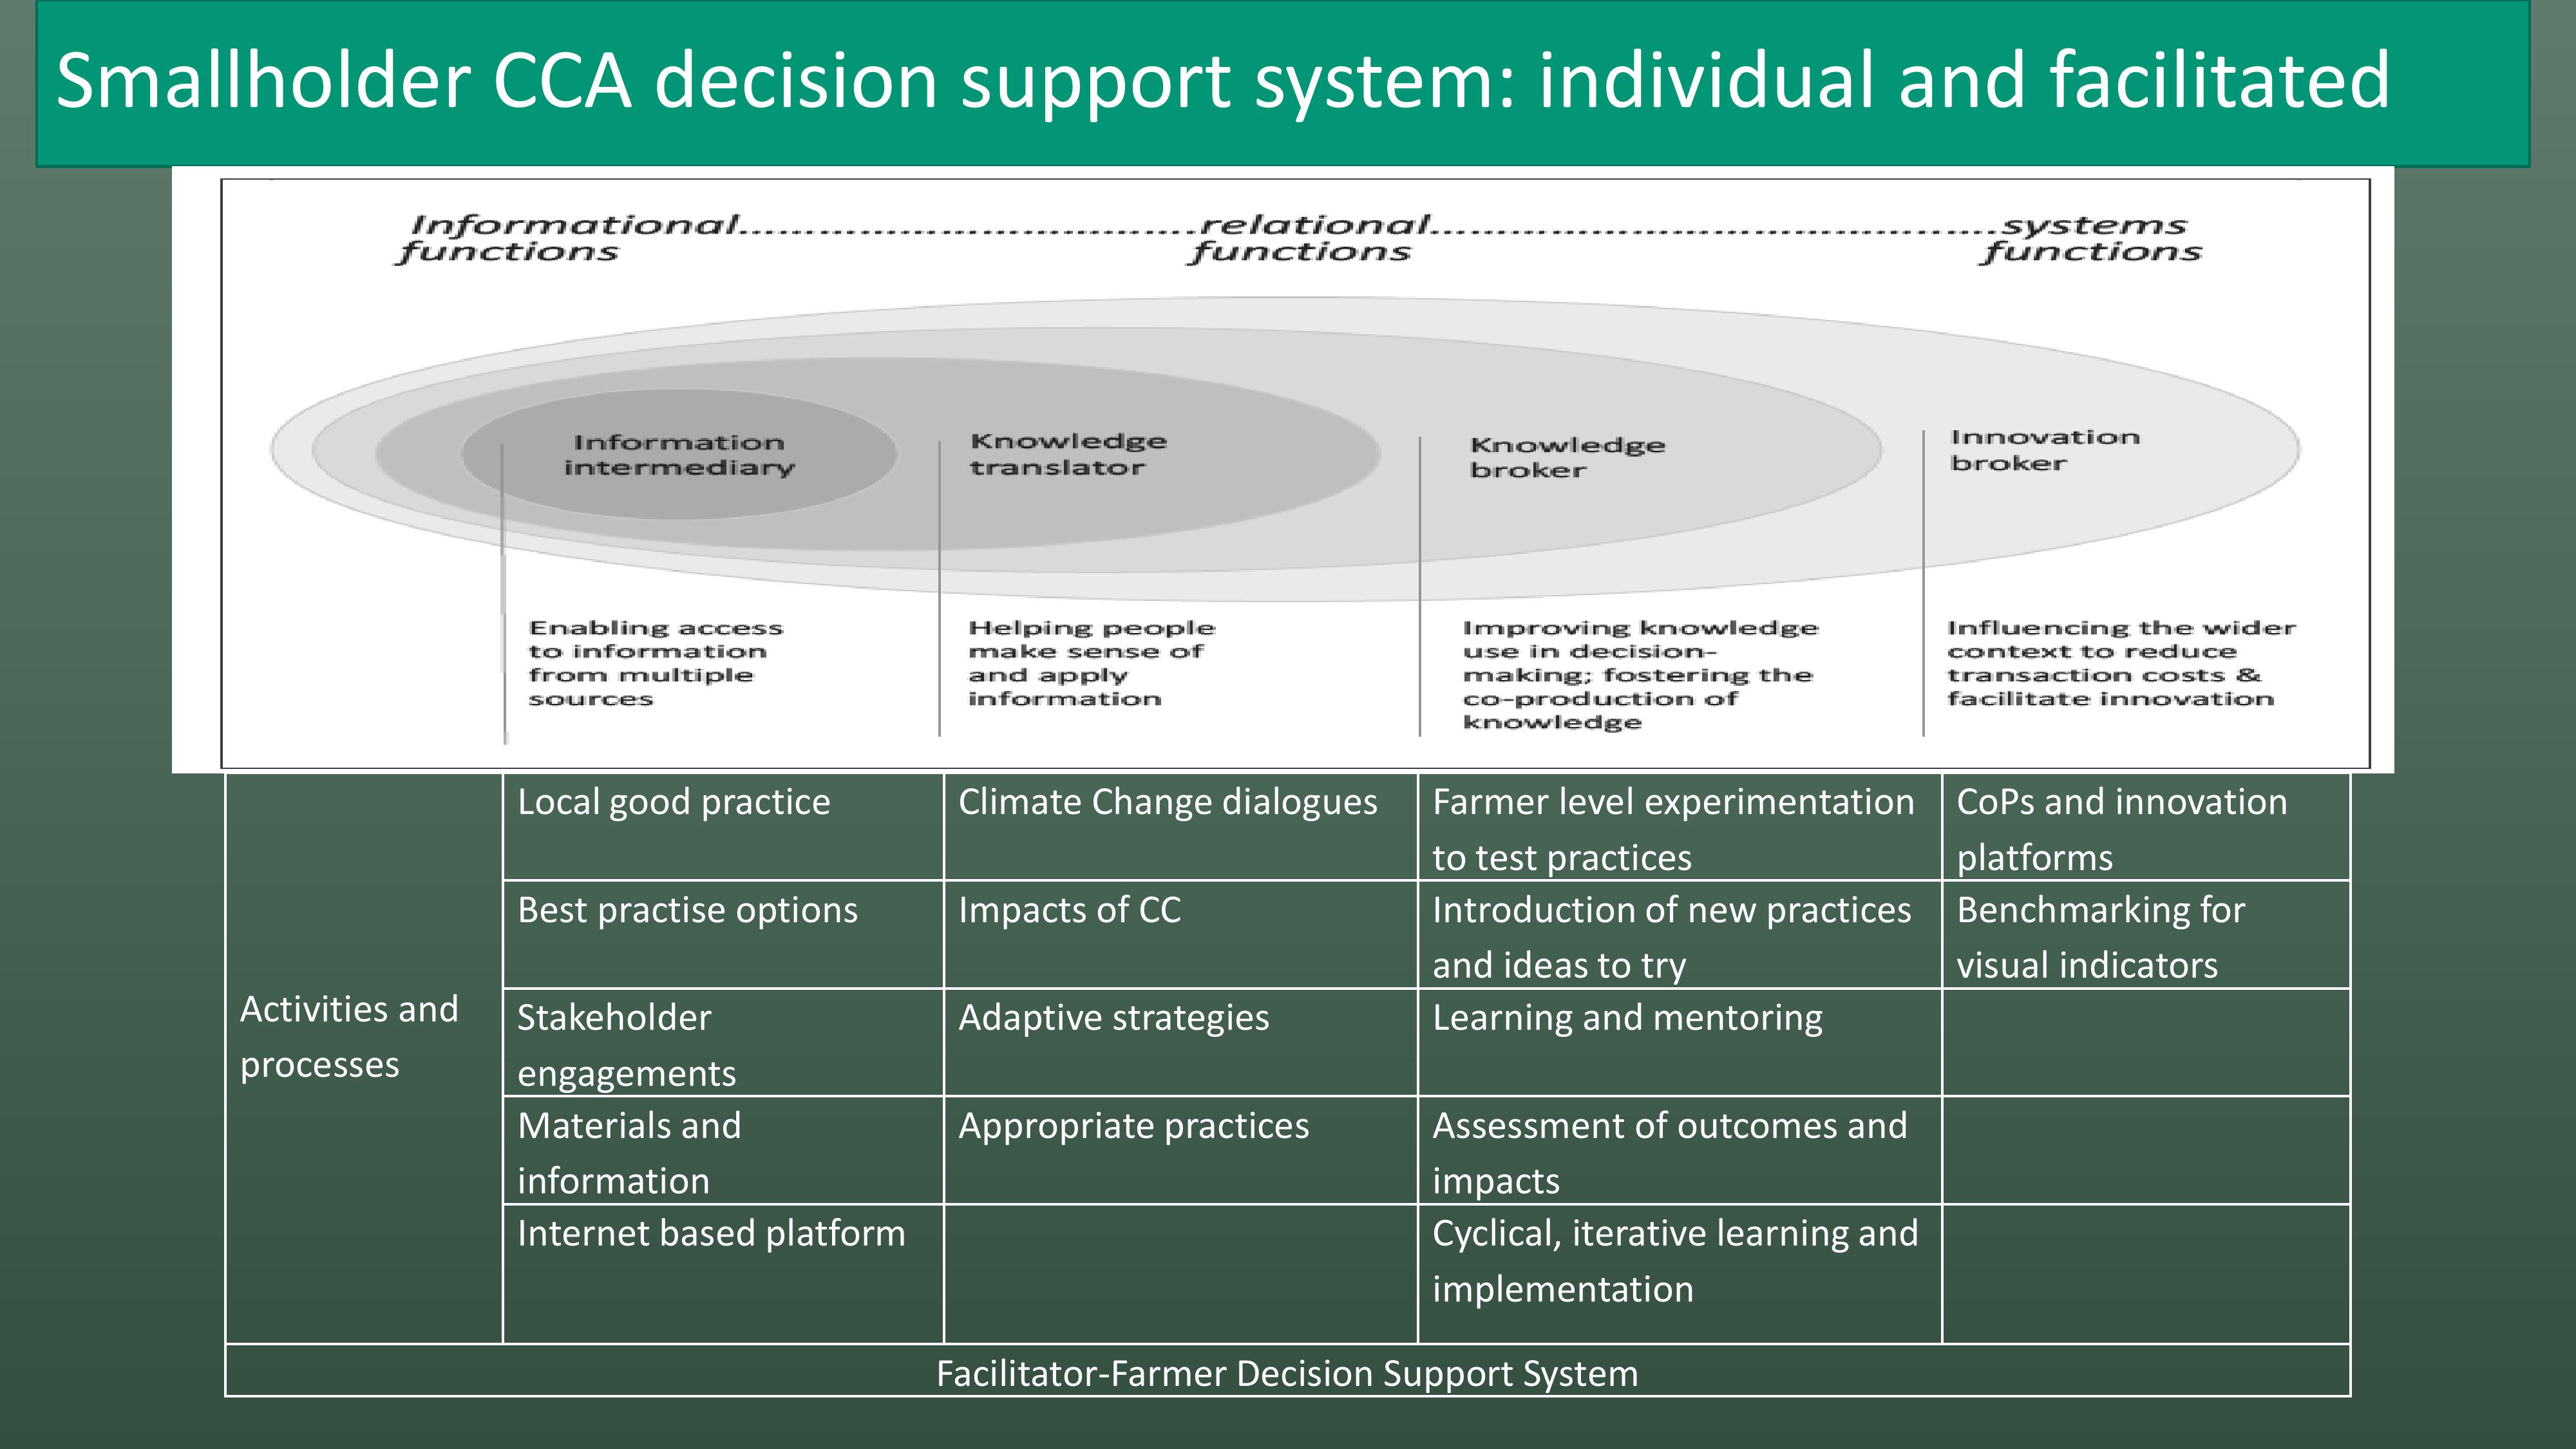
Smallholder CCA decision support system: individual and facilitated
Activities and
processes
Local good practice
Climate Change dialogues
Farmer level experimentation
to test practices
CoPs and innovation
platforms
Best practise options
Impacts of CC
Introduction of new practices
and ideas to try
Benchmarking for
visual indicators
Stakeholder
engagements
Adaptive strategies
Learning and mentoring
Materials and
information
Appropriate practices
Assessment of outcomes and
impacts
Internet based platform
Cyclical, iterative learning and
implementation
Facilitator-Farmer Decision Support System
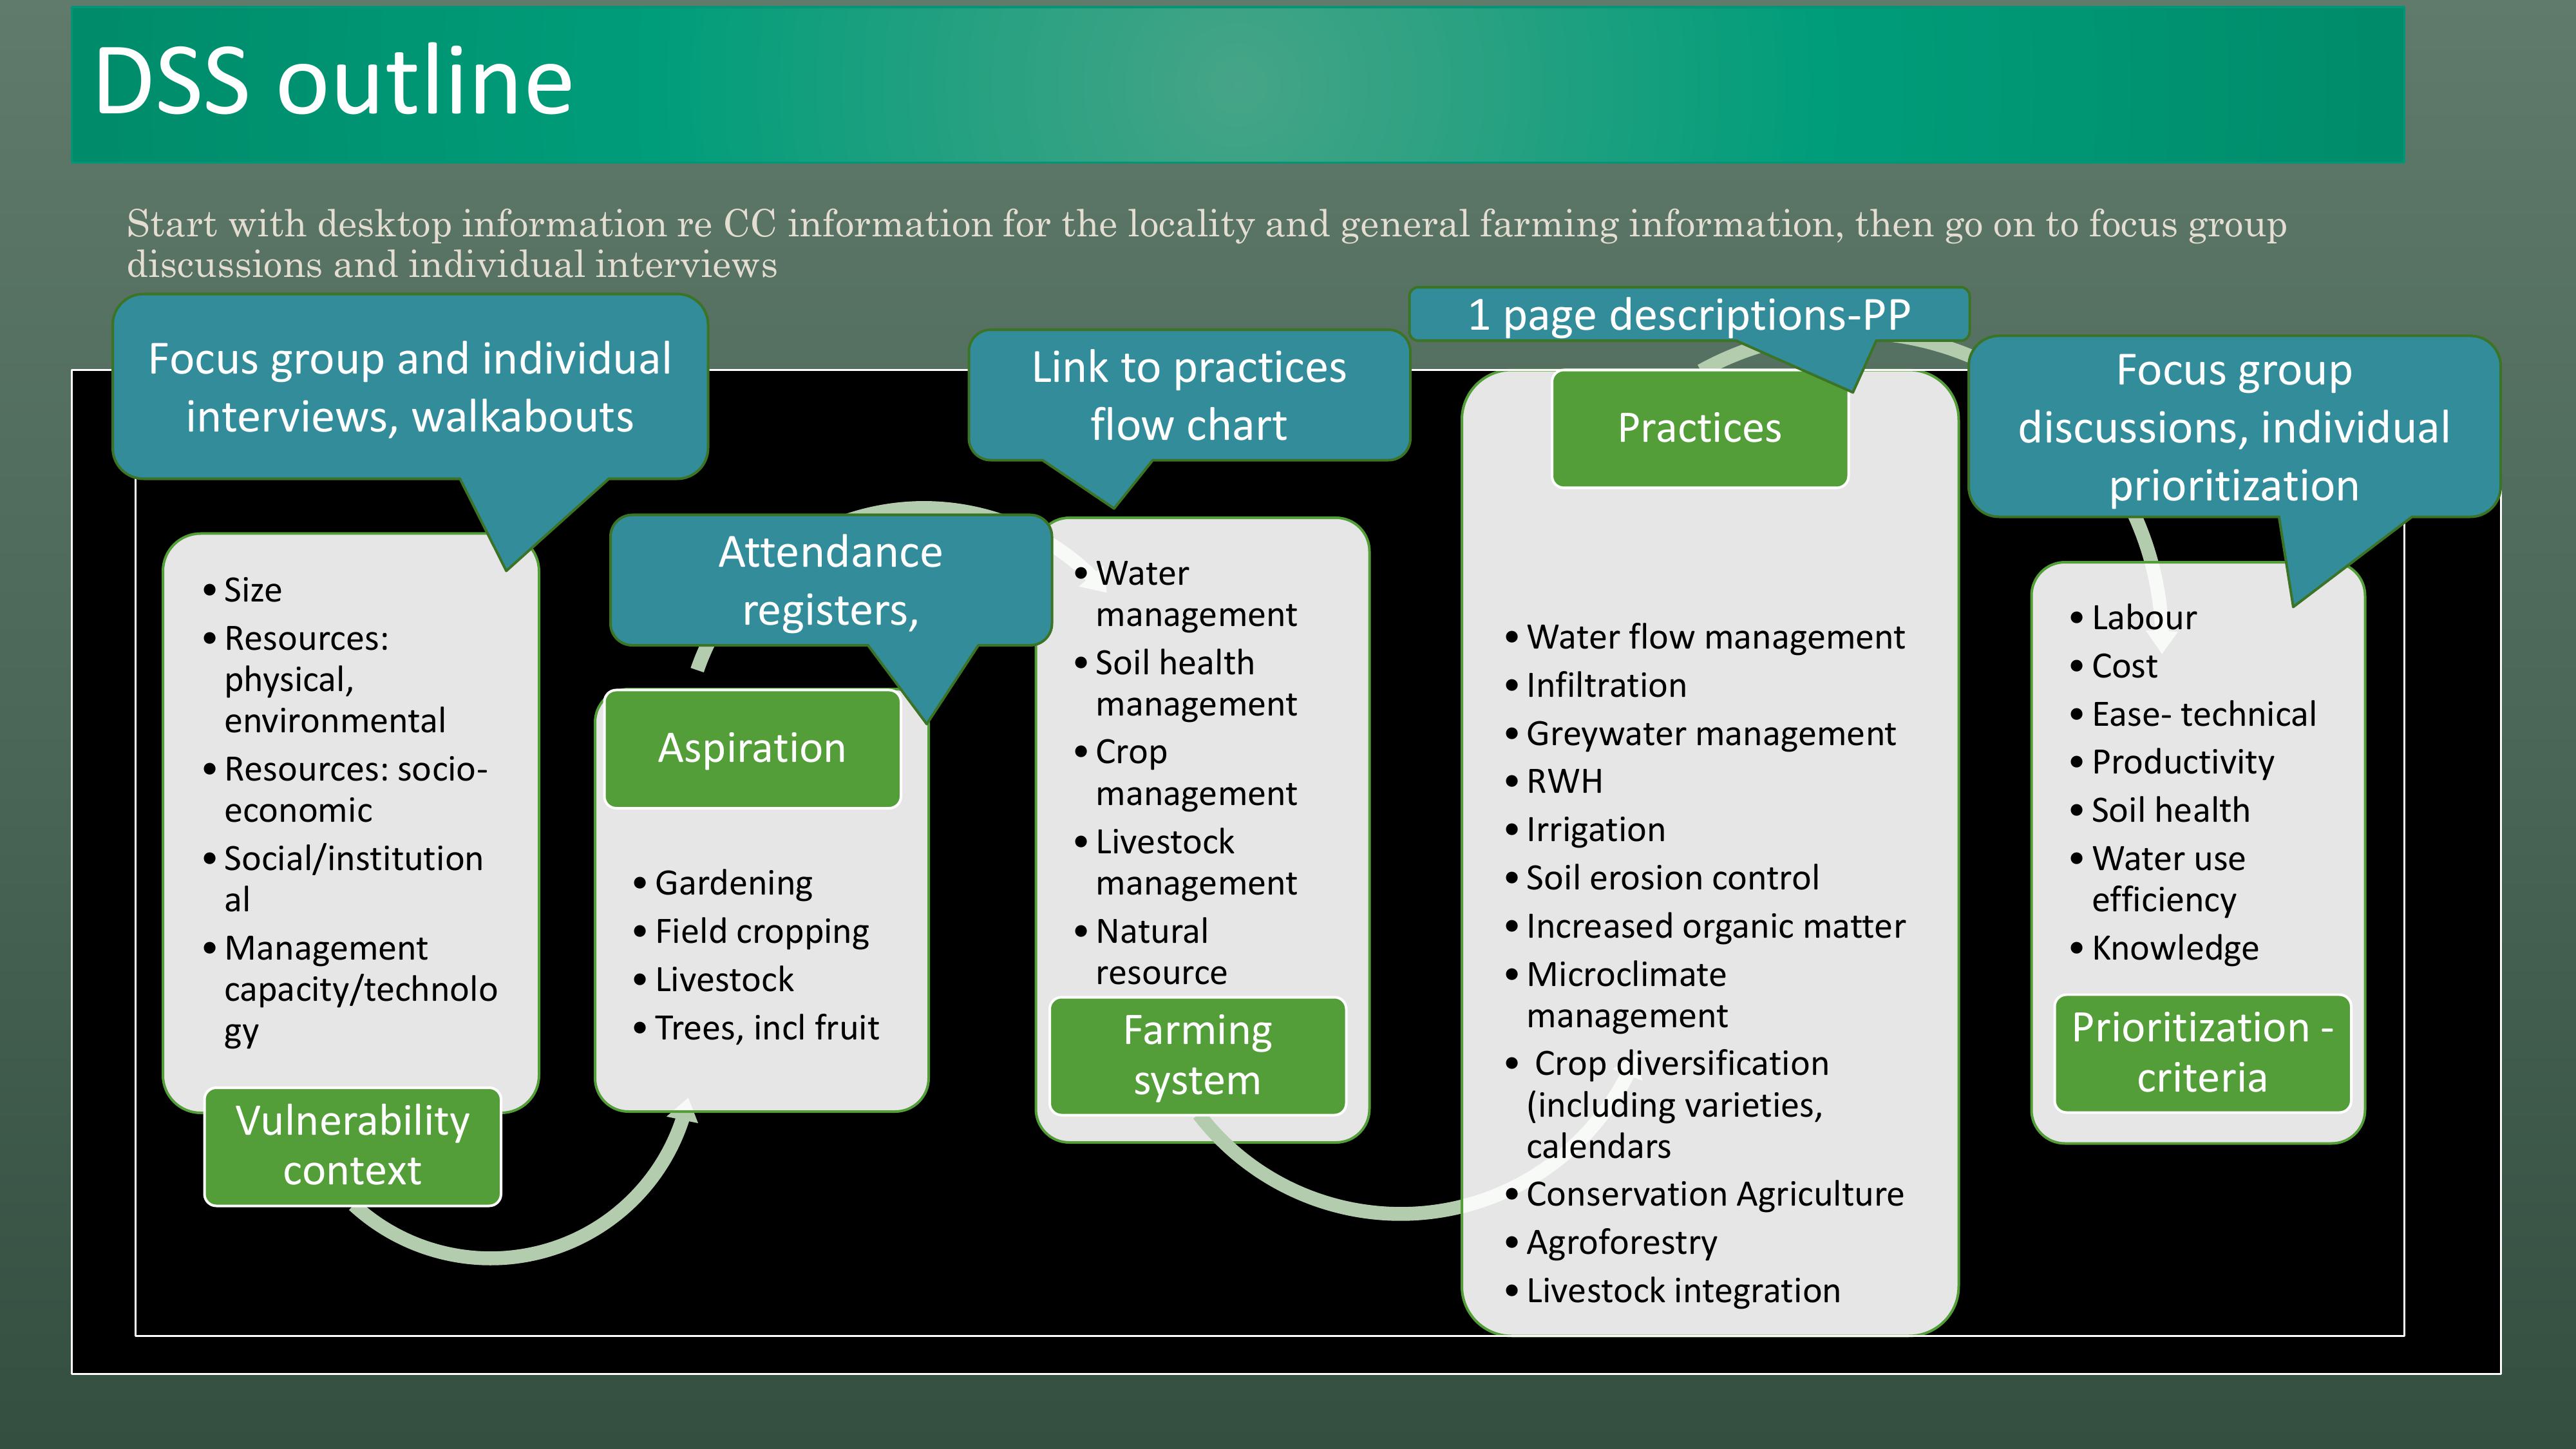
Start with desktop information re CC information for the locality and general farming information, then go on to focus group
discussions and individual interviews
•Size
•Resources:
physical,
environmental
•Resources: socio-
economic
•Social/institution
al
•Management
capacity/technolo
gy
Vulnerability
context
•Gardening
•Field cropping
•Livestock
•Trees, inclfruit
Aspiration
•Water
management
•Soil health
management
•Crop
management
•Livestock
management
•Natural
resource
management
Farming
system
•Water flow management
•Infiltration
•Greywater management
•RWH
•Irrigation
•Soil erosion control
•Increased organic matter
•Microclimate
management
•Crop diversification
(including varieties,
calendars
•Conservation Agriculture
•Agroforestry
•Livestock integration
Practices
•Labour
•Cost
•Ease- technical
•Productivity
•Soil health
•Water use
efficiency
•Knowledge
Prioritization -
criteria
Focus group and individual
interviews, walkabouts
Attendance
registers,
Focus group
discussions, individual
prioritization
Link to practices
flow chart
1 page descriptions-PP
DSS outline
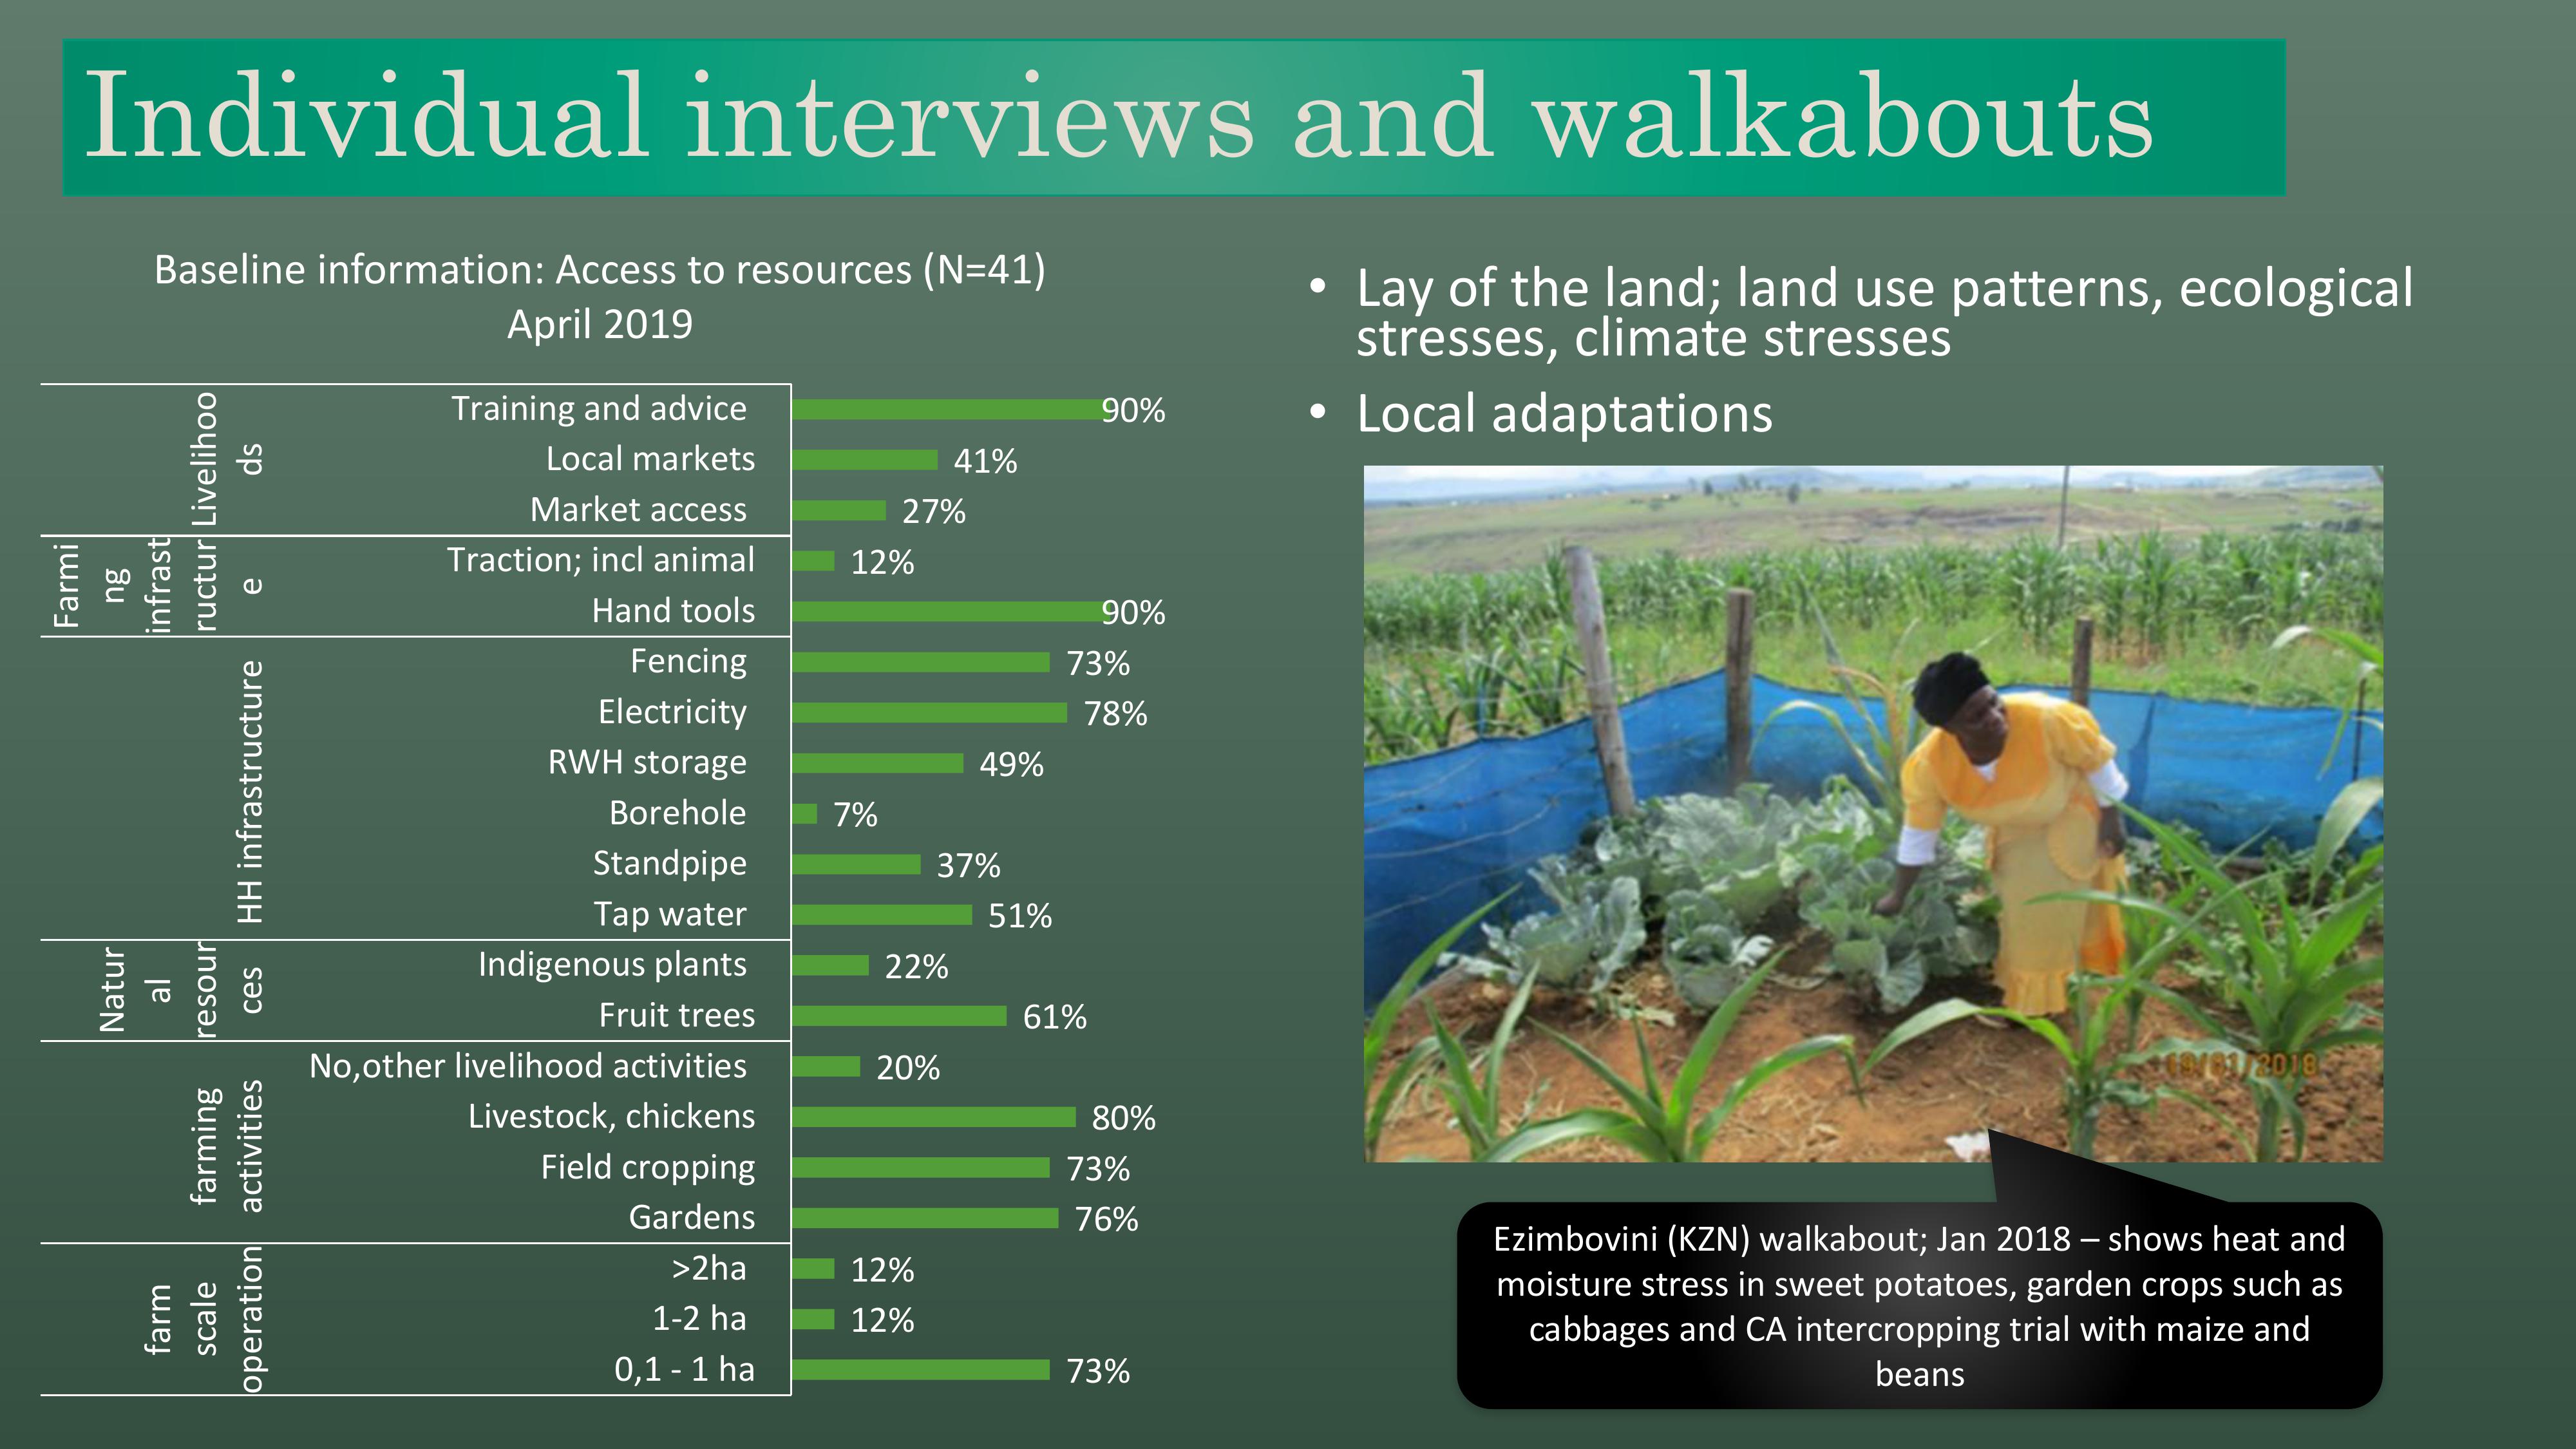
•Lay of the land; land use patterns, ecological
stresses, climate stresses
•Local adaptations
Individual interviews and walkabouts
73%
12%
12%
76%
73%
80%
20%
61%
22%
51%
37%
7%
49%
78%
73%
90%
12%
27%
41%
90%
0,1 - 1 ha
1-2 ha
>2ha
Gardens
Field cropping
Livestock, chickens
No,other livelihood activities
Fruit trees
Indigenous plants
Tap water
Standpipe
Borehole
RWH storage
Electricity
Fencing
Hand tools
Traction; incl animal
Market access
Local markets
Training and advice
farm
scale
operation
farming
activities
Natur
al
resour
ces HH infrastructure
Farmi
ng
infrast
ructur
e
Livelihoo
ds
Baseline information: Access to resources (N=41)
April 2019
Ezimbovini (KZN) walkabout; Jan 2018 –shows heat and
moisture stress in sweet potatoes, garden crops such as
cabbages and CA intercropping trial with maize and
beans
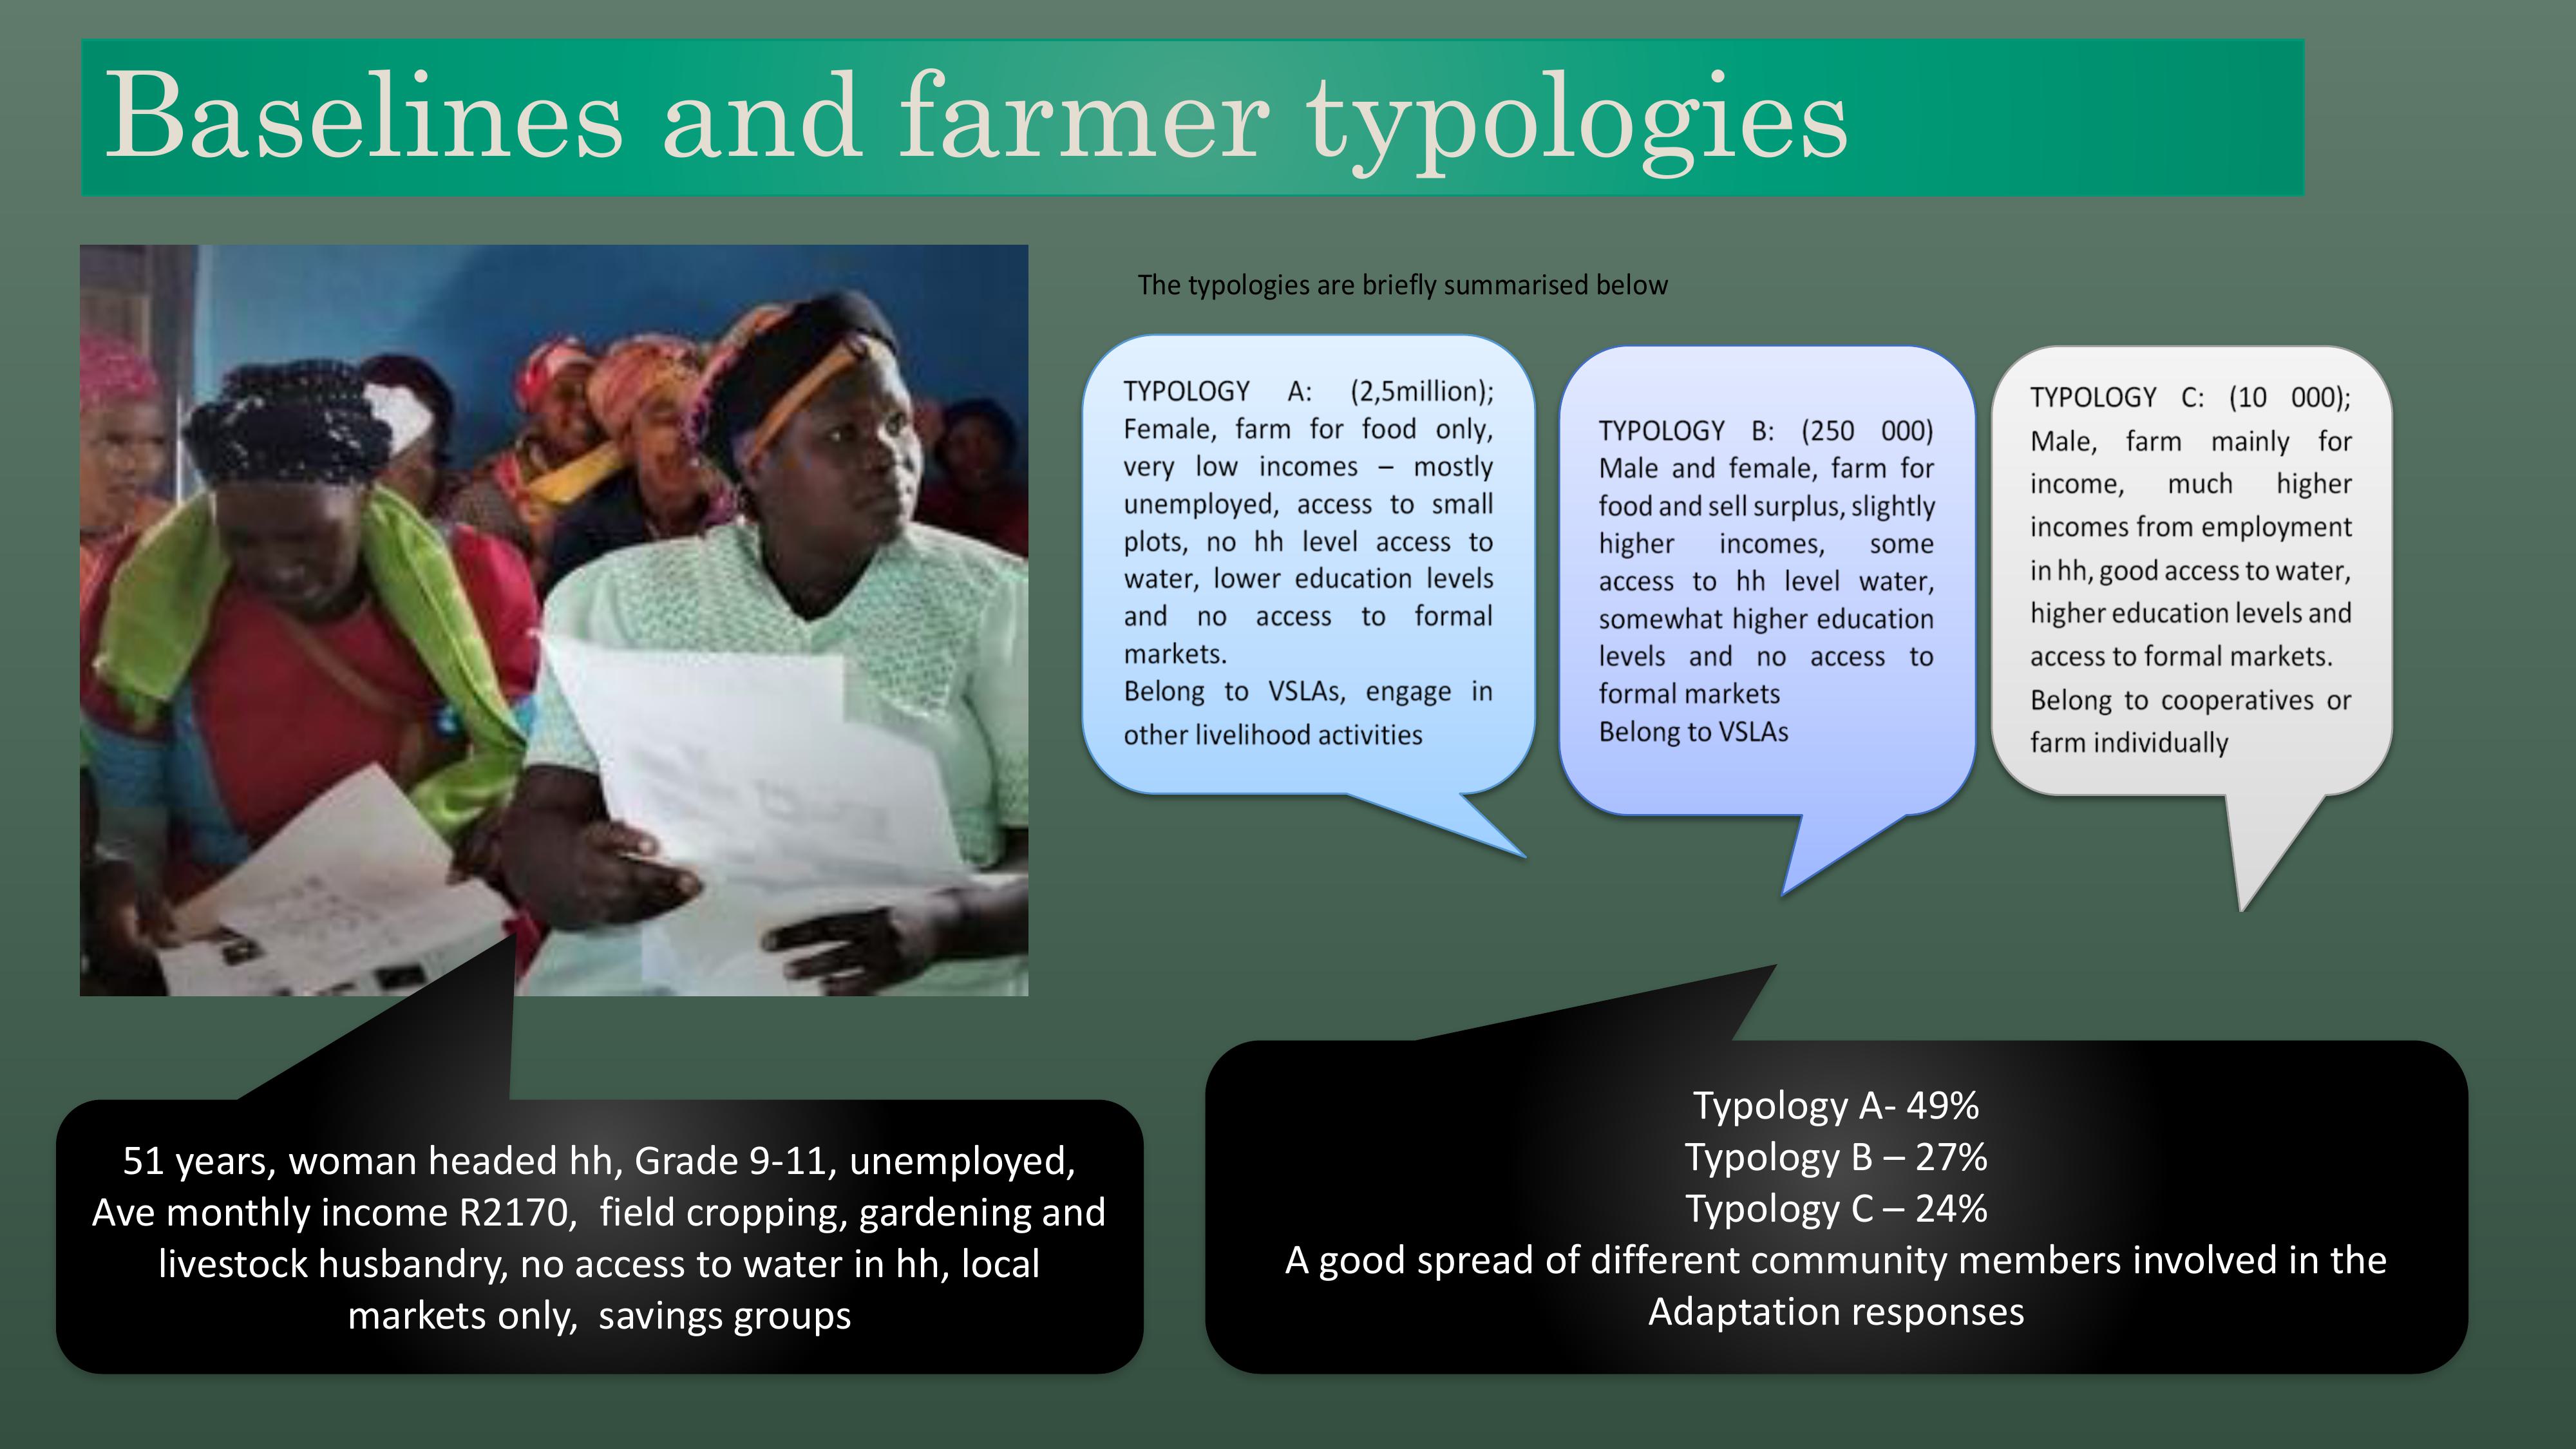
The typologies are briefly summarised below
The table below indicates the typology for each of the participants interviewed for the baseline
assessment
51 years, woman headed hh, Grade 9-11, unemployed,
Ave monthly income R2170, field cropping, gardening and
livestock husbandry, no access to water in hh, local
markets only, savings groups
Typology A- 49%
Typology B –27%
Typology C –24%
A good spread of different community members involved in the
Adaptation responses
Baselines and farmer typologies
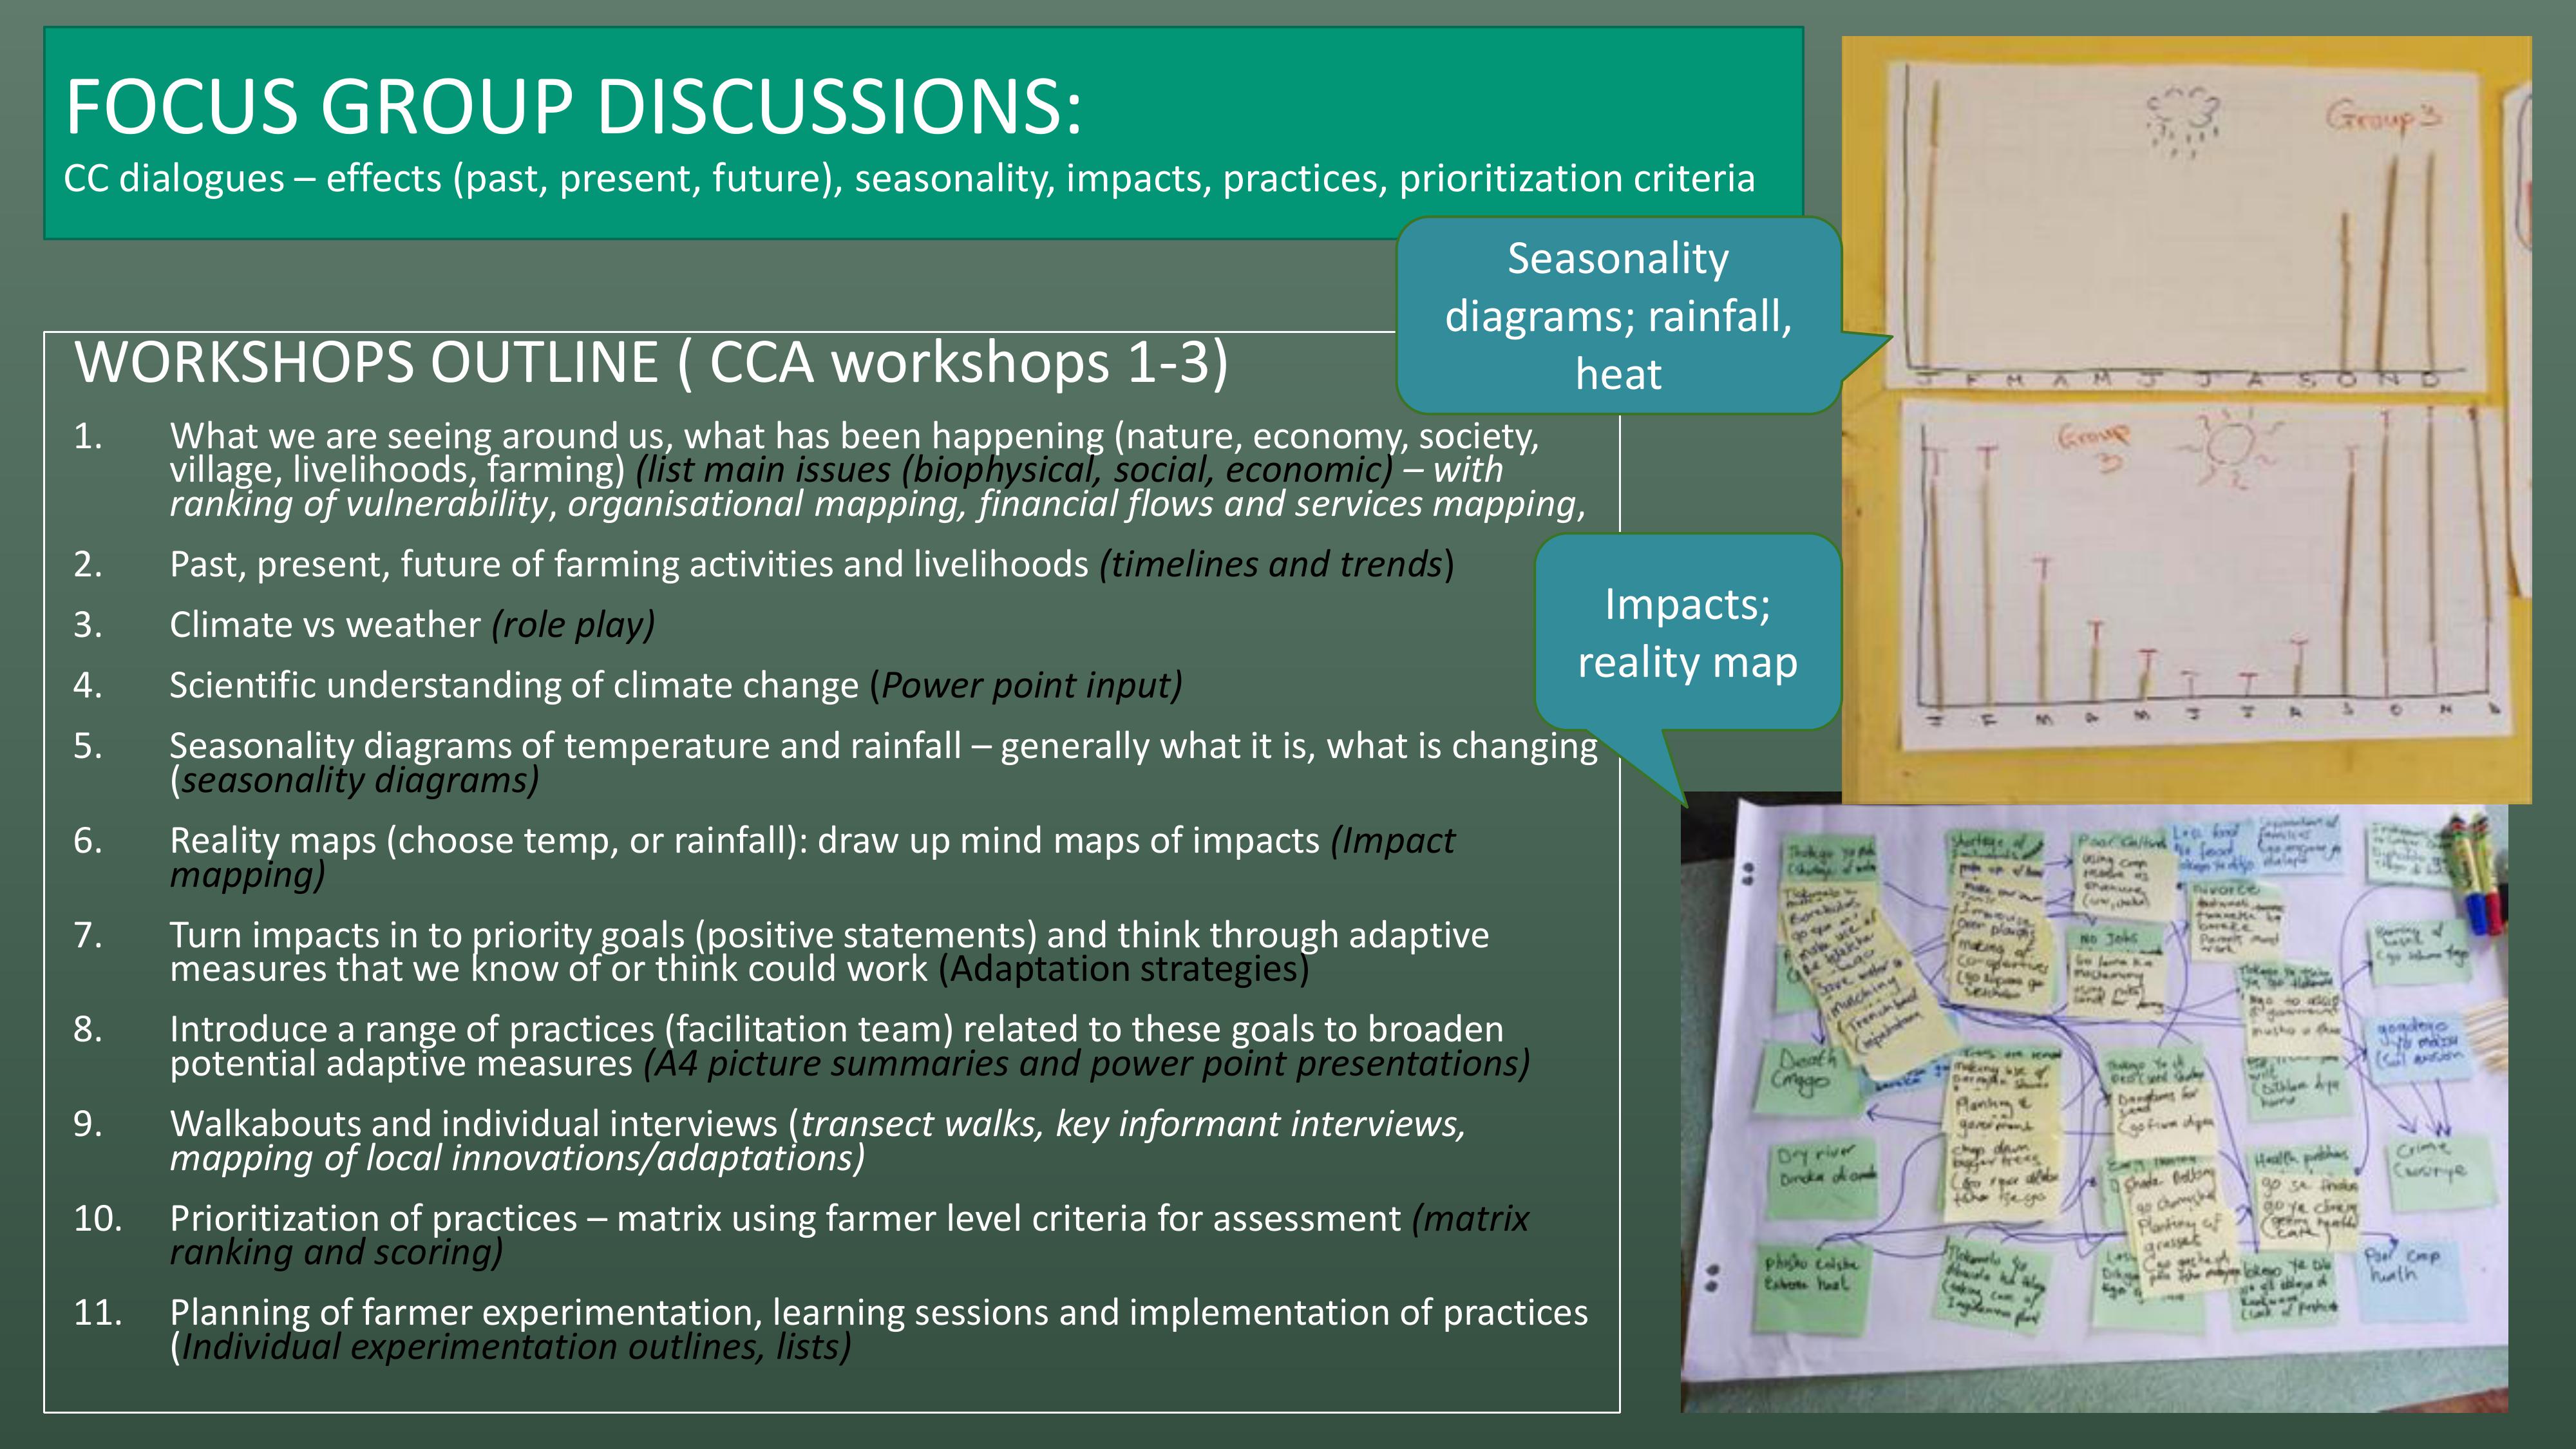
FOCUS GROUP DISCUSSIONS:
CC dialogues –effects (past, present, future), seasonality, impacts, practices, prioritization criteria
WORKSHOPS OUTLINE ( CCA workshops 1-3)
1. What we are seeing around us, what has been happening (nature,economy, society,
village, livelihoods, farming) (list main issues (biophysical, social, economic) –with
ranking of vulnerability, organisational mapping, financial flows and services mapping,
2. Past, present, future of farming activities and livelihoods (timelines and trends)
3. Climate vs weather (role play)
4. Scientific understanding of climate change (Power point input)
5. Seasonality diagrams of temperature and rainfall –generally what it is, what is changing
(seasonality diagrams)
6. Reality maps (choose temp, or rainfall): draw up mind maps of impacts (Impact
mapping)
7. Turn impacts in to priority goals (positive statements) and think through adaptive
measures that we know of or think could work (Adaptation strategies)
8. Introduce a range of practices (facilitation team) related to these goals to broaden
potential adaptive measures (A4 picture summaries and power point presentations)
9. Walkabouts and individual interviews (transect walks, key informant interviews,
mapping of local innovations/adaptations)
10. Prioritization of practices –matrix using farmer level criteria for assessment (matrix
ranking and scoring)
11. Planning of farmer experimentation, learning sessions and implementation of practices
(Individual experimentation outlines, lists)
Seasonality
diagrams; rainfall,
heat
Impacts;
reality map
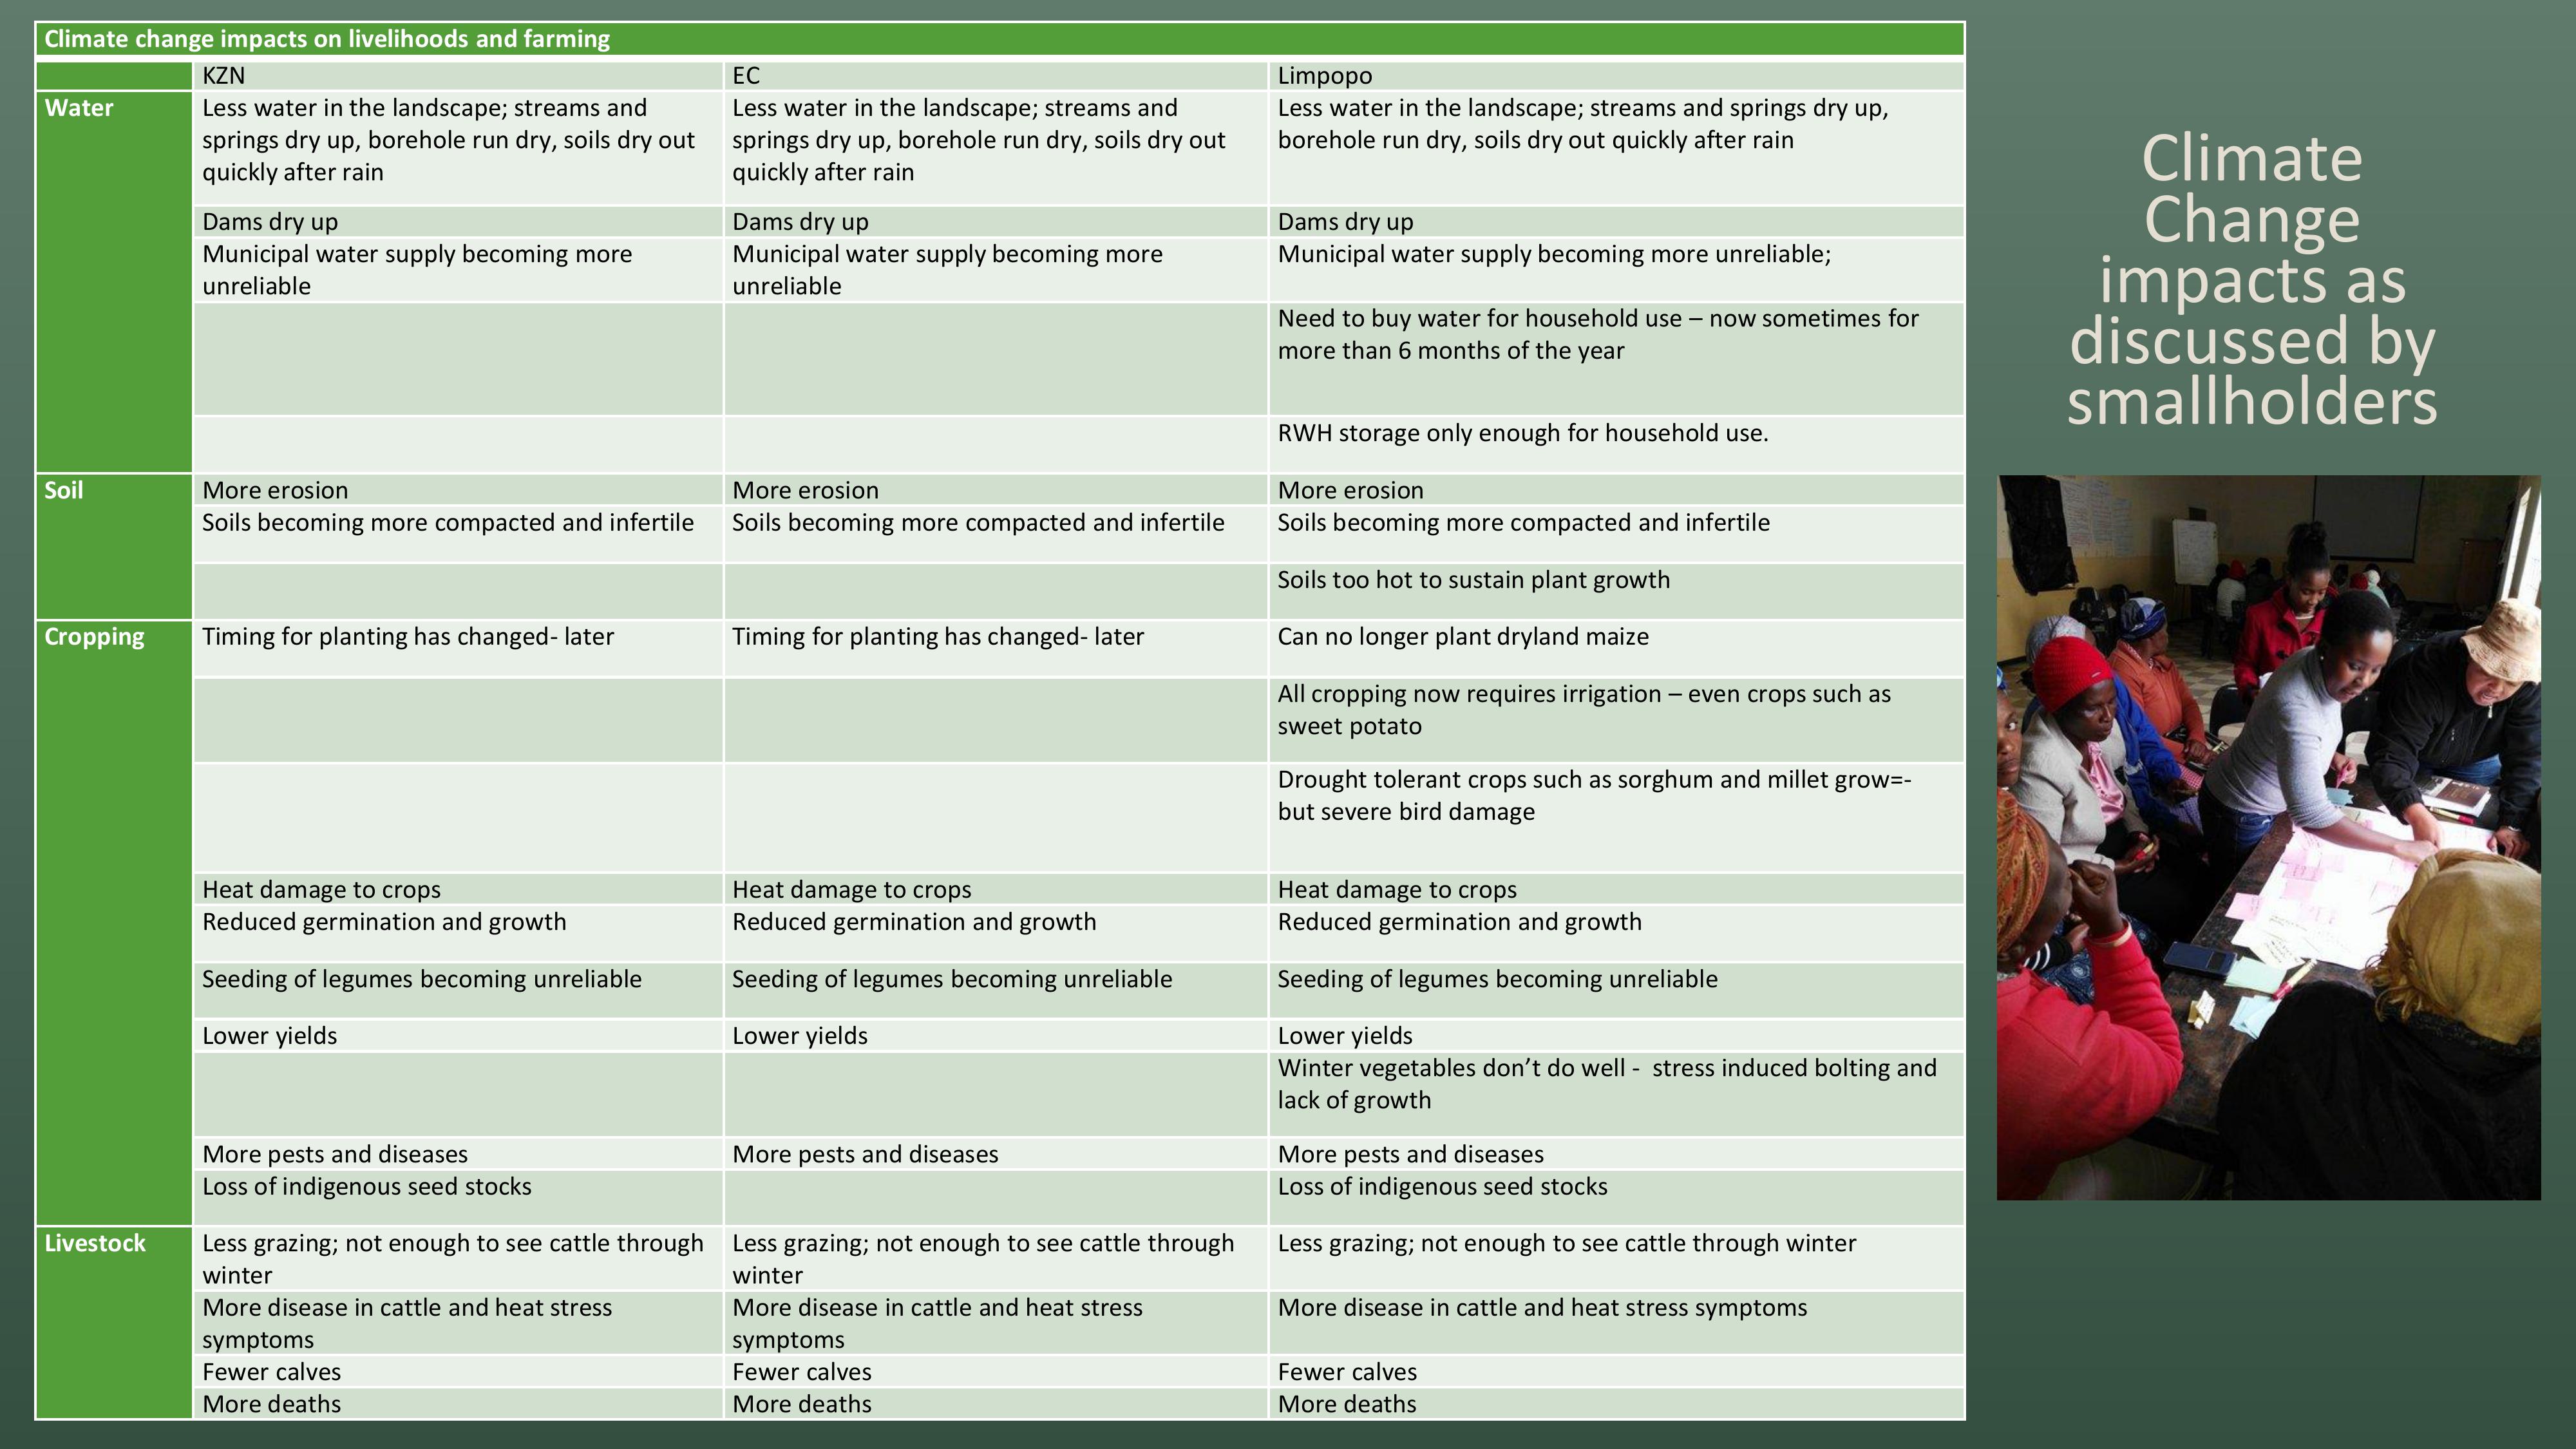
Climate Change
impacts as discussed
by smallholders
Climate change impacts on livelihoods and farming
KZN
EC
Limpopo
Water
Less water in the landscape; streams and
springs dry up, borehole run dry, soils dry out
quickly after rain
Less water in the landscape; streams and
springs dry up, borehole run dry, soils dry out
quickly after rain
Less water in the landscape; streams and springs dry up,
borehole run dry, soils dry out quickly after rain
Dams dry up
Dams dry up
Dams dry up
Municipal water supply becoming more
unreliable
Municipal water supply becoming more
unreliable
Municipal water supply becoming more unreliable;
Need to buy water for household use
–now sometimesfor
more than 6 months of the year
RWH storage only enough for household use.
Soil
More erosion
More erosion
More erosion
Soils becoming more compacted and infertile
Soils becoming more compacted and infertile
Soils becoming more compacted and infertile
Soils too hot to sustain plant growth
Cropping
Timing for planting has changed
- later
Timing for planting has changed
- later
Can no longer plant dryland maize
All cropping now requires irrigation
–even crops such as
sweet potato
Drought tolerant crops such as sorghum and millet grow=
-
but severe bird damage
Heat damage to crops
Heat damage to crops
Heat damage to crops
Reduced germination and growth
Reduced germination and growth
Reduced germination and growth
Seeding of legumes becoming unreliable
Seeding of legumes becoming unreliable
Seeding of legumes becoming unreliable
Lower yields
Lower yields
Lower yields
Winter vegetables don’t do well
-stress induced bolting and
lack of growth
More pests and diseases
More pests and diseases
More pests and diseases
Loss of indigenous seed stocks
Loss of indigenous seed stocks
Livestock
Less grazing; not enough to see cattle through
winter
Less grazing; not enough to see cattle through
winter
Less grazing; not enough to see cattle through winter
More disease in cattle and heat stress
symptoms
More disease in cattle and heat stress
symptoms
More disease in cattle and heat stress symptoms
Fewer calves
Fewer calves
Fewer calves
More deaths
More deaths
More deaths
Climate
Change
impacts as
discussed by
smallholders

Climate Change
impacts as discussed
by smallholders –
continued.
Natural resources
Fewer trees; too much cutting for
firewood
Fewer trees; too much cutting for firewood
Fewer trees; too much cutting for firewood
Decrease in wild animals and indigenous
plants
Decrease in wild animals and indigenous
plants
Decrease in wild animals and indigenous plants
Increased crop damage from wild animals
such as birds and monkeys
Increased crop damage from wild animals
such as birds and monkeys
Increased crop damage from wild animals such as
birds and monkeys
Availability of indigenous vegetables has
decreased
No longer able to harvest anyresources due to
scarcity
Increased population puts pressure on resources
Social
More diseases
More diseases
More diseases
Increased poverty and hunger
Increased poverty and hunger
Increased poverty and hunger
Increased crime andreduced job
opportunities
Increased crime andreduced job
opportunities
Increased crime andreduced jobopportunities
Increased food prices
Increased conflict
Inability to survive
It feels as if the end
of the world is
coming
We are being punished
by God for not living
correctly
Climate change is a reality and
we will need to find different
ways to do thing to survive
Climate
Change impacts
as discussed by
smallholders –
continued.

In all villages farmers had some ideas, or many, of potential practices for CCA
Area
Village
Natl resources/
landscape
Water (manage
and increase
available water)
Soil health and
fertility (
incl
Manage soil
movement)
Crops
Livestock
Other
Bergville
Thamela
RWH
Mulching
Savings groups
No previous exposure to
improved practices
Manure and
fertilizer
bulk buying
Bergville
Ezibomvini
Spring protection
Compost
Natural P&D
control
Plant fodder
CA learning groups; 3
-
4yrs
(MDF)
RWH storage
tanks; Jo
-Jo tanks
Furrows
Conservation
Agriculture
Fodder
supplementation
Infield rainwater
harvesting
Contours
Mulching
Drip kits
Diversion ditches
Tunnels
Greywater; tower
gardens
Stone bunds
Infiltration pits/
banana circles
Small dams
Suggestions
for Natural
resource
management
lag behind for
most groups
POTENTIAL ADAPTIVE MEASURES:
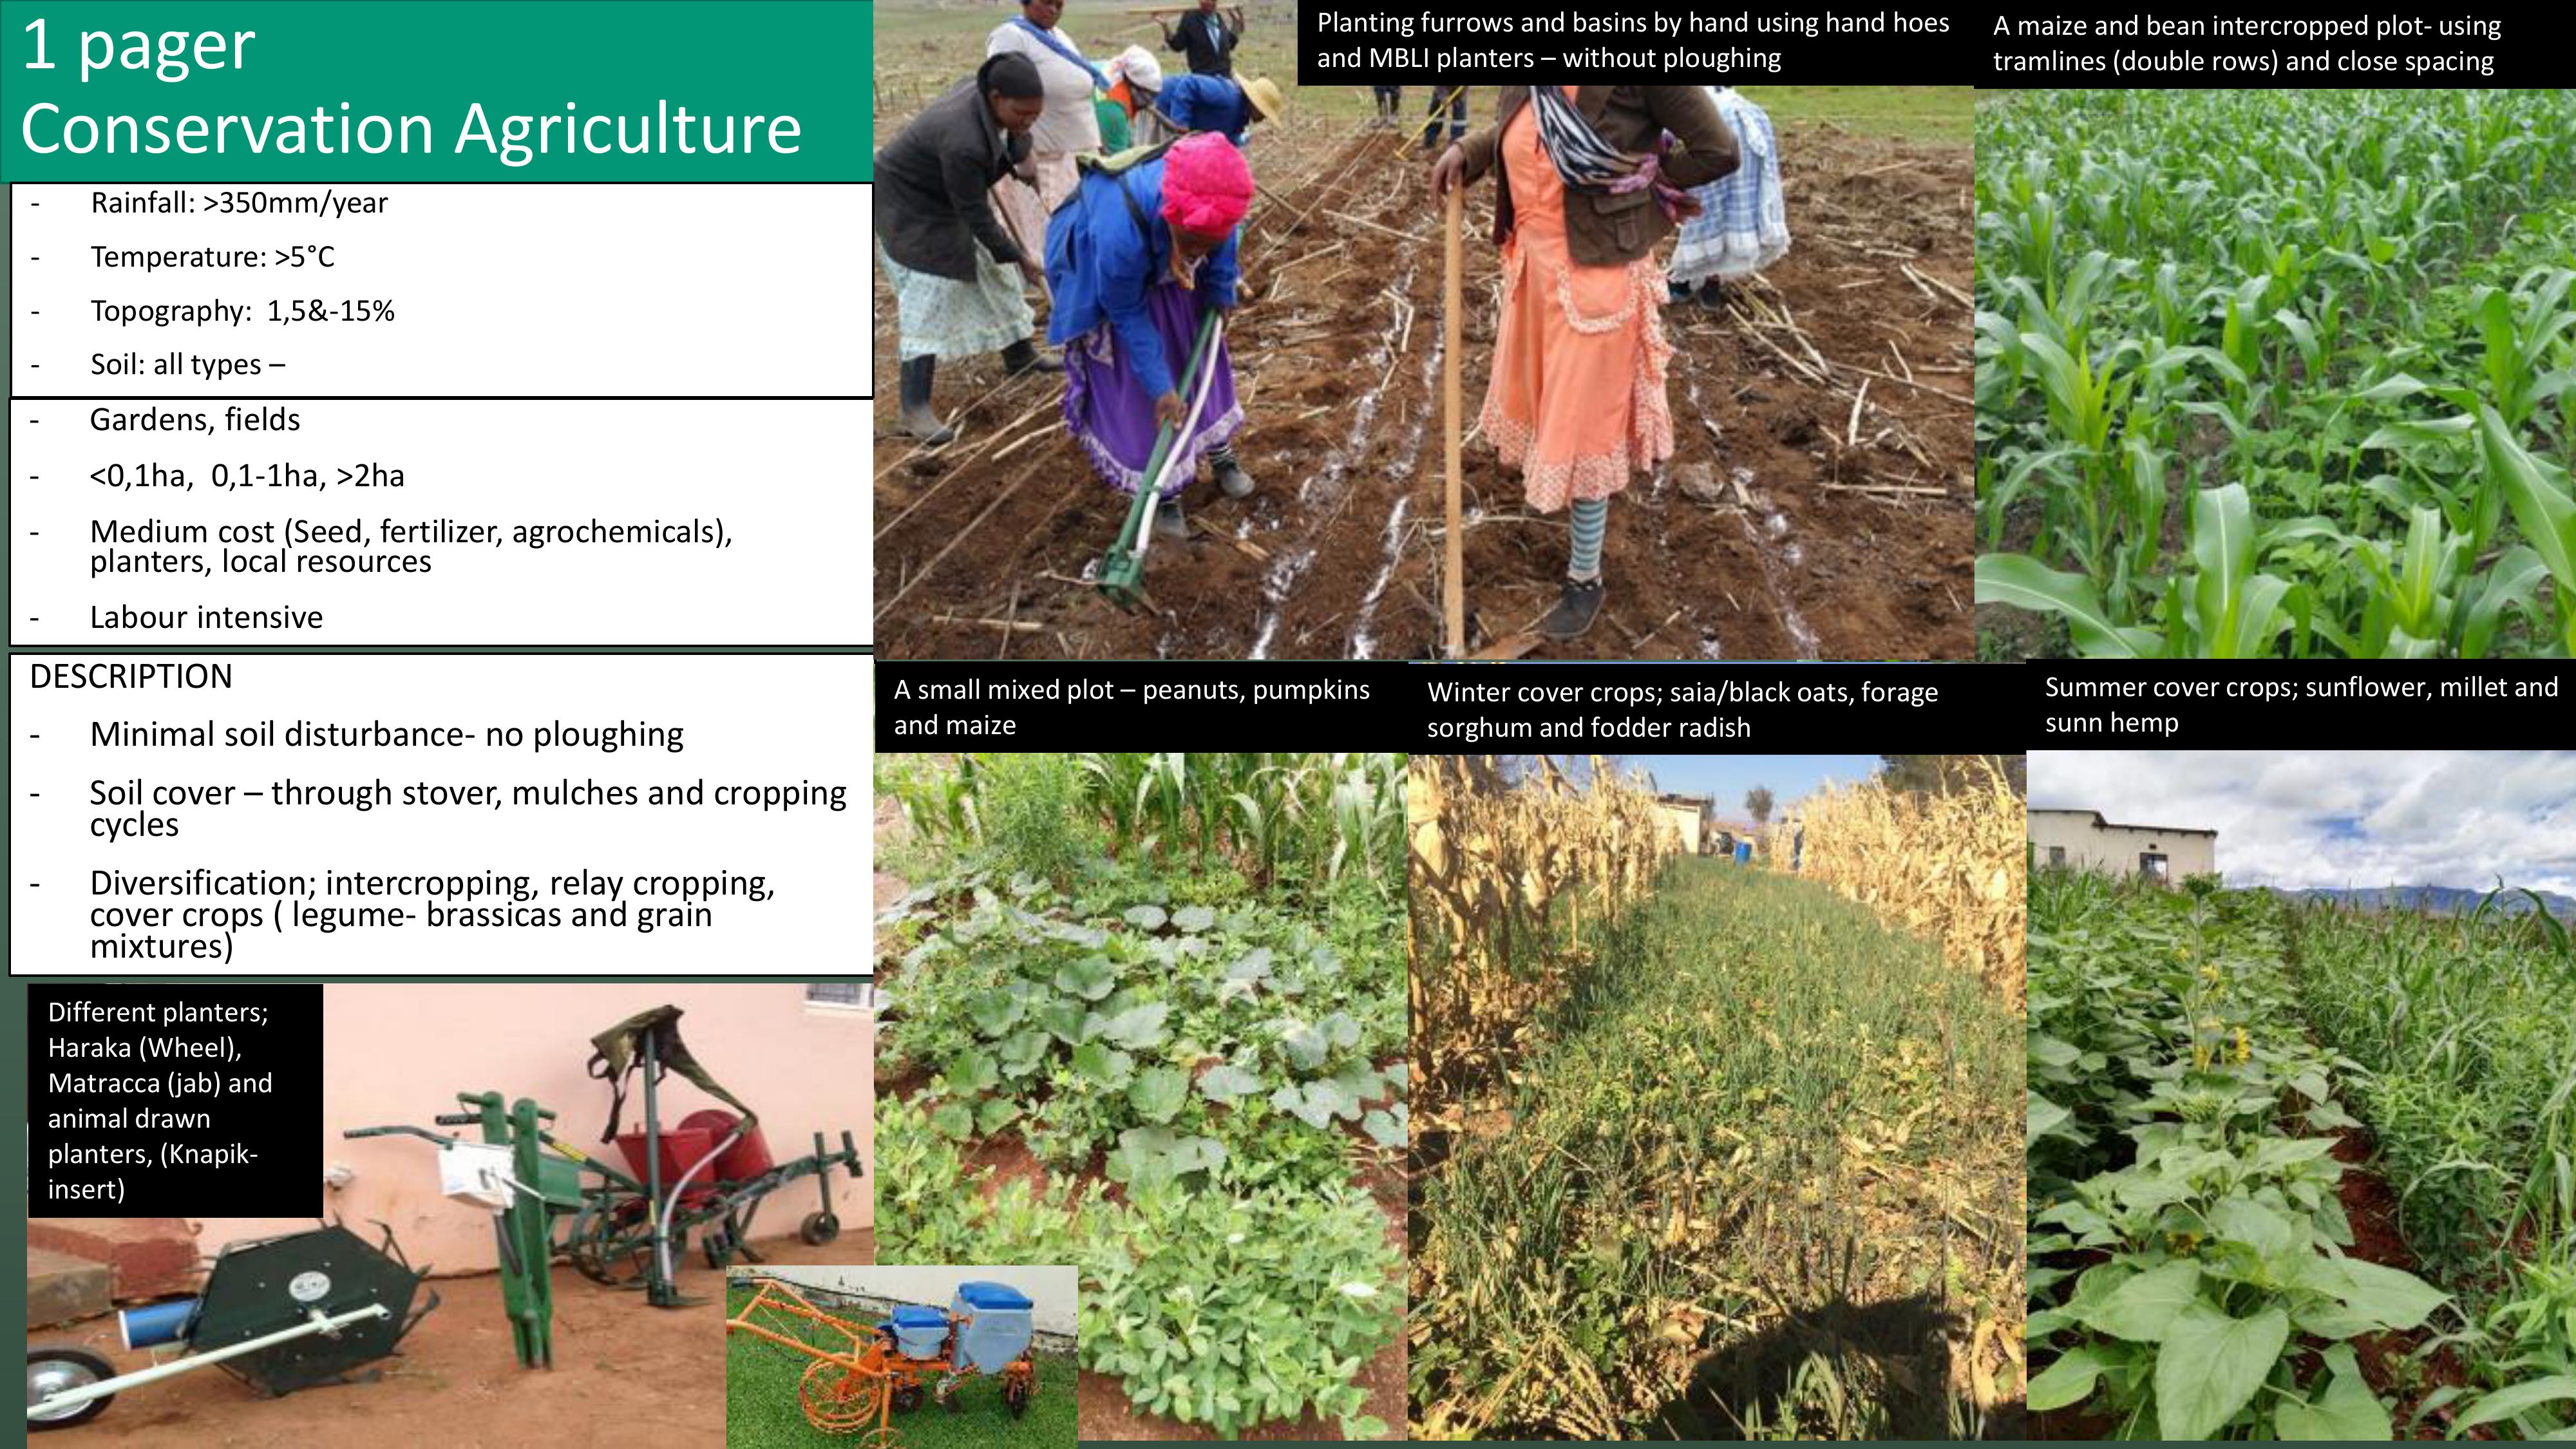
1 pager
Conservation Agriculture
-Gardens, fields
-<0,1ha, 0,1-1ha, >2ha
-Medium cost (Seed, fertilizer, agrochemicals),
planters, local resources
-Labour intensive
DESCRIPTION
-Minimal soil disturbance- no ploughing
-Soil cover –through stover, mulches and cropping
cycles
-Diversification; intercropping, relay cropping,
cover crops ( legume- brassicas and grain
mixtures)
-Rainfall: >350mm/year
-Temperature: >5°C
-Topography: 1,5&-15%
-Soil: all types –
Different planters;
Haraka (Wheel),
Matracca(jab) and
animal drawn
planters, (Knapik-
insert)
A small mixed plot –peanuts, pumpkins
and maizeWinter cover crops; saia/black oats, forage
sorghum and fodder radish
Summer cover crops; sunflower, millet and
sunn hemp
A maize and bean intercropped plot-using
tramlines (double rows) and close spacing
Planting furrows and basins by hand using hand hoes
and MBLI planters –without ploughing

Oaks, Lepelle, Finale –Limpopo –Criteria used to assess impact of implementation of different
practices
Oaks, Finale, Lepelle: Impact of CSA practices
SCALE: 1=low; 2 = medium, 3= high (agreement between participants)
CRITERIA
PRACTICES
Easy
to do
More
food
Better
growth
Good
water
man
Better
soil
fertility
Score
Rank
COMMENTS
Trench
beds
1
3
3
3
3
13
5
Very good for growth, soil health
and water management. The best
practice
- but difficult to dig
Mulching
3
3
3
3
3
15
2
Less irrigation providing more
food
Furrows
2
2
3
3
3
13
4
more moisture,better growth,
carries some fertility in the water
Rock
bunds
2
3
3
3
3
14
3
deep irrigation, catches more
fertile soil
Adding
organic
matter to
the soil
3
3
3
3
3
15
1
easier than trench beds
Crop
varieties
1
1
1
1
1
5
7
we do not have the knowledge
-
but will be easy once we know
Planting
times
2
1
1
1
1
6
6
would be nice to have a calendar
to remember.
PRIORITIZATION OF PRACTICES:

Province
Site/Area
;
villages
Demonstration
sites
CoPs
Collaborative
strategies
KZN
Ntabamhlophe
-
CCA workshop 1,2,3,4,5
-
Monitoring and PIA
-Farmers w NGO support (Lima
RDF)
-
Tunnels and drip kits
-
Individual experimentationwith basket of options
Ezibomvini/
,
Eqeleni
-
CCA workshop 1,2,3,4,5
-
Water issues workshops 1,2
-Water issues follow
-up
-Water issues continuation
-Monitoring, PIA
-
Fodder and supplementation learning process
-CA open days, cross visits
(LandCare
, KZNDARD, ARC,
GrainSA), LM Agric forums, No Till
Club,
StratAct ….
-
Tunnels (Quantitative measurements
-
CA farmer experimentation(Quantitative measurements) –case studies
-Individual experimentationwith basket of options; monitoring review and
re
-planning
-
Livestock integration learning group and experimentation focus
Swayimane
-
CCA workshop 1,2,3,4
-
Monitoring, review and re-planning
-CA open days
-Umgungundlovu DM agriculture
forum
-
CA farmer experimentation
-
gardening level experimentation; tunnel, trench beds drip kits etc.
Madzikane
-CCA workshop 1,2,3
-CA open days
-
Madzikane stakeholder forum
-CA farmer experimentation
-
gardening level experimentation; tunnel, trench beds drip kits etc
Limpopo
Mametja (Sedawa,
Turkey)
-
CCA workshop 1,2,3,4,5
-Water issues workshops 1
-2
-Water issues follow
-up
-
Poultry production learning and mentoring
-
CA learning and mentoring
-
Monitoring, review and re-planning
-Agroecology network
(AWARD/MDF, 15 organisations)
-Maruleng
DM
-Review of CSA implementation and re
-planning for next season
Tunnels (Quantitative measurements
-
CA farmer experimentation(Quantitative measurements) –case studies
-
Individual experimentationwith basket of options
-water committee, plan for agric water provision
Lepelle
Water issues workshops 1
-2
-
-water committee, plan for agric water provision
Tzaneen (Sekororo-
Lourene)
-
CCA workshop 1,2
-Monitoring
Farmers learning group
-Tunnels and drip kits
EC
Alice/
Middledrift
area
-
CCA workshop 1,2,3,4,5
-
Monitoring, review and re-planning
Imvotho Bubomi Learning Network
(IBLN)
- ERLC, Fort Cox, Farmers,
Agric Extension services, NGOs
-
Monitoring and review of implementation of CSA practices and
experimentation
-
Training and mentoring _CA, furrow irrigation, ….
-Planning for further implementationand experimentation and quantitative
measurements
Communities of practice
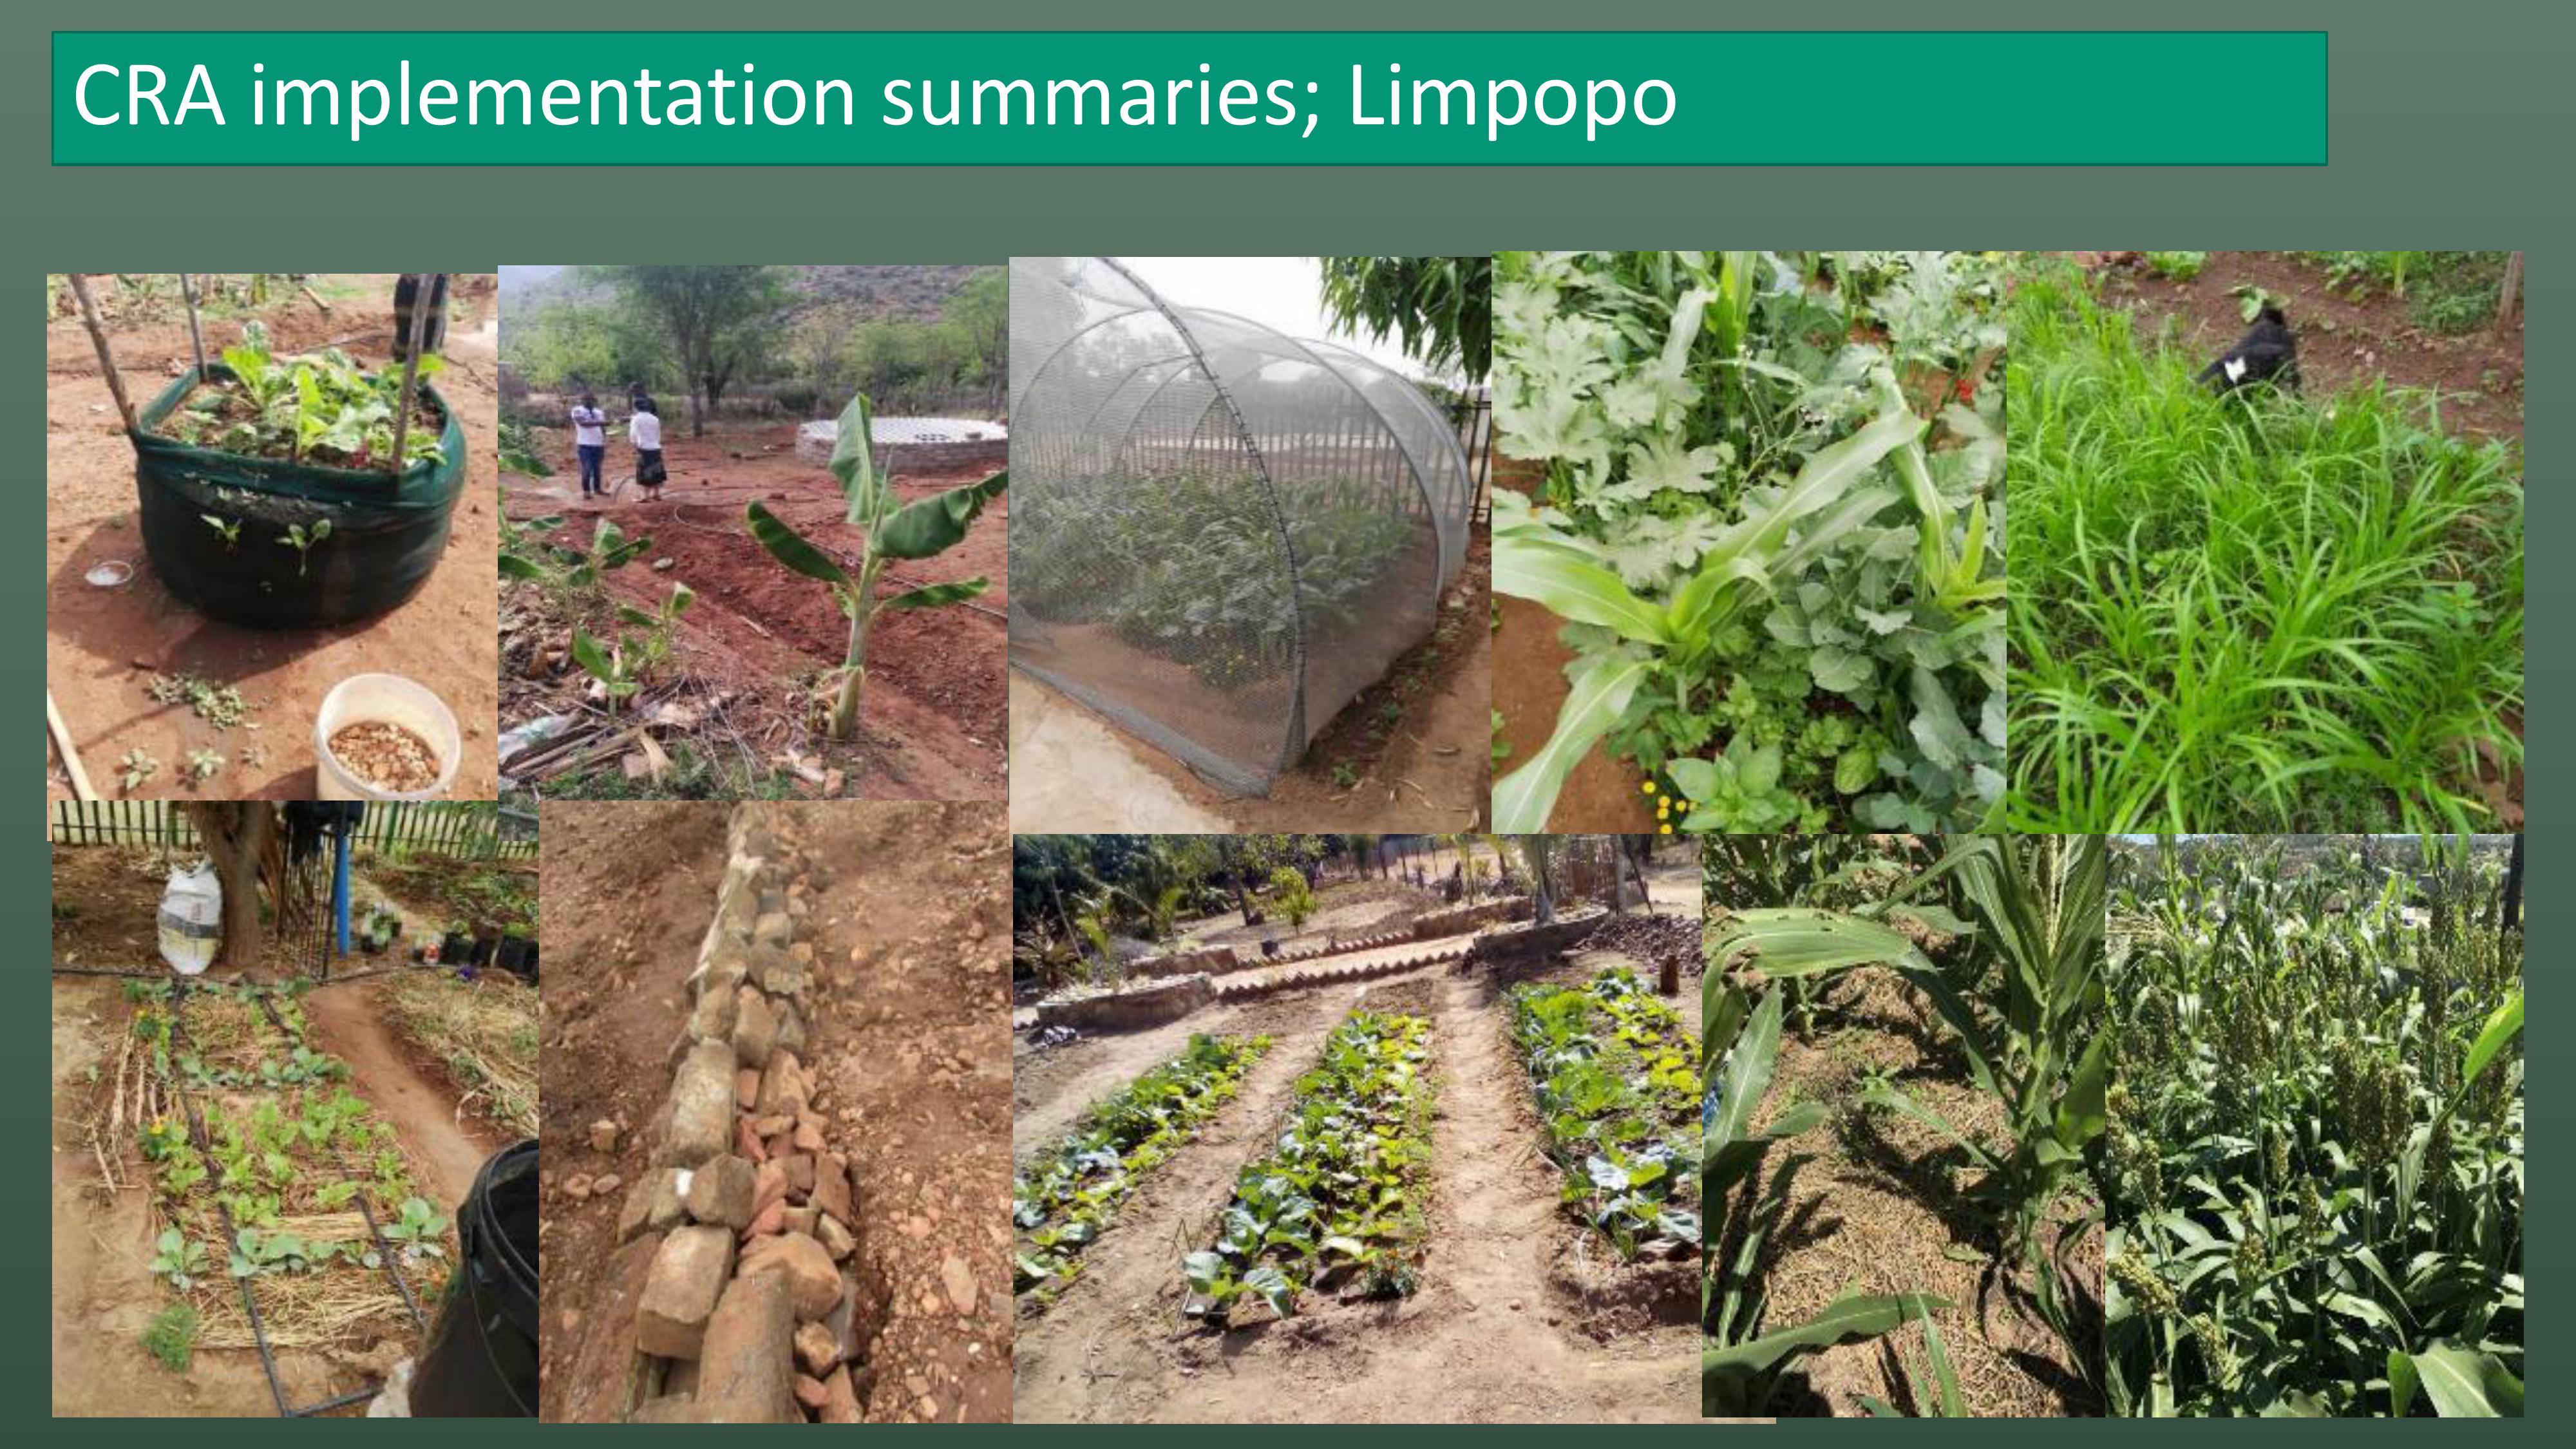
CRA implementation summaries; Limpopo
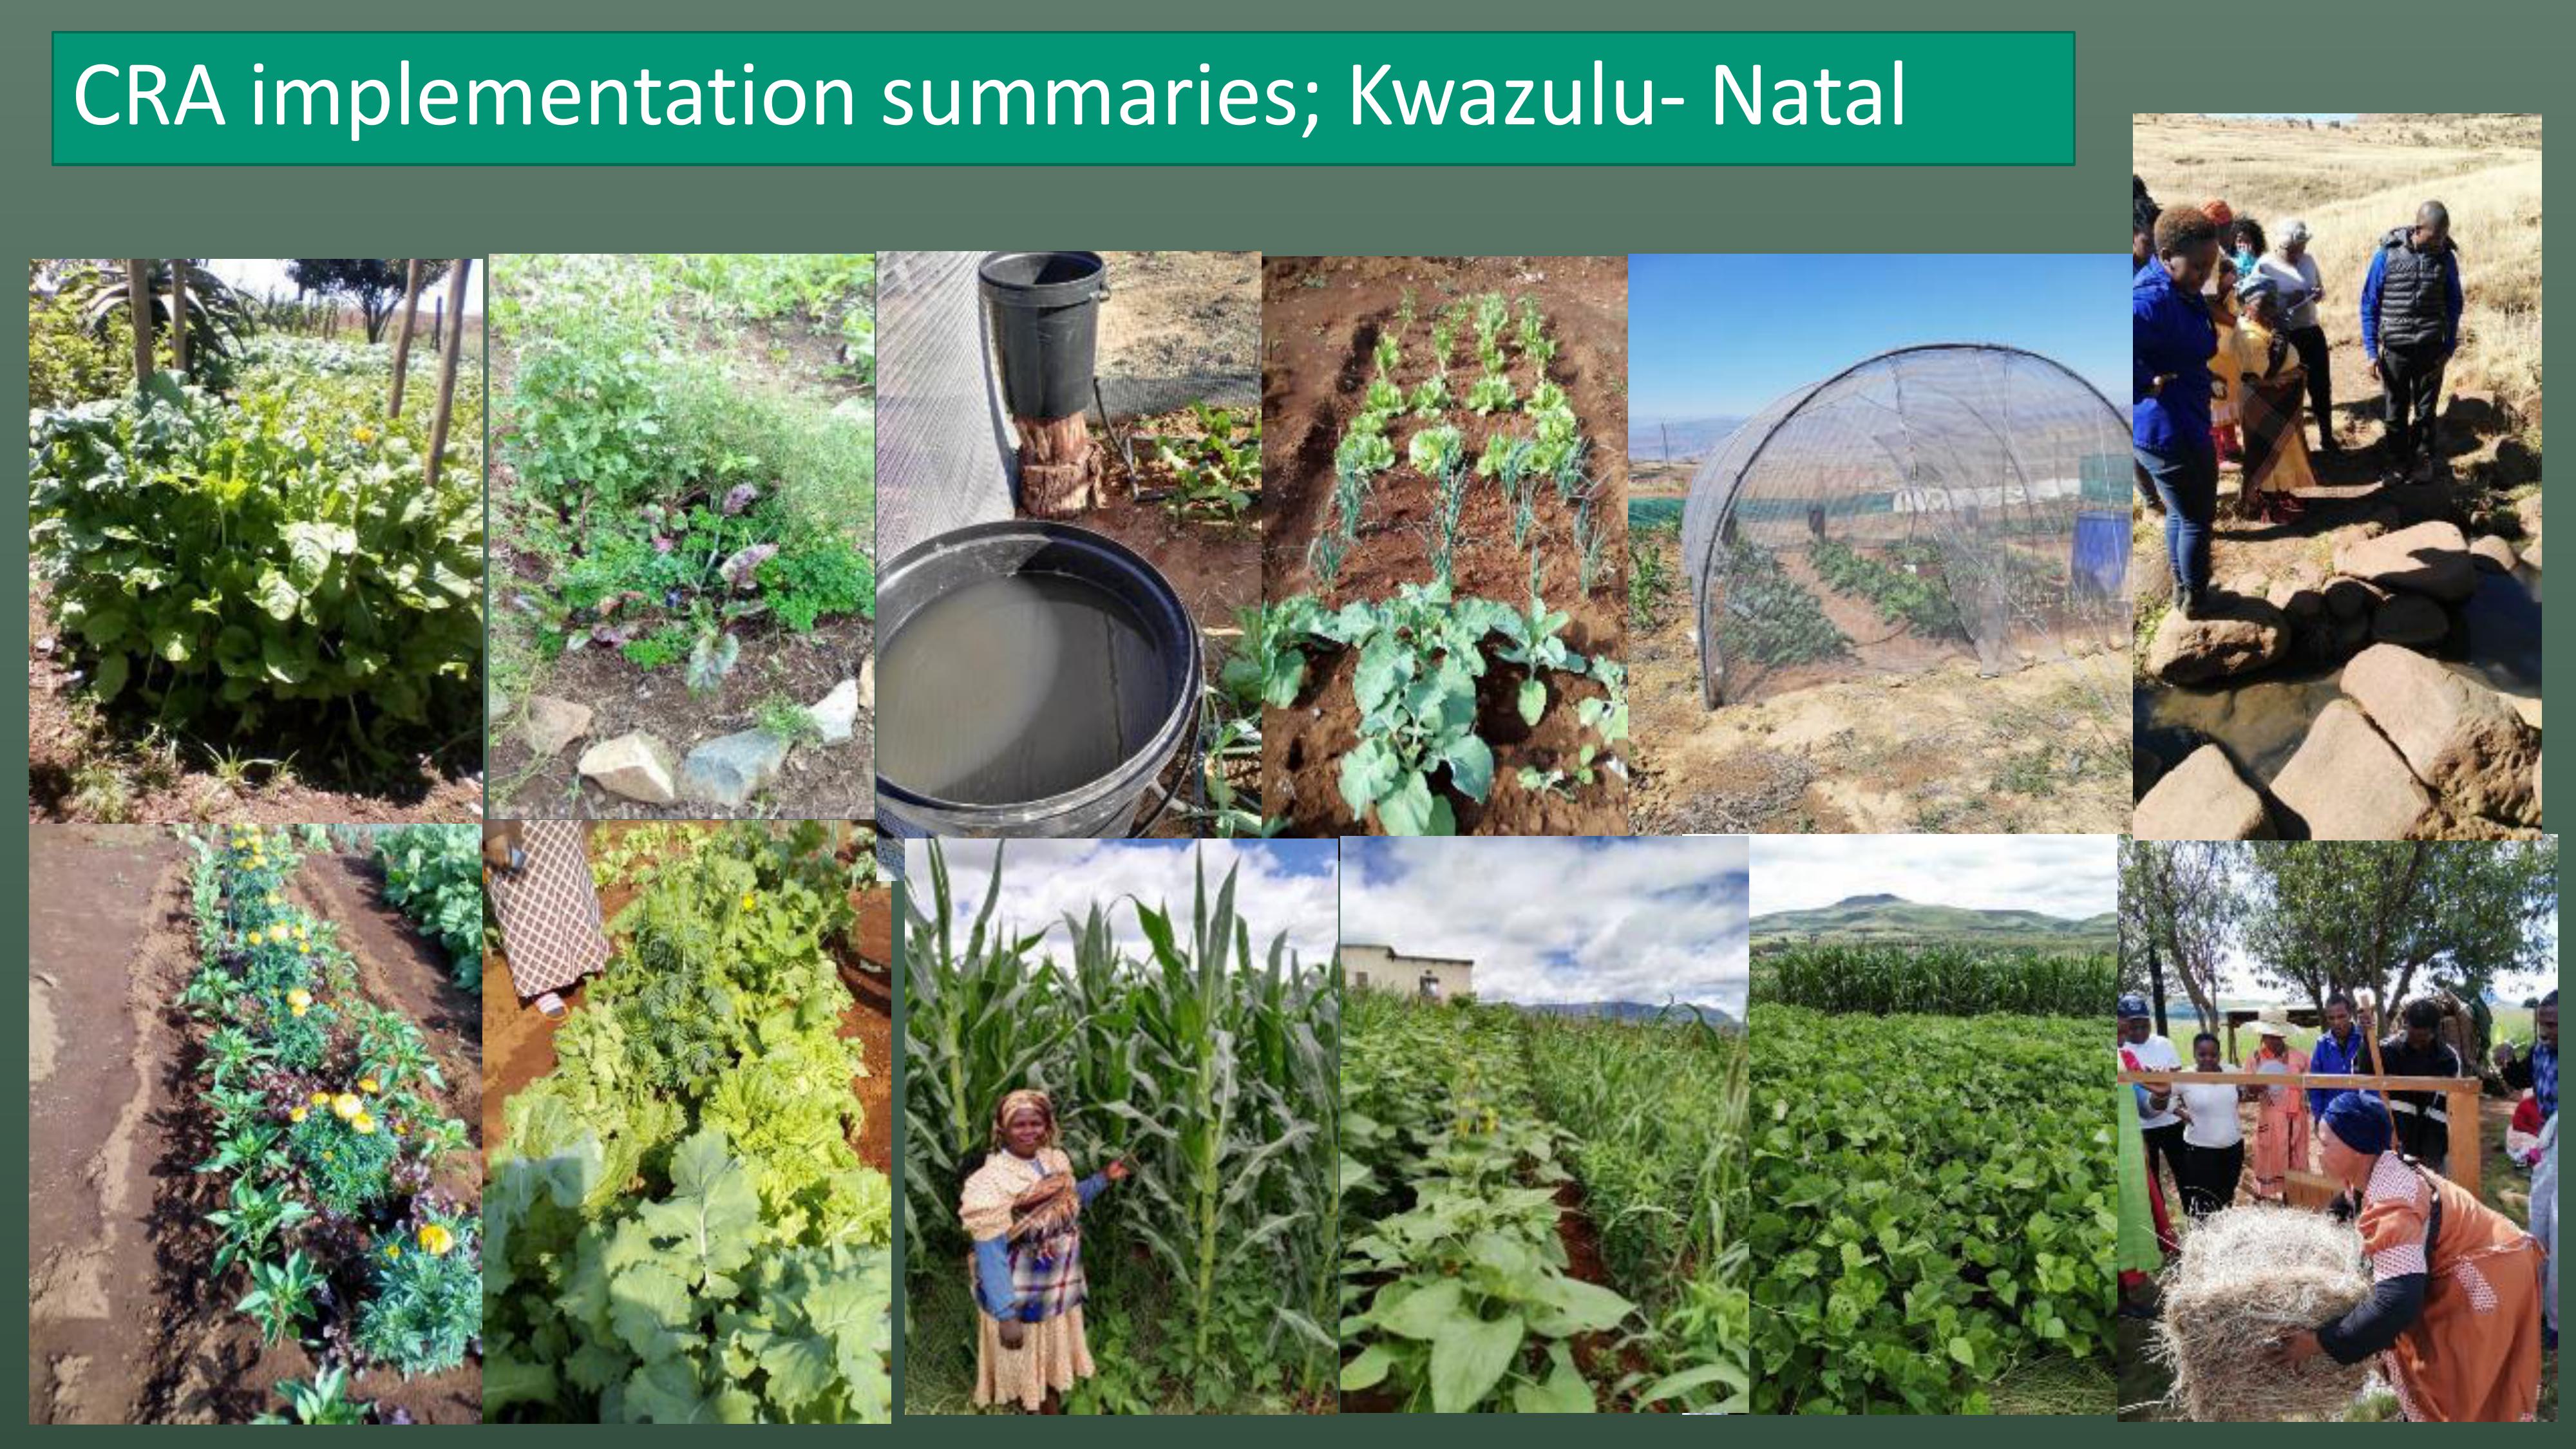
CRA implementation summaries; Kwazulu-Natal
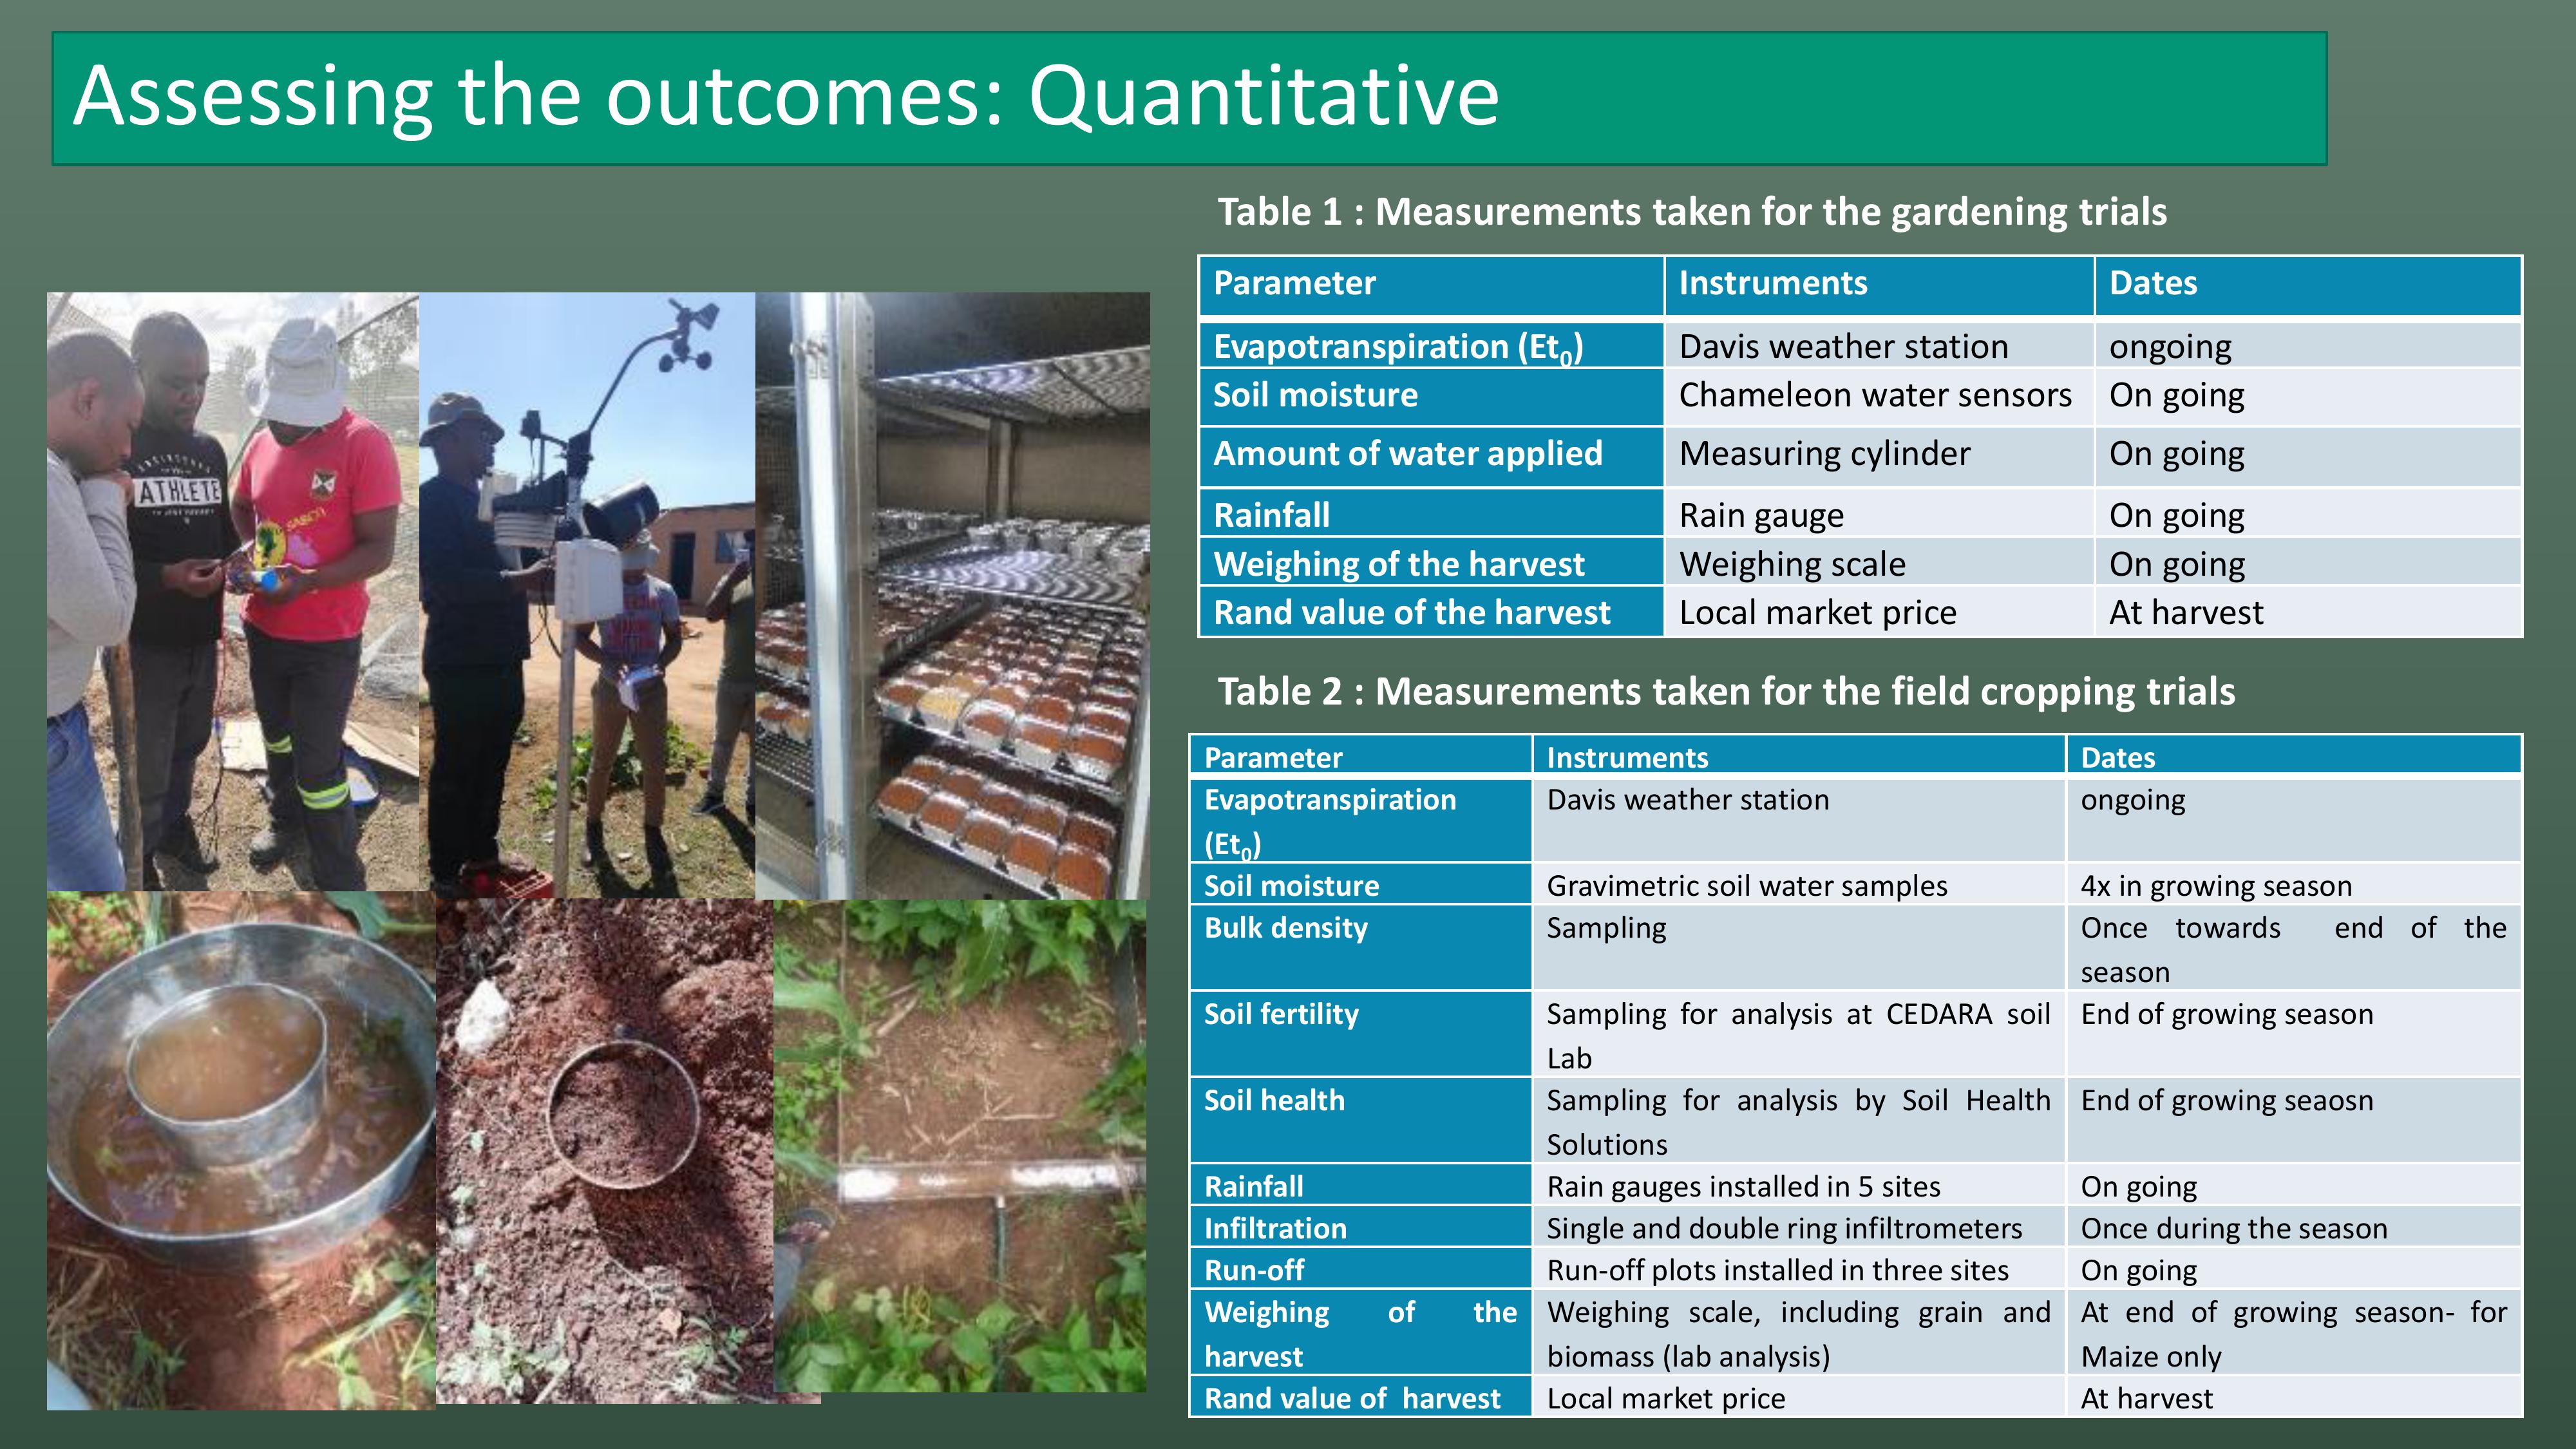
Parameter
Instruments
Dates
Evapotranspiration
(Et0)
Davis
weather station
ongoing
Soil
moisture
Chameleon
water
sensors
On
going
Amount
of water applied
Measuring
cylinder
On
going
Rainfall
Rain
gauge
On
going
Weighing
of the harvest
Weighing
scale
On
going
Rand
value of the harvest
Local
market price
At
harvest
Table 1 : Measurements taken for the gardening trials
Parameter
Instruments
Dates
Evapotranspiration
(Et
0)
Davis
weather station
ongoing
Soil
moisture
Gravimetric
soil water samples
4
x in growing season
Bulk
density
Sampling
Once
towardsend of
the
season
Soil
fertility
Sampling
for analysis at CEDARA
soil
Lab
End
of growing season
Soil
health
Sampling
for analysis by Soil
Health
Solutions
End
of growing seaosn
Rainfall
Rain
gaugesinstalled in5 sites
On
going
Infiltration
Single
and double ring infiltrometers
Once
during the season
Run
-off
Run
-off plotsinstalled inthree sites
On
going
Weighing
of
the
harvest
Weighing
scale, including grain
and
biomass
(lab analysis)
At
end of growing season-
for
Maize
only
Rand
value of harvest
Local
market price
At
harvest
Table 2 : Measurements taken for the field cropping trials
Assessing the outcomes: Quantitative
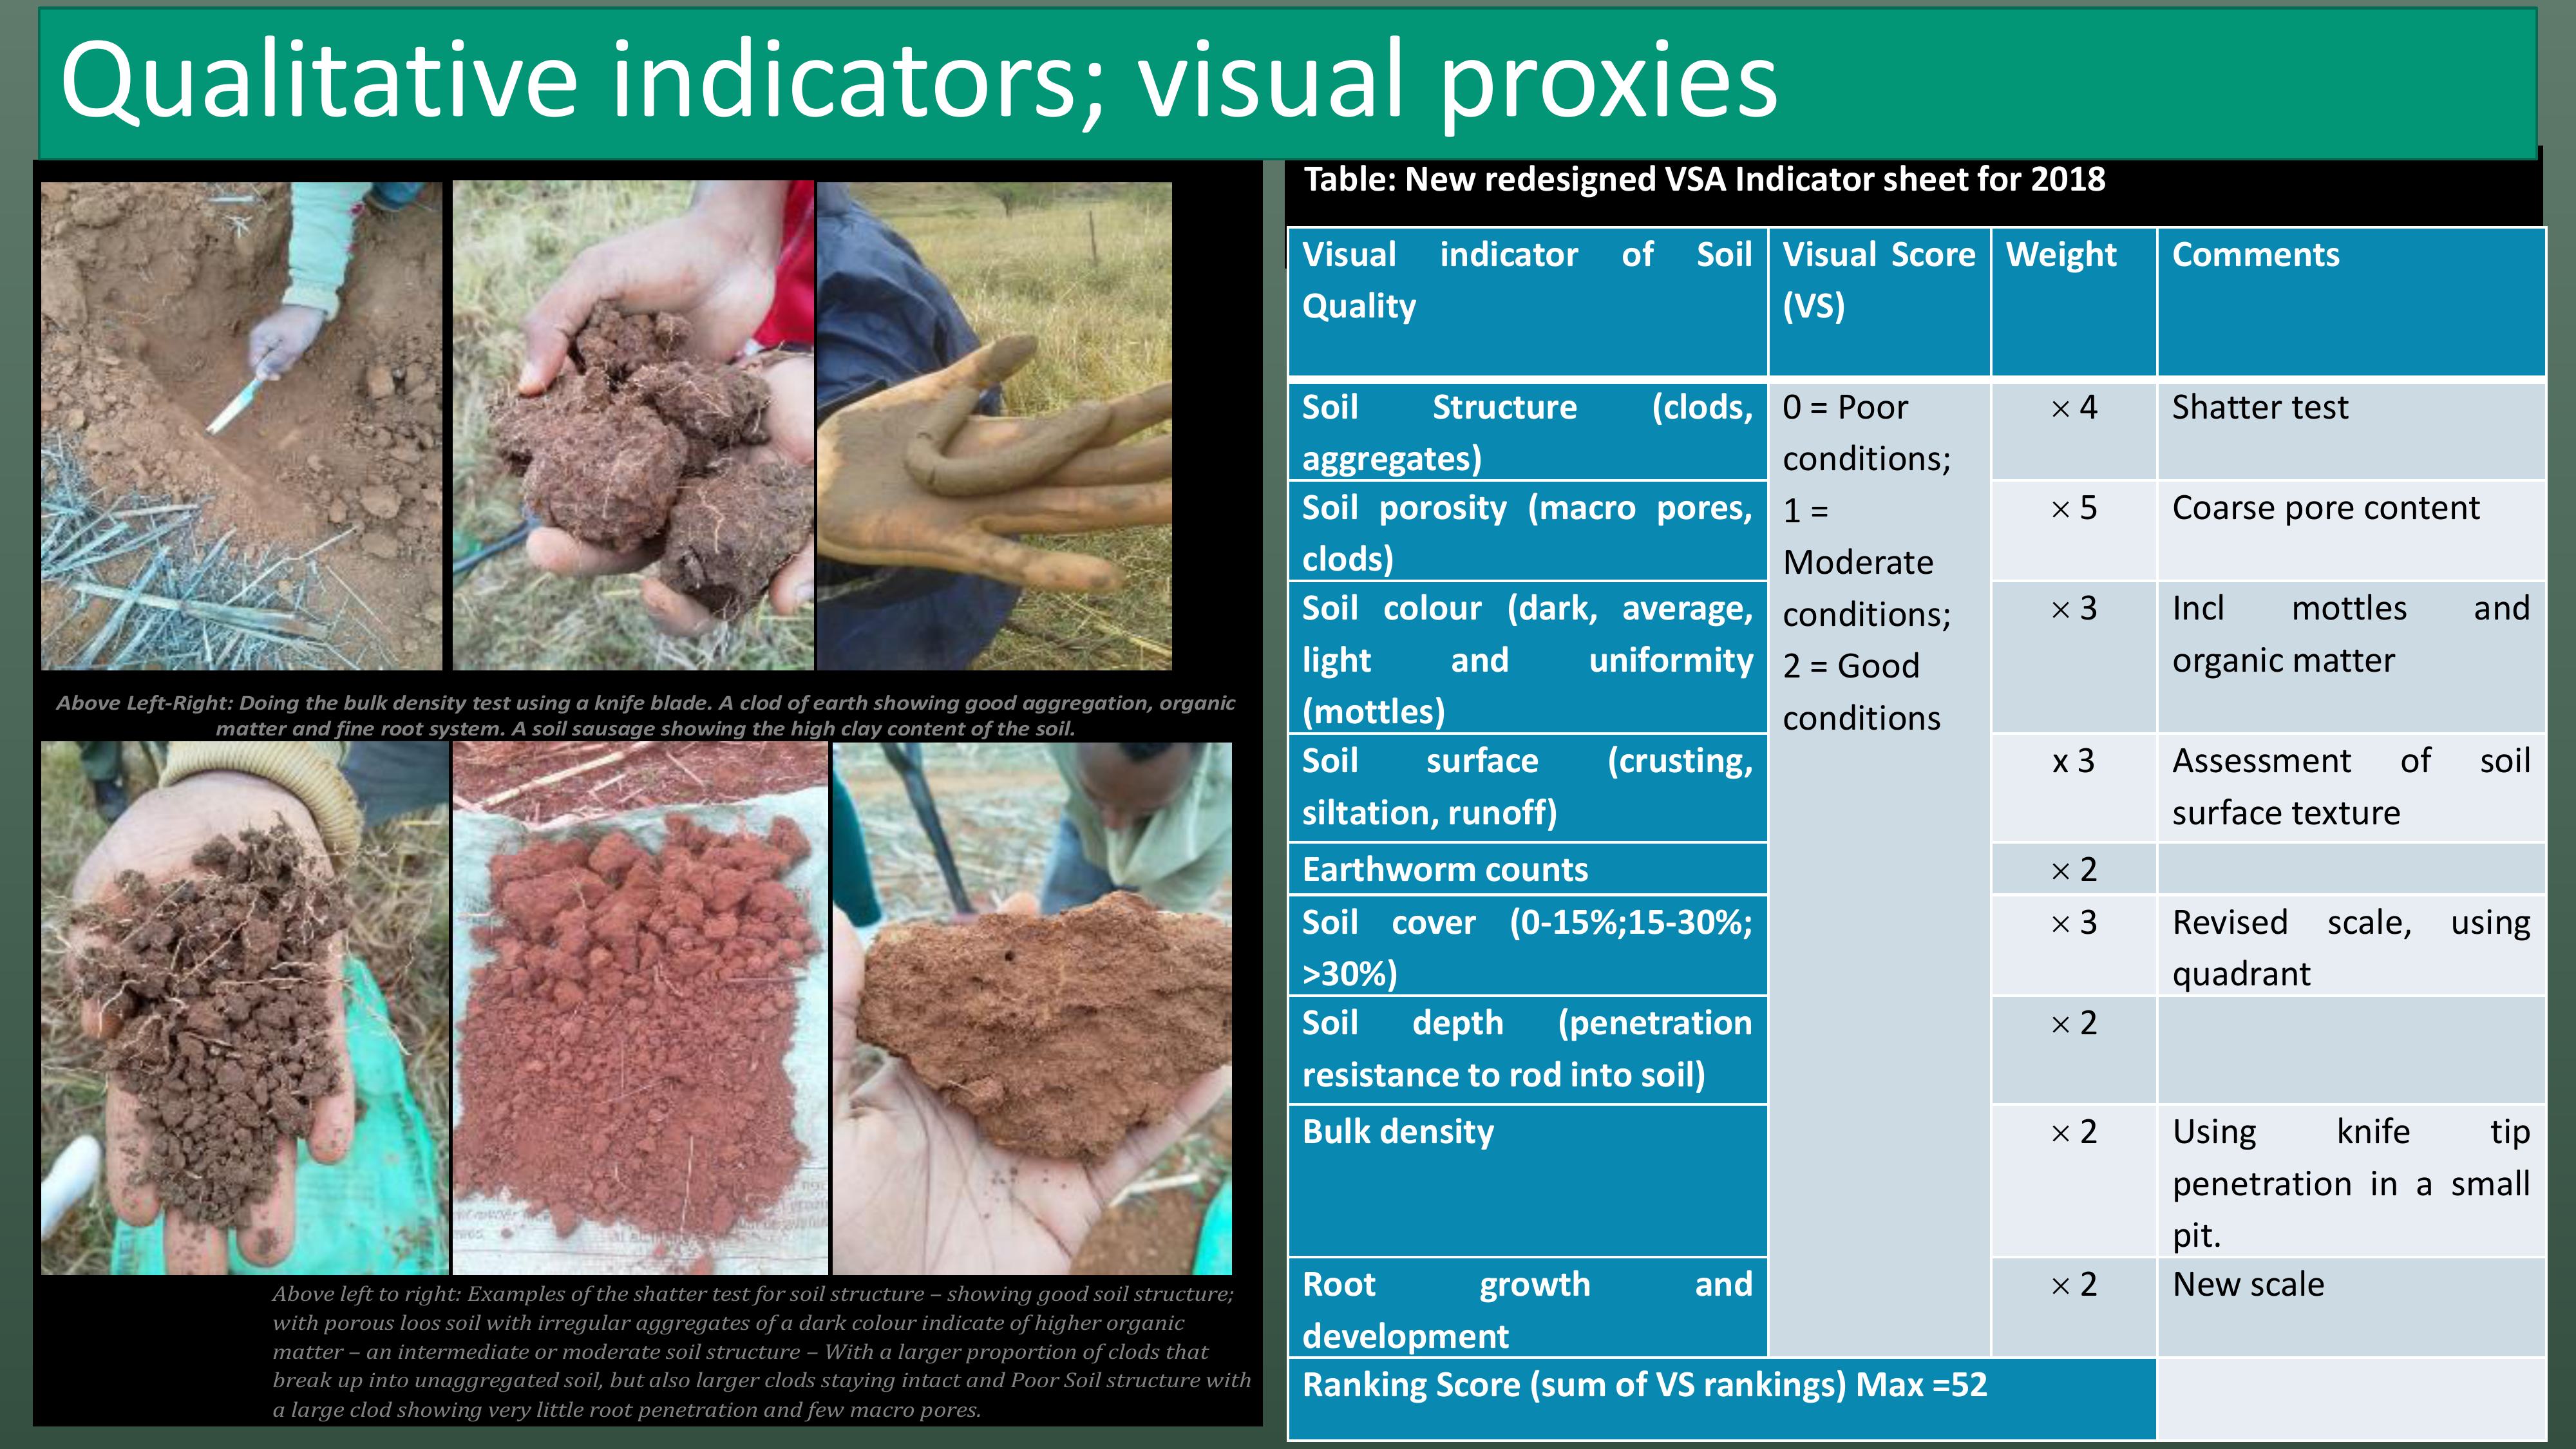
Table: New redesigned VSA Indicator sheet for 2018
Visual
indicator of
Soil
Quality
Visual Score
(VS)
Weight
Comments
Soil
Structure
(clods,
aggregates)
0 = Poor
conditions;
1 =
Moderate
conditions;
2 = Good
conditions
4
Shatter
test
Soil
porosity (macro
pores,
clods)
5
Coarse
pore content
Soil
colour (dark,
average,
light
and
uniformity
(mottles)
3
Incl
mottles
and
organic
matter
Soil
surface
(crusting,
siltation,
runoff)
x 3
Assessment
of
soil
surface
texture
Earthworm
counts 2
Soil
cover (0-15%;15-30%
;
>
30%)
3
Revised
scale,
using
quadrant
Soil
depth
(penetration
resistance
to rod into soil)
2
Bulk
density 2
Using
knife
tip
penetration
in a
small
pit
.
Root
growth
and
development
2
New
scale
Ranking
Score (sumof VS rankings) Max =52
Below are a few photographs indicative of the VS assessment and sampling process
Above Left-Right: Doing the bulk density test using a knife blade. A clod of earth showing good aggregation, organic
matter and fine root system. A soil sausage showing the high clay content of the soil.
Above left to right: Examples of the shatter test for soil structure – showing good soil structure;
with porous loos soil with irregular aggregates of a dark colour indicate of higher organic
matter– an intermediate or moderate soil structure – With a larger proportion of clods that
break up into unaggregated soil, but also larger clods staying intact and Poor Soil structure with
a large clod showing very little root penetration and few macro pores.
Qualitative indicators; visual proxies

Bgvl
June-Sept 2018
Simple
scientific method
(ET)
Farmers'
method
(Water
applied)
Name
of famer
water
use
(m3)
Total
weight
(kg)
WP
(kg/m
3)
water use
(m
3)
Total
weight
(kg)
WP
(kg/m
3)
Phumelele Hlongwane
trench
bed inside tunnel
1
,65
21
,06
12
,76
1
,85
21
,06
11
,38
Phumelele
Hlongwane
;
trench
bed outside
tunnel
0
,83
5
,32
6
,45
1
,75
5
,32
3
,04
Ntombakhe
Zikode
trench
bed
inside tunnel
1
,65
17
,71
10
,73
2
,37
17
,71
7
,47
Ntombakhe
Zikode
;
trench
bed outside
tunnel
0
,50
3
,35
6
,76
0
,53
3
,35
6
,33
Simple
scientific
method
(ET)
Farmers'
method
(Water
applied)
Name
of famer
water
use
(m
3)
Total
weight
(kg)
WP
(kg/m
3
)
water
use
(m3
)
Total
weight
(kg)
WP
(kg/m
3)
Christina
Thobejane (Tunnel
;
trench
beds, withmulch)
0
,8
48
,9
65
1
,10
48
,9
56
,7
Christina Thobejane
(Furrows
and ridges
with
mulch)
0
,5
24
,5
46
,4
3
,91
24
,5
5
Christina
trench outside
0
,8
14
,7
18
,4
2
,93
14
,7
11
,3
Nora
Mahlako (Tunnel
;
trench
beds withoutmulch)
0
,8
19
,6
26
9
,47
19
,6
5
Table: Water productivity for gardening practices for two participants from
Limpopo (Sedawa); April -July 2018
Table : Water productivity for gardening practices for two participants
from Bergville; July-Aug 2018
WP for trench beds substantially higher than
“normal bed”. WP in tunnels substantially
higher than outside; around 5 x more in
Limpopo and around 3 x more in KZN
Water productivity; Gardening
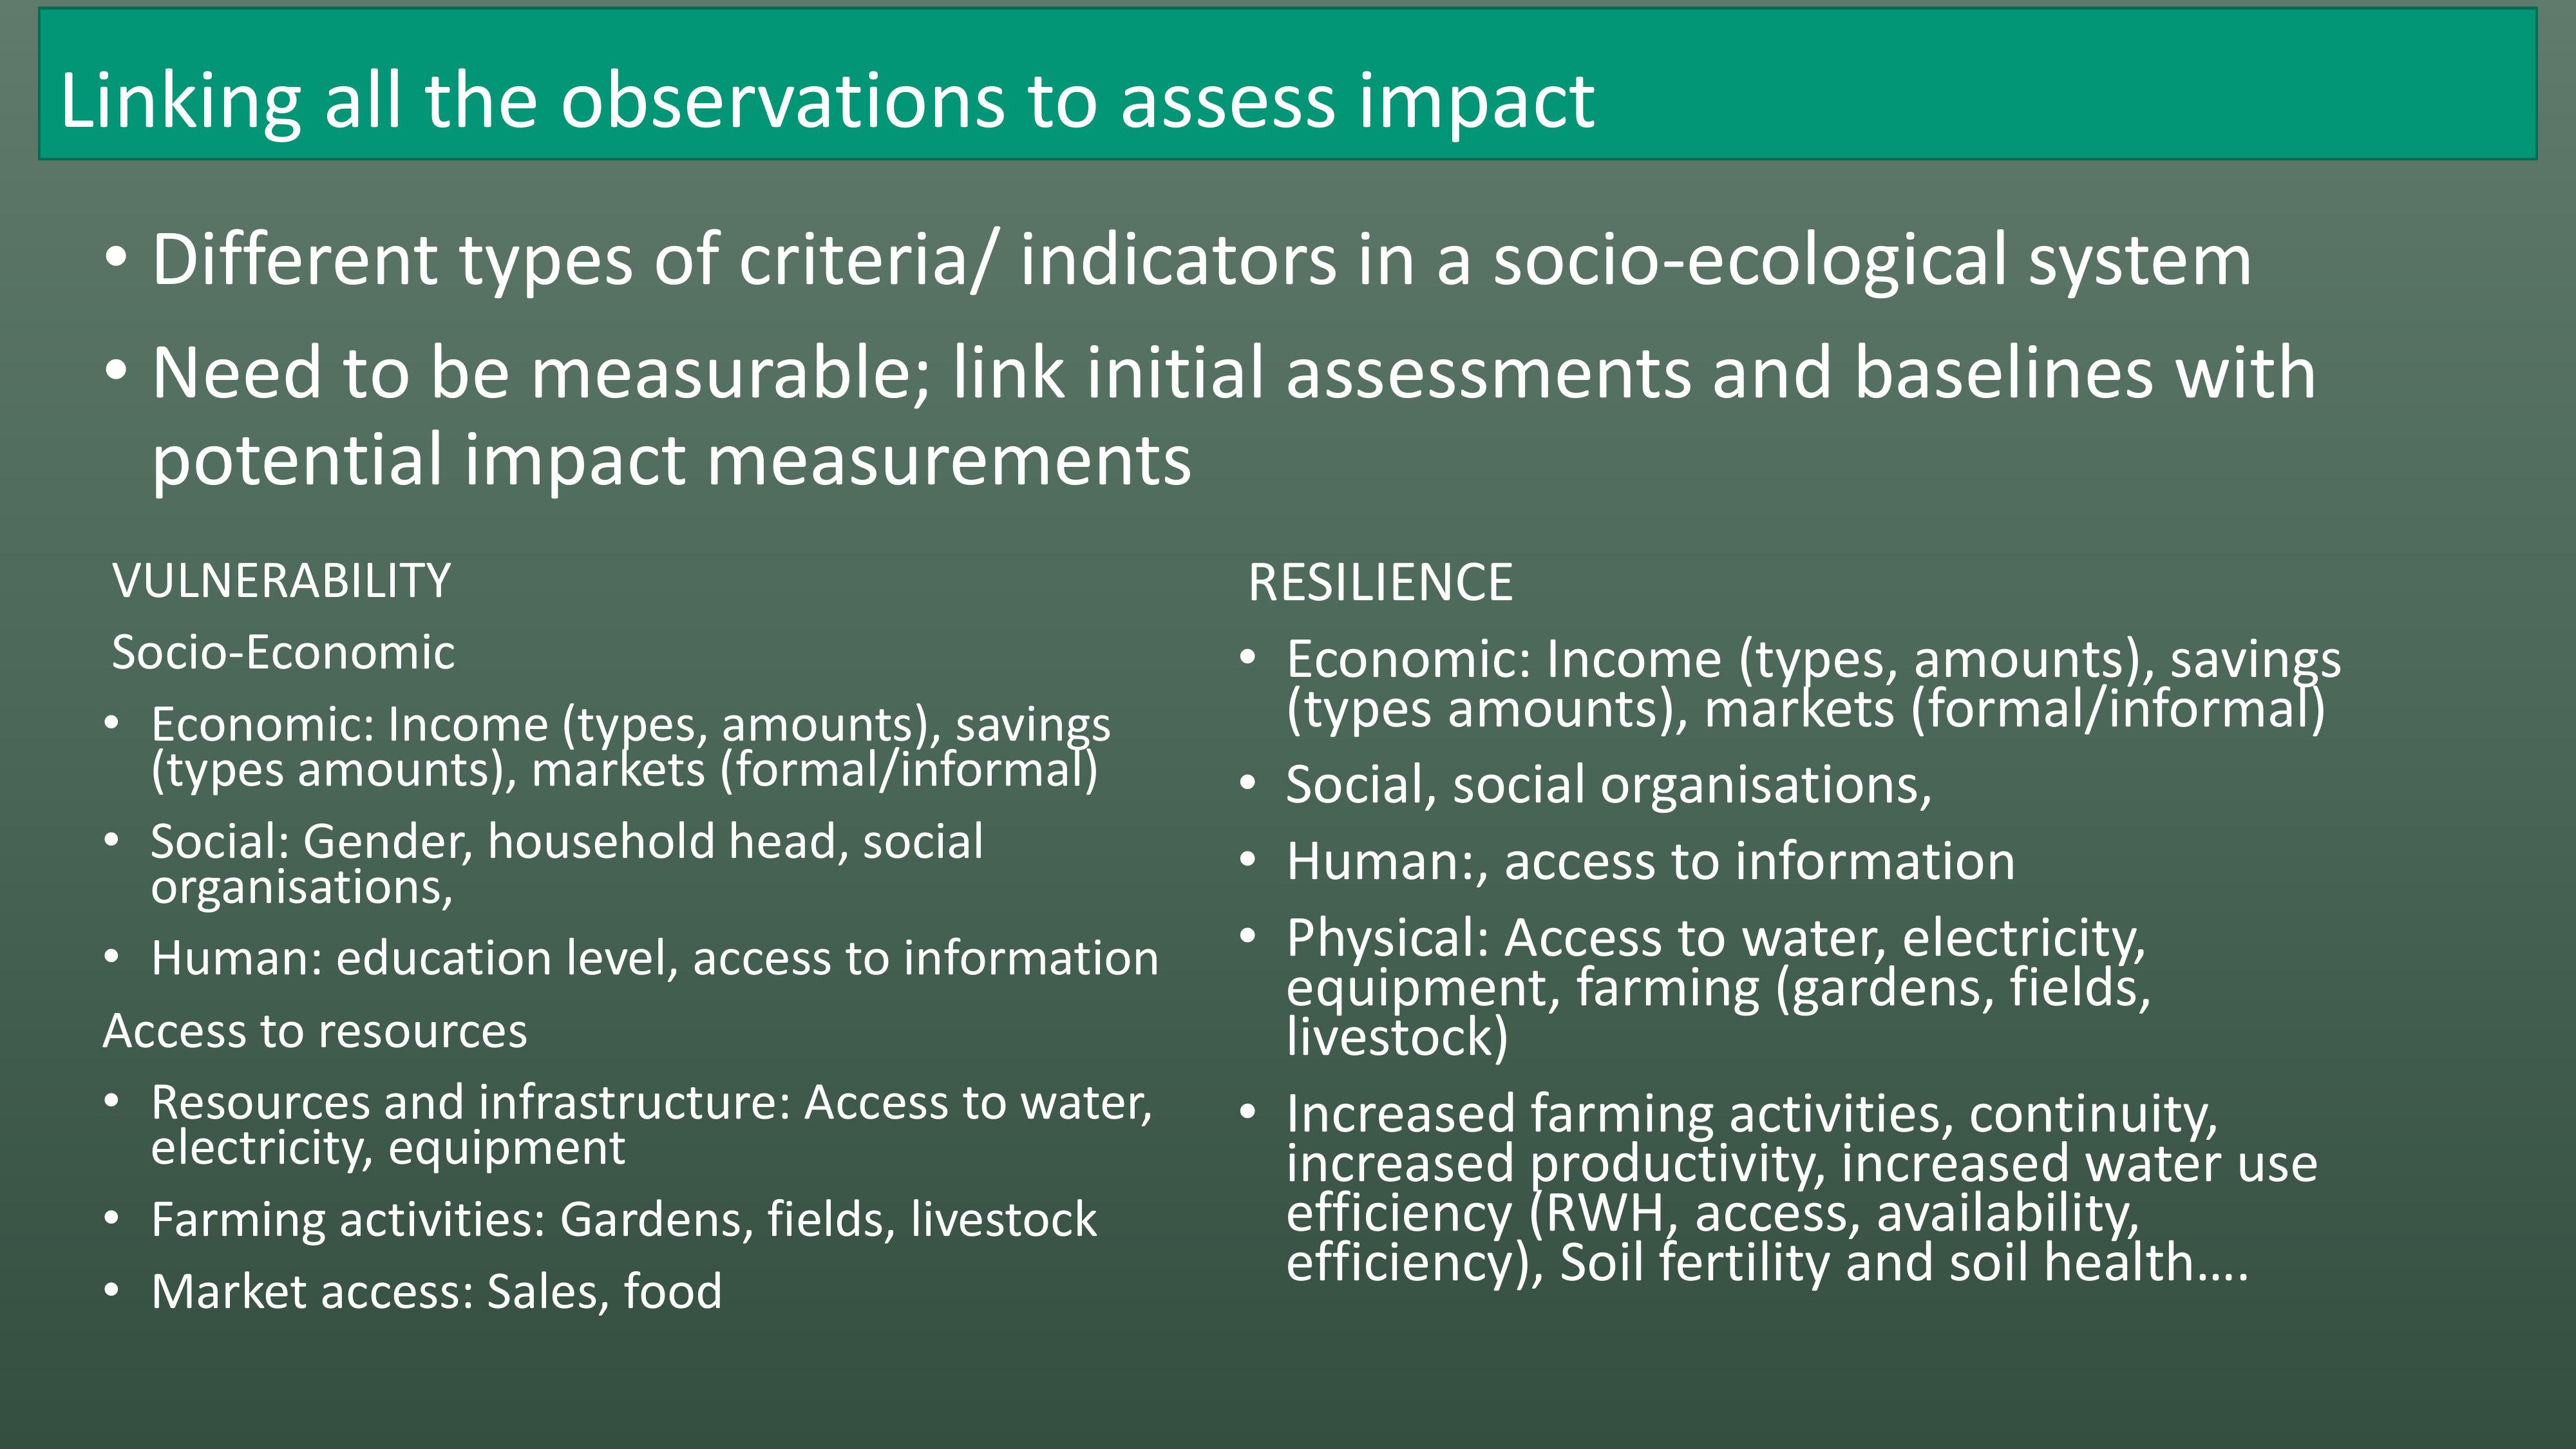
•Different types of criteria/ indicators in a socio-ecological system
•Need to be measurable; link initial assessments and baselines with
potential impact measurements
VULNERABILITY
Socio-Economic
•Economic: Income (types, amounts), savings
(types amounts), markets (formal/informal)
•Social: Gender, household head, social
organisations,
•Human: education level, access to information
Access to resources
•Resources and infrastructure: Access to water,
electricity, equipment
•Farming activities: Gardens, fields, livestock
•Market access: Sales, food
RESILIENCE
•Economic: Income (types, amounts), savings
(types amounts), markets (formal/informal)
•Social, social organisations,
•Human:, access to information
•Physical: Access to water, electricity,
equipment, farming (gardens, fields,
livestock)
•Increased farming activities, continuity,
increased productivity, increased water use
efficiency (RWH, access, availability,
efficiency), Soil fertility and soil health….
Linking all the observations to assess impact
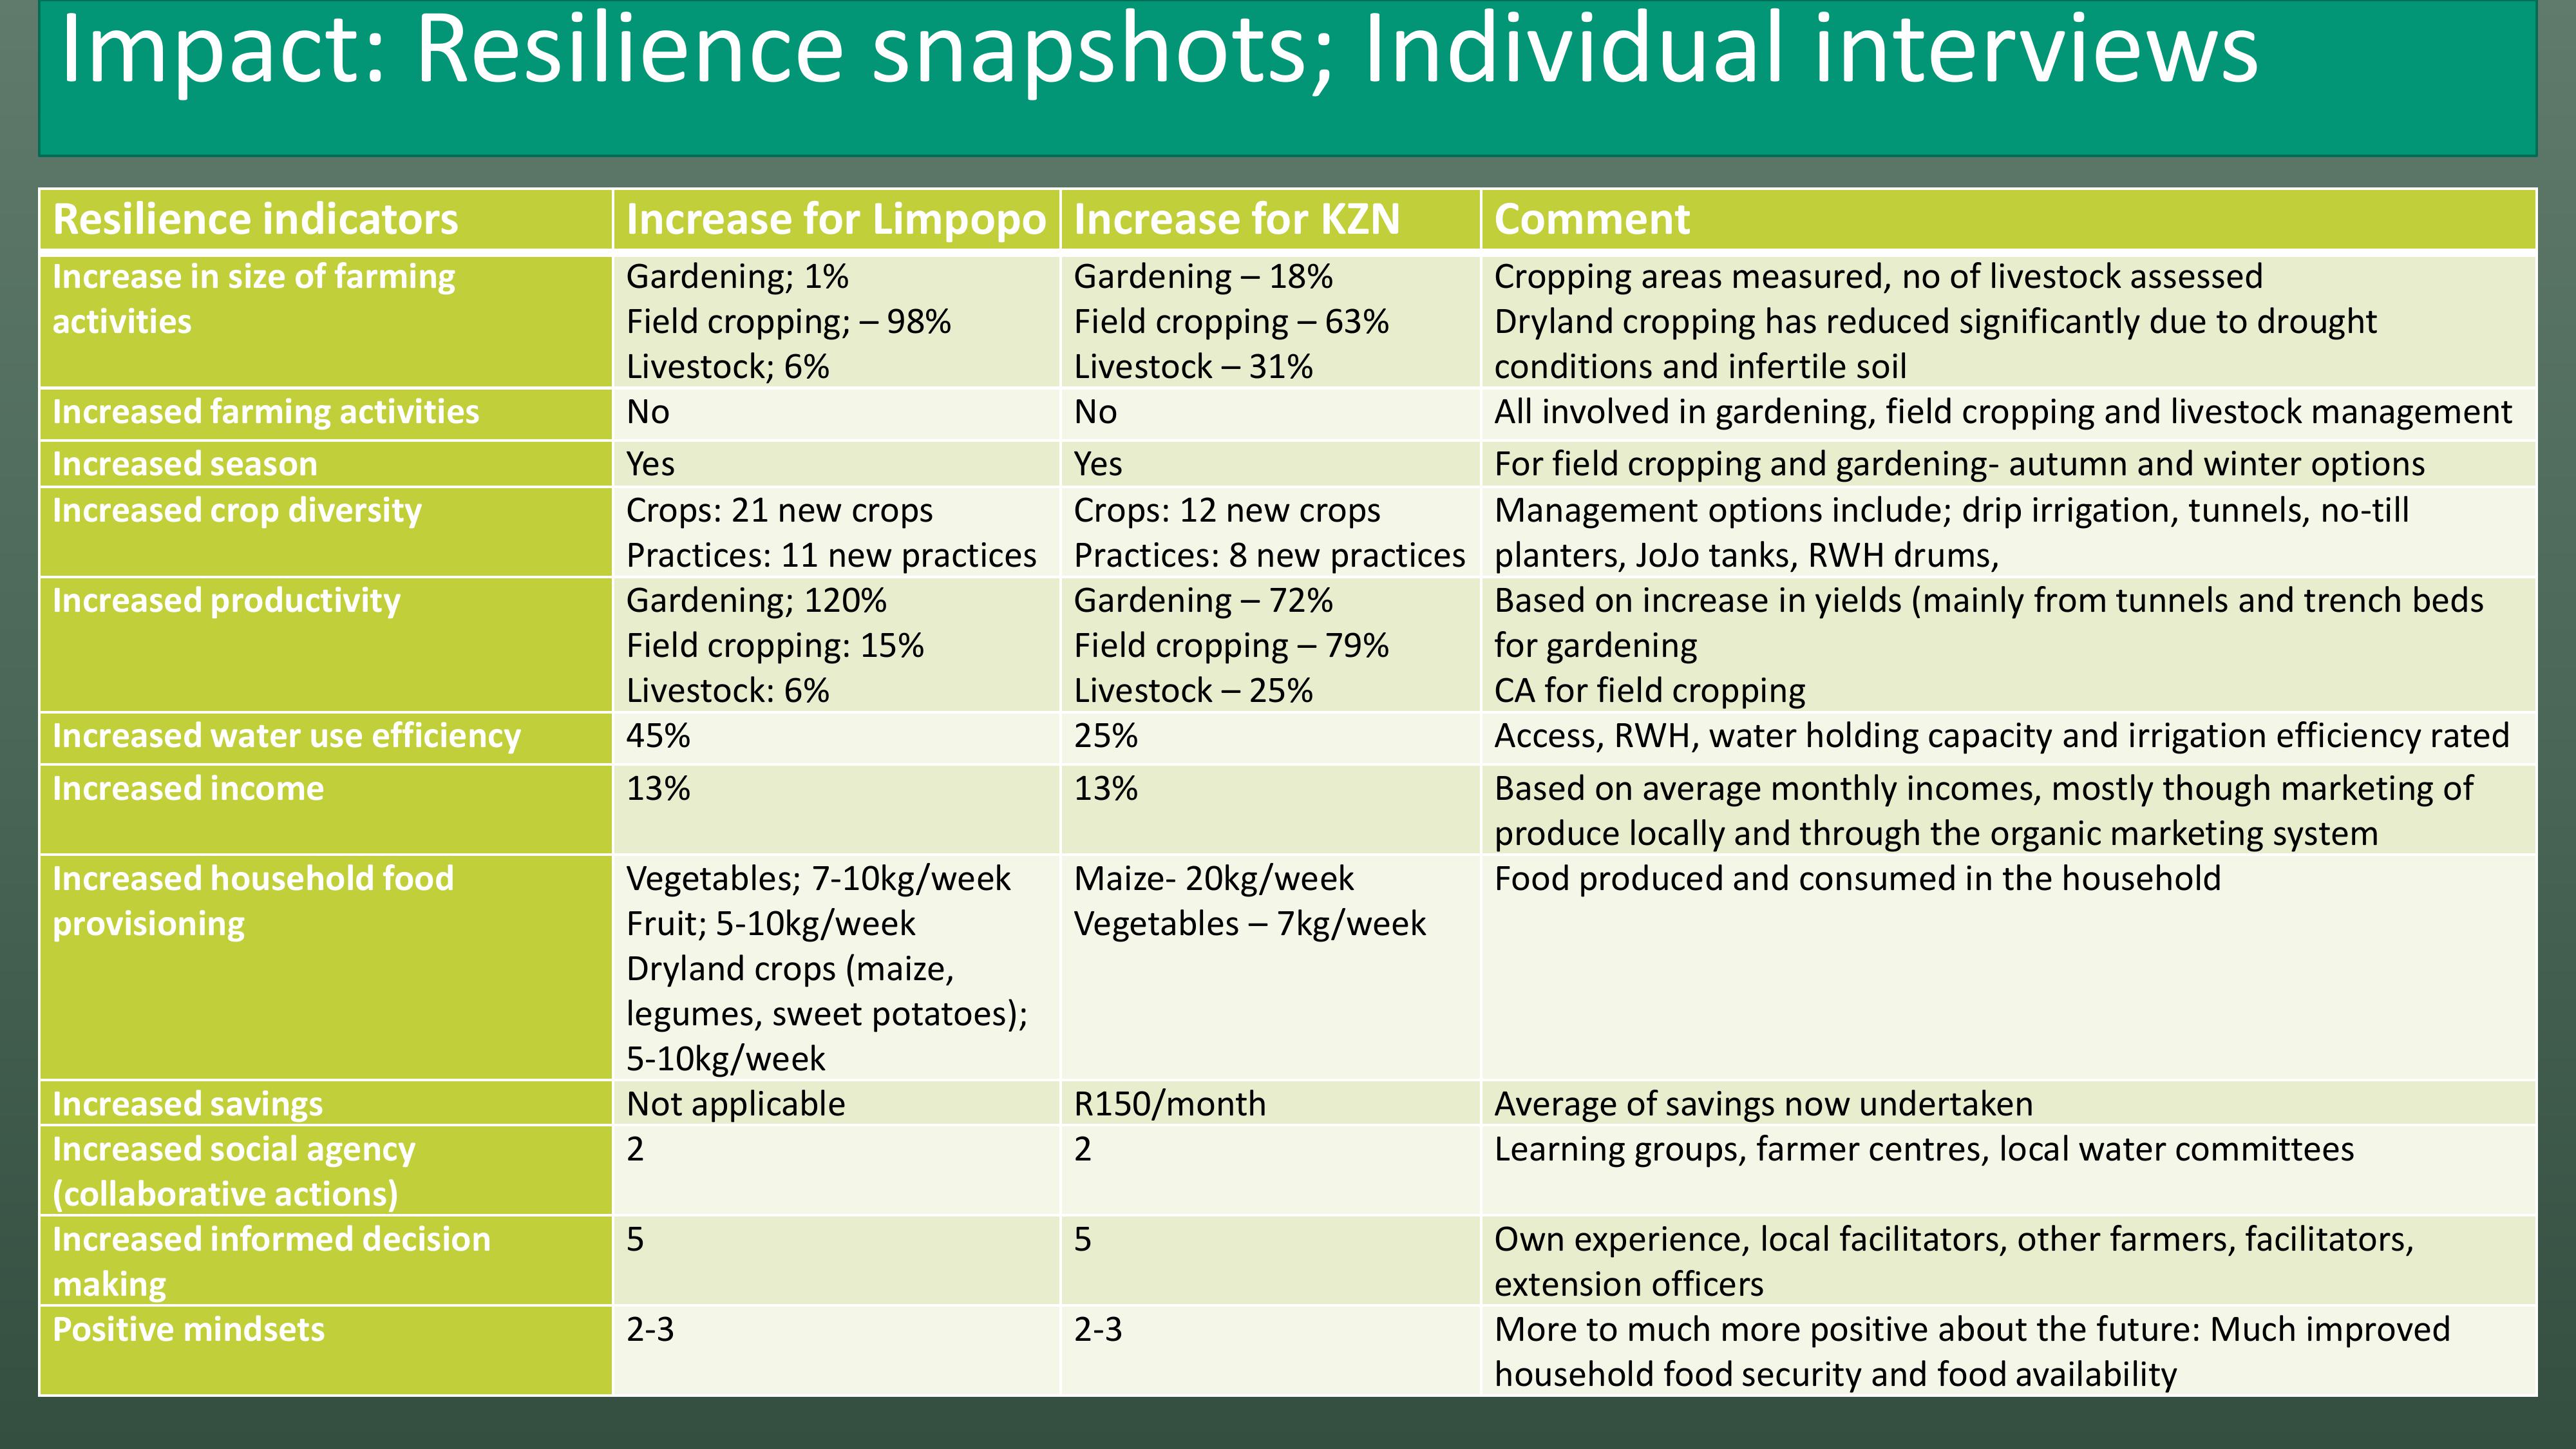
Impact: Resilience snapshots; Individual interviews
Resilience indicators
Increase for Limpopo
Increase for KZN
Comment
Increase in size of farming
activities
Gardening; 1%
Field cropping;
–98%
Livestock; 6%
Gardening
–18%
Field cropping
–63%
Livestock
–31%
Cropping areas measured, no of livestock assessed
Dryland cropping has reduced significantly due to drought
conditions and infertile soil
Increased farming activities
No
No
All involved in gardening, field cropping and livestock management
Increased season
Yes
Yes
For field cropping and gardening
- autumn and winter options
Increased crop diversity
Crops: 21 new crops
Practices: 11 new practices
Crops: 12 new crops
Practices: 8 new practices
Management options include;drip irrigation, tunnels, no
-till
planters, JoJo tanks, RWH drums,
Increased productivity
Gardening; 120%
Field cropping: 15%
Livestock: 6%
Gardening
–72%
Field cropping
–79%
Livestock
–25%
Based on increase in yields (mainly fromtunnels and trench beds
for gardening
CA for field cropping
Increased water use efficiency
45%
25%
Access, RWH, water holding capacity and irrigation efficiency rated
Increased income
13%
13%
Based on average monthly incomes, mostly though marketing of
produce locally and through the organic marketing system
Increased household food
provisioning
Vegetables; 7
-10kg/week
Fruit; 5
-10kg/week
Dryland crops (maize,
legumes, sweet potatoes);
5
-10kg/week
Maize
- 20kg/week
Vegetables
–7kg/week
Food produced and consumed in the household
Increased savings
Not applicable
R150/month
Average of savings now undertaken
Increased social agency
(collaborative actions)
2
2
Learning groups, farmer centres, local water committees
Increased informed decision
making
5
5
Own experience, local facilitators, other farmers, facilitators,
extension officers
Positive mindsets
2
-3
2
-3
More to much more positive about the future: Much improved
household food security and food availability

Impact: Participatory impact assessment
Soil
;
health
and
fertility
Money;
income
and
savings
Productivit
y
;
acceptance
of practice,
saving in
farming –
equipment
,
labour
Knowledge
;
increased
knowledge
and
ability
to
use
Food
;
how
much
produced
and how
healthy
Water
;
use and
access
Social
agency
;
Support,
empowe
rment
Total
Conservation
Agriculture
22
21
26
28
18
23
18
156
Savings
6
15
14
15
12
11
15
88
Livestock
19
11
18
7
5
12
11
83
Gardening
14
15
12
13
15
17
21
107
Crop rotation
16
12
13
12
12
15
10
90
Intercropping
12
13
15
12
11
11
9
83
Small
businesses
11
17
15
10
20
11
9
93
In KZN positive impact of CRA and associated
practices in order of importance: CA, gardening
(tunnels, agroecology) , small businesses
(farmer centres, poultry), savings, livestock
(integration –fodder, health)

Conclusions
•Systemic approach
•Grounded in local contextualisation
•For appropriate community led implementation and
•Participatory impact assessment for
•Incremental and cyclical improvements and behaviour change
Appropriate for partnering
in different contexts
Effective model for CCA;
locally contextualised
and owned
LET’s COLLABORATE