Water Research Commission
Prepared By:
Project team led by Mahlathini Development Foundation.
Project Number: K5/2719/4
Project Title: Collaborative knowledge creation and mediation strategies for the dissemination of
Water and Soil Conservationpractices and ClimateSmart Agriculture in smallholder farming
systems.
Deliverable No.5:Interim report: Refined decision support system for CSA in smallholder farming
Date: October 2018
Deliverable
5
Submitted to:
Executive Manager: Water Utilisation in Agriculture
Water Research Commission
Pretoria
Project team:
Mahlathini Development Foundation
Erna Kruger
Sylvester Selala
Mazwi Dlamini
Khethiwe Mthethwa
Temakholo Mathebula
Phumzile Ngcobo
Catherine vandenHoof
Institute of Natural Resources NPC
Jon McCosh
Rural Integrated Engineering (Pty) Ltd
Christiaan Stymie
Rhodes University Environmental Learning Research Centre
Lawrence Sisitka
WRC K4/2719 Deliverable 5: Interim report; Refined decision support system for smallholder CSA-October 2018
3
CONTENTS
FIGURES 4
TABLES 5
1OVERVIEW OF PROJECT AND DELIVERABLE 6
Contract Summary 6
Project objectives 6
Deliverables 6
Overview of Deliverable 5 7
2Cops and demonStration sites continued 10
2.1CCA workshop 1 10
2.1.1CCA workshop 1 summary – Gobizembe (Swayimane) 11
2.1.2Farmer Experimentation in Conservation Agriculture 15
2.1.3CoP in Swayimane20
3NEW EMPHASIS: Water issues 20
3.1Introduction 20
3.2Water issues Workshop 1 21
3.2.1KZN (Ezibomvini) (22 participants) 21
3.2.2KZN (Eqeleni) (28 participants)26
3.2.3Limpopo (Sedawa) (27 participants) 31
3.2.4Limpopo (Lepelle) 36
3.3Water issues workshop 2 40
3.3.1Agenda; water issues workshop 240
3.3.2SEDAWA Water issues Workshop 2 41
3.3.3Lepelle Water Issues Workshop 245
4CSA practices / Decision support system 51
4.1Objectives of DSS51
4.2Development of DSS 51
4.3Conceptual framework 52
4.4DSS inputs53
4.4.1Physical environment 53
4.4.2Farming systems 58
4.4.3Farmer socio-economic background 58
4.4.4Resources and management strategies60
4.4.5Agricultural practices 60
4.5DSS processes and intermediate steps 62
4.5.1Defining resources to manage based on physical environment and farming systems62
4.5.2Suggesting management practices based on resources to manage63
4.5.3Confining suggested practice based on restrictions set by farmer’s socio-economic background,
by farming system and by environmental conditions65
4.5.4Ranking relevant practices based on farmer and facilitator input68
4.6Limitations of the DSS and further work 70
4.7References 71
5CCA workshop 3 and 4: Individual prioritization and farmer experimentation72
5.1Eastern Cape (Alice, Middledrift, King Williams Town) 72
5.1.1CoP: Climate smart agriculture meeting: Fort Cox college of Agriculture and forestry Institute72
5.1.2CCA Workshop 3 agenda and process 72
5.2KwaZulu Natal (Ezibomvini and Thabamhlophe) 81
5.2.1Indicators used an Innovation Systems model81
5.2.2Trends for longer term smallholder participants in the CA SFIP83
5.2.3Environmental and productivity indicators 92
5.3Limpopo (Sedawa, Lorraine (Sekororo), Turkey) 97
WRC K4/2719 Deliverable 5: Interim report; Refined decision support system for smallholder CSA-October 2018
4
6Quantitative measurements for moNItoring impact104
6.1Limpopo measurements for individual experimentation 105
6.1.1Outline of the process 105
6.1.2Methodology106
6.1.3Background on water productivity106
6.1.4Conservation Agriculture vs conventional tillage109
6.1.5Gardening systems 111
6.1.6Working with Chameleons 115
6.1.7Soil fertility122
6.1.8Learning and conclusions122
7Capacity building and publications 124
7.1Community level learning124
7.2Organisational capacity building 124
7.3Post graduate students 124
7.4Publications and networking 125
FIGURES
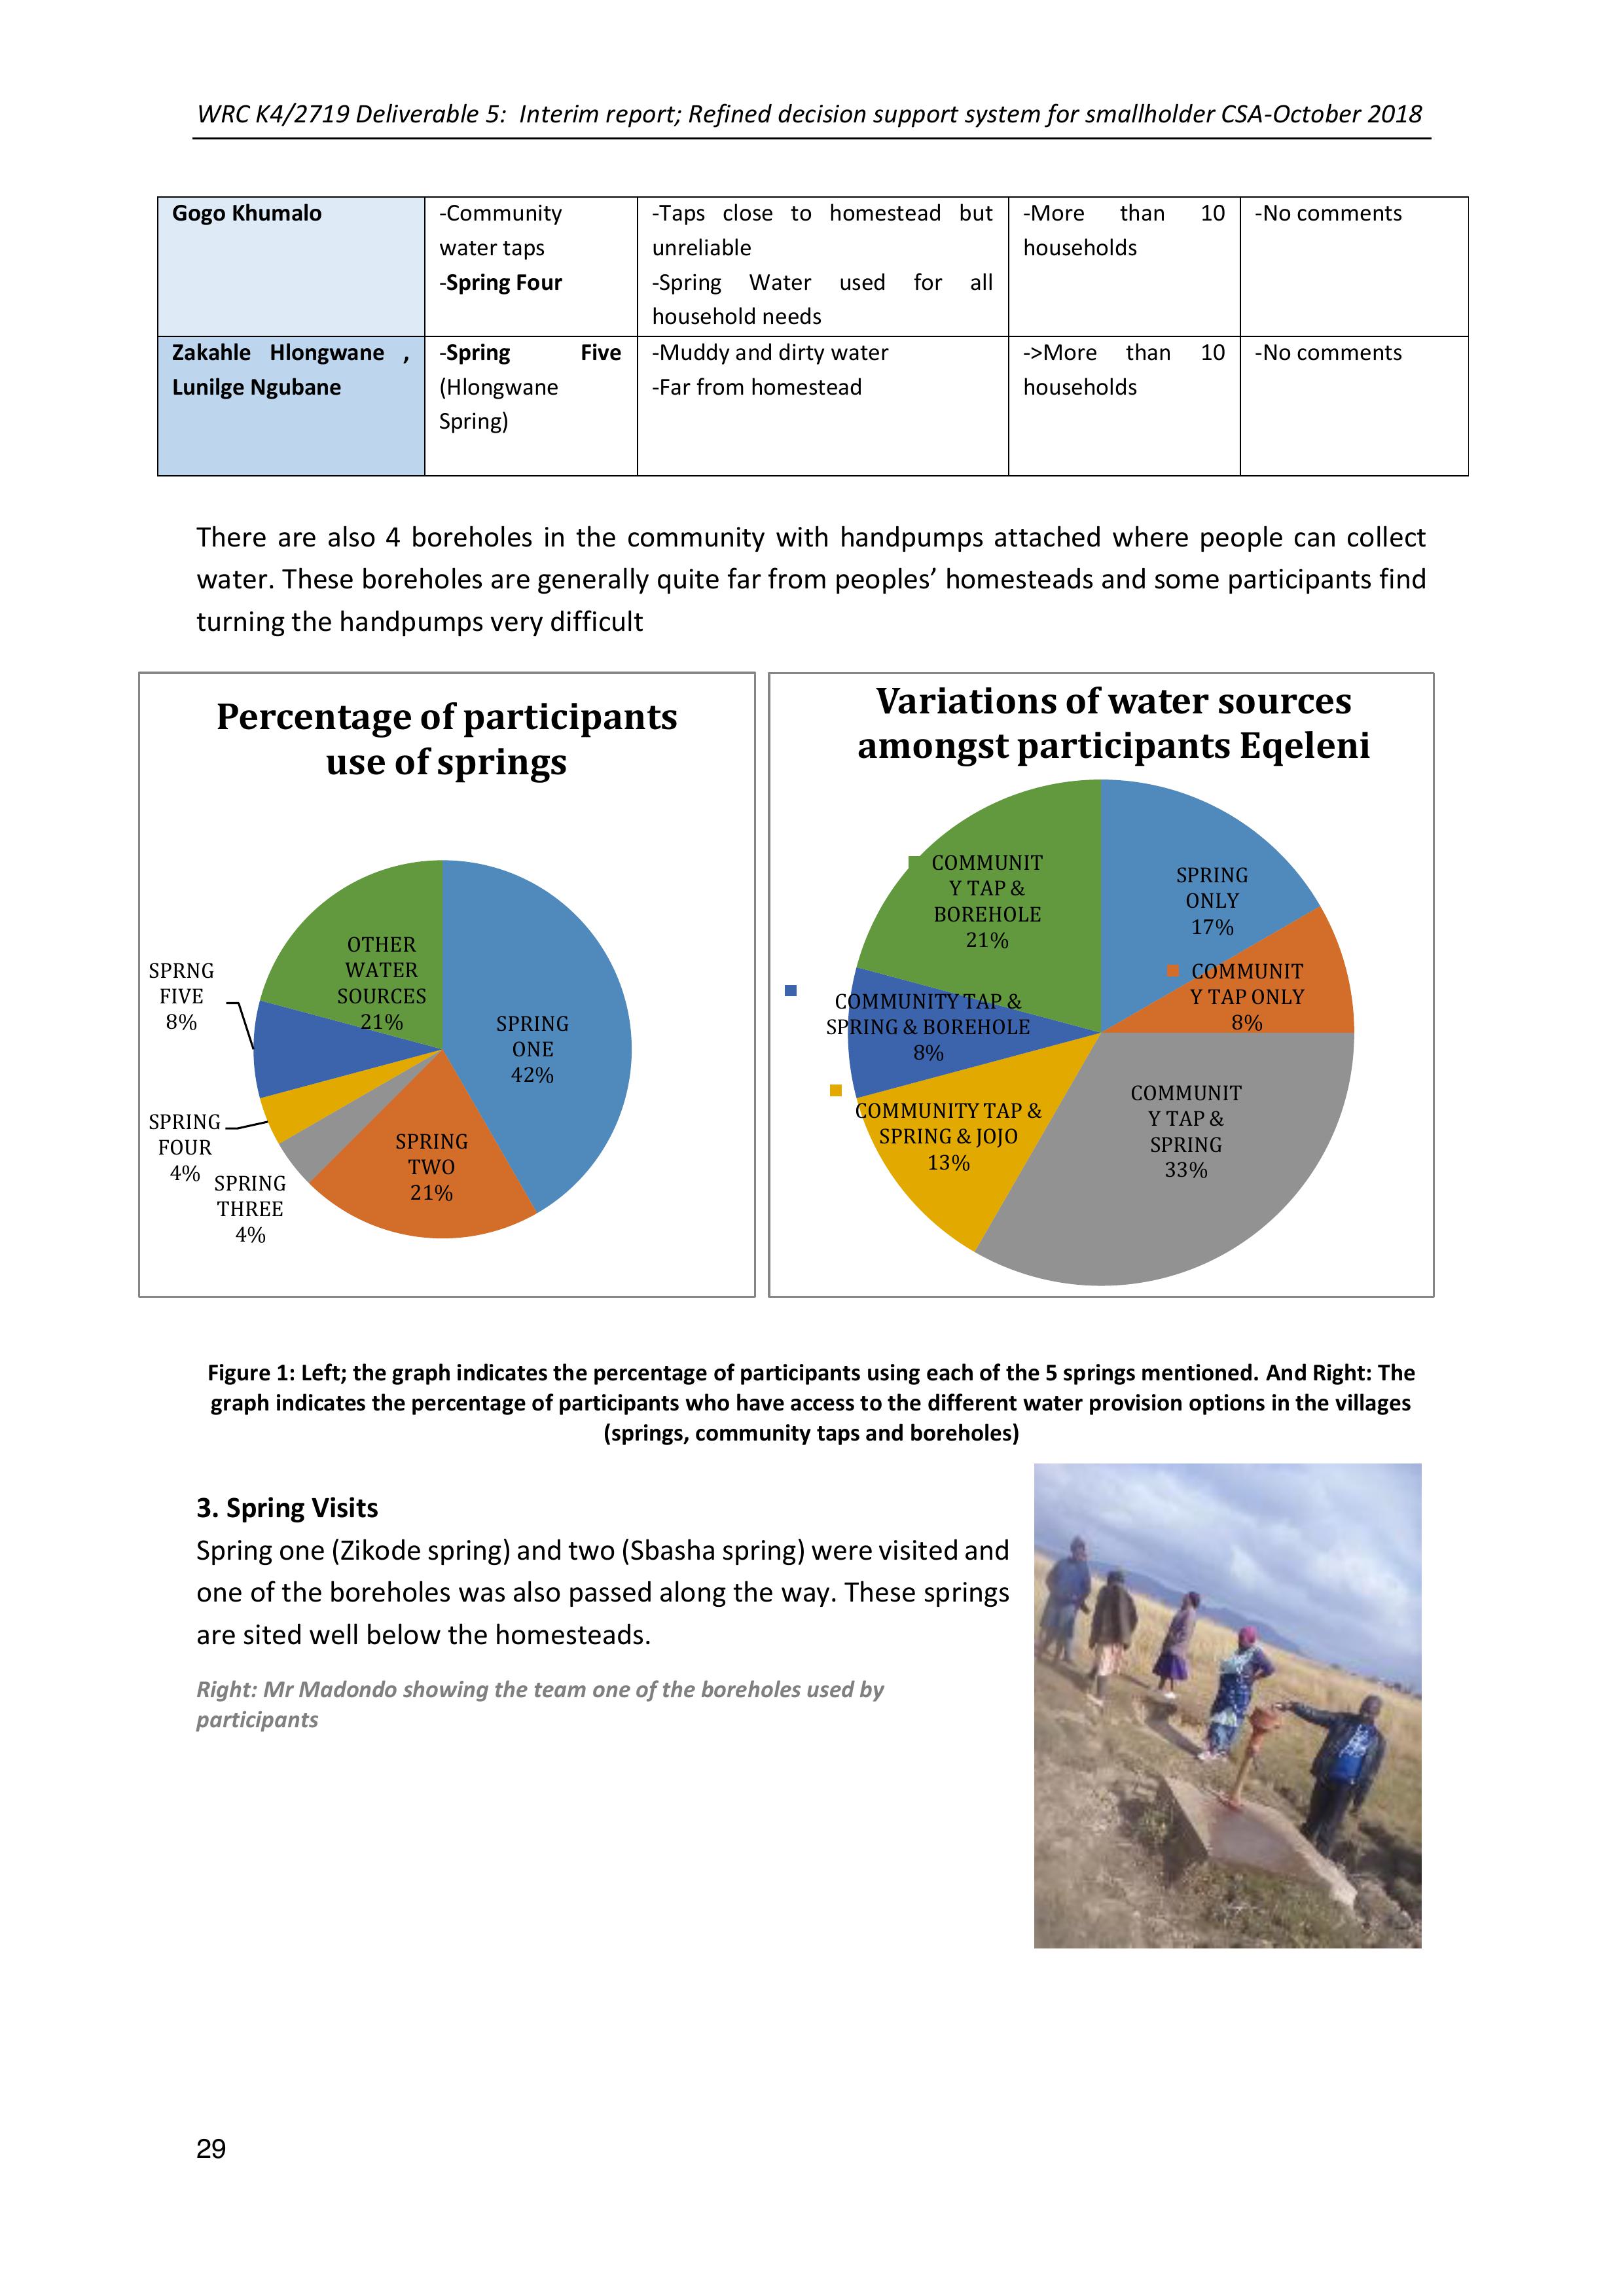
Figure 1: Left; the graph indicates the percentage of participants using each of the 5 springs
mentioned. And Right:The graph indicates the percentage ofparticipants who haveaccess to the
different water provision options in the villages (springs, community taps and boreholes) ...............29
Figure 2: The picture alongside outlines the proposed extent of the supply .......................................34
Figure 3: Schematic of the Decision Support System (DSS), with model inputs highlighted in grey.....52
Figure 4: Components, proxies and sub-categories of the physical environment...............................53
Figure 5: Soil texture triangle. ...............................................................................................................56
Figure 6: Resources and related management strategies. ...................................................................60
Figure 7: Summary of CA adoption for 4th and 5th season participants July 2018. ...............................84
Figure 8: Comparison of soil health test results for 2nd and 4th year CA participants ...........................93
Figure 9: From Left to Right: A spade of her soil graded to show large clods but little structural integrity;
An example of root size and depth of one of her maize plant -showing quite shallow rooting and the
double ring infiltrometer set up for readings. ......................................................................................97
Figure 10: Percentage implementation of new interventions and new innovations for a selection of
participants from 3 villages; July-September 2018 ...............................................................................98
Figure 11: Percentage implementation of local good practices for a selection of participantsfrom 3
villages; July-September 2018 ..............................................................................................................99
Figure 12: The gravimetric soil water content for Koko Maphori’s CA plot in Sedawa at 30,60,90 and
120cm depth .......................................................................................................................................111
Figure 13: Soil water content: Christina’s trench bed inside the tunnel (1 September2018)............117
Figure 14: Soil water content; Christina’s furrows-and ridges (traditional beds or control) ..............117
Figure 15: Soil water content: Christina’s trench bed outside the tunnel..........................................118
Figure 16: Soil Water content; Norah Mahlako -trench bed inside tunnel........................................119
Figure 17: Soil Water Content; Norah Mahlako- trench bed outside the tunnel ...............................119
Figure 18: Soil water content; Mariam Malephe-trench bed inside the tunnel ................................. 121
Figure 19: Soil Water Content: Mariam Malephe- trench bed outside the tunnel ............................121
Figure 20: Soil fertility analysis results for four villages in Limpopo...................................................122
WRC K4/2719 Deliverable 5: Interim report; Refined decision support system for smallholder CSA-October 2018
5
TABLES
Table 1: Deliverables for the research period; completed .....................................................................6
Table 2: CoPs’ established in three provinces (May-September 2018) ................................................10
Table 3: Gobizembe analysis of farming system; Past, present and future..........................................12
Table 4: Analysis of potential adaptive measures to counteract CC Impacts; Swayimane ..................12
Table 5: Prioritization matrix for Gobizembe participants ...................................................................15
Table 6: Crops yields in CA trials in Swayimane; 2017-2018 ................................................................17
Table 7: Summarised points from the discussion of introduction of Conservation Agriculture in
Swayimane ............................................................................................................................................17
Table 8: Description of all water sources, as used by each participant in the workshop .....................23
Table 9: Eqeleni; details of water sources per participant ...................................................................28
Table 10: Agro-Ecological Zones encountered in South Africa (grey) and location of study sites within
these zones ...........................................................................................................................................54
Table 11: Socio-economic characteristics and range of values used to define the three typologies...59
Table 12:Criteria fordefining the resourcestomanage and related strategies,based on the physical
environment and farming system (grey boxes) (*:solely for semiarid zone) .......................................63
Table 13: Criteria for selecting practices based on the resources to manage and related strategies (grey
boxes) ....................................................................................................................................................63
Table 14: Criteria for confining the selected practices based on farmer typology, physical environment
and farming system (grey boxes) ..........................................................................................................65
Table 15: Scores, between 0 and 3 assigned by a facilitator to each resource andper practice based on
the estimated beneficial impact of the practice on the specific resource ...........................................69
Table 16: CSA practices prioritized by individual participants ..............................................................74
Table 17: Individual farmer led experimentation choices; EC, Aug 2018 .............................................76
Table 18:Innovation Systems indicators for the CA-SFIP in Bergville ...................................................82
Table 19: Crop yields in CA farmer-led trials in Bergville; 2013-2017 ..................................................92
Table 20: Bulk density results for three CA participants.......................................................................94
Table 21: Run-off data from Phumelele Hlongwane; 2016-2017 .........................................................95
Table 22: Summary of water infiltration results for 13 participants in Bergville; 2017-2018 ..............96
Table 23: Participants in quantitative measurements for trials; KZN, Limpopo and EC: September 2018
............................................................................................................................................................104
Table 24: Rainfall records from 4 standard rain gauges in Sedawa, Mametja and Botshableo .........107
Table 25: Water productivity calculations for the gardening system farmer led experiments ..........113
WRC K4/2719 Deliverable 5: Interim report; Refined decision support system for smallholder CSA-October 2018
6
Interimreport:Refineddecisionsupport
systemfor CSAinsmallholderfarming
1OVERVIEW OF PROJECT AND DELIVERABLE
Contract Summary
Project objectives
1.To evaluate and identify best practice options for CSA and Soil and Water Conservation
(SWC) in smallholder farming systems, in two bioclimatic regions in South Africa. (Output 1)
2.To amplify collaborative knowledge creation of CSA practices with smallholder farmers in
South Africa (Output 2)
3.To test and adaptexisting CSA decision support systems (DSS) for theSouth African smallholder
context (Outputs 2,3)
4.To evaluate the impact of CSA interventions identifiedthrough the DSS by pilotinginterventions
in smallholder farmer systems, considering water productivity, social acceptability and farm-scale
resilience (Outputs 3,4)
5.Visual and proxy indicators appropriate for a Payment for Ecosystems based model aretested at
community level for local assessment of progress and tested against field and laboratory analysis
of soil physical and chemical properties, and water productivity (Output 5)
Deliverables
Table 1: Deliverables for the research period; completed
No
Deliverable
Description
Target date
FINANCIAL YEAR 2017/2018
1
Report: Desktop review of
CSA and WSC
Desktop review of current science, indigenous and traditional
knowledge, and best practice in relation to CSA and WSC in the
South African context
1 June 2017
2
Report on stakeholder
engagement and case
study development and
site identification
Identifying and engaging with projects and stakeholders
implementing CSA and WSC processes and capturing case studies
applicable to prioritized bioclimatic regions
Identification of pilot research sites
1 September
2017
3
Decision support system
for CSA in smallholder
farming developed
(Report)
Decision support system for prioritization of best bet CSA options in
a particular locality; initial database and models. Review existing
models, in conjunction with stakeholder discussions for initial
criteria
15 January
2018
FINANCIAL YEAR: 2018/2019
4
CoPs and demonstration
sites established (report)
Establish communities of practice (CoP)s including stakeholders and
smallholder farmers in each bioclimatic region.5. With each CoP,
identify and select demonstration sites in each bioclimatic region
and pilot chosen collaborative strategies for introduction of a range
of CSA and WSC strategies in homestead farming systems (gardens
and fields)
1 May 2018
5
Interim report: Refined
decision support system
for CSA in smallholder
farming (report)
Refinement of criteria and practices, introduction of new ideas and
innovations, updating of decision support system
1 October
2018
6
Interim report: Resultsof
pilots, season 1
Pilot chosen collaborative strategies for introduction of a range of
CSA and WSC strategies, working with the CoPs in each site and the
decisions support system. Create knowledge mediation productions,
31 January
2019

WRC K4/2719 Deliverable 5: Interim report; Refined decision support system for smallholder CSA-October 2018
7
manuals, handouts and other resources necessary for learning and
implementation.
FINANCIAL YEAR 2019/2020
7
Report: Appropriate
quantitative measurement
procedures for verification
of the visual indicators.
Set up farmer and researcher level experimentation
1 May 2019
8
Interim report:
Development of indicators,
proxies and benchmarks
and knowledge mediation
processes
Document and record appropriate visual indicators and proxies for
community level assessment, work with CoPs to implement and
refine indicators. Link proxies and benchmarks to quantitative
research to verify and formalise. Explore potential incentive
schemes and financing mechanisms.
Analysis of contemporary approaches to collaborative knowledge
creation within the agricultural sector. Conduct survey of present
knowledge mediation processes in community and smallholder
settings. Develop appropriate knowledge mediation processes for
each CoP. Develop CoP decision support systems
1 August
2019
9
Interim report: results of
pilots, season 2
Pilot chosen collaborative strategies for introduction of a range of
CSA and WSC strategies, working with the CoPs in each site and the
decisions support system. Create knowledge mediation productions,
manuals, handouts and other resources necessary for learning and
implementation.
31 January
2020
FINANCIAL YEAR 2020/2021
10
Final report: Results of
pilots, season
Pilot chosen collaborative strategies for introduction of a range of
CSA and WSC strategies , working with the CoPs in each site and the
decisions support system. Create knowledge mediation productions,
manuals, handouts and other resources necessary for learning and
implementation.
1 May 2020
11
Final Report: Consolidation
and finalisation of decision
support system
Finalisation of criteria and practices, introduction of new ideas and
innovations, updating of decision support system
3 July 2020
12
Final report - Summarise
and disseminate
recommendations for best
practice options.
Summarise and disseminate recommendations for best practice
options for knowledge mediation and CSA and SWC techniques for
prioritized bioclimatic regions
7 August
2020
Overview of Deliverable 5
The design of the decision support system (DSS) is seen as an ongoing process divided into three
distinct parts:
➢Practices:Collation, review, testing, and finalisation of those CSA practices to be included.
Allows for new ideas and local practices to be included over time. This also includes linkages
and reference to externalsources of technical information around climate change, soils, water
management etc and how this will be done, as well as modelling of the DSS;
➢Process: Through which climate smart agricultural practices are implemented at smallholder
farmer level. This also includes the facilitation component,communities of practice (CoPs),
communication strategies and capacity building and
➢Monitoring and evaluation:local and visual assessment protocols for assessing
implementation and impact of practicesas well as processes used. This also includes site
selection and quantitative measurements undertaken tosupport the visual assessment
protocols and development of visual and proxy indicators for future use in inactive based
support schemes for smallholder farmers.
Activities in this five- month period have included:
➢Practices activities: Initial modelling of the DSS and initial design of an online survey for CSA
practices

WRC K4/2719 Deliverable 5: Interim report; Refined decision support system for smallholder CSA-October 2018
8
➢Process activities: Introduction of CCA in 1 (CCA workshop 1) more community in KZN
(Swayimane), individual prioritization and planning (CCA workshop 3) in the EC (3 villages),
training and implementation (Workshops 4 and 5) inKZN (3 villages), the EC (3 villages) and
Limpopo (3 villages). CoP engagement has consisted of presentations at the KZN CA forum
(KZNDARD) and a national CA Forum (GrainSA/ Maize Trust). Capacity building; continuation
of MSC’s(Khethiwe Mthethwa) and MA (Mazwi Dlamini); 2 Conference presentations; 1
article; 1 cross visit (PACSAsmall livestock farming visit) and 1learning event (ARC “Agricloud”
app for smallholder farmers- introduction).
➢Monitoring and evaluation:First round of quantitative measurement of indicators (weather
stations, run-off plots, gravimetric soil sampling, soil health sampling, soil fertility sampling,
chameleon water sensors) for conservation agriculture (CA) and intensive gardening activities
in one site; Limpopo, expansion of baseline information and impact assessment of CA after 4-
5 years of implementation
A chronology of activities undertaken is presented in the table below.
Date
Activity
Description
Team
2018/05/04,05
CCA workshop 3
Ezibomvini and Eqeleni (KZN)
Phumzile, Khethiwe,
Sylvester
2018/05/04,05
Water issues
exploration
workshop 1
Lepelle, Sedawa (Limpopo),
Sylvester, Erna
2018/06/06, 07
CCA workshop 4
Ezibomvini, Eqeleni,
Thabamhlophe(KZN)
Phumzile, Khethiwe,
Temakholo,
2018/06/26,27
Water issues
exploration
workshop 2
Lepelle, Sedawa (Limpopo)
Sylvester, Erna, Chris,
Neville Meyer
2018/07/03-04
CCA workshop 1
Swayimane (KZN)
Temakholo, Khethiwe,
Mazwi,
2018/07/07-14
Initial online
survey
Draft concept
Erna, Matthew Evans
2018/07/26
Livestock cross
visit
PACSA small livestock projects in
Umgungundlovu DM
Mazwi, Temakholo,
Khethiwe
2018/07-09
Initial modelling
of DSS
MoU with WITS academic for initial
outline and concept of model
Erna, Catherine van den
Hoof
2018/05-08
Participatory
video
Training of field staff; PV in KZN
(Ezibomvini, Stulwane,
Swayimane), EC (Alice, Middeldrift)
and Limpopo (Lepelle, Sedawa)
Mazwi, Sylvester, Erna,
Khethiwe, Phumzile.
Neville Meyer
2018/07/30-
08/03
CCA workshop 3
and 4
EC (Alice, Middeldrift), 3 villages,
incl baseline interviews,
construction of tunnel, dripkits,
towers gardens, demos and
training
Sylvester, Mazwi,
Khethiwe, Temakholo,
Erna, Chris and Lawrence
WRC K4/2719 Deliverable 5: Interim report; Refined decision support system for smallholder CSA-October 2018
9
2018/08/07,08
Water issues
workshop 2
KZN (Ezibomvini and Eqeleni)
Erna, Chris, Phumzile,
Temakholo, Khethiwe
2018/08/13-15
LaRSSA
conference
Presentation on CA innovation
system
Erna
2018/08/20-22
Water issues
workshop 3
Limpopo (Lepelle, Sedawa)
Erna, Chris, Sylvester
Neville Meyer
2018/09/06
ARC_Agricloud
workshop
Introducing app for smallholders -
climate forecasting to assist
planting, spraying and pest control
Erna, Temakholo,
Phumzile, Samke,
2018/09/16
GrainSA CA forum
Presentation of CA progress;
Swayimane, Bergville and overall
Erna, Phumzile, Khethiwe
2018/09/25-27
8th Biennial
LandCare
Conference
Presentation on CA progress
Temakholo, Khethiwe
Capacity building and publications:
•Research presentations and chapters:
oMazwi Dlamini –M Phil (PLAAS UWC-yr 2); Completedresearch tools and started on
field work
oKhethiwe Mthethwa: M Agric – University of KwaZulu Natal; January 2018. The
contribution of Climate Smart Agriculture (CSA) practices in adapting to climate
change: The case of smallholder farmers in KwaZulu Natal. Completed proposal and
desktop review and started on research tools
•Publications:
oSA Grain Newsletter; CA SFIP, 1 smallholder case study (Swayimane)
•Cross visits:
oPACSA – small livestock production interventions in the Umgungundlovu DM
•Attendance:
oNo-Till Club Annual Conference- 4-6 September 2018
oKZN CA Forum
oIntroduction of Agricloud app (www.rain4africa.org) for smallholder farmers –ARC –
6 September
•Conference papers:
oLand Rehabilitation Society of South Africa: Annual Conference 13-15 August2018.
Presentation of a paper “Learning CA the Innovation Systems Way” – E Kruger
o8thBiennial LandCare Conference; 25-27 September “CA Innovation Systems; progress
and successes” – T Mathebula

WRC K4/2719 Deliverable 5: Interim report; Refined decision support system for smallholder CSA-October 2018
10
2COPS AND DEMONSTRATION SITES CONTINUED
The work with the CoPs and in the demonstration sites is ongoing. The table below summarises the
progress to date.
Table 2: CoPs’ established in three provinces (May-September 2018)
*Note: Activities in bold under Demonstration Sites, were conducted during tis time frame
CCA workshop 1
The idea is both to continue the implementation and experimentation with a basket of CSA options in
the existing seven(7) villages and to introduce the process in new villages. The climate change
adaptation process was expanded into one more village, in Southern KZN during this period.
Province
Site/Area;
villages
Demonstration
sites
CoPs
Collaborative strategies
KZN
Tabamhlophe
- CCA workshop 1
- CCA workshop 2
-CCA workshop 3
-Farmers w NGO
support (Lima RDF)
- Tunnels and drip kits
- Individual experimentation
with basket of options
Ezibomvini/
, Eqeleni
- CCA workshop 1
- CCA workshop 2
- CCA workshop 3
- CCA workshop 4
(training)
- Water issues
workshops 1,2
-CA open days,
cross visits
(LandCare, DARD,
ARC, GrainSA), LM
Agric forums, ….
- Tunnels (Quantitative
measurements
- CA farmer experimentation
(Quantitative measurements)
– case studies
-Individual experimentation
with basket of options
Swayimane
- CCA workshop 1
-CA open days
-Umgungundlovu
DM agriculture
forum
-CA farmer experimentation
Limpopo
Mametja
(Sedawa, Turkey)
- CCA workshop 1
- CCA workshop 2
- CCA workshop 3
- CCA workshop 4
-Water issues
workshops 1-2
-Agroecology
network
(AWARD/MDF)
-Maruleng DM
- Tunnels (Quantitative
measurements
- CA farmer experimentation
(Quantitative measurements)
– case studies
- Individual experimentation
with basket of options
-water committee, plan for
agric water provision
Lepelle
Water issues
workshops 1-2
-
-water committee, plan for
agric water provision
Tzaneen
(Sekororo-
Lourene)
- CCA workshop 1
- CCA workshop 2
- Assessment of
farmer
experimentation
Farmers learning
group
-Tunnels and drip kits
EC
Alice/Middledrift
area
- CCA workshop 1
- CCA workshop 2
- CCA workshop 3
and 4
Imvotho Bubomi
Learning Network
(IBLN) - ERLC, Fort
Cox, Farmers, Agric
Extension services,
NGOs
-Individual and collaborative
experimentation with basket
of options
-Tunnel, dripkits, trench beds
(Quantitative measurements)

WRC K4/2719 Deliverable 5: Interim report; Refined decision support system for smallholder CSA-October 2018
11
Swayimane is a densely populate rural community close to New Hanover and Pietermaritzburg. A
number of smallholders there are active in market gardening and selling of vegetables and field crops
(such as amadume, sweet potatoes and maize) to the burgeoning urban population around them. Four
new learning groups were started in the area during 207-2018, focussing initially on the introduction
of Conservation Agriculture into their cropping systems. An exploration of climate change impacts
and potential adaptive measures into theirfarming system and experimentation withclimate smart
agriculture practices both in their cropping and gardening activities was made.
CCA workshop 1 summary – Gobizembe (Swayimane)
Written by Temakholo Mathebula and Erna Kruger
Group understanding of Climate Change
The 20 participants in this workshop acknowledged that the weather patterns in their area have been
changing, with overall higher temperaturesand water scarcity in the community, becoming slowly
more and more severe. This is linked to a change in the rainfall patterns, which has affected their
planting dates and harvests. They appreciate the opportunity to experiment with ideas that can assist
in building their resilience and mentioned that already they can see how the Conservation Agriculture
they have tried this yearcan help. They
mentioned that they were not aware how
severe the situation is in other areas (as
presented by Mahlathini). For some of the
farmers climate change was seen a myth,
but the discussion made them more aware
of the issues as a real problem.
Right: The Gobizembe learning group discussing
climate change, impacts and adaptive measures
They felt that the winter season has become colder and the summer season, hotter. They added that
this yearthe rate of rainfall has increased and as a result they had snails in their vegetable gardens for
the first time. There were no serious issues with soil erosion in majority of their gardens because they
continued to open basins instead of ploughing which has become common practice amongst the
group members and has assisted them in retaining water.
One of the participants raised the prevalent problem of water scarcity in the community, adding that
if the community does not take care of the environment this will be worse. According to another
farmer, if climate change goes unnoticed and misunderstood in local communities there will be no life
on earth. They suggested that issues related to climate change and its effects on the environment
should be taught in schools because the younger generationsshould be taught about the theories,
reality of climate change and what can be done to combat it. They further asserted that people are
the cause of climate change, therefore,communities must alsobe involved indrivingchangeincluding
faith- based organisations inKwaSwayimane. The analysis ofchanging in their farming system from
past though to future is summarised in the table below

WRC K4/2719 Deliverable 5: Interim report; Refined decision support system for smallholder CSA-October 2018
12
Table 3: Gobizembe analysis of farming system; Past, present and future
Past
Present
Future
No fertilizers used
Farmers continue to use compost produced
using dead leaves
Increased use of fertilizers
Mixed cropping
Mono cropping
No water to water their crops and to
give to livestock.
Use of organic fertilisers-
chicken and cattle dung
Decrease in yields due to abandonment of
traditional methods of planting
Integration of crops and livestock
system
Traditional varieties
Shift to westernized planting methods
Deterioration of health status and
energy levels
Keeping of livestock
Tram lines (beans and potatoes)
Loss in yields
There were no termites
Farmers use basins, contours and swales
methods to plant sweet potatoes
Increase food insecurity
The farmers use swales to be able to clearly
see when it is time to harvest
Nutrition deficiency
We eat genetically modified food
One home one garden
More vulnerable to sickness.
Training of younger generation how to
farm
Crops are more vulnerable to termites
The analysis of impact of climate change on the lives and livelihoods of the participants is presented
in the table below
Table 4: Analysis of potential adaptive measures to counteract CC Impacts; Swayimane
Problem
Impact
Solutions or adaptations
Death of livestock
Poverty and Hunger
Vaccinate livestock
Increased rainfall
Increase presence of insects andpests
in vegetable gardens
Spraying of pesticides and ash in the garden, use
natural pest control such as wood ash, crushed garlic
and water mix to kill pest and insects.
Drought
Vegetable plants dry up
Change planting season, use cattle dung as compost,
keep soil covered and don’t till the soil, cover crops
with net
Scarcity of water
Vegetable plants dry up and shrinking
of food supply
Man-made dams, recycle and reuse water, water
plants once a day, creating basins to plant, rain water
harvesting, provision of JoJo tanks
Fewer homes with
vegetable gardens in
communities
Less food supply
Every home must have a vegetable garden
Soil erosion
Reduced ability of the soil to store
water and nutrients.
Create basins and farrows &ridges for planting. Don’t
till the soil.
Yield loss
Increase food insecurity
Implement CA practices: mulching and no-till.
Poverty
Hunger and nutrition deficiency in the
community. Increase in crime and
theft
Growing crops and vegetables for household
consumption
Crime
Yield loss
Fencing of vegetable gardens. Encourage youth to
get involved in farming activities and/or find jobs

WRC K4/2719 Deliverable 5: Interim report; Refined decision support system for smallholder CSA-October 2018
13
The household visits on the 2nd day revealed a number of practices undertaken by the farmer
participants that can already be considered local adaptive measures. The household farm fields of
Ritta Ngobese, Khombisile Mcancana and Thandazile Mathonsi were visits toobserve their fields,
record current farming practices and climate change effects on farming.
They opted break up their community garden and farm in smaller cluster of 5 people together in their
homesteads. They have a garden/field of around 400m2, fenced andsupplied with water through a Jo-
Jo tank. They plant vegetables in winter and field crops in summer.
They use S&W conservationtechniques including raised beds, planting basins, furrows and ridges,
some mulching, mixed cropping and crop rotation. This last season they have used CA fortheir field
crops.
The farmers started their season by planting potatoes. After harvesting they cover the soil with maize
stalks to retain soil moisture. They also planted cover crops and intercropped using cow peas and
amadumbe. Thereafter, they planted amadumbe, then the maize and bean intercrop. Currently they
have planted cabbages, brinjal, mustard spinach, onions, spinach, beetroot, carrots and green pepper
(see Pictures below). They have issueswith pests infecting cabbage and spinach leaves that oftenturn
purple.
Right; a mixed
raised bed of
chilies and
onions and far
right their
garden,
showing raised
beds, basins,
and sandbags
to conserve
soil and water
Above left: Mam Ngobese’s field prepared for field cropping with furrows and ridges ready for planting potatoes and
amadumbe. Above right; Thandazile Mathonsi, uses basins in her garden for planting. She uses a mixture of fertilizer and
manure for planting, but her soils are obviously lacking in organic matter and are dry and infertile.

WRC K4/2719 Deliverable 5: Interim report; Refined decision support system for smallholder CSA-October 2018
14
After the field visits, the exercise in
suggesting and prioritising adaptive
measures was conducted.
Right: Tema facilitating the impacts and
adaptive measures mind mapping exercise
Here practices were introduced
(using the practicespower point
presentation), that farmers could try
out immediately or in the near future
to solve some the current issues
discussed and discuss the current
adaptation measures they are
practicing to solve these challenges. The practices are categorized in five differentgroups; water
management, soil management, crop management, livestock, and natural resources.
Water management
•Rain Water Harvesting
•Windbreaks
•Grey water use
Soil management
•Less use of tractors (No-till)
•Plant on contours
•Plant grass to stop erosion (crop/soil cover)
•Stone lines
•Increase soil fertility
•Increase water holding
Crop management
•Natural pest & disease control (ash& garlic)
•Trench beds
•Mulching
•CA (No-till)
•Tunnels
•Inter cropping & crop rotation
•Seed type/ seed saving
From this list the following practices were prioritized by the group for implementation:
1.Mix cropping
2.Drip kits
3.CA
4.Trenches
5.Cover crops
6.Tower gardens
7.Tunnels
Criteria used to select practices are summarised below:
a) Water usage: The water use requirement for each practice

WRC K4/2719 Deliverable 5: Interim report; Refined decision support system for smallholder CSA-October 2018
15
b) Soil fertility: The contribution of each practice to soil fertility
c) Cost: The affordability of the tools required to construct structures and/or sustain practices
d) Increase in crop quality: Increases crop health and yields
e) Seasonality: Whether each practice is suitable for allseasons, subject to theeffects of unpredictable
changes in climate conditions
f) Labour: Thisrelates to the labour intensityand time required to construct structures and sustain
practice(s).
These criteria were then used to rate the different practices as shown in the table below.
Scale:
1-low/easy/cheap
2-medium/average
3-difficult/high/expensive
Table 5: Prioritization matrix for Gobizembe participants
Water
usage
Increase
soil
fertility
Cost
Crop
quality
Seasonality
Labour
TOTAL
Tunnels
2
3
3
3
3
3
17
Drip kits
1
3
2
3
3
2
14
Trenches
1
3
1
3
3
3
14
Tower
gardens
1
3
2
3
2
2
13
Mix
cropping
2
3
2
3
1
2
13
Cover crops
2
3
3
3
1
2
14
CA (no-till)
1
3
1
3
3
3
14
This exercise helps to prioritise the practices that individual farmer participants will experiment with
in the coming seasonand paves the way for the 3rdCCA workshopwhere the individual
experimentation schedule is set out and training and mentoring is provided in the techniques and
practices.
Farmer Experimentation in Conservation Agriculture
The implementation of the CA awareness raising and experimentation is managed through the Maize
Trust Smallholder FarmerInnovation Programme. Outcomes, learnings andlinkages withweather
variability and adaptation are also reported here as these aspects are pertinent to the assessment of
impact of the practices and the development of the decision support process.
Individual members of the learning groups are part of a Farmers’ Association in the area. Thirty-four
(34) participants conducted CA trials; consisting of 400m2plots intercropped with maize and beans
and maize and cowpeas respectively. Cover crops are relay planted into the plots towards the end of
the season. Farmer level experimentation was expanded to include plantingwith a 2-row tractor
drawn planter for the larger fields and the experimentation layout and planting procedures were
adopted to also suit this process.
Below are a few small case studies of the trials during this growing season.
WRC K4/2719 Deliverable 5: Interim report; Refined decision support system for smallholder CSA-October 2018
16
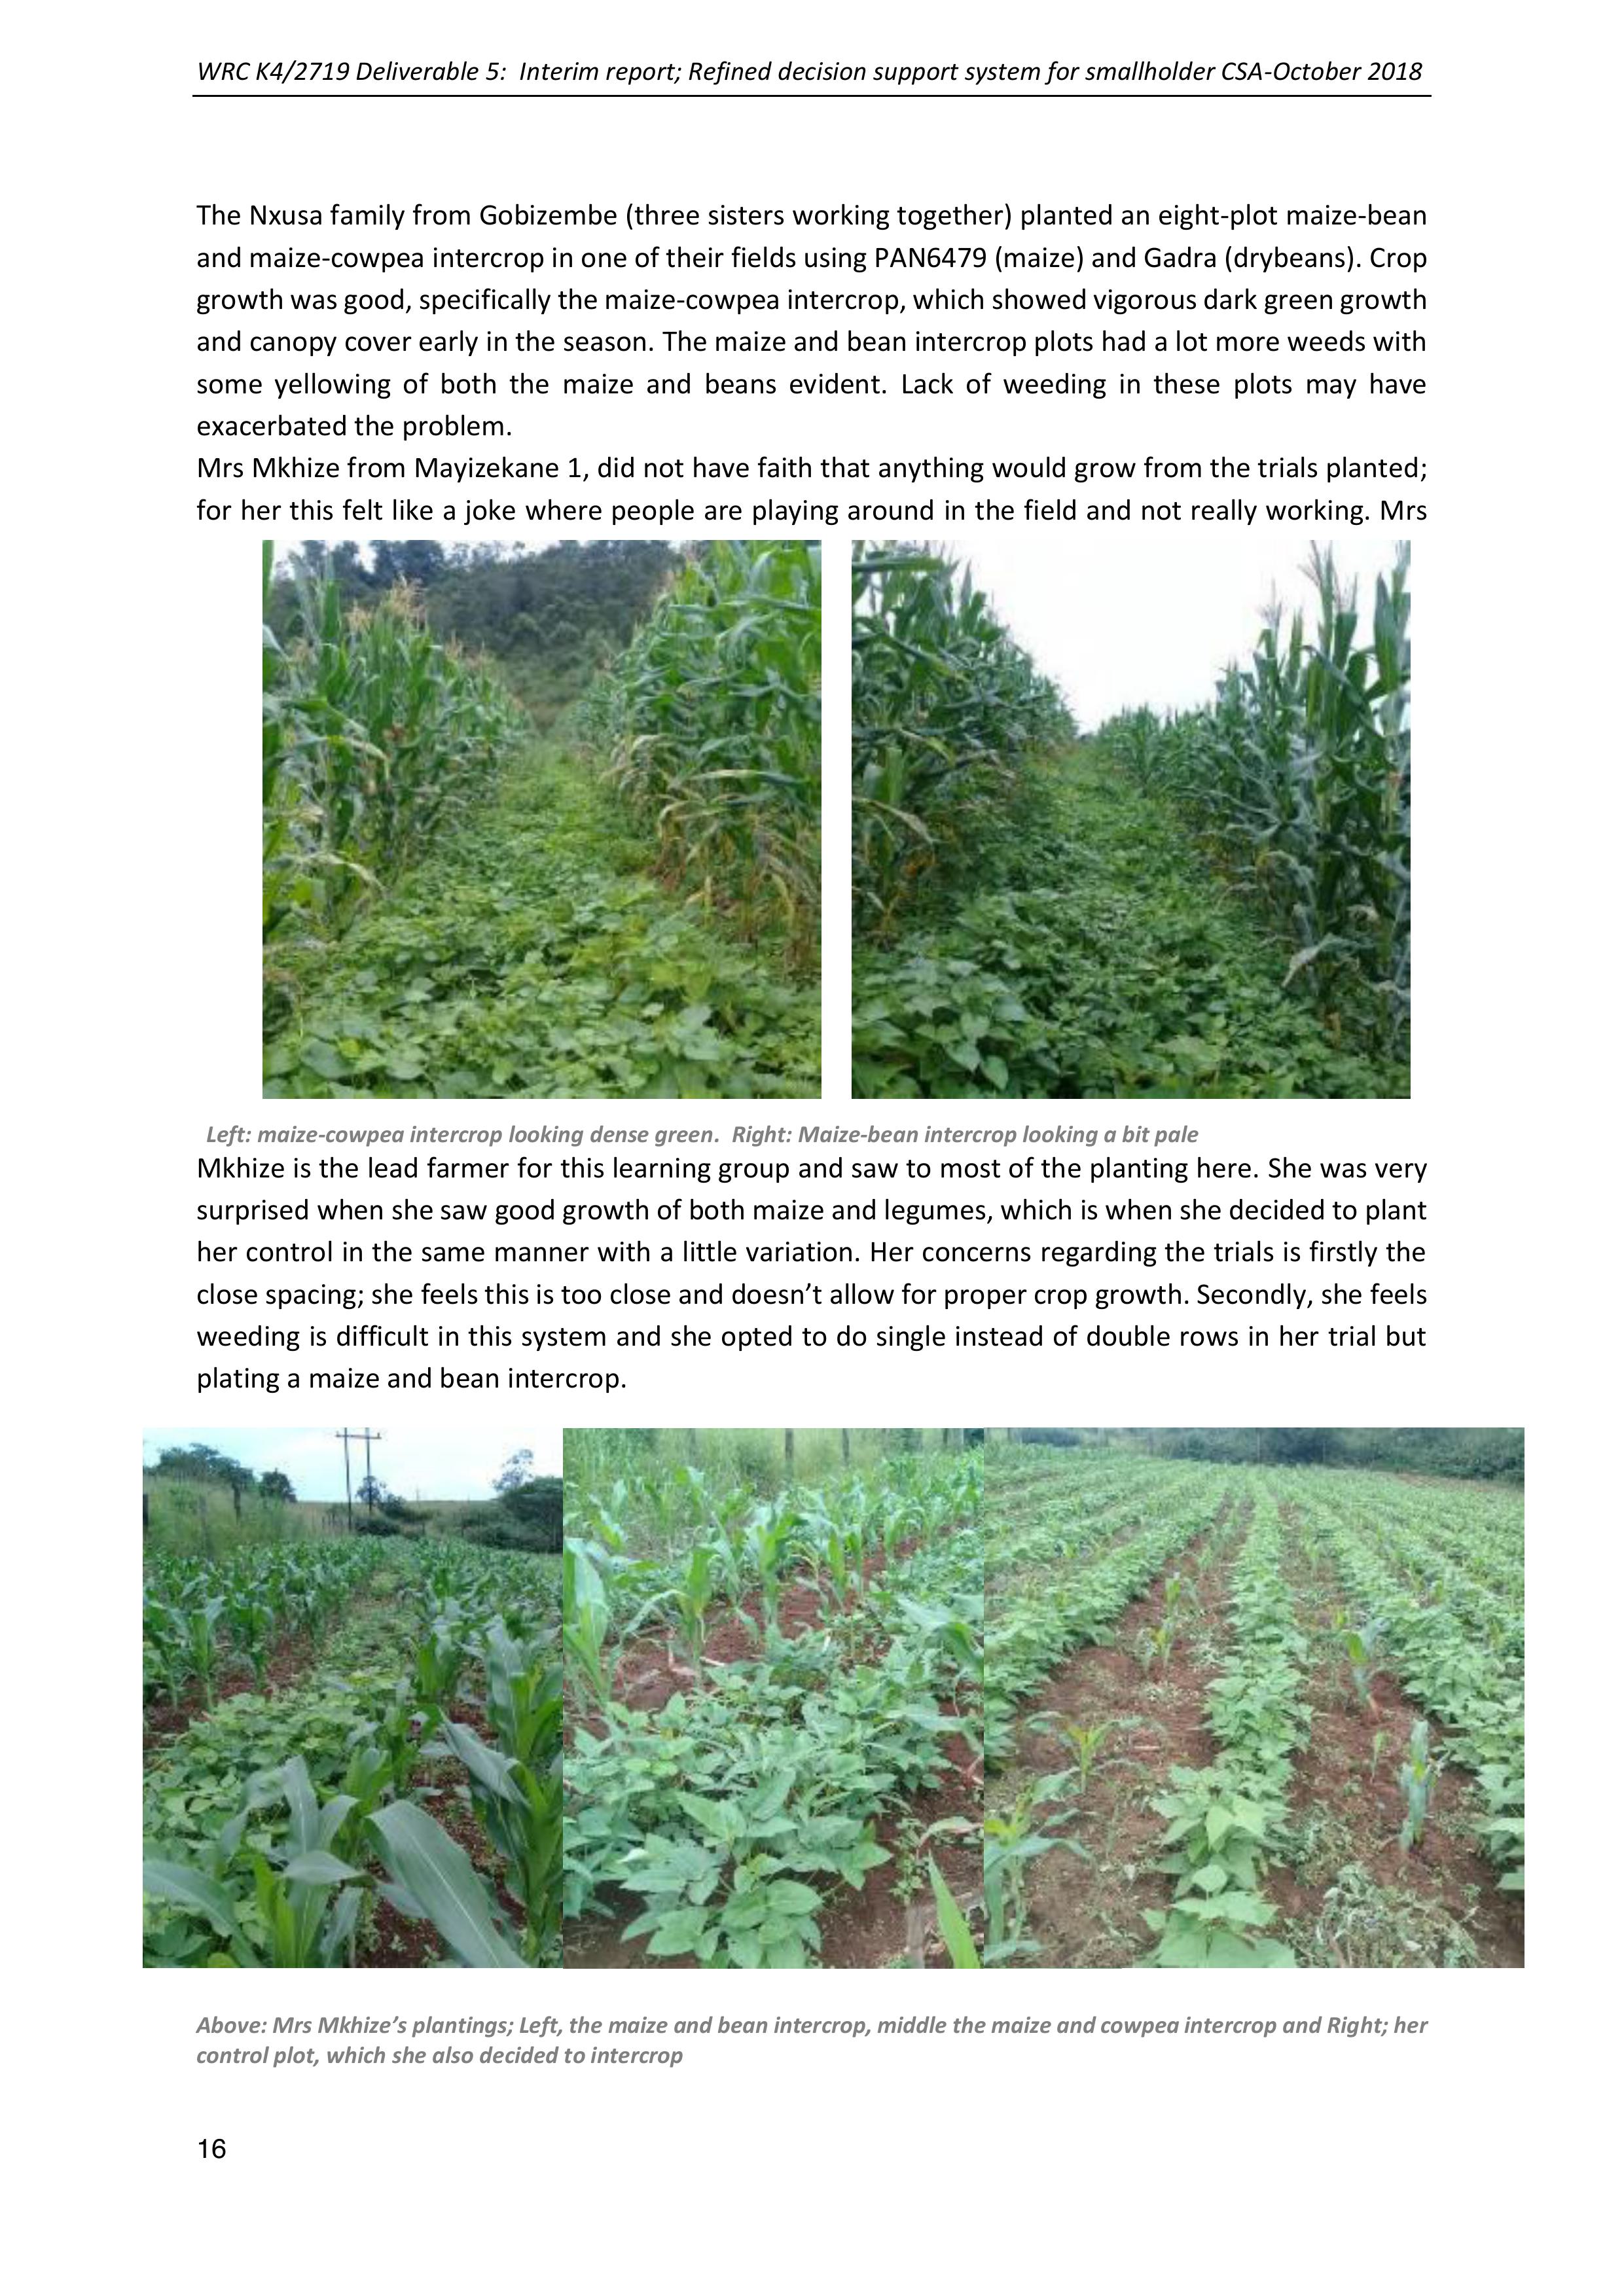
The Nxusa family from Gobizembe (three sisters working together) planted an eight-plot maize-bean
and maize-cowpea intercrop in one of their fields using PAN6479 (maize) and Gadra (drybeans). Crop
growth was good, specifically the maize-cowpea intercrop, which showed vigorous dark green growth
and canopy cover early in the season. The maize and bean intercrop plots had a lot more weeds with
some yellowing of both the maize and beans evident. Lack of weeding in these plots may have
exacerbated the problem.
Mrs Mkhize from Mayizekane 1, did not have faith that anything would grow from the trials planted;
for her this feltlike a joke where people are playing around inthe field and not reallyworking. Mrs
Mkhize is the lead farmer for this learning group and saw to most of the plantinghere. She was very
surprised when she saw good growth of both maize and legumes, which is when she decided to plant
her control in the same manner with a little variation. Her concerns regarding the trials is firstly the
close spacing; she feels this is too close and doesn’t allow for proper crop growth. Secondly, she feels
weeding is difficult in this system and she opted to do single instead of double rows in her trial but
plating a maize and bean intercrop.
Above: Mrs Mkhize’s plantings; Left, the maize and bean intercrop, middle the maize and cowpea intercrop and Right; her
control plot, which she also decided to intercrop
Left: maize-cowpea intercrop looking dense green. Right: Maize-bean intercrop looking a bit pale

WRC K4/2719 Deliverable 5: Interim report; Refined decision support system for smallholder CSA-October 2018
17
Dumazile Nxusa, wasone of 15 farmers who relay planted the cover crops
in between her maizeand the germination was around 85%. All the cover
crops germinated and grew well. These included Sunn- hemp, Saia oats,
fodder rye and fodder radish. The area planted is 1460 m2.
Right: Views of Mrs Nxusa’s cover crops in Swayimane
Observations during the growing season and group discussion and
learning sessions help the farmers to understandand analyse the
elements of the new practices in their farming system.
Yields were extremely variable and quite low. This is not unusual for
entrant participants. The range of maize yields for these participants was
between 0,5-7,2t/ha. The effects of CA on the soil and cropping system
are not yet visible or obvious after the first season. These yields are more
indicative of the basic conditions and management practices for each
farmer.
Table 6: Crops yields in CA trials in Swayimane; 2017-2018
Crop yields in CA trials; Swayimane 2017-2018
Ave maize yield (t/ha
Yield range for
maize
Ave bean yields
(t/ha)
Ave cowpea yields
(t/ha)
Gobizembe
1,6
0,5-7,2t/ha
0,2
0,2
Mayizekane 1
1,2
1
0,2
Mayizekane 2
1
0,4
0,7
Mayizekane 3
0,9
0,7
0,7
A review session with farmers was held to discuss progress with the CA trials and analyse observations
made by the farmers. These discussions are summarised in the table below
Table 7: Summarised points from the discussion of introduction of Conservation Agriculture in Swayimane
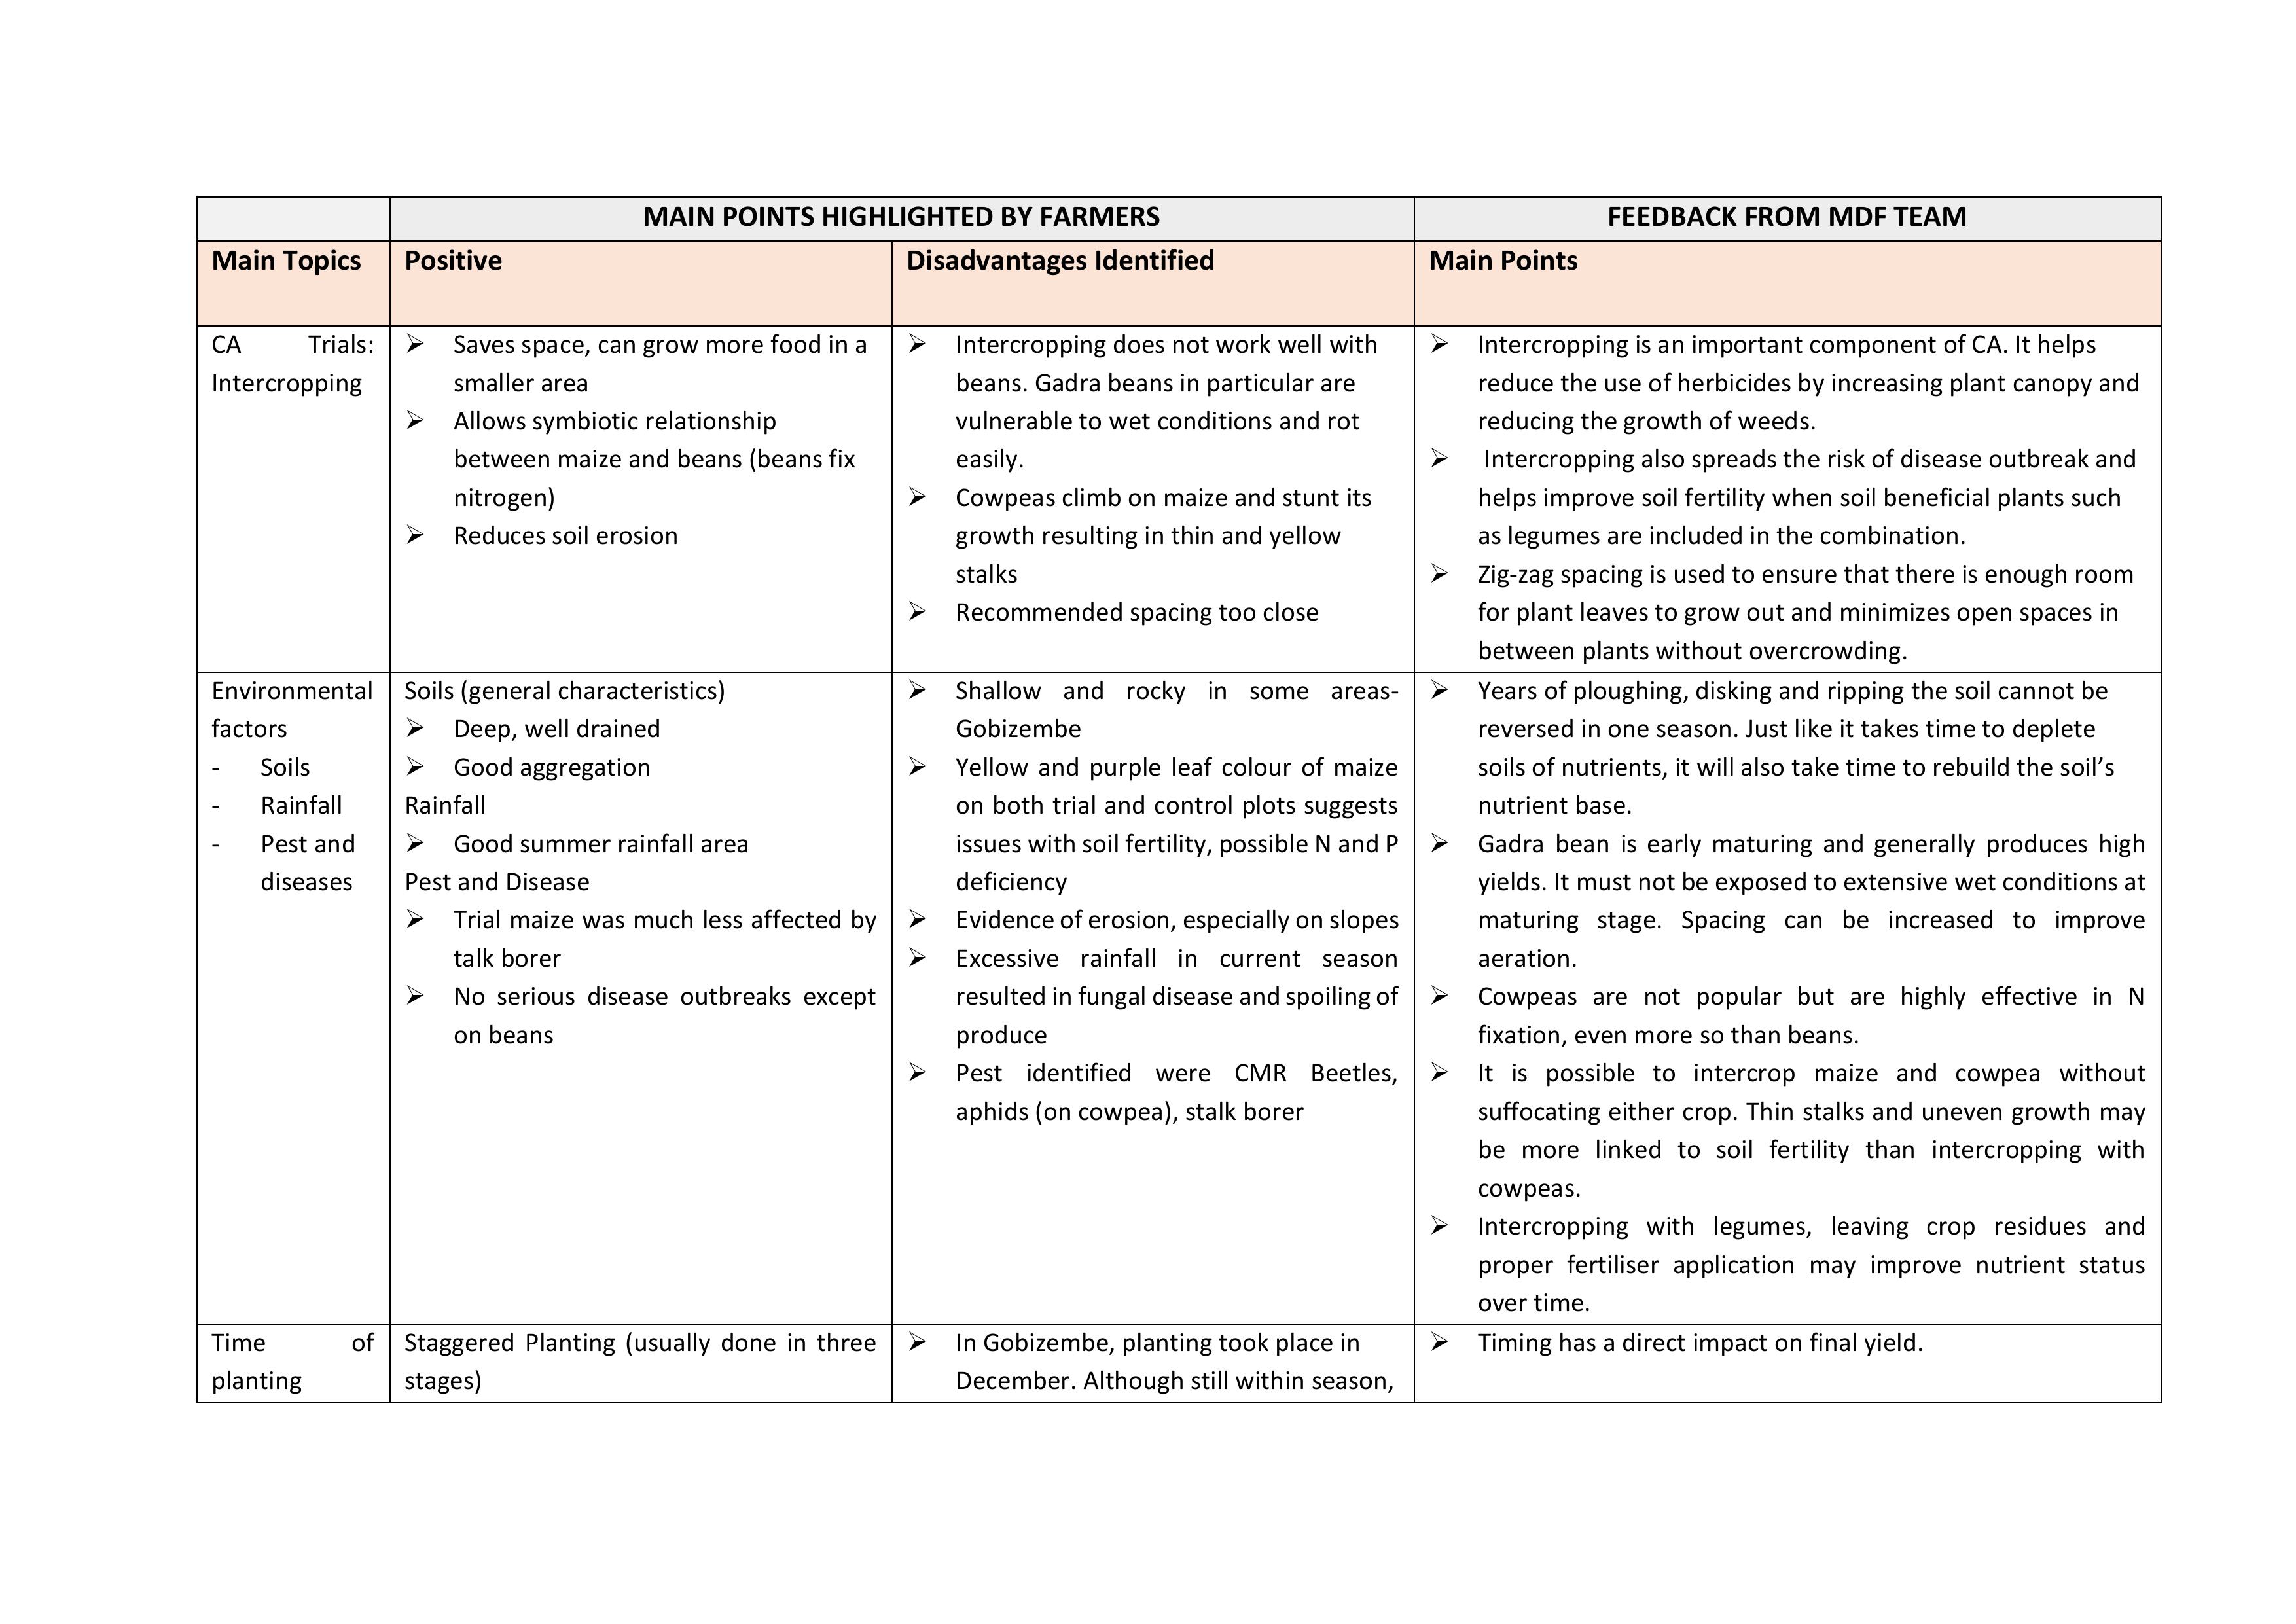
MAIN POINTS HIGHLIGHTED BY FARMERS
FEEDBACK FROM MDF TEAM
Main Topics
Positive
Disadvantages Identified
Main Points
CA Trials:
Intercropping
➢Saves space, can grow more food in a
smaller area
➢Allows symbiotic relationship
between maize and beans (beans fix
nitrogen)
➢Reduces soil erosion
➢Intercropping does not work well with
beans. Gadra beans in particular are
vulnerable to wet conditions and rot
easily.
➢Cowpeas climb on maize and stunt its
growth resulting in thin and yellow
stalks
➢Recommended spacing too close
➢Intercropping is an important component of CA. It helps
reduce the use of herbicides by increasing plant canopy and
reducing the growth of weeds.
➢ Intercropping also spreads the risk of disease outbreak and
helps improve soil fertility when soil beneficial plants such
as legumes are included in the combination.
➢Zig-zag spacing is used to ensure that there is enough room
for plant leaves to grow out and minimizes open spaces in
between plants without overcrowding.
Environmental
factors
-Soils
-Rainfall
-Pest and
diseases
Soils (general characteristics)
➢Deep, well drained
➢Good aggregation
Rainfall
➢Good summer rainfall area
Pest and Disease
➢Trial maize was much less affected by
talk borer
➢No serious disease outbreaks except
on beans
➢Shallow and rocky in some areas-
Gobizembe
➢Yellow and purple leaf colour of maize
on both trial and control plots suggests
issues with soil fertility, possible N and P
deficiency
➢Evidence of erosion, especially on slopes
➢Excessive rainfall in current season
resulted in fungal disease and spoiling of
produce
➢Pest identified were CMRBeetles,
aphids (on cowpea), stalk borer
➢Years of ploughing, disking and ripping the soil cannot be
reversed in one season. Just like it takes time to deplete
soils of nutrients, it will also take time to rebuild the soil’s
nutrient base.
➢Gadra bean is early maturing and generally produces high
yields. It must not be exposed to extensive wet conditions at
maturing stage. Spacing can be increased to improve
aeration.
➢Cowpeas are not popular but are highlyeffective in N
fixation, even more so than beans.
➢It is possible to intercrop maize and cowpea without
suffocating either crop. Thin stalks and uneven growth may
be more linked to soil fertility than intercropping with
cowpeas.
➢Intercropping with legumes, leaving crop residues and
proper fertiliser application may improve nutrient status
over time.
Time of
planting
Staggered Planting (usually done in three
stages)
➢In Gobizembe, planting took place in
December. Although still within season,
➢Timing has a direct impact on final yield.
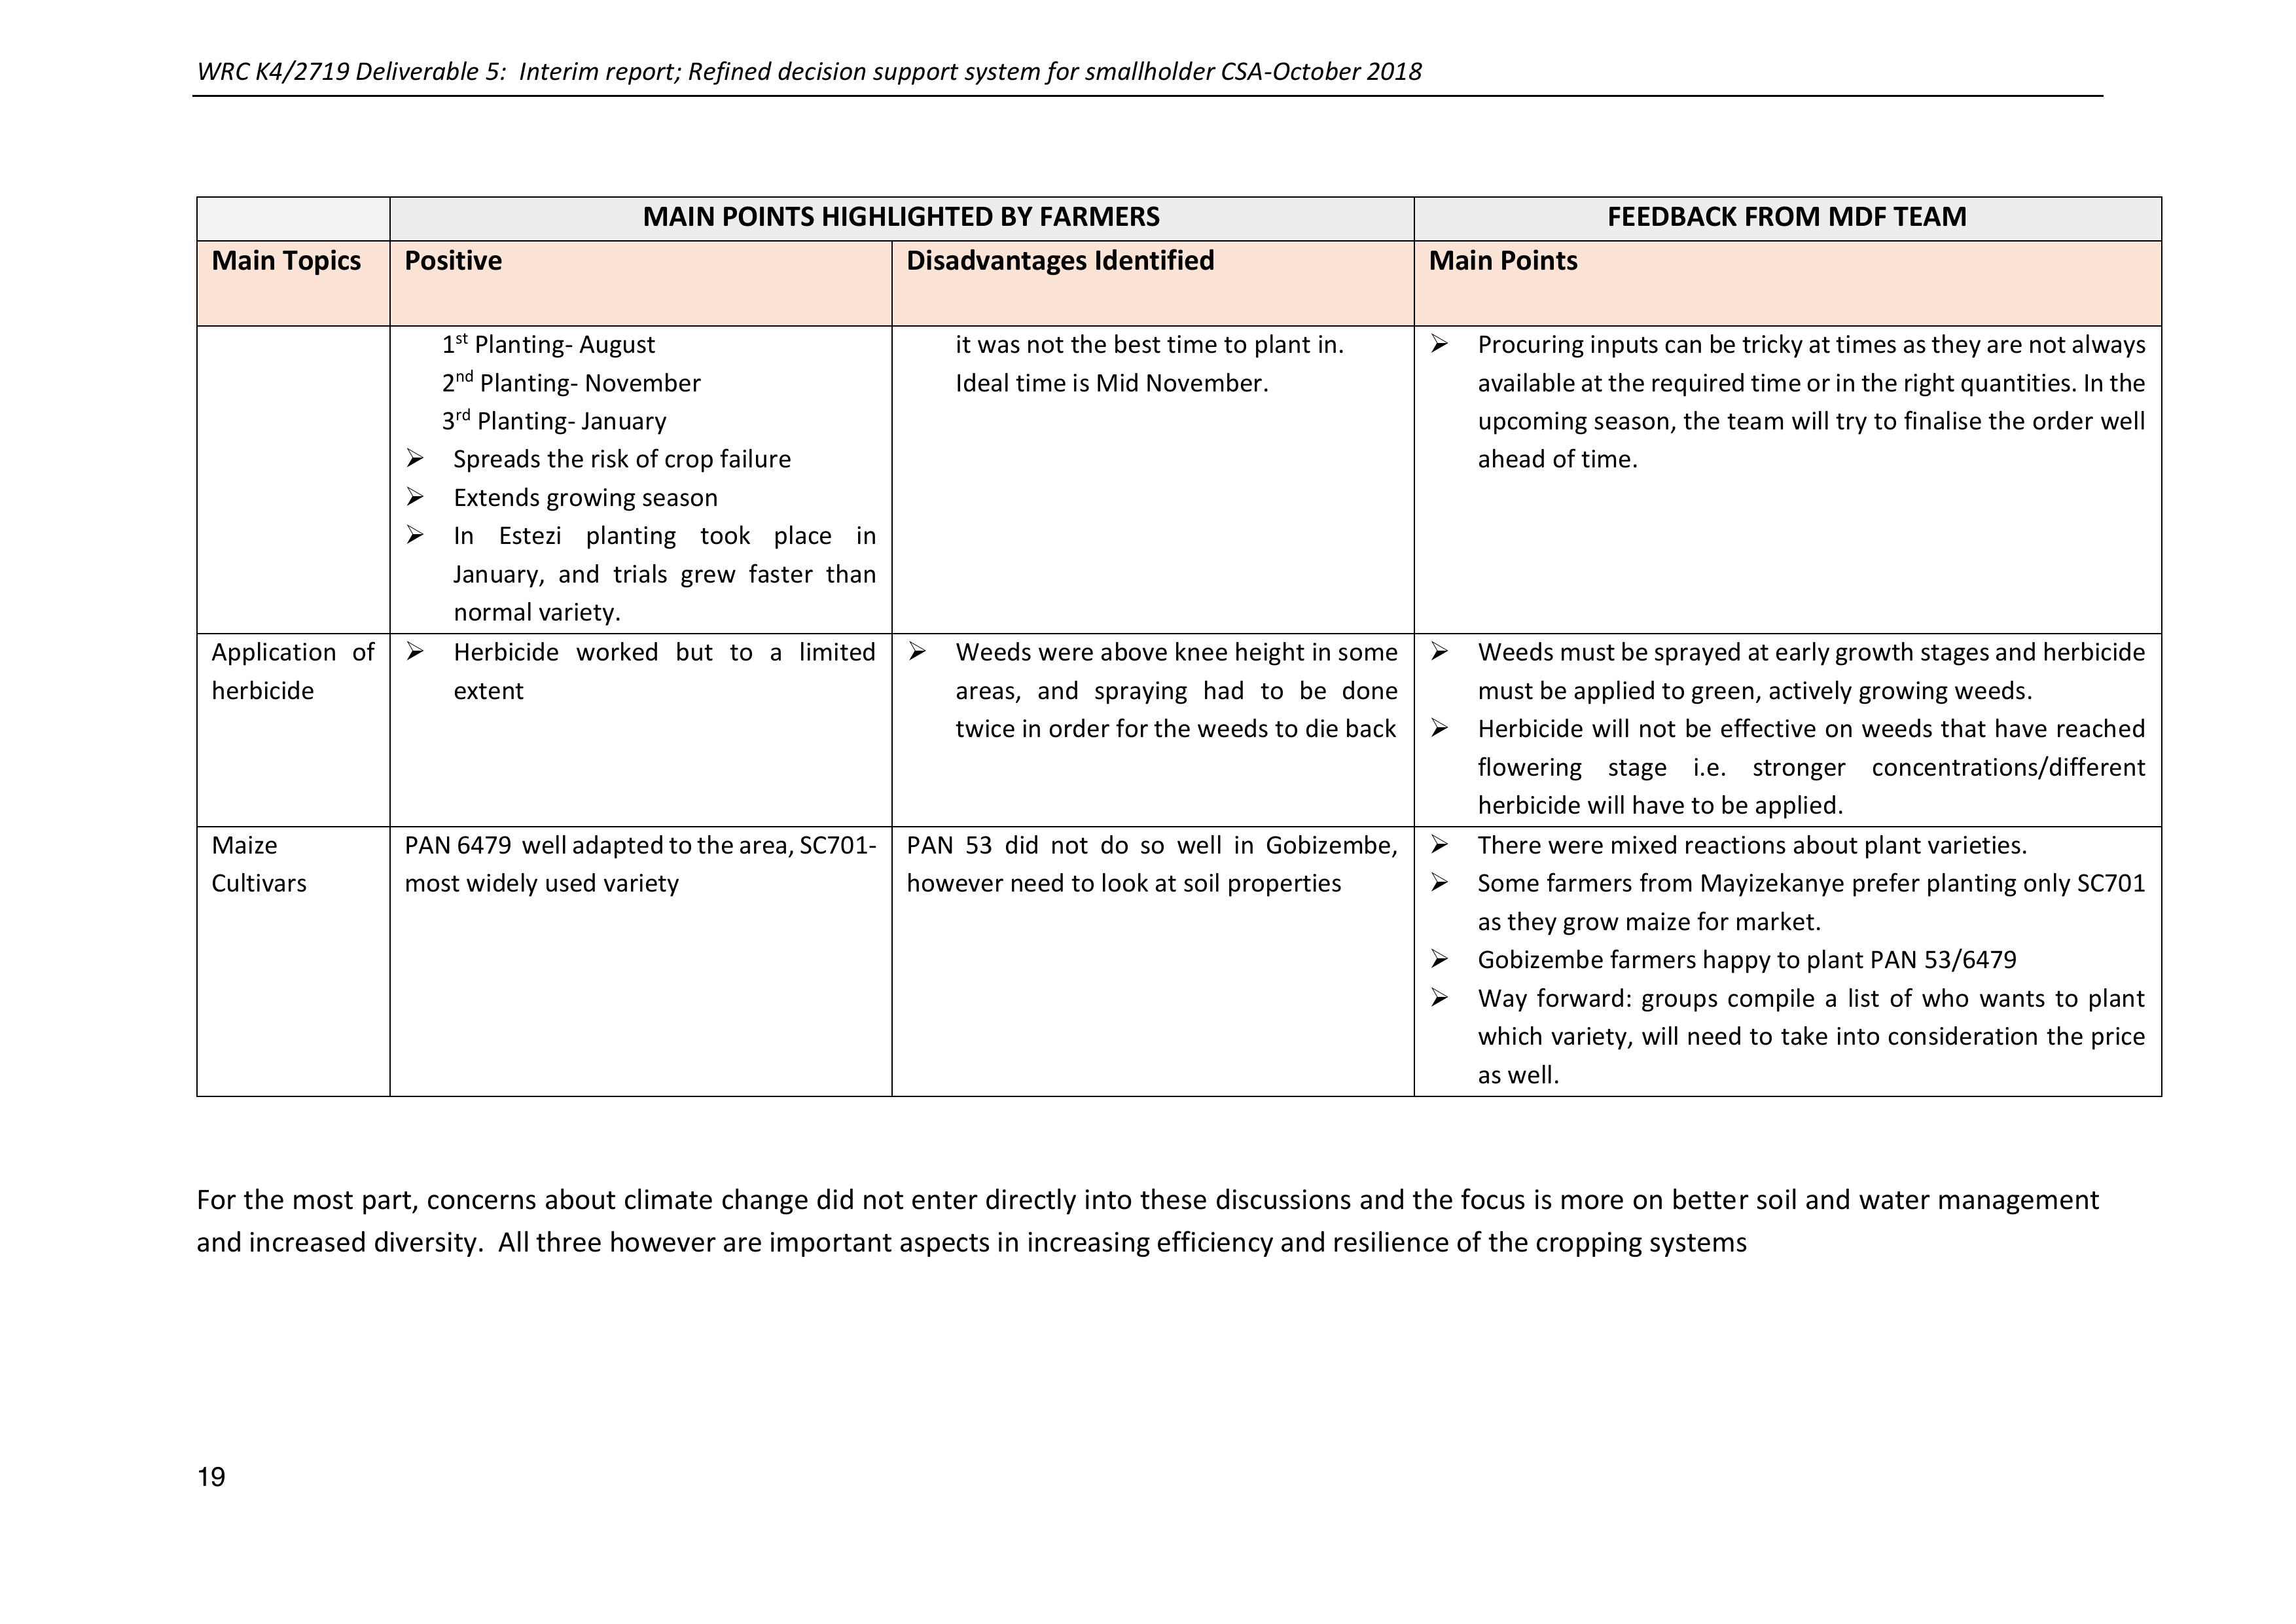
WRC K4/2719 Deliverable 5: Interim report; Refined decision support system for smallholder CSA-October 2018
19
MAIN POINTS HIGHLIGHTED BY FARMERS
FEEDBACK FROM MDF TEAM
Main Topics
Positive
Disadvantages Identified
Main Points
1st Planting- August
2nd Planting- November
3rd Planting- January
➢Spreads the risk of crop failure
➢Extends growing season
➢In Estezi planting took place in
January, and trials grew faster than
normal variety.
it was not the best time to plant in.
Ideal time is Mid November.
➢Procuring inputs can be tricky at times as they are not always
available at the required time or in the right quantities. In the
upcoming season, the team will try to finalise the order well
ahead of time.
Application of
herbicide
➢Herbicide worked but to a limited
extent
➢Weeds were above knee height in some
areas, and spraying hadto be done
twice in order for the weeds to die back
➢Weeds must be sprayed at early growth stages and herbicide
must be applied to green, actively growing weeds.
➢Herbicide will not be effective on weeds that have reached
flowering stage i.e. stronger concentrations/different
herbicide will have to be applied.
Maize
Cultivars
PAN 6479 well adapted to the area, SC701-
most widely used variety
PAN 53 did not do so well in Gobizembe,
however need to look at soil properties
➢There were mixed reactions about plant varieties.
➢Some farmers from Mayizekanye prefer planting only SC701
as they grow maize for market.
➢Gobizembe farmers happy to plant PAN53/6479
➢Way forward: groups compile a list of who wants to plant
which variety, will need to take into consideration the price
as well.
For the most part, concerns about climate change did not enter directly into these discussionsand the focus is more on better soil and water management
and increased diversity. All three however are important aspects in increasing efficiency and resilience of the cropping systems
WRC K4/2719 Deliverable 5: Interim report; Refined decision support system for smallholder CSA-October 2018
20
CoP in Swayimane
For theSwayimane groups good relationships have been built withthe DARD extension officers as well
as representatives from the UmswhathiLM and Umgungundlovu DM. In addition, role players from
UKZN and local NGOs have been involved. Through these relationships requests were made for
expansion of the CA programme into others areas in the LM. An introductory meeting was held in the
Appelbosch area- (between Wartburg and Tongaat). In addition, this process has fostered cooperation
with the UKZN, who is runninga research process onClimate Smart Agriculture through the Water
Research Commission –CA is one of the technologies they are demonstrating in their sites in KZN
(Swayimanye) and the Free State.
3NEW EMPHASIS: WATER ISSUES
Introduction
More andmore, it is becoming clear that it is not possible to discuss the issues of farming in a changing
climate without also tackling the issues of access to water and water availability. The assumption of
this research process has been to work with people to maximise the efficient use of available water.
It has however been emphasisedby the participants that the reduction of available water and the
greater pressure on existing water sources has already reduced their productive capacity substantially
in some cases.
Participants in four of the eight learning groups presently involved have taken it upon themselves to
engage with the water issues as a group. They have stressed that they now want to try and solve the
water issues for themselves and can no longer wait for the Government and Municipality to provide
this service for them. They have lost faith that these structures have their interest at heart.
As this is a significant step in social agency and in self determination of community people and active
learning group participants, a decision was taken to develop a process of support for these activities.
These learning groups have set upwater committees, whichthey have gained permission and support
for from their traditional authorities have come up with plans for their water provision schemes and
have collected some funds for implementation. They have asked for assistance in the design and
implementation of their plans and also in securing funders to support their activities.
Lobbying and advocacy for rural people and their desperate situation around water is also central to
this theme and here Participatory Video (PV) is being used as a tool. The PV process is described in
the next section of this report.
A methodology/process has been designedtoassist these groups inthe exploration and
implementation of their agricultural water provision plans.
-Workshop 1: Exploration of all water sources available to the community, a timeline of water
provision and issues in the community, and exploration of options/scenarios for intervention.
WRC K4/2719 Deliverable 5: Interim report; Refined decision support system for smallholder CSA-October 2018
21
This workshop was run in four villages; 2 in KZN (Ezibomvini and Eqeleni0 and2 in Limpopo
(Lepelle and Sedawa)
-Workshop 2: Screening of community video, report back on engineering suggestions,
prioritisation of scenarios (plans) and follow-up actions. This workshop was run in the two
Limpopo villages.
Water issues Workshop 1
KZN (Ezibomvini) (22 participants)
Wirtten by Samukhelisiwe Mkhize and Temakholo Mathebula
Ezibomvini Water issues discussion
1 Introduction
On the 31stJuly 2018 the MDF team (including Nonkanyiso, Phumzile, Samukelisiwe, Sandile and
Zanani) visited Ezibomvini village in Bergville to have an initial exploratory meeting around the issues
related to water availability and accessibilityin the community and explore possible solutions and
opportunities for collaborative action.
The meeting started with a brief recap of the previous meeting where participants discussed how the
changing climate over the pastfew years has increased the incidence of floods and its effects on the
shortage of available food due droughts. The participants also mentioned that, there is increasingly
less rainfallduring spring season and places that usually havewater have runout of water. Most of
the community members fetch water from muddy and dirty springs that are very far from most of
their homesteads. But, participants insisted that these springs are reliable water sources, at least they
offer reliable water supply unlike community taps installed by the government that have no water
supply for months at a time. One example is the “24/7 spring”thatsupplies water throughout the
year.
There are no community committees working to helpcommunity members to raise and solve some
of these issues. Individuals have gone to the counsellor to report these issues and request assistance.
But participants claim thatparty politics are the main cause of skewedaccess to water. One of the
community members Mam’ Mazibuko asserted that the councillor has favourites; he only helps those
individuals from a particular political party. Participants were encouraged to form a committee that
will represent them either at the municipality or amongst other relevant stakeholders in solving these
issues. It was important to also emphasis the issue of keeping political issues and memberships outside
of this committee in order to empower and represent all members of the committee members
equally.
1.2 Timeline of past and present issues
In 1994 after voting the municipality installed a water pipe system connected to a spring neighbouring
households in an effort to make water more accessible for household use. Efforts were undermined
by vandalism and theft of water pipes by youth andherdsmen who have been suspected of cutting
the pipes for their cattle to drink from.
One of the participants (Phumelele Hlongwane) added that, there are several springs available in the
community for community members to use. She recalls fetching water from the 24/7 spring since
1998.
WRC K4/2719 Deliverable 5: Interim report; Refined decision support system for smallholder CSA-October 2018
22
In 2000, the former community councillor Mr Mlotshwa also installed pipes connected to one of the
springs. For a short time, itseemed that life had changed after the pipes were installed. The elderly
were able to fetch water comfortably with 5 litre containers. But this didnot last long, the pipe was
found damaged and left leaking. Community members had a meeting about this conflict and
arguments rose amongst the members. The issue remained unresolved till today.
Currently the community does not have access to clean water. A meeting was requested with the
councillor Mr Musa Hadebe. The meeting did not take place. Instead, he sent a driver to deliver water
to the community at R300 for 2500 litres. To simply put it, no money means no water.
Some community members have small watercatchmentsystems, harvesting rainwater usingJoJo
tanks and drip irrigation systems. But, harvested water does not lastvery long andruns out during the
lengthy dry period.
From the discussion participants proposed two possible solutions: a) Use of machines to check if there
iswater down (water table) in their surroundings to drill boreholes and b) Use of TLB to install a big
pipe from the spring close toone of the homesteads so that they can put small pipes to their
homesteads.
2. Description of all water sources
On the 7th August 2018 a more in- depth workshop was held around the water issue.
The participants had agreed to form a committee (after the 1st meeting in July), to help them
address some of the issues affecting water provision and assistance with water issues in the
village. The primary idea behind this is that organizing themselves around this issue will give
community members a better chance of negotiating and bargaining with other stakeholders
as well as a way forward in developing a community of practice amongst the relevant
stakeholders. The realisation is that communities have been establishing their own strategies
to deal with the issue of lack of water access, but there is still a dearth in technical support
(viable innovations) and commitment at community level. The suggestion to elect a
committee will also help address political issues surrounding water access as there are a lot
of politics involved in the distribution of water. Participants have begun speaking to
community members about this idea and gaining support for this initiative.
The session began with each participant introducing themselves and giving a brief description of their
water sources and N explanation of the location of these sources (see Table 6 and Pictures below).

WRC K4/2719 Deliverable 5: Interim report; Refined decision support system for smallholder CSA-October 2018
23
Above left: The map of water sources drawn by the workshop participants and Above right: discussion of the sources
Table 8: Description of all water sources, as used by each participant in the workshop
Participant
Type of water
source(s)
Description and
location of water
source
Number of
households
Issues
Suggestions and
comments
Mabhengu
Dlamini , Zodwa
Zikode,
Phumelele
Hlongwane,
Cabangani
Hlongwane
Manyola
Zimba, Baba
Mazibuko
-Water Pipe (1)
-Spring One (24/7
spring)
-Damaged and dripping
water pipe
-24/7 water supply
-available across all seasons
-Spring is quite far from
homesteads
-Water used for all
household needs
-Previously
installed water
system
provided water
for 11
households
- Water pipes are
cut by community
members (2007)
and has not been
maintained since
-Spring not fenced
-Water is muddy
and dirty and
shared with
livestock
-To install a tank
system that would
connect a pipe to
the spring to
households.
-Dig deep trenches
when inserting
pipes underground
Madlala Zikode
-Water tap
Collects water from
a tap in her relatives
homestead, the tap
gets water from a
spring
`-Located in relatives
homestead
-Water tap connected
-Water used for all
household needs
-Two
households
-None mentioned
-No new
suggestions
Nonhlanhla
Zikode
-Water pipe
Same water pipe as
Mabhengu Dlamini
Madondo
KaDubazane
-Spring Two
-Spring is toofar from
homestead
-24/7 Water supply
-Muddy and dirty water
-Water used for all
household needs
?
-Shares water
with livestock -
Has to wake up
early to get
cleaner water
-To install a tank
system that would
connect a pipe to
the spring to
households
Macele Dlamini
-Water pipe
- Spring three
-Damaged and dripping
water pipe
-Has a broken tap
that no longer
works in her
homestead
-The tap needs
maintenance
-Has a tank that
needs to be
repaired
-The participant
asserts that there is
underground water,
they just need to
install a system

WRC K4/2719 Deliverable 5: Interim report; Refined decision support system for smallholder CSA-October 2018
24
3. Spring Visits
The team and participants agreed on seeing the two springs and other water sources such as the
leaking pipe. These springsdo not have any pipes supplying water to households and there are no
issues related to ownership of this spring. According to the map which is drawn by participants which
shows water sources in the community there are 5 springs and 2 tanks. The pictures below are
illustrations of the water sources and characteristics of each source.
Right: Spring one – More
than 10 households use
this spring for all
household needs
Participants prefer
to collect water in
the morning before
cattle invade the
water source. Water
is perennially
available but due to
increasing demand
for water from both
human and
livestock, water
levels have
decreased.
Right: Spring two- 11
households get water
form this spring, for
household use as well as
watering vegetable
gardens
WRC K4/2719 Deliverable 5: Interim report; Refined decision support system for smallholder CSA-October 2018
25
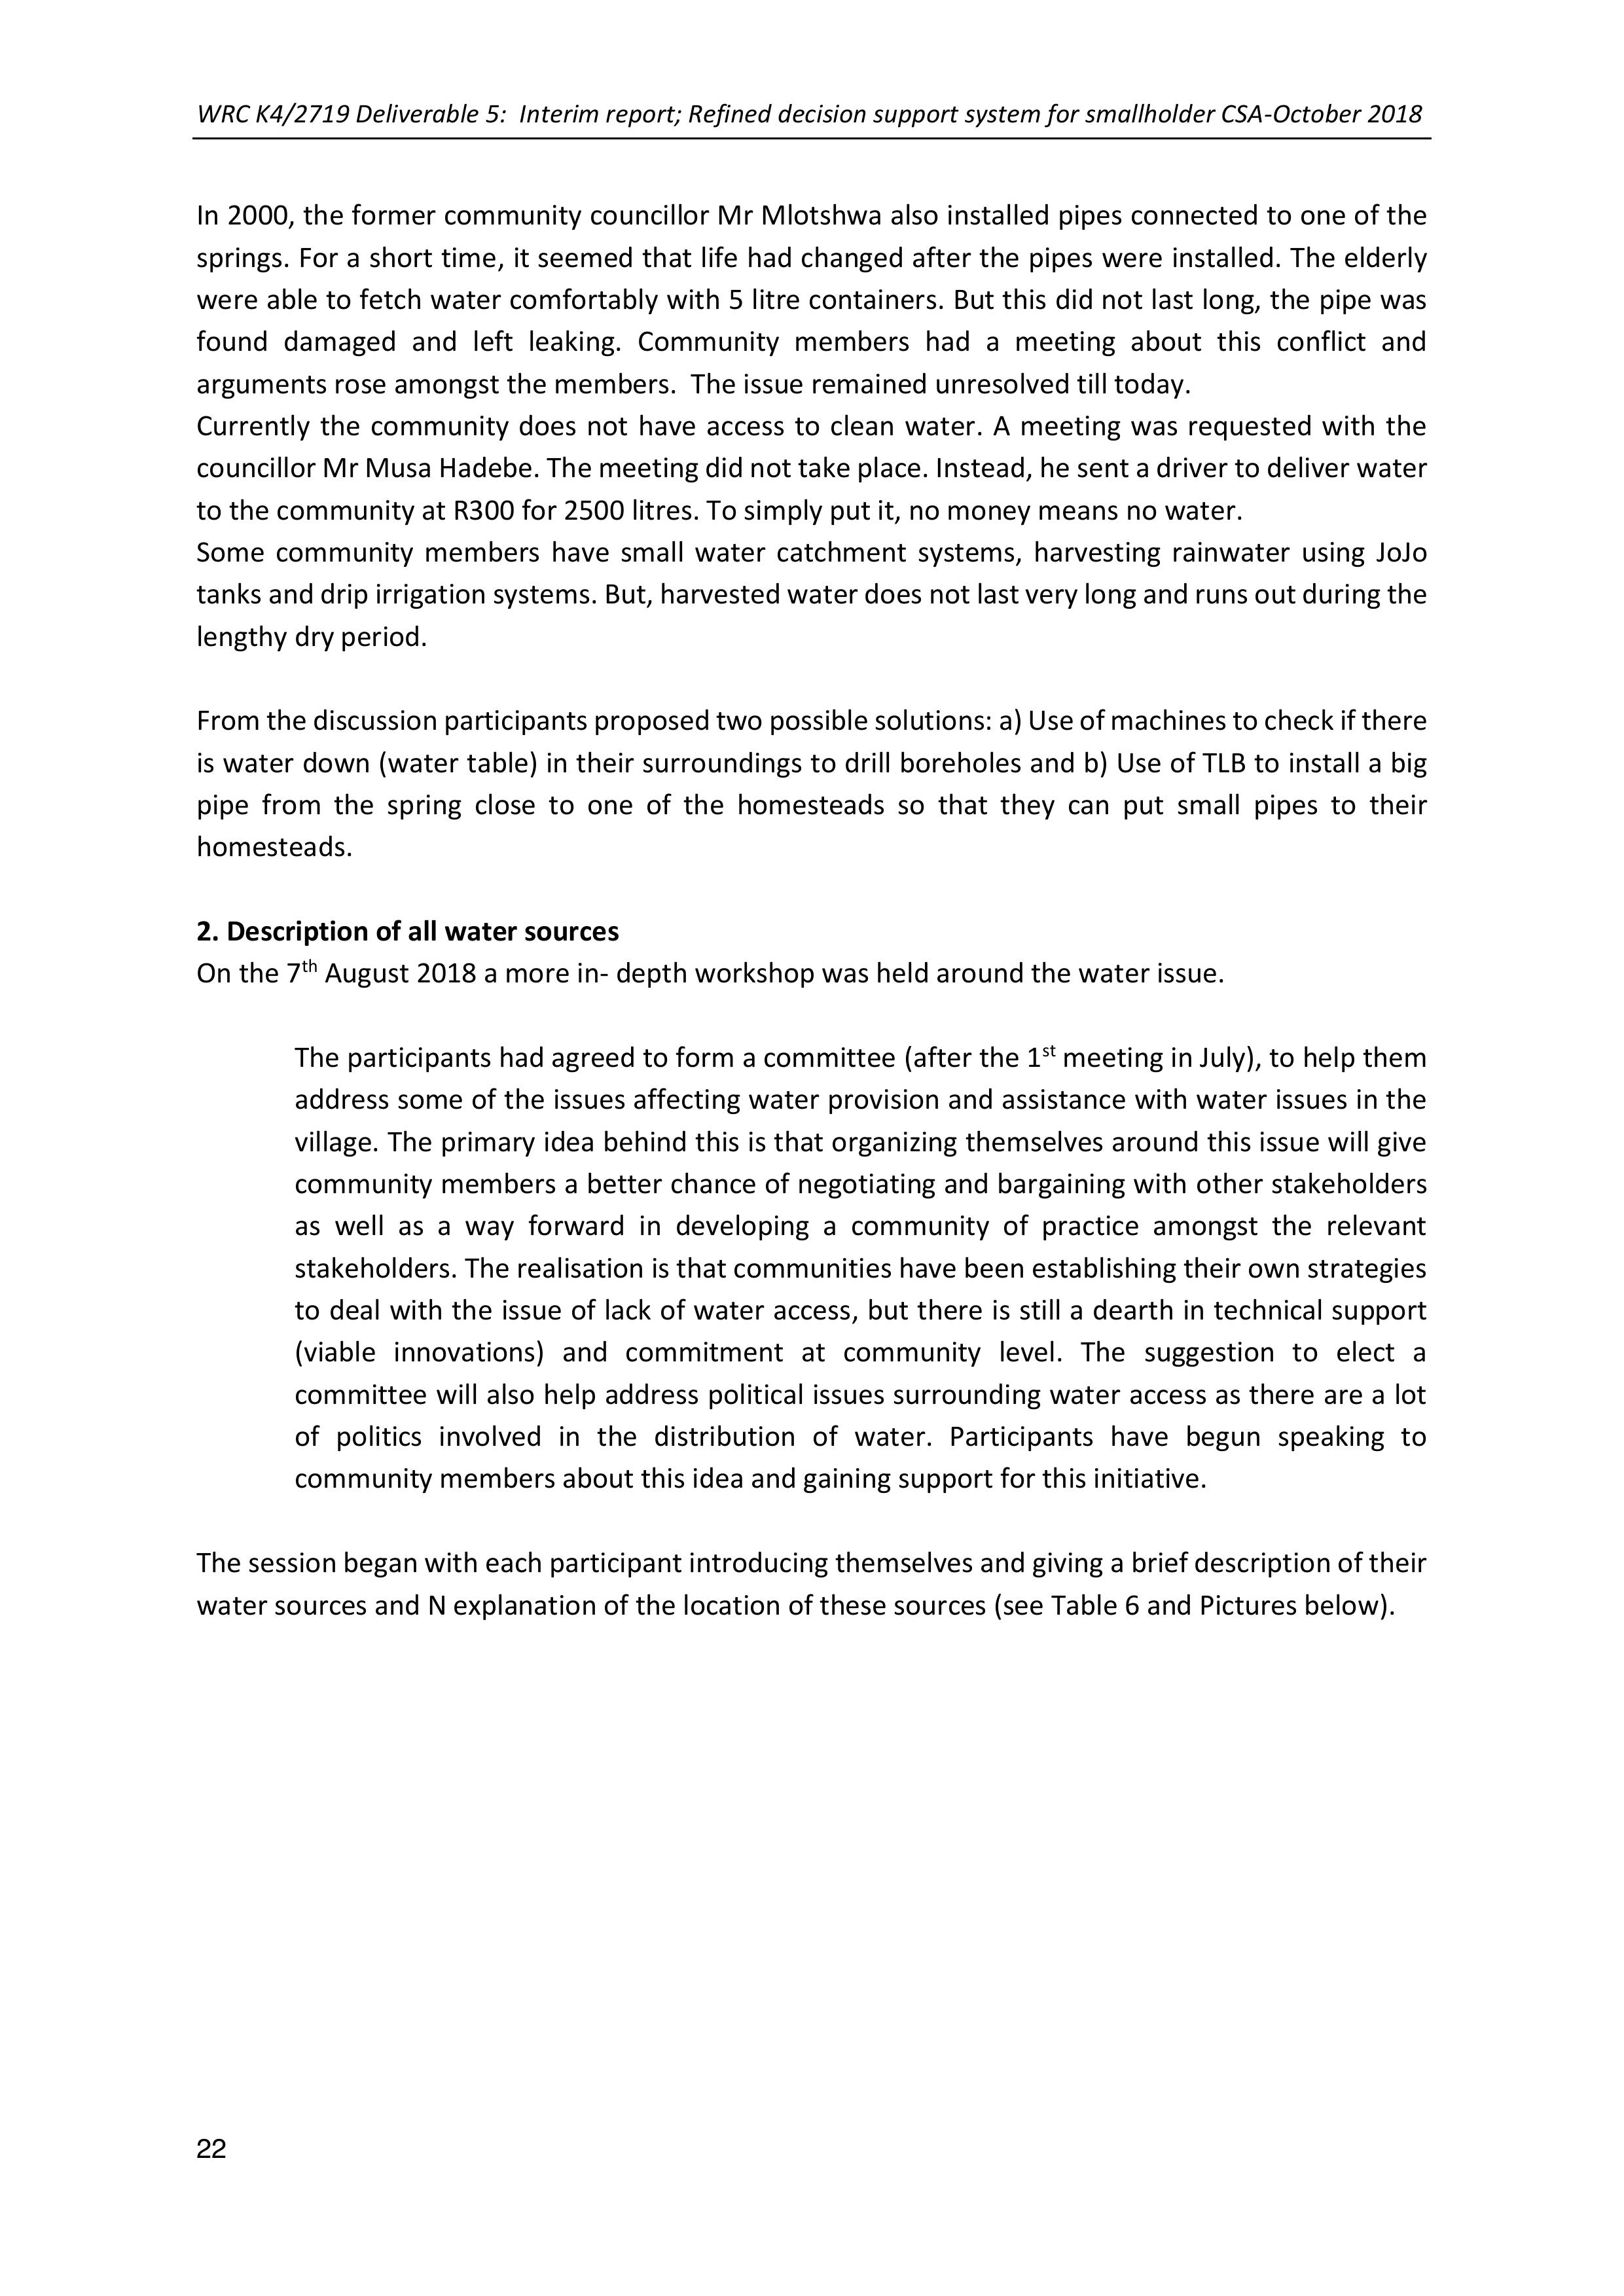
Right: An example of a
leaking pipe from the piped
systems that are no longer
working.
Far right; Spring Three is
used by more than 10
households for household
activities and irrigating of
gardens.
Due to the lack of
access and availability
of water MaCele along
with her community
members decided to
dig this ‘spring’ to
address this issue in
2015.
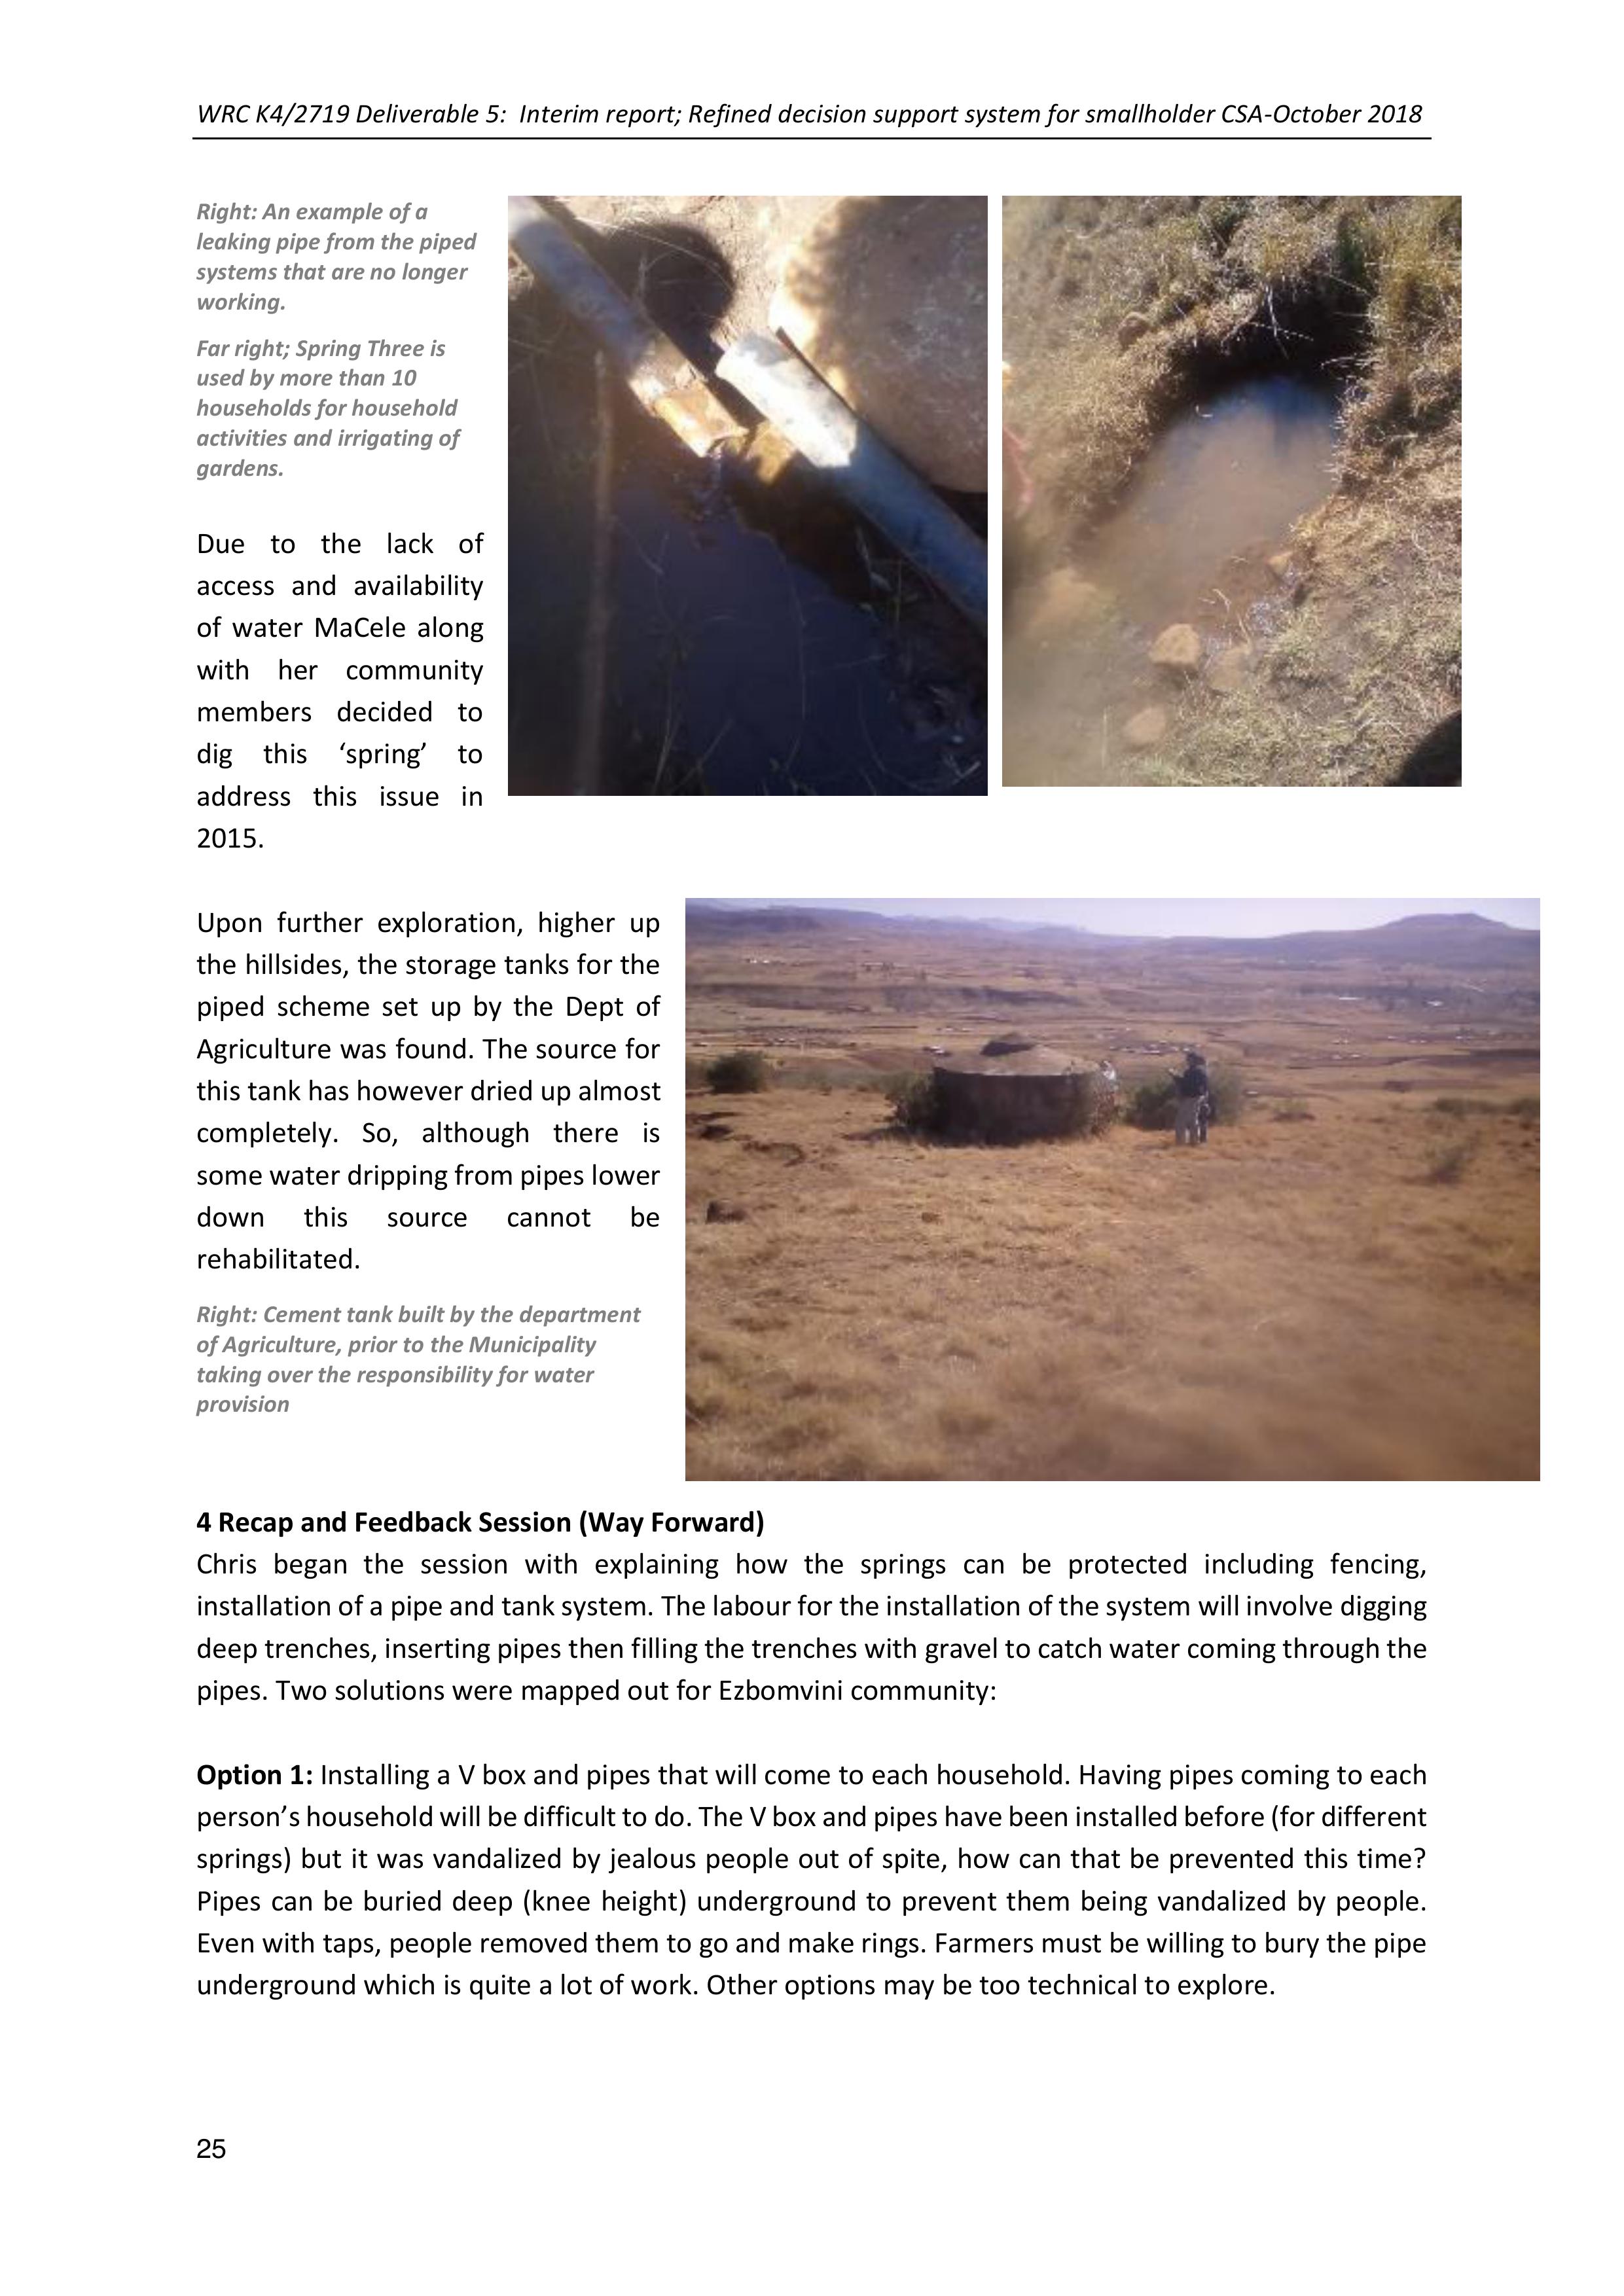
Upon further exploration, higher up
the hillsides, the storage tanks for the
piped scheme set up by the Dept of
Agriculture was found. The source for
this tank has however dried up almost
completely. So, although there is
some water dripping from pipes lower
down this source cannot be
rehabilitated.
Right: Cement tank built by the department
of Agriculture, prior to the Municipality
taking over the responsibility for water
provision
4 Recap and Feedback Session (Way Forward)
Chris began the session with explaininghow the springs can be protected including fencing,
installation of a pipe and tank system. The labour for the installation of the system will involve digging
deep trenches, inserting pipes then filling the trenches with gravel to catch water coming through the
pipes. Two solutions were mapped out for Ezbomvini community:
Option 1: Installing a V box and pipes that will come to each household. Having pipes coming to each
person’s household will be difficult to do. The V box and pipes have been installed before (for different
springs) but it was vandalized by jealous people out of spite, how can that be prevented this time?
Pipes canbe buried deep (kneeheight) underground to prevent them being vandalized by people.
Even with taps, people removed them to go and make rings. Farmers must be willing to bury the pipe
underground which is quite a lot of work. Other options may be too technical to explore.
WRC K4/2719 Deliverable 5: Interim report; Refined decision support system for smallholder CSA-October 2018
26
Option 2: (more feasible) to make a furrow below the spring and install a slotted pipe with cement on
either side to secure it, that way the spring will not be disturbed and people will get water. Gravel will
be placed below and above the slotted pipe and then sand added on top to help purify the water. A
JoJo tank will then be installed below the spring and will be filled up by water from the spring. The
pipes will feed from the JoJo tank into each household. A JoJo tank is not the safest option, it might
get vandalized if it is near the spring. It can either be secured/fenced or the JoJo can be at someone’s
house. Farmers must be willing toput money together to purchase a pipe and a JoJo tank which will
be placed at someone’s house. The springs are not bubbling, therefore if a JoJo tank is installed it will
take a while for it to be filled up by the spring. Therefore, people will need to manage the water use
and take turns in watering their gardens, collecting water for household use etc. In terms of money,
quotations will need to be collected from suppliers and thereafter the group will calculate individual
contributions. It is risky to decide on the amount contributed without first knowing the costs as
chances are the estimations will be below the actual costs.
Other Organisations that have worked with Ezibomvini Community
Stakeholder engagement: farmers have been promised assistance many times regarding the water
issue. Philakahle was the first organisation to assist andthey asked each farmer to contribute R 100.00
towards purchasing pipes, and then disappeared. When the farmers followed up on it, it turned out
two staff members had resigned from Philakahle and the organisation would no longer assist them.
Lima had also undertaken to intervene; but only through their loan issuing programme where the
farmers would have to pay it back.
The opinion supporting the solution was that the JoJo tank can be kept at one of the households
(Phumelele Hlongwane’s homestead). Two systems would haveto be constructed one for the 10
people from Mam’ Hlongwanes side and another for 2 people from Mam’ Gumede but they still need
to discuss these options with other community members.
5. Follow-up actions
1.Chris can assist with pipe specifications and site measurements and other support related to
infrastructure but group must decide where the Jo-Jo tank will go and how many people will
benefit from it before the work begins. Number of people in Maka Ndoza’s spring: 10.
2.MDF will give feedback on the assessment made today and how the Jo-Jo can be installed.
3.Zodwa Zikode’s group to meet and discuss the water issue and proposed project and bring
feedback from the people. (Their water sources are below the community close to the river,
rather and thus different to the two springs above the village on the hill side).
4.Follow up meeting to discuss about and prepare for implementation.
KZN (Eqeleni) (28 participants)
Written by Samukhelisiwe Mkhize andTtemakholo Mathebula
1. Introduction
On 1st August 2018 the first introductory meeting to explore water issues and possible solutions was
held in Eqeleni
2. Timeline of past and present issues

WRC K4/2719 Deliverable 5: Interim report; Refined decision support system for smallholder CSA-October 2018
27
According to participants the main water sources include 5 springs that have been providing water to
households for more than 50 years. Water pipes were not installed until late councillor (Baba’Mzo)
started to install the pipes and used engines to pump the water to the taps. The source is a borehole
at the bottom of the community next to the Emmaus hospital. Even here the taps and pipes were
supplied by the community and not the Municipality.
Mr Ndlovu who passed away had alsopromised to purify the waterfrom the river and installpipes
and taps for households to use. In 2002 community membersbought taps and pipesto this water
system. But due to Mr Ndlovu’s death and subsequent confusion, nothing was done and the pipies
and taps can no longer be located.
The municipality has provided a ‘‘water vehicle’’ that transports and delivers dirty water that can only
be used for washing and irrigating. They also added that there is favouritism in terms of the
distribution of water where community members who belong to certainpolitical organizations have
greater access than others.
The participants are notsatisfied with servicedelivery. Currently there are maintenance problems
with the pump and there has been no water inthe taps for more than 5 months.. According to the
participants their current councillor Mbuso Hadebe and municipality workers are not helpful.
Some participants have JoJo tanks to collect rainwater, but not everyone has a tank to do this.
From the discussionthe participants
agreed that installing water taps and
pipes close to their homesteads would
be most beneficialoption. There is a
borehole close to one of the springs but
it’s quite far from their households.
Maybe the pipes could be connected to
that spring then drawswater into tanks
close to their homesteads. Lastly,
participants agreed on establishing a
committee and meet with the MDF
team including Erna and Chris on the 8th
August; for a more in-depth
exploration
Right: the water issues workshop participants
in Eqeleni
3. Description and explanation of participants water sources
The participants use springs as their main water sources because tap water supply is inconsistent and
unreliable. There are a total of 5 springs and 1 borehole used by participants:
Spring 1 (Zikode spring)
Spring 2 (Sbasha Spring)
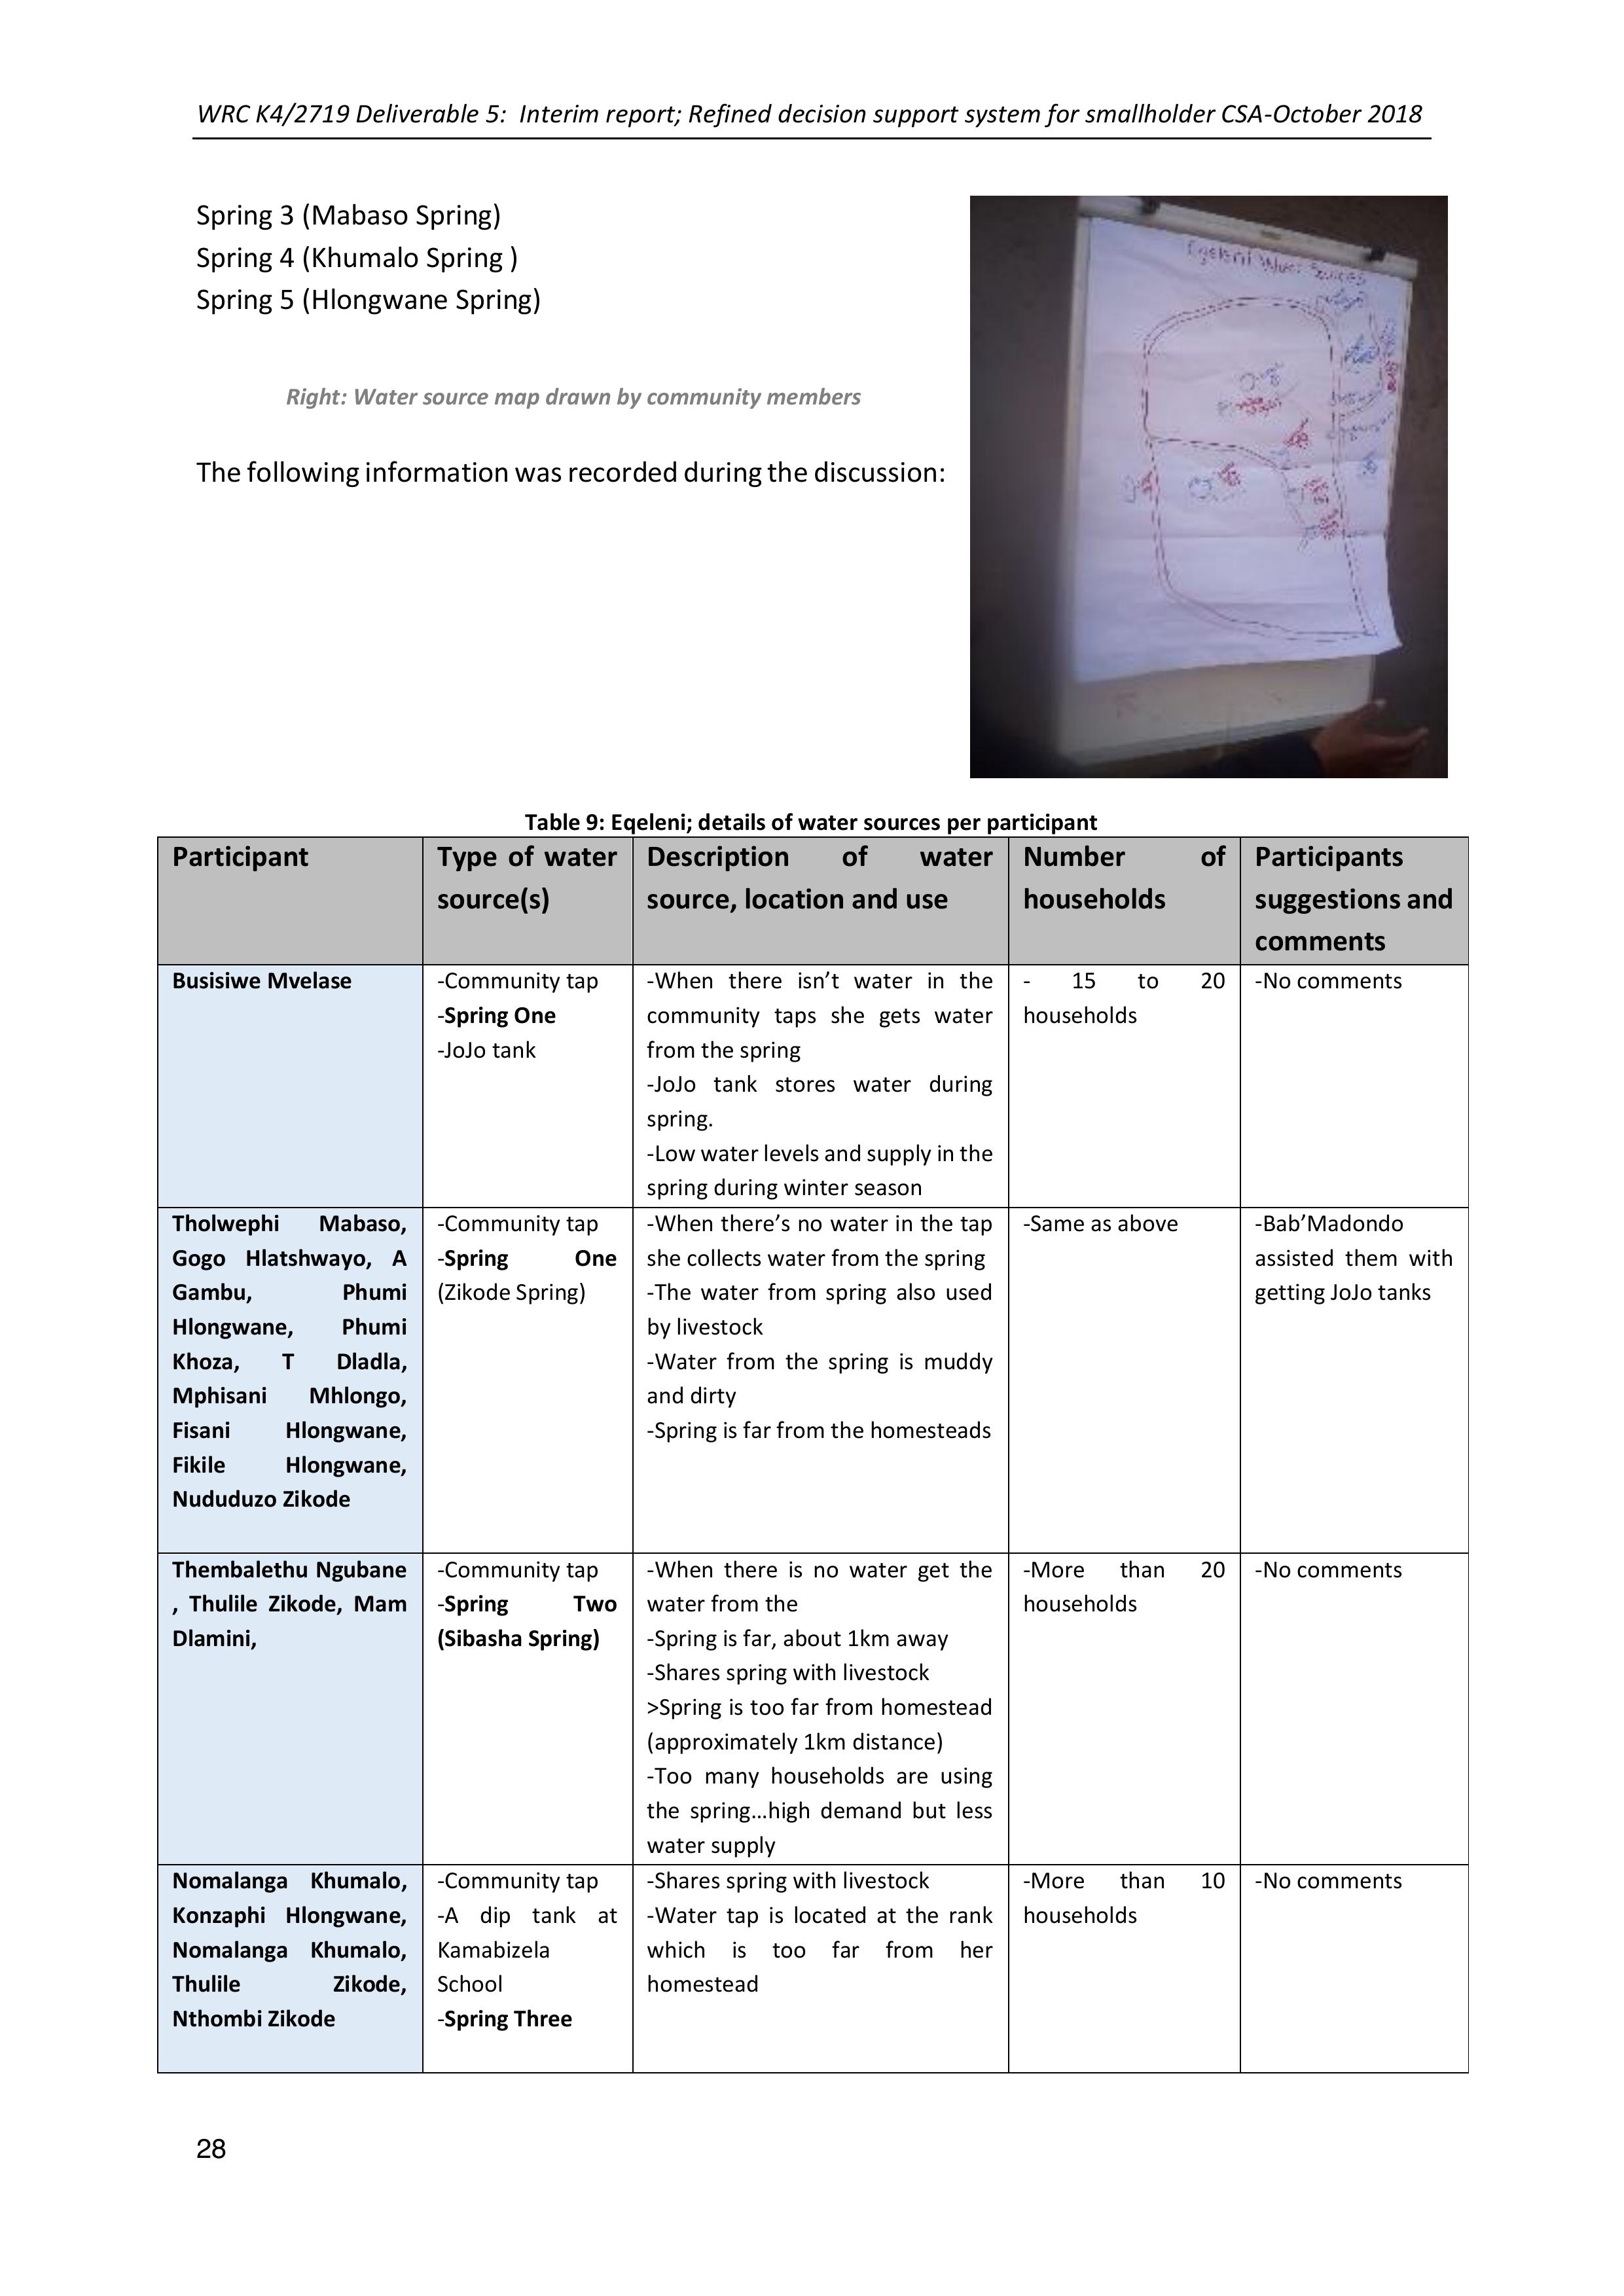
WRC K4/2719 Deliverable 5: Interim report; Refined decision support system for smallholder CSA-October 2018
28
Spring 3 (Mabaso Spring)
Spring 4 (Khumalo Spring )
Spring 5 (Hlongwane Spring)
Right: Water source map drawn by community members
The following information was recorded during the discussion:
Table 9: Eqeleni; details of water sources per participant
Participant
Type of water
source(s)
Description of water
source, location and use
Number of
households
Participants
suggestions and
comments
Busisiwe Mvelase
-Community tap
-Spring One
-JoJo tank
-When there isn’t water inthe
community taps she gets water
from the spring
-JoJo tank stores water during
spring.
-Low water levels and supply in the
spring during winter season
- 15 to 20
households
-No comments
Tholwephi Mabaso,
Gogo Hlatshwayo, A
Gambu, Phumi
Hlongwane, Phumi
Khoza, T Dladla,
Mphisani Mhlongo,
Fisani Hlongwane,
Fikile Hlongwane,
Nududuzo Zikode
-Community tap
-Spring One
(Zikode Spring)
-When there’s no water in the tap
she collects water from the spring
-The water from spring also used
by livestock
-Water from the spring is muddy
and dirty
-Spring is far from the homesteads
-Same as above
-Bab’Madondo
assisted them with
getting JoJo tanks
Thembalethu Ngubane
, Thulile Zikode, Mam
Dlamini,
-Community tap
-Spring Two
(Sibasha Spring)
-When there is no water get the
water from the
-Spring is far, about 1km away
-Shares spring with livestock
>Spring is too far from homestead
(approximately 1km distance)
-Too many households are using
the spring…high demand but less
water supply
-More than 20
households
-No comments
Nomalanga Khumalo,
Konzaphi Hlongwane,
Nomalanga Khumalo,
Thulile Zikode,
Nthombi Zikode
-Community tap
-A dip tank at
Kamabizela
School
-Spring Three
-Shares spring with livestock
-Water tap is located at the rank
which is too far from her
homestead
-More than 10
households
-No comments
WRC K4/2719 Deliverable 5: Interim report; Refined decision support system for smallholder CSA-October 2018
29
Gogo Khumalo
-Community
water taps
-Spring Four
-Taps close to homestead but
unreliable
-Spring Water used for all
household needs
-More than 10
households
-No comments
Zakahle Hlongwane ,
Lunilge Ngubane
-Spring Five
(Hlongwane
Spring)
-Muddy and dirty water
-Far from homestead
->More than 10
households
-No comments
There are also 4 boreholes in the community with handpumps attached where people can collect
water. These boreholes are generally quite far from peoples’ homesteads and some participants find
turning the handpumps very difficult
Figure 1: Left; the graph indicates the percentage of participants using each of the 5 springs mentioned. And Right: The
graph indicates the percentage of participants who have access to the different water provision options in the villages
(springs, community taps and boreholes)
3. Spring Visits
Spring one (Zikode spring) and two (Sbashaspring) were visited and
one of the boreholes was also passed along the way. These springs
are sited well below the homesteads.
Right: Mr Madondo showing the team one of the boreholes used by
participants
SPRING
ONLY
17%
COMMUNIT
Y TAP ONLY
8%
COMMUNIT
Y TAP &
SPRING
33%
COMMUNITY TAP &
SPRING & JOJO
13%
COMMUNITY TAP &
SPRING & BOREHOLE
8%
COMMUNIT
Y TAP &
BOREHOLE
21%
Variations of water sources
amongst participants Eqeleni
SPRING
ONE
42%
SPRING
TWO
21%
SPRING
THREE
4%
SPRING
FOUR
4%
SPRNG
FIVE
8%
OTHER
WATER
SOURCES
21%
Percentage of participants
use of springs

WRC K4/2719 Deliverable 5: Interim report; Refined decision support system for smallholder CSA-October 2018
30
Below left and right: Spring one (Zikode spring), used by around 15-20
households
Right: Spring two (Sbahsa spring),
used by at least 10 households in
the community
4. Recap and Feedback
Session (Way Forward)
There are two main issues; the
one being that water will need
to be pumped up from the
springs if it is reticulated, and
the other that water will still
need to be accessedby
livestock
Pumping:
While in the field Chris suggested that a water pump ‘‘money maker pump” can be installed in one of
the springs (Spring Two). It’s designed and manufacturedbyan NGO in Kenya funded inthe US. It costs
about R3000 to R3500.
Livestock
Participants could dig and install a water trough to allow livestock to access water as well while
providing reliable water supply to community members. Another option is a mobile solar pump.
Option 1:
Protect one of the springs and pump water to a header tank (13 m head) and reticulate from there
with pipes to the homeateads. This would need a pump and also a solution at the springs for cattle to
drink
Option 2:
Drill a borehole, with apump and headertankwith pipes to homesteads. People liked this ideaas they
find boreholes in the are to be more reliable than the springs.
During the discussion Mr Madondo reminded the participants that there is no sponsor supporting this
project, therefore, participants would have to make some contributions to support the project. This
initiative will require old and young women to work together to solve these water issues. But one of
WRC K4/2719 Deliverable 5: Interim report; Refined decision support system for smallholder CSA-October 2018
31
the participants asserted that it’s time that the young women and wives assist with the present water
issues in thecommunity; they have to make the financial contributions to make this project a success.
5. Follow up actions
1.Community members need to addthe locations of present boreholes on the map and make
suggestions as to where they think a borehole can be sited
2.MDF will provide feedback on costing of the spring protection and cattle watering trough.
3.Further exploration of the other 3 springs will still need to be done.
Limpopo (Sedawa) (27 participants)
1. Agenda
For local initiatives, municipal water supply and local sources e.g. rivers, and spring explore the
following:
1.Define the sources, what they are, where, how they are manged, who has access
1.2.What is working (enablers)
2.Challenges/barriers the communities are facing with the systems
3.Who are the role players, what aretheirresponsibilities (gov,civil society and local structures)
4.Community led action, ideas and the way forward.
5.What do you think PV can do to assist with awareness raising and lobbying
After the focus group discussion, divide the group into three smaller groups to focus on water
(summary of main points from the discussion), map (theplan)and time line.Then presentations,
which will be documented/filmed with the key statements 3/4 people.
2. Participatory Video
The participatory video concept was introduced to the group. This is a story for them to tell and control
and alsotoshow whomever they choose- theirlearning group, other groups from the locality, their
larger community, their structures such as traditional authorities, Municipality Department of Water
Affairs and the general public.
They have the right to decide what is in the videoand what isnot andwhat should be covered. The
idea is to learn about their struggles and their successes and then other people can learn from them.
They will give consent and we will not share this footage with anyone prior to such consent being
given.
Participants were given a chance to handle the video cameras and footage was shot be the facilitation
team to summarise the content and learning in the focus group discussion. After editing the video will
be first shown to the learning group and further edited by them before decisions are made about
whom else to involve.
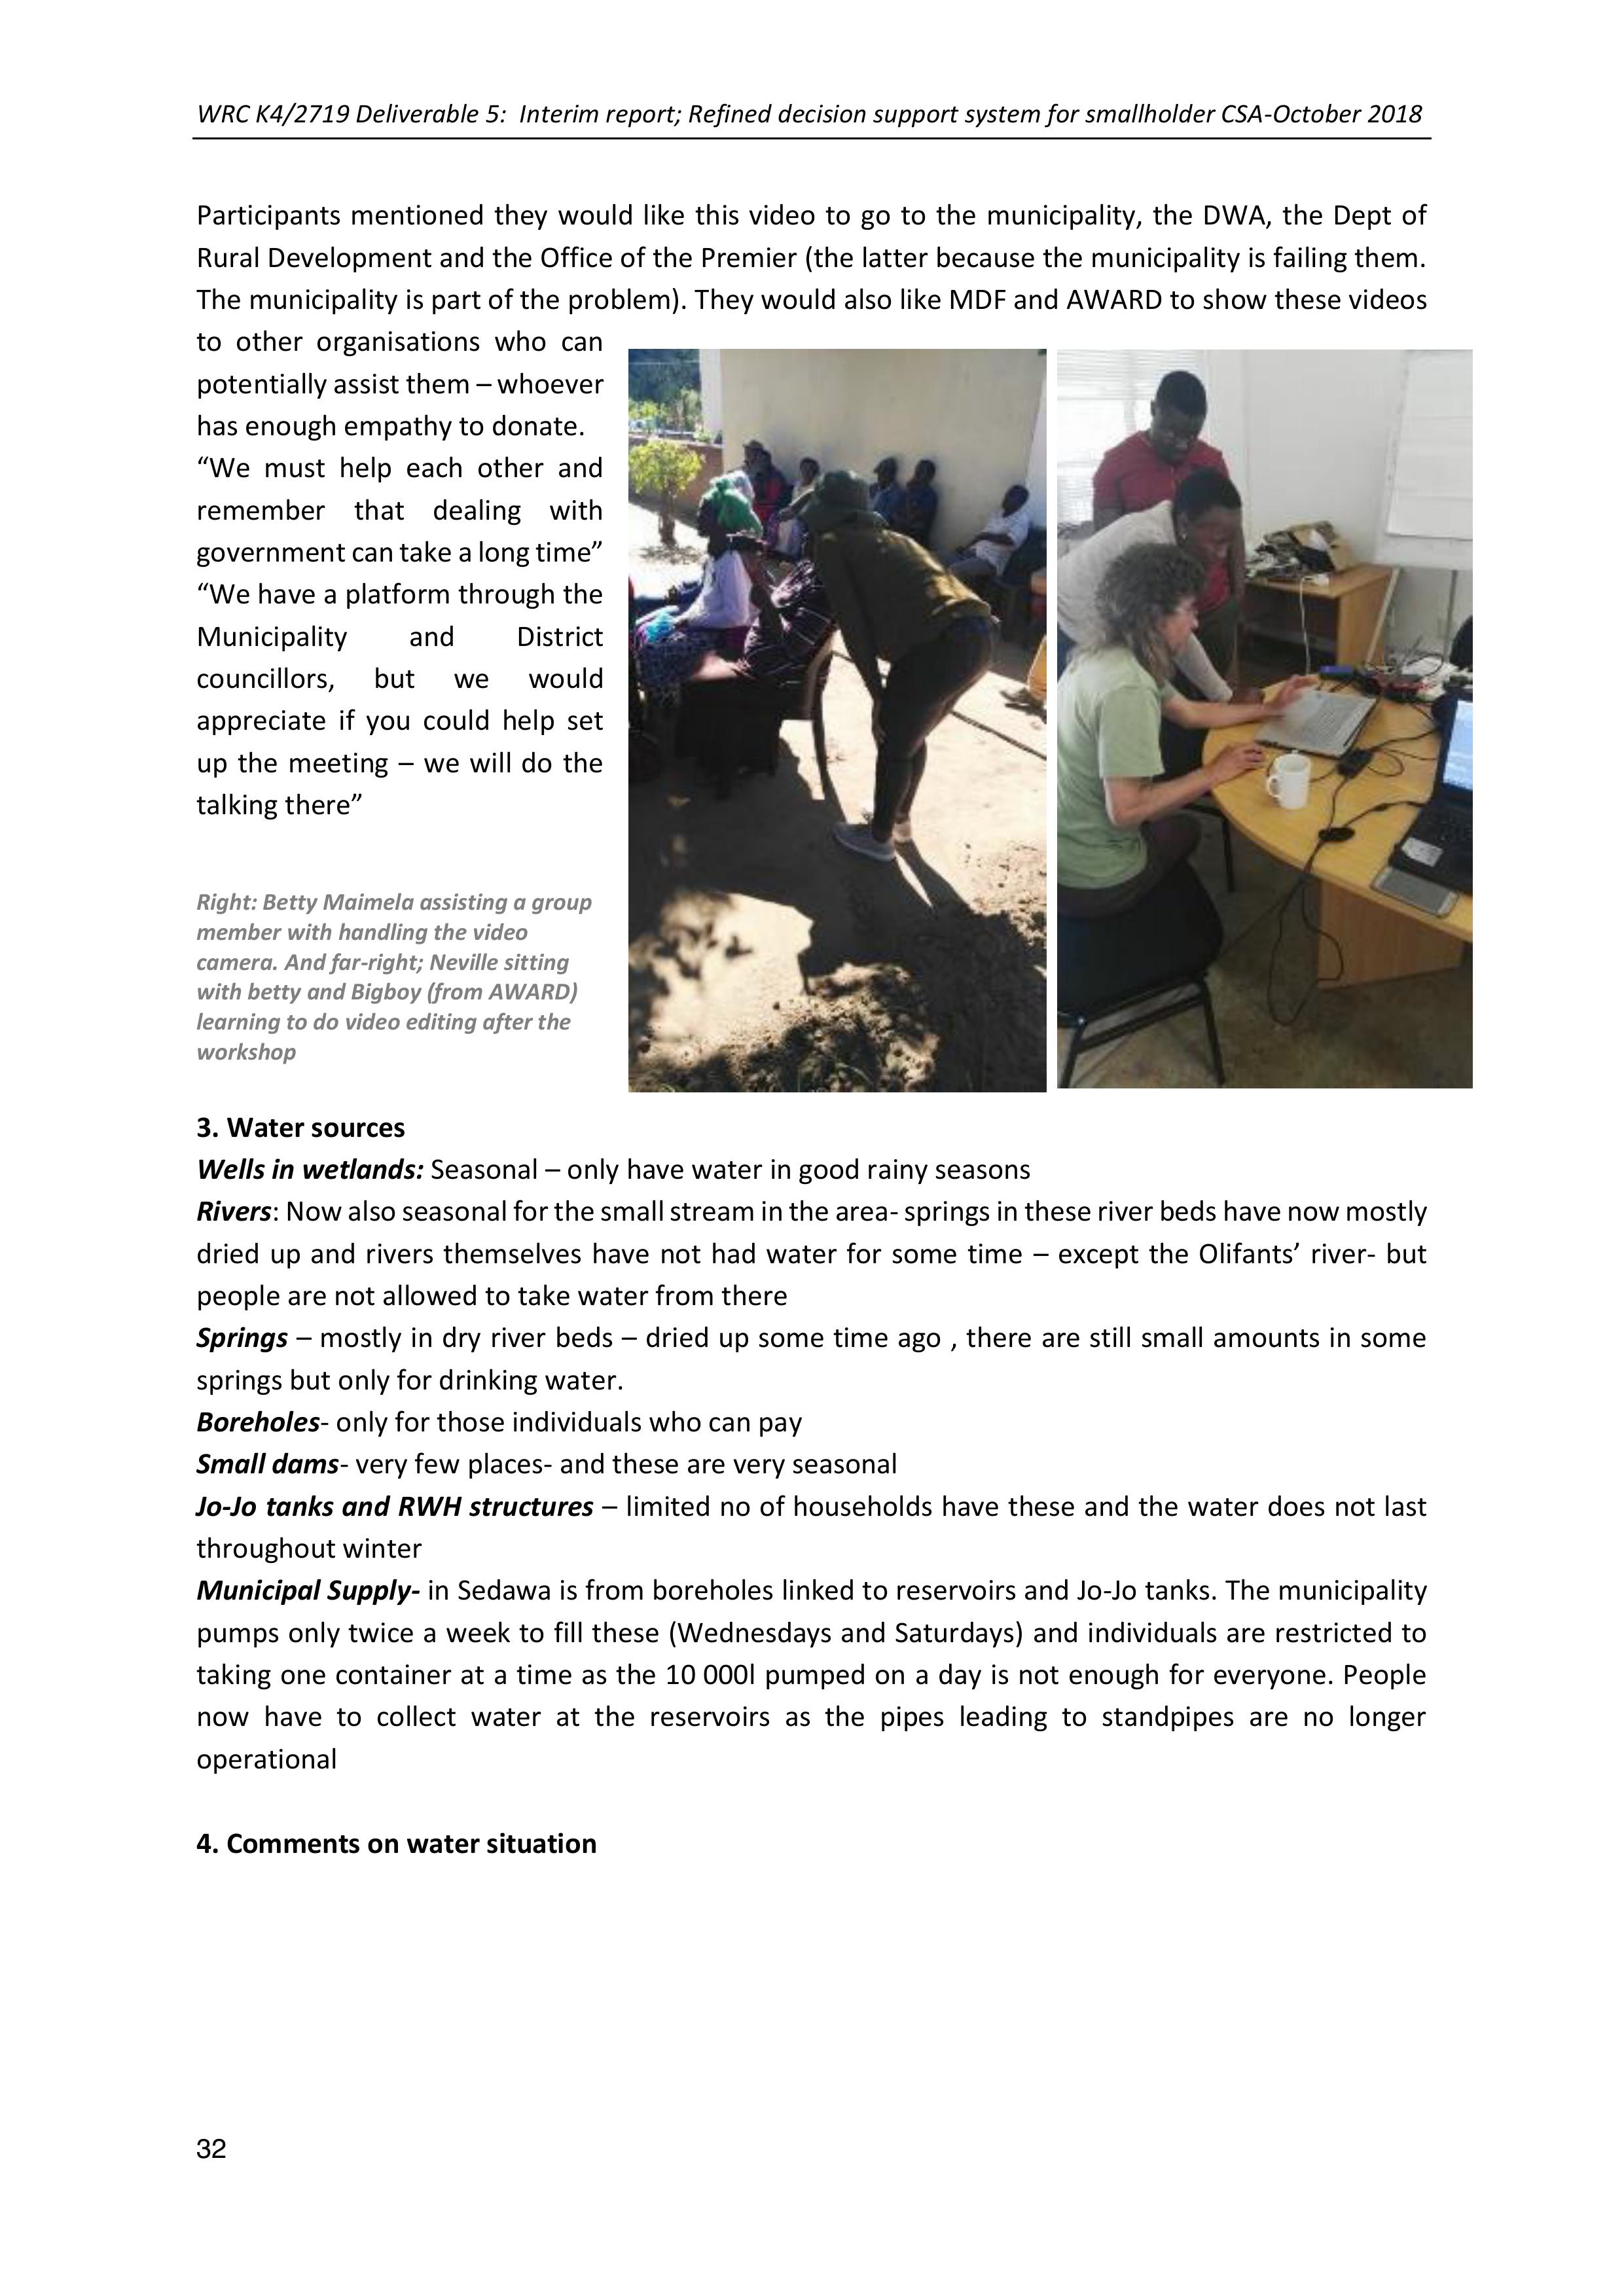
WRC K4/2719 Deliverable 5: Interim report; Refined decision support system for smallholder CSA-October 2018
32
Participants mentioned theywould like this video to go to the municipality, the DWA, the Dept of
Rural Development and the Office of the Premier (the latter because the municipality is failing them.
The municipality is part of the problem). They would also like MDF and AWARD to show these videos
to other organisations who can
potentially assist them –whoever
has enough empathy to donate.
“We must help each other and
remember that dealingwith
government can take alongtime”
“We have a platform through the
Municipality and District
councillors, butwe would
appreciate if you could help set
up the meeting –we will do the
talking there”
Right: Betty Maimela assisting a group
member with handling the video
camera. And far-right; Neville sitting
with betty and Bigboy (from AWARD)
learning to do video editing after the
workshop
3. Water sources
Wells in wetlands: Seasonal – only have water in good rainy seasons
Rivers: Now also seasonal for the small stream in the area- springs in these river beds have now mostly
dried up and rivers themselves have not had water for some time –except the Olifants’ river- but
people are not allowed to take water from there
Springs –mostly in dry river beds –dried up some time ago , there are still small amountsin some
springs but only for drinking water.
Boreholes- only for those individuals who can pay
Small dams- very few places- and these are very seasonal
Jo-Jo tanks and RWH structures–limited no of households have these and thewater does not last
throughout winter
Municipal Supply- in Sedawa is from boreholes linked to reservoirs and Jo-Jo tanks. The municipality
pumps only twice a week to fill these (Wednesdays and Saturdays) and individuals are restricted to
taking one container at a time as the 10 000l pumpedon a day isnot enough for everyone. People
now have to collect water at the reservoirs as the pipes leading to standpipes are no longer
operational
4. Comments on water situation
WRC K4/2719 Deliverable 5: Interim report; Refined decision support system for smallholder CSA-October 2018
33
➢Presently there is very little water from any of the
sources and 80% of households are paying for water
for household use only.
➢Only those people with boreholes have reliable
water access
➢The springs and wells are generally quite small and
only supply a few people. Animals are also drinking
there
➢Individuals with boreholes are selling water – if 210l
drums delivered, that costs R35-R45/ drum. If
people collect in 20l buckets they pay R1/bucket.
This started in 2016. Before that it was easier to get
water. The individuals with boreholes are now
taking advantage of the water shortage.
➢The springs in the river beds are no longer reliable
they are systematically drying up.
➢That leaves us with the only alternative of going up the mountain to the more reliable springs
high up in the kloof and to connect long pipes to bring water here.
➢The learning groups has collected R8 000 so far to buy this pipe.
➢In 2016 there was still enough water, but people were not very active in gardening. The
gardening was triggered by MDF and AWARD’s interventions, but has now come with a major
drought. That is why we have decided to try and come up with our own solutions for water
supply.
➢Because there is now so little water the systems need to be managed. So, for example the
amount of water taken from wells and springs and who is allowed to take water has caused
some conflict in the community.
➢Thus far there is no structure or organisation that manages water, people just do it by
themselves
➢The municipal supply has always been unreliable, that has not changed. It is just that there is
now a lot more pressure on that water and a greater need for access
➢The storage tanks are not large enough for everyone, even if they are pumping and people
need now to collect the water at the tanks -the hours provided for by the municipality are not
enough.
➢Not everyone in the village has access to municipal pipes. Some individuals have made illegal
connections into these pipes and these have been removed by other people as the water
becomes less.
➢None of the local sources are enough to even provide drinking and household water for the
community
5. Enablers
➢Good rain
➢Looking after wells and springs- having shade around these have helped with supply but more
maintenance is required
➢Less sand mining will keep the sand dams and springs in the river beds working
➢Subsurface flow is still keeping the system running – although less so than before
➢The Municipal boreholes were well sited as they are all strong
➢The wetlands and springs up the mountains are still intact and they keep the flow of water
going – as well as boreholes. Community members must be warned not to remove the sedges
and plants in these wetlands
ALTERNATIVE SOURCES
(Percentage of households with
access)
Jo-Jo tanks at household
level
12 %
Buying 210l drums of water
80%
Springs (Nov-June)
8%
Wells (Nov-Dec)
36%
Municipal water (ave 1x/
week)
56%

WRC K4/2719 Deliverable 5: Interim report; Refined decision support system for smallholder CSA-October 2018
34
6. Relationships in the community – the way forward
➢The responsibility now falls on the beneficiaries of this project – the learning group members
to make sure everything works. That is why we have started a water committee
➢We have come together to have one voice for the municipality and other outsiders
➢Getting water from the mountains is just one way the community is trying to sort out the
water problems
➢If there is no diesel in the municipal pumps the community is prepared to buy diesel
themselves.
➢The underground RWH tanks are very useful. This year the few with these tanks have
managed to keep their crops
going until early June. So if all
participants can have access to
these, linked with the supply
form the mountains there will
be enough water to carry us
through.
7. The plan
The idea is to bring a very long pipe
from the mountains to supply around
30-40 households in the community
with water for both household use and
gardening.
Figure 2: The picture alongside outlines the
proposed extent of the supply
8. Water Walk
On the Thursday, 5 community
members (MrMapekere, Mr Malepe,
Alex, Sam, Christina )and5 team
members (Erna, Sylvester, Betty, Chris
and Neville) braved the walk up the
mountain. It was a 6km hike up the
mountain moving up by 900m in
elevation. The source is in fact over the neck of the kloof down another 120m on the other side.
The whole water course on the way up is now dry and there are a few very long pipes already in this
stream bed- now all dried up.
Just above the village we came across a garden beingirrigatedusing sprinklers and flood irrigation.
The water source here was a pipe for this individual in a different stream –which he said has now
dried up andwhich he has replaced with a borehole and a tank. He is obviously a well-resourced
individual in the community.
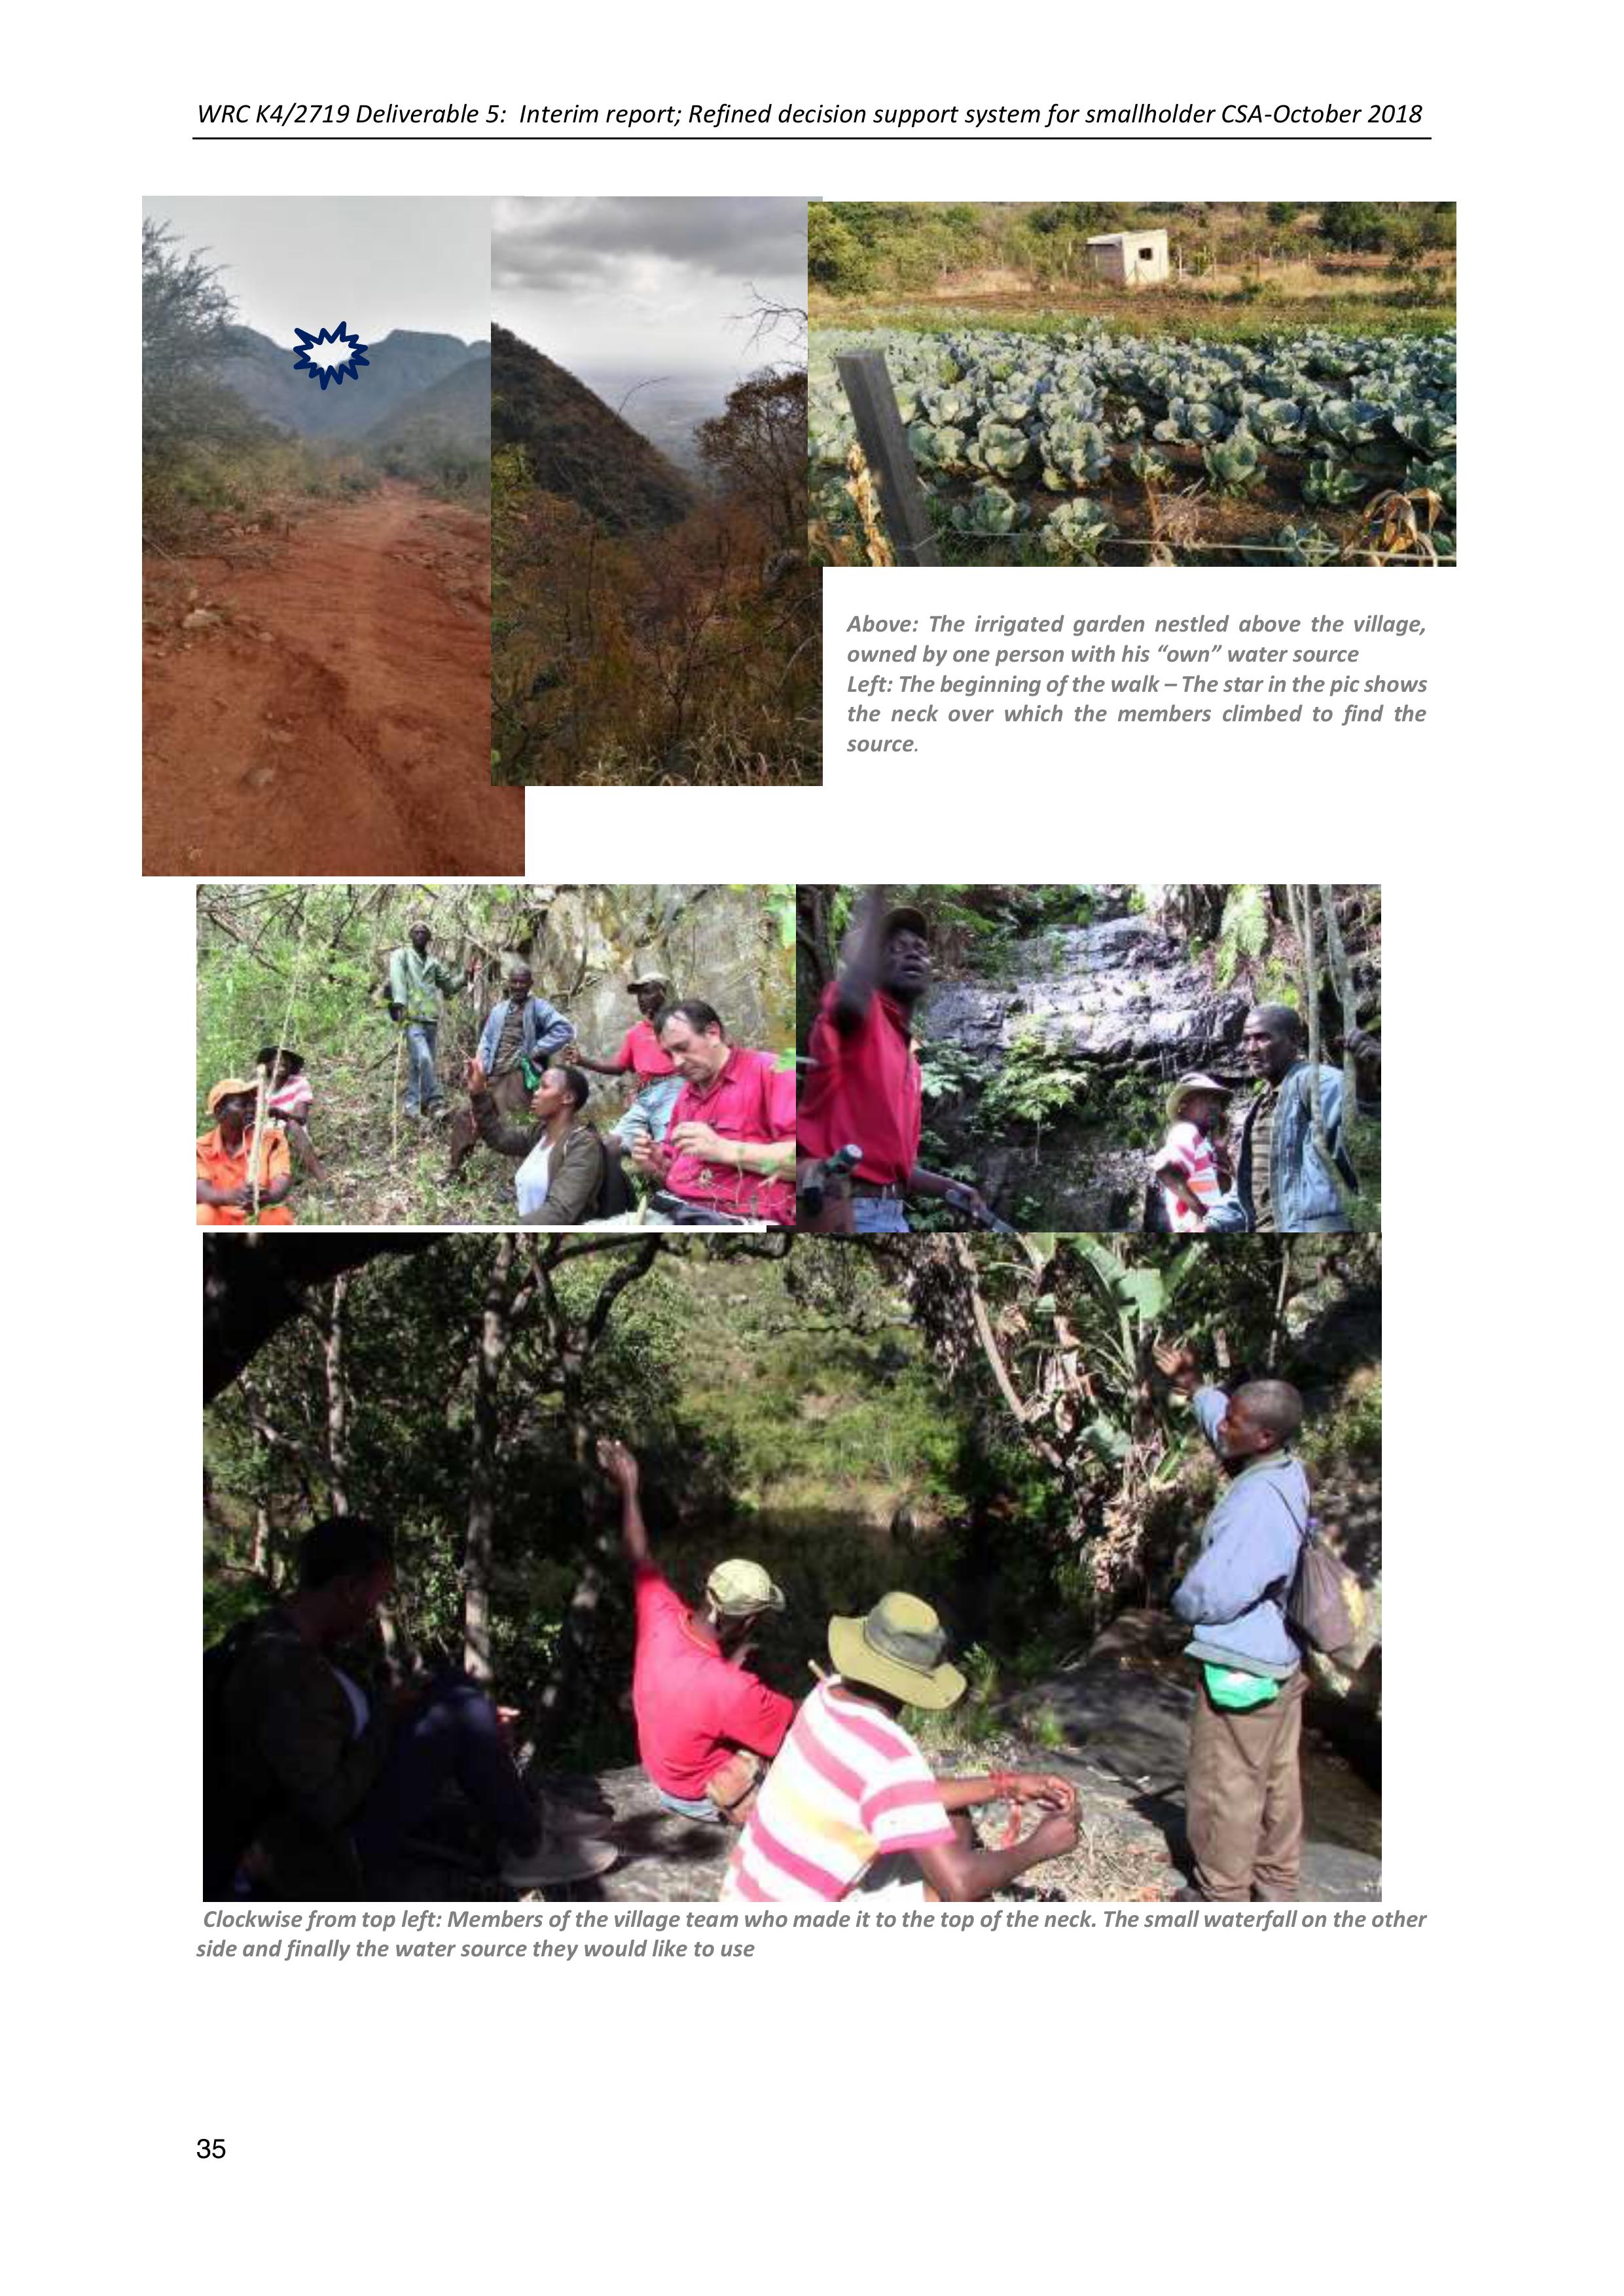
WRC K4/2719 Deliverable 5: Interim report; Refined decision support system for smallholder CSA-October 2018
35
Above: The irrigated garden nestled above the village,
owned by one person with his “own” water source
Left: The beginning of the walk –The star in the pic shows
the neck over which the members climbed to find the
source.
Clockwise from top left: Members of the village team who made it to the top of the neck. The small waterfall on the other
side and finally the water source they would like to use
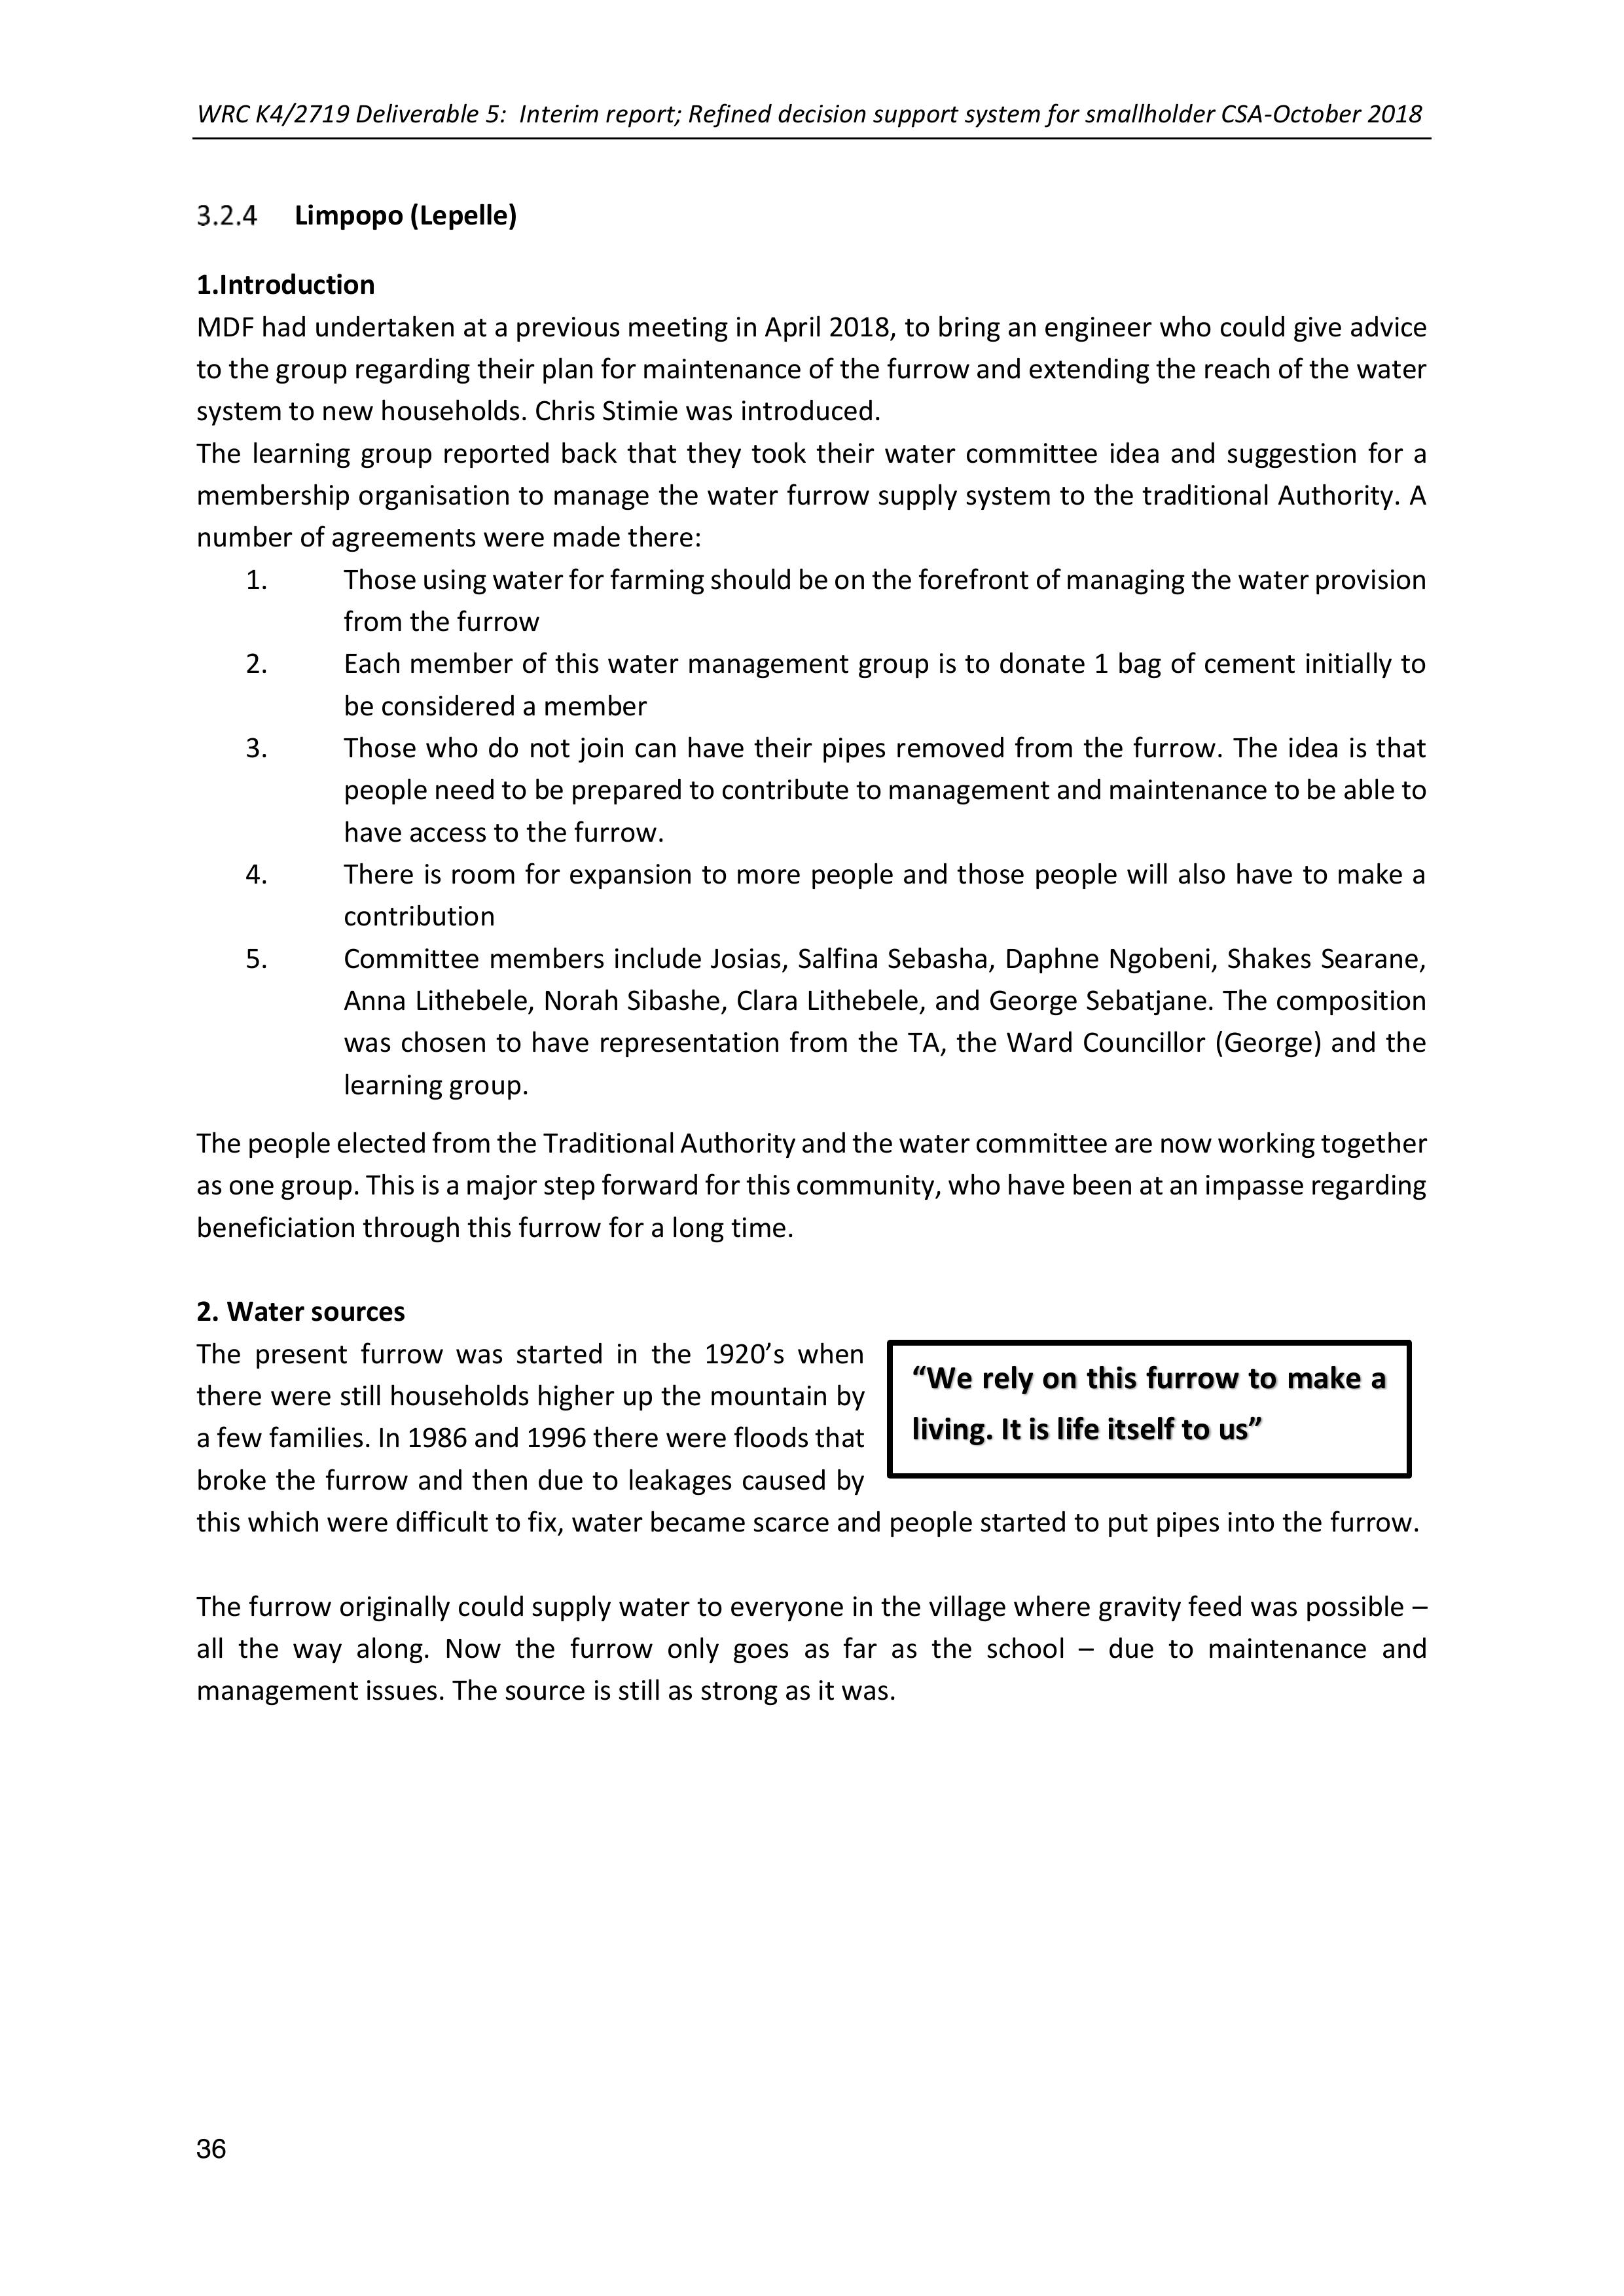
WRC K4/2719 Deliverable 5: Interim report; Refined decision support system for smallholder CSA-October 2018
36
Limpopo (Lepelle)
1.Introduction
MDF had undertaken at a previous meeting in April 2018, to bring an engineer who could give advice
to the group regarding their plan for maintenance of the furrow and extending the reach of the water
system to new households. Chris Stimie was introduced.
The learning groupreported back that they took their water committee idea and suggestion for a
membership organisation to manage the water furrow supply system to thetraditional Authority. A
number of agreements were made there:
1.Those using waterfor farming should be on the forefront of managing the water provision
from the furrow
2.Each member of this water management group isto donate 1bag of cement initially to
be considered a member
3.Those who do notjoin can have their pipes removedfrom the furrow. The idea is that
people need to be prepared to contribute to management and maintenance to be able to
have access to the furrow.
4.There is room for expansion to more peopleand those people will also have to make a
contribution
5.Committee members include Josias, Salfina Sebasha, Daphne Ngobeni, Shakes Searane,
Anna Lithebele, Norah Sibashe, Clara Lithebele, and George Sebatjane. The composition
was chosen to have representation from the TA, the Ward Councillor (George) and the
learning group.
The people elected from the TraditionalAuthority andthe water committee are now working together
as one group. This is a major step forward for this community, who havebeen atan impasse regarding
beneficiation through this furrow for a long time.
2. Water sources
The presentfurrow was started in the 1920’swhen
there were still households higher up the mountain by
a few families. In 1986 and 1996 there were floods that
broke the furrow and thendue to leakages caused by
this which were difficult to fix, water became scarce and people started to put pipes into the furrow.
The furrow originally could supply water to everyone in the village where gravity feed was possible –
all the way along. Now the furrow only goes as far as the school – due to maintenance and
management issues. The source is still as strong as it was.
“We rely on this furrow to make a
living. It is life itself to us”

WRC K4/2719 Deliverable 5: Interim report; Refined decision support system for smallholder CSA-October 2018
37
The furrow has brought us together. Everyone is given access to use the furrow directly, even the
newcomers. They collect water and do their laundry there.
The pipes were put in higher up along the furrow (for individuals) as
conflicts arose dueto everyone wanting to irrigate form the furrow
at the same time and people not wanting to wait for each other. The
furrow runs along two blocks in the community –one towards and
past the chief’s house andone further down closer to the Lepelle
river. After a meeting, some time ago the cement “dam” was
constructed so that people could put their pipes in there. As the space
ran out individuals would just come and put their pipe in the bank or
remove others’ pipes. This has caused a lot of leakages and reduced
the water in the furrow further. So now the furrow ends close to the
school as there is no longer enough water to flow all the way along.
Right:The sub-group working on the timeline for water sources, provision and
issues in the community of Lepelle
There are presently around 40 pipes linked into the furrows and
overall around 50 households that benefit. (The community consists
of around 208 households). The plan is to extend the use of the furrow to another 50-60 households.
These pipes are open ended and run continually once placed into the furrow. Those underneath are
more reliable than the pipes placed on top of them. So, some pipes end up not having water in them.
We have learnt that it is quite wasteful of water to do that and now we have taps and ways to close
off the pipes when we are not using them. We have also made better furrows and basins for irrigation
in our yard in- stead of letting the water just run everywhere.
Right and below; George
Sebatjane has made improved
furrows and basins around his
mango trees toimprove his
irrigation efficiency from the
furrow and also to save water.
Far- right: He has also constructed
small terraces in his mango
nursery to ensure even irrigation,
less erosion and better growth for
the small mango trees.

WRC K4/2719 Deliverable 5: Interim report; Refined decision support system for smallholder CSA-October 2018
38
Maintenance is very
important. When is rains
rocks fall into the furrow
and damage it. Also, crabs
make holes in the banks
which then have many
leaks. Cows also become a
problem when it is dry
elsewhere and the start to
graze on the green grass
around the banks of the
furrow.
In around 1999 the Municipality (Tubatse) put in a system – it is a borehole with water pumped into
a tank and reticulate to stand pipes It does not cover the whole village and is very unreliable. Section
1, which is below the main road has some access to municipal water. Section 2 of Lepelle – above the
main road has no municipalaccess. They have been sharing a spring/ stream with another community
Leboeng. This community recently placed a weir across the stream which effectively has dried up the
water lower down and Lepelle (section 2) is now in a very difficult position.
3. The plan/idea
We have always wanted to do something about the furrow and as water is becoming more scarce we
are now taking on this responsibility. The cement to fix the furrow is just the first step. We will need
help with how to design and build the furrow in a way that does not break so easily and how to fit in
all the pipes that people want to put in without destroying the furrow. Each individual will also need
around 600m of piping (100m each of 40-32-20-15) – so this will cost around R3 000/household. We
also will insist that people put taps on their pipe- not so much to regulate how much water they use,
but to ensure that they are not wasting water.
Above and Right:the sub-group working on the plan / design of the water provision
process through the furrow
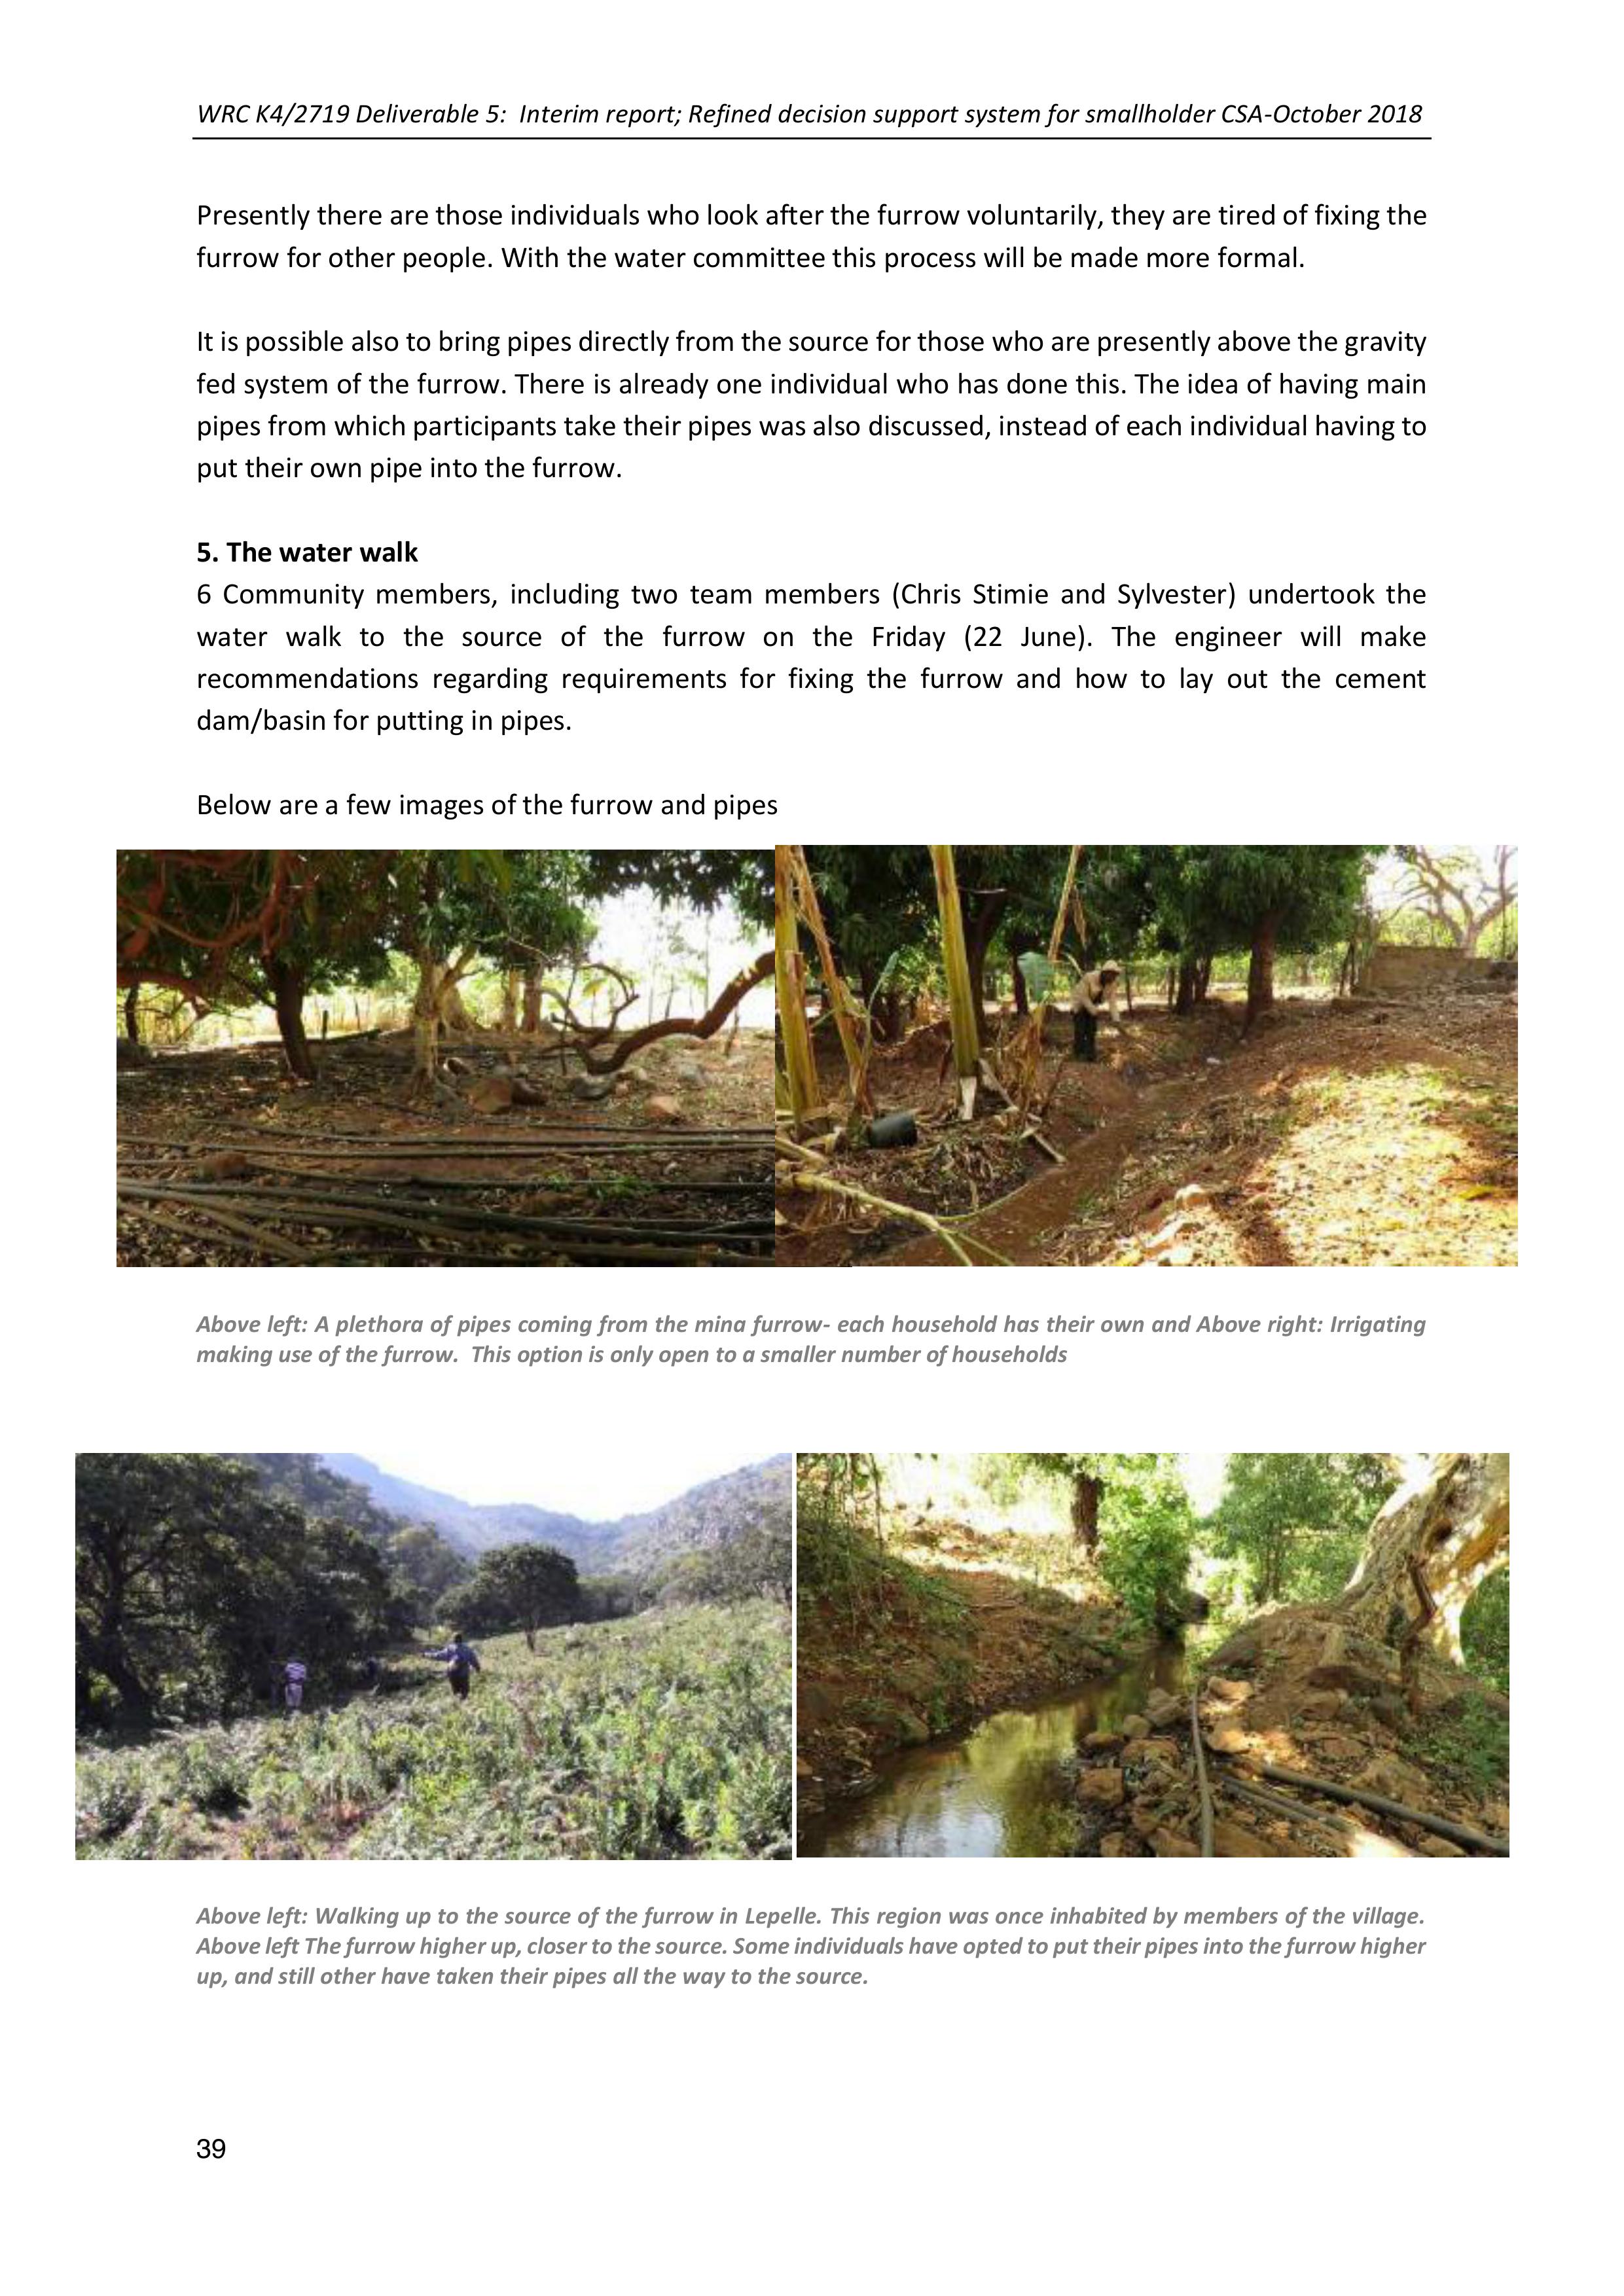
WRC K4/2719 Deliverable 5: Interim report; Refined decision support system for smallholder CSA-October 2018
39
Presently there are those individuals who look after the furrow voluntarily, they are tired of fixing the
furrow for other people. With the water committee this process will be made more formal.
It is possible also to bring pipes directly from the source for those who are presently above the gravity
fed system of the furrow. There is already one individual who has done this. The idea of having main
pipes from which participants take their pipes was also discussed, instead of each individual having to
put their own pipe into the furrow.
5. The water walk
6 Community members, including two team members (Chris Stimie and Sylvester) undertook the
water walk to the source of the furrow on the Friday (22 June).The engineer will make
recommendations regarding requirements for fixing the furrow and how to lay out the cement
dam/basin for putting in pipes.
Below are a few images of the furrow and pipes
Above left: A plethora of pipes coming from the mina furrow- each household has their own andAbove right: Irrigating
making use of the furrow. This option is only open to a smaller number of households
Above left: Walking up to the source of the furrow in Lepelle. This region was once inhabited by members of the village.
Above left The furrow higher up, closer to the source. Some individuals have opted to put their pipes into the furrow higher
up, and still other have taken their pipes all the way to the source.
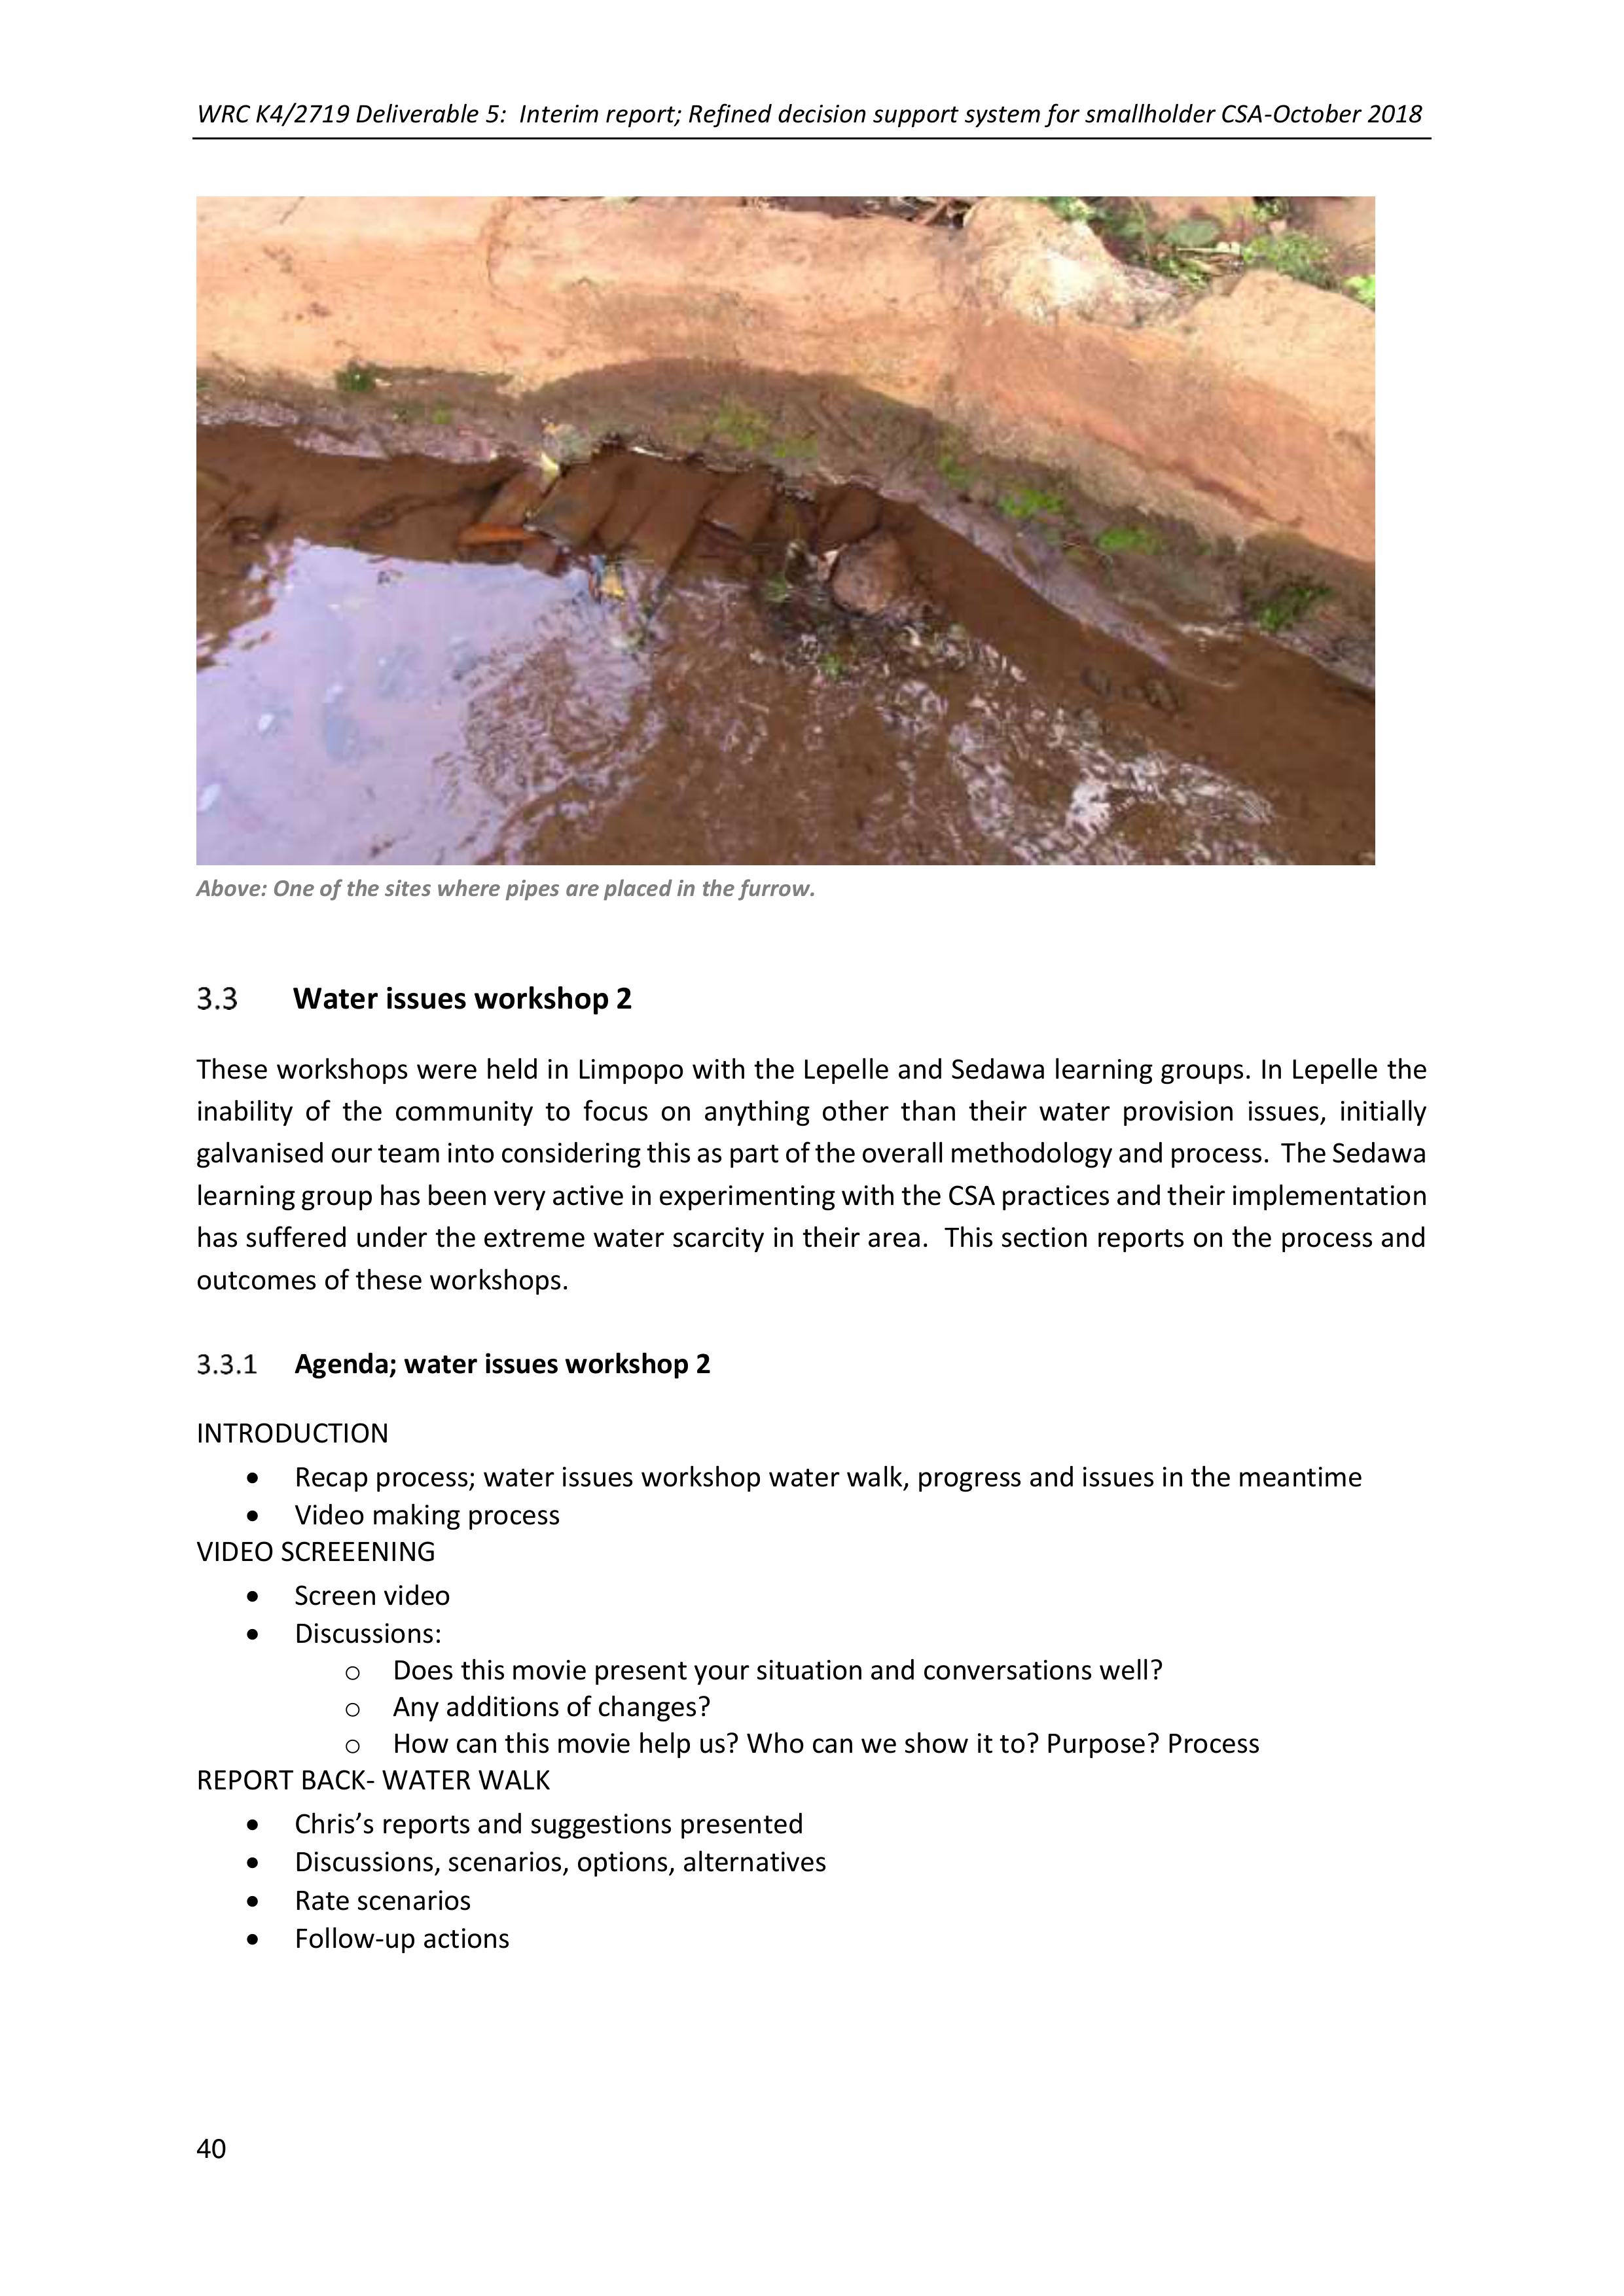
WRC K4/2719 Deliverable 5: Interim report; Refined decision support system for smallholder CSA-October 2018
40
Above: One of the sites where pipes are placed in the furrow.
Water issues workshop 2
These workshops were held in Limpopo with the Lepelle and Sedawa learning groups. In Lepellethe
inability of the community to focus on anything other than their water provision issues, initially
galvanised our team into considering this as part of the overall methodology andprocess. The Sedawa
learning group has been very active inexperimenting with the CSA practicesand their implementation
has suffered under the extreme water scarcity in their area. This section reports on the process and
outcomes of these workshops.
Agenda; water issues workshop 2
INTRODUCTION
•Recap process; water issues workshop water walk, progress and issues in the meantime
•Video making process
VIDEO SCREEENING
•Screen video
•Discussions:
oDoes this movie present your situation and conversations well?
oAny additions of changes?
oHow can this movie help us? Who can we show it to? Purpose? Process
REPORT BACK- WATER WALK
•Chris’s reports and suggestions presented
•Discussions, scenarios, options, alternatives
•Rate scenarios
•Follow-up actions
WRC K4/2719 Deliverable 5: Interim report; Refined decision support system for smallholder CSA-October 2018
41
SEDAWA Water issues Workshop 2
Introduction
Some of the learning group members went to speak topeople in Botshableo who have done this
before (protected a spring in the mountain and reticulated with pipes in the village). In that case only
8 of all the initial ‘volunteers” went ahead with the process. But technically it seems feasible. If he can
do it, so can we.
The strikes and road blockages in the area as because of water issues. It appears to be the only way
to get the Municipality to hear us the municipal borehole pumps are broken; there are maintenance
issues. The municipal water trucks that deliver water do not come to this village- so there is presently
no water at all. The Maruleng Municipality is quite small and only have 2-3water trucks, which are
not enough to service all the areas. There are rumours of them combining with Palaborwa.
No one has been informed of the impending bulk water supply system, although they have seen the
pipes being laid along the main road and some of the big new reservoirs built on the hills. There is no
direct communication form the municipality. We can only hear news via the radio/ newspapers.The
meetings that do happen are about votes, they are not real things. There is friction as they make
promises that they do not fulfil.
Different scenarios were discussed
1.Divert water from the Olifant’s river and bring it through Botshabelo to Sedawa – it is a
shorter route than the mountain spring
2.The alternative spring at the foot of the hills in Sedawa (we passed the infrastructure and
irrigated gardens on the way up). The group felt that they could communicate with him, but
there is a practice in the area, that if someone discovers a spring and uses it first, it even gets
their name, so it becomes a bit of a challenge. There were conflicts before that eventually
had to be sorted out by the tribal authority. It might get to that here, or it might be better
3.We still need to take the walk around the mountain to see how far it is (Maphikiri). We do
not yet want to let go of this option. We would need to run the pipe around the back of the
mountain through Botshabelo and then bring it here.
4.Boreholes, maybe three sperate ones to be able to take pipes from there to the various
participants, who are in three separate areas. The fear here is that some boreholes are
running dry and sometimes people drill and do not get water.
Comments on the screening of the movie
1.The movie is perfect as it is
2.It’s a nice way of keeping a record of what we did
3.It was a very long walk, hopefully it will bear some fruit
4.Thirsty from seeing that water- this video is giving us encouragement and hope
5.We’ve seen the water- now let’s go get it
6.We are seeing how steep the slope is, the pipe will have to go around
7.The way it looks, the source seems small, but I know from the past that it is a very good
source
8.This video can be used to show prospective donors
9.Just the effort we took should impress the funders
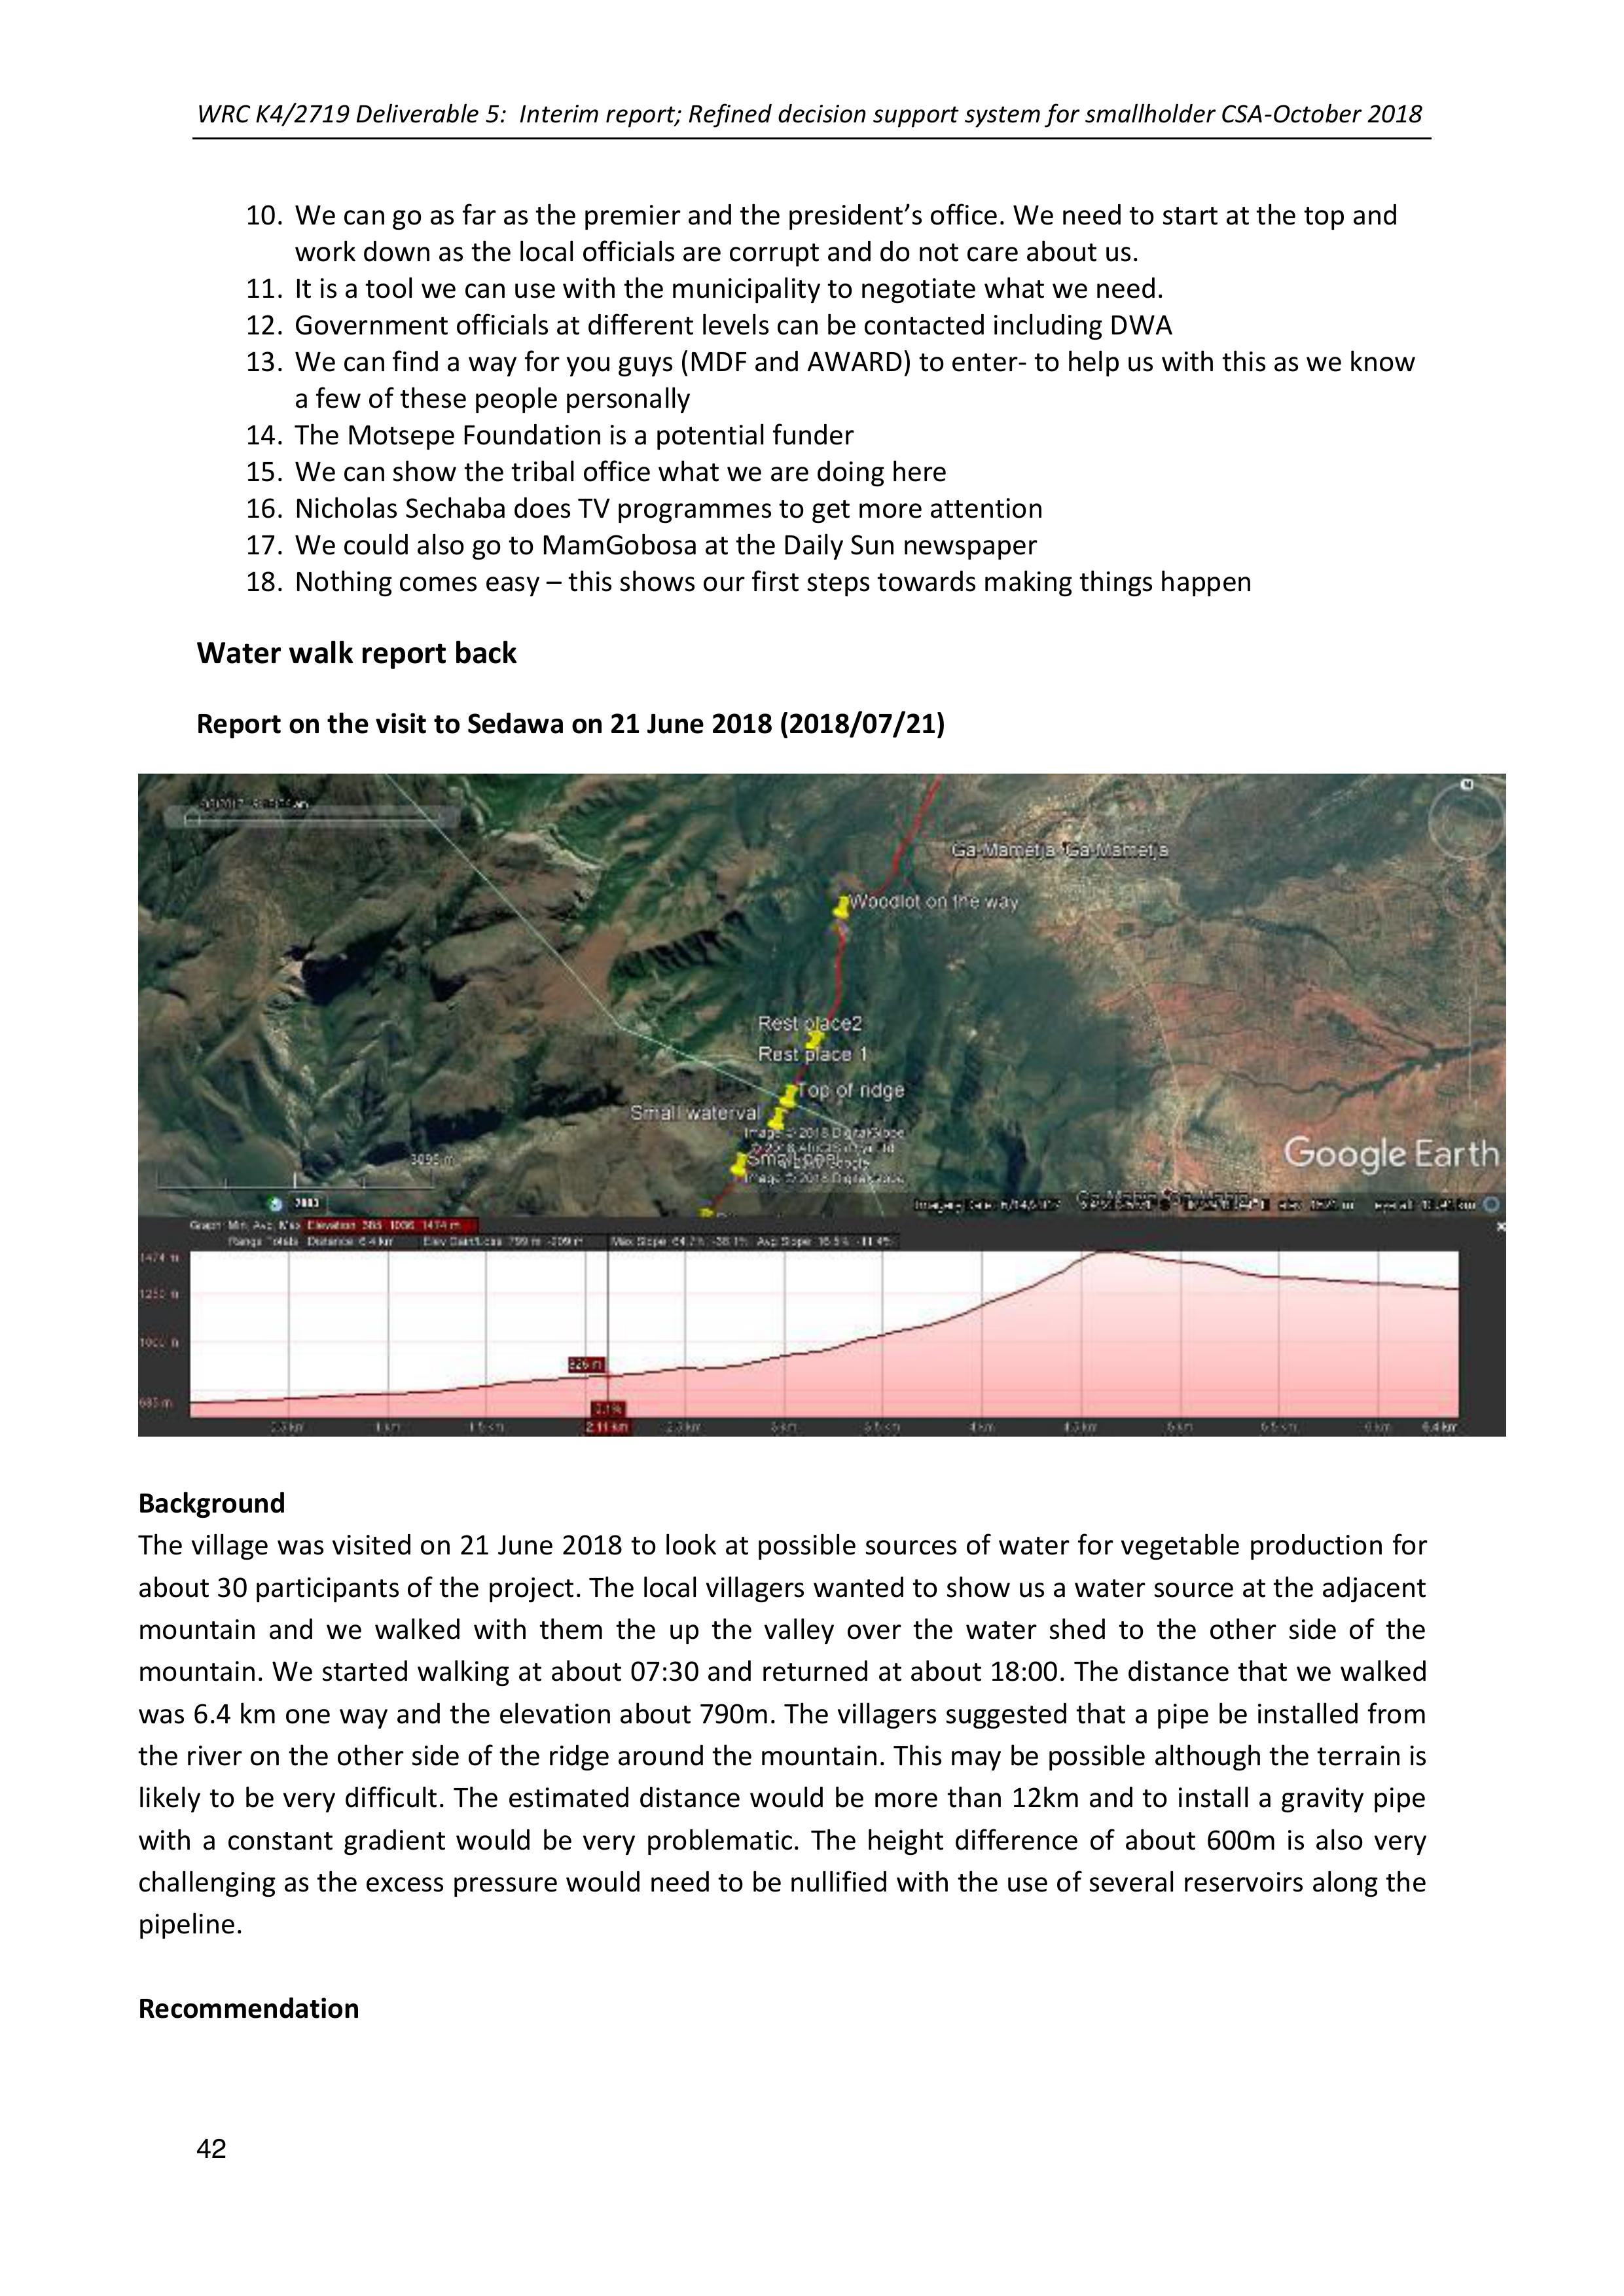
WRC K4/2719 Deliverable 5: Interim report; Refined decision support system for smallholder CSA-October 2018
42
10.We can go as far as the premier and the president’s office. We need to start at the top and
work down as the local officials are corrupt and do not care about us.
11.It is a tool we can use with the municipality to negotiate what we need.
12.Government officials at different levels can be contacted including DWA
13.We can find a way for you guys (MDF and AWARD) to enter- to help us with this as we know
a few of these people personally
14.The Motsepe Foundation is a potential funder
15.We can show the tribal office what we are doing here
16.Nicholas Sechaba does TV programmes to get more attention
17.We could also go to MamGobosa at the Daily Sun newspaper
18.Nothing comes easy – this shows our first steps towards making things happen
Water walk report back
Report on the visit to Sedawa on 21 June 2018 (2018/07/21)
Background
The village was visited on 21 June 2018 to lookat possible sources of water for vegetable production for
about 30 participants of the project. The local villagers wanted to show us a water source at the adjacent
mountain and we walked with them the up the valley over the water shed to the other side of the
mountain. We started walking at about07:30 andreturned at about 18:00. The distance that we walked
was 6.4 km one way and the elevation about 790m. The villagers suggested that a pipe be installed from
the river on the other side of the ridge around the mountain. This may be possible although the terrain is
likely to bevery difficult. The estimateddistance would be morethan 12kmand to install a gravity pipe
with a constant gradient would be very problematic. The height difference of about600m is also very
challenging as the excess pressure would need to be nullified with the use of several reservoirs along the
pipeline.
Recommendation
WRC K4/2719 Deliverable 5: Interim report; Refined decision support system for smallholder CSA-October 2018
43
The 12km pipeline around the mountain will be technically very difficult but the cost would be prohibitive.
A rough costing indicates that the costs for this optioncould be in excess of R3m. This option is therefore
not recommended. The option of taking the route that we walked is also not recommended for the same
reasons with the added complication that the water would need to be pumped.
The amount of water is also not much and the flow rate at the time of visit was estimated to be between
5 and 10 m3/h.
It is therefore recommended thata much more cost effective and practical option be considered. In my
opinion a borehole would be a far better solution to develop a water source. It would need to be managed
in such a way that it is sustainable and equitable. These problems could be overcome with clear definition
of roles and responsibilities based on sound management and maintenance.
SUMMARY AND DISCUSSIONS
Summary: the spring as it is now, supplies around
10 000l/hr, which is not very strong. The distance the
pipe would need to go is 12 km (around the mountain)
and the spring is 800m higher than the village. This
provides too much pressure for a pipe and “breaker”
tanks and pressure release valves would need to be built
along the way. The overall estimated cost is around
R3 000 000. SUGGESTION: Communal boreholethat
belongs to the group.
COMMENTS
1.I agree with the borehole option. It could make
sense to drill them in Mabins A and then bring
the water to Sedawa
2.R3 million sounds scary, but maybe we can
break down these costs and start step by step
3.It the source is not so strong, maybe we can build a wall and collect water to get more
4.There are boreholes that aren’t yielding that much water. Up there we are sure there is
water, so let’s explore
5.We can use different classes of pipe, even class 6
6.Going for a borehole is going one step backwards –let’s go forward rather
7.We’ve set our sights on that water, so let’s keep going
8.There are a lot of people with boreholes that are not giving good yields. Do we have goo
ways of detecting whether boreholes will be strong or not?
COMMUNITY HOMEWORK – end September
Go and visit people with boreholes to find out
-When it was drilled
-Who did the drilling
-How deep it is
-Yield – l/hr
-Does it change in winter and summer; is it getting weaker
-How did you decide to put it there?
Water Group
22 people have contributed R 9000 towards the
proposed water system. There are around
another 50 people who are waiting to see what
happens.
Min water required:600l/hh/day
Gardens:250 000l/week (fill up whole yard with
trench beds, 50 hh)
Fields: 420 000l/week (Ave 3,6ha, 8 hh)(THUS
AROUND 700 000l/week)
SPRING: 10 000l/hr ~200 000l/day = 700 000- 1
400 00l/week ( COST:R1,5-3million)
BOREHOLE: 2 500l/hr ~ 175 000l/week (will need
3-4 boreholes) (COSTR150 000-R300 000)
* this was based on Christina’s borehole =, which
is strong and fills her 24 000l tank in 10 hours
WRC K4/2719 Deliverable 5: Interim report; Refined decision support system for smallholder CSA-October 2018
44
And find some places to provisionally site 3 boreholes based on this information and on where we
think there most likely is water (ie close to the riverbed) (get GPS coordinates for those spots –Betty
can help with that)
MEETING 1: We need to meet to discuss the options more (23 August)
OPTIONS
Next steps
What we still need to know or do
Boreholes
Shorter term, more manageable, but
there may not be enough water
How will they be distributed? Group
people into areas?
Pick water sources and number of
people
TEST WATER
Siting? Quality of water? Operational
costs, who will pay for maintenance.?
Who will open and close the taps/
pumps? Fixing pipes and pumps (We are
starting to earn income from our gardens
and can contribute)
Mountain spring
Longer term. There is a danger of
burning of pipes
There is not clarity in the longer term
how much water there is
Are there cheaper ways?
TEST WATER
Organise a meeting for the man
from Botshabelo to explain his
process, costs, issues etc.
Get Chris to do quantities
Steel pipes may beneeded, but this could
be very expensive
Need to walk alongwhere the pipe will
be. And talk to the man from Botshabelo
again.
There is the concern that 205 needs to be
left for the environment.
Dipua Thobejane is the Muaruleng Mayor – he can be approached
Also Rebecca Malepe is the councillor and she can be informed. To seeif they will provide support
Lebo from DWA can also be contacted
COMMENT: Cryton:the municipality needs to be informed as it is under their jurisdiction –so that
there are no legal repercussions. And you will need to specify that it is water for agriculture, not
household use
MAHLATHINI/AWARD HOMEWORK- end-September
-Are there good drilling companies in the area, and which are they?
-Is there an underground water survey for the area?
-Costs of an exploration/survey (or water divining)
-MDF is in the process of writing a funding proposal, which will be able to assist with the
funding (not R3million though). We will know by end November whether that is possible
-Derrick/ William from the municipal support unit in AWARD – can show the video
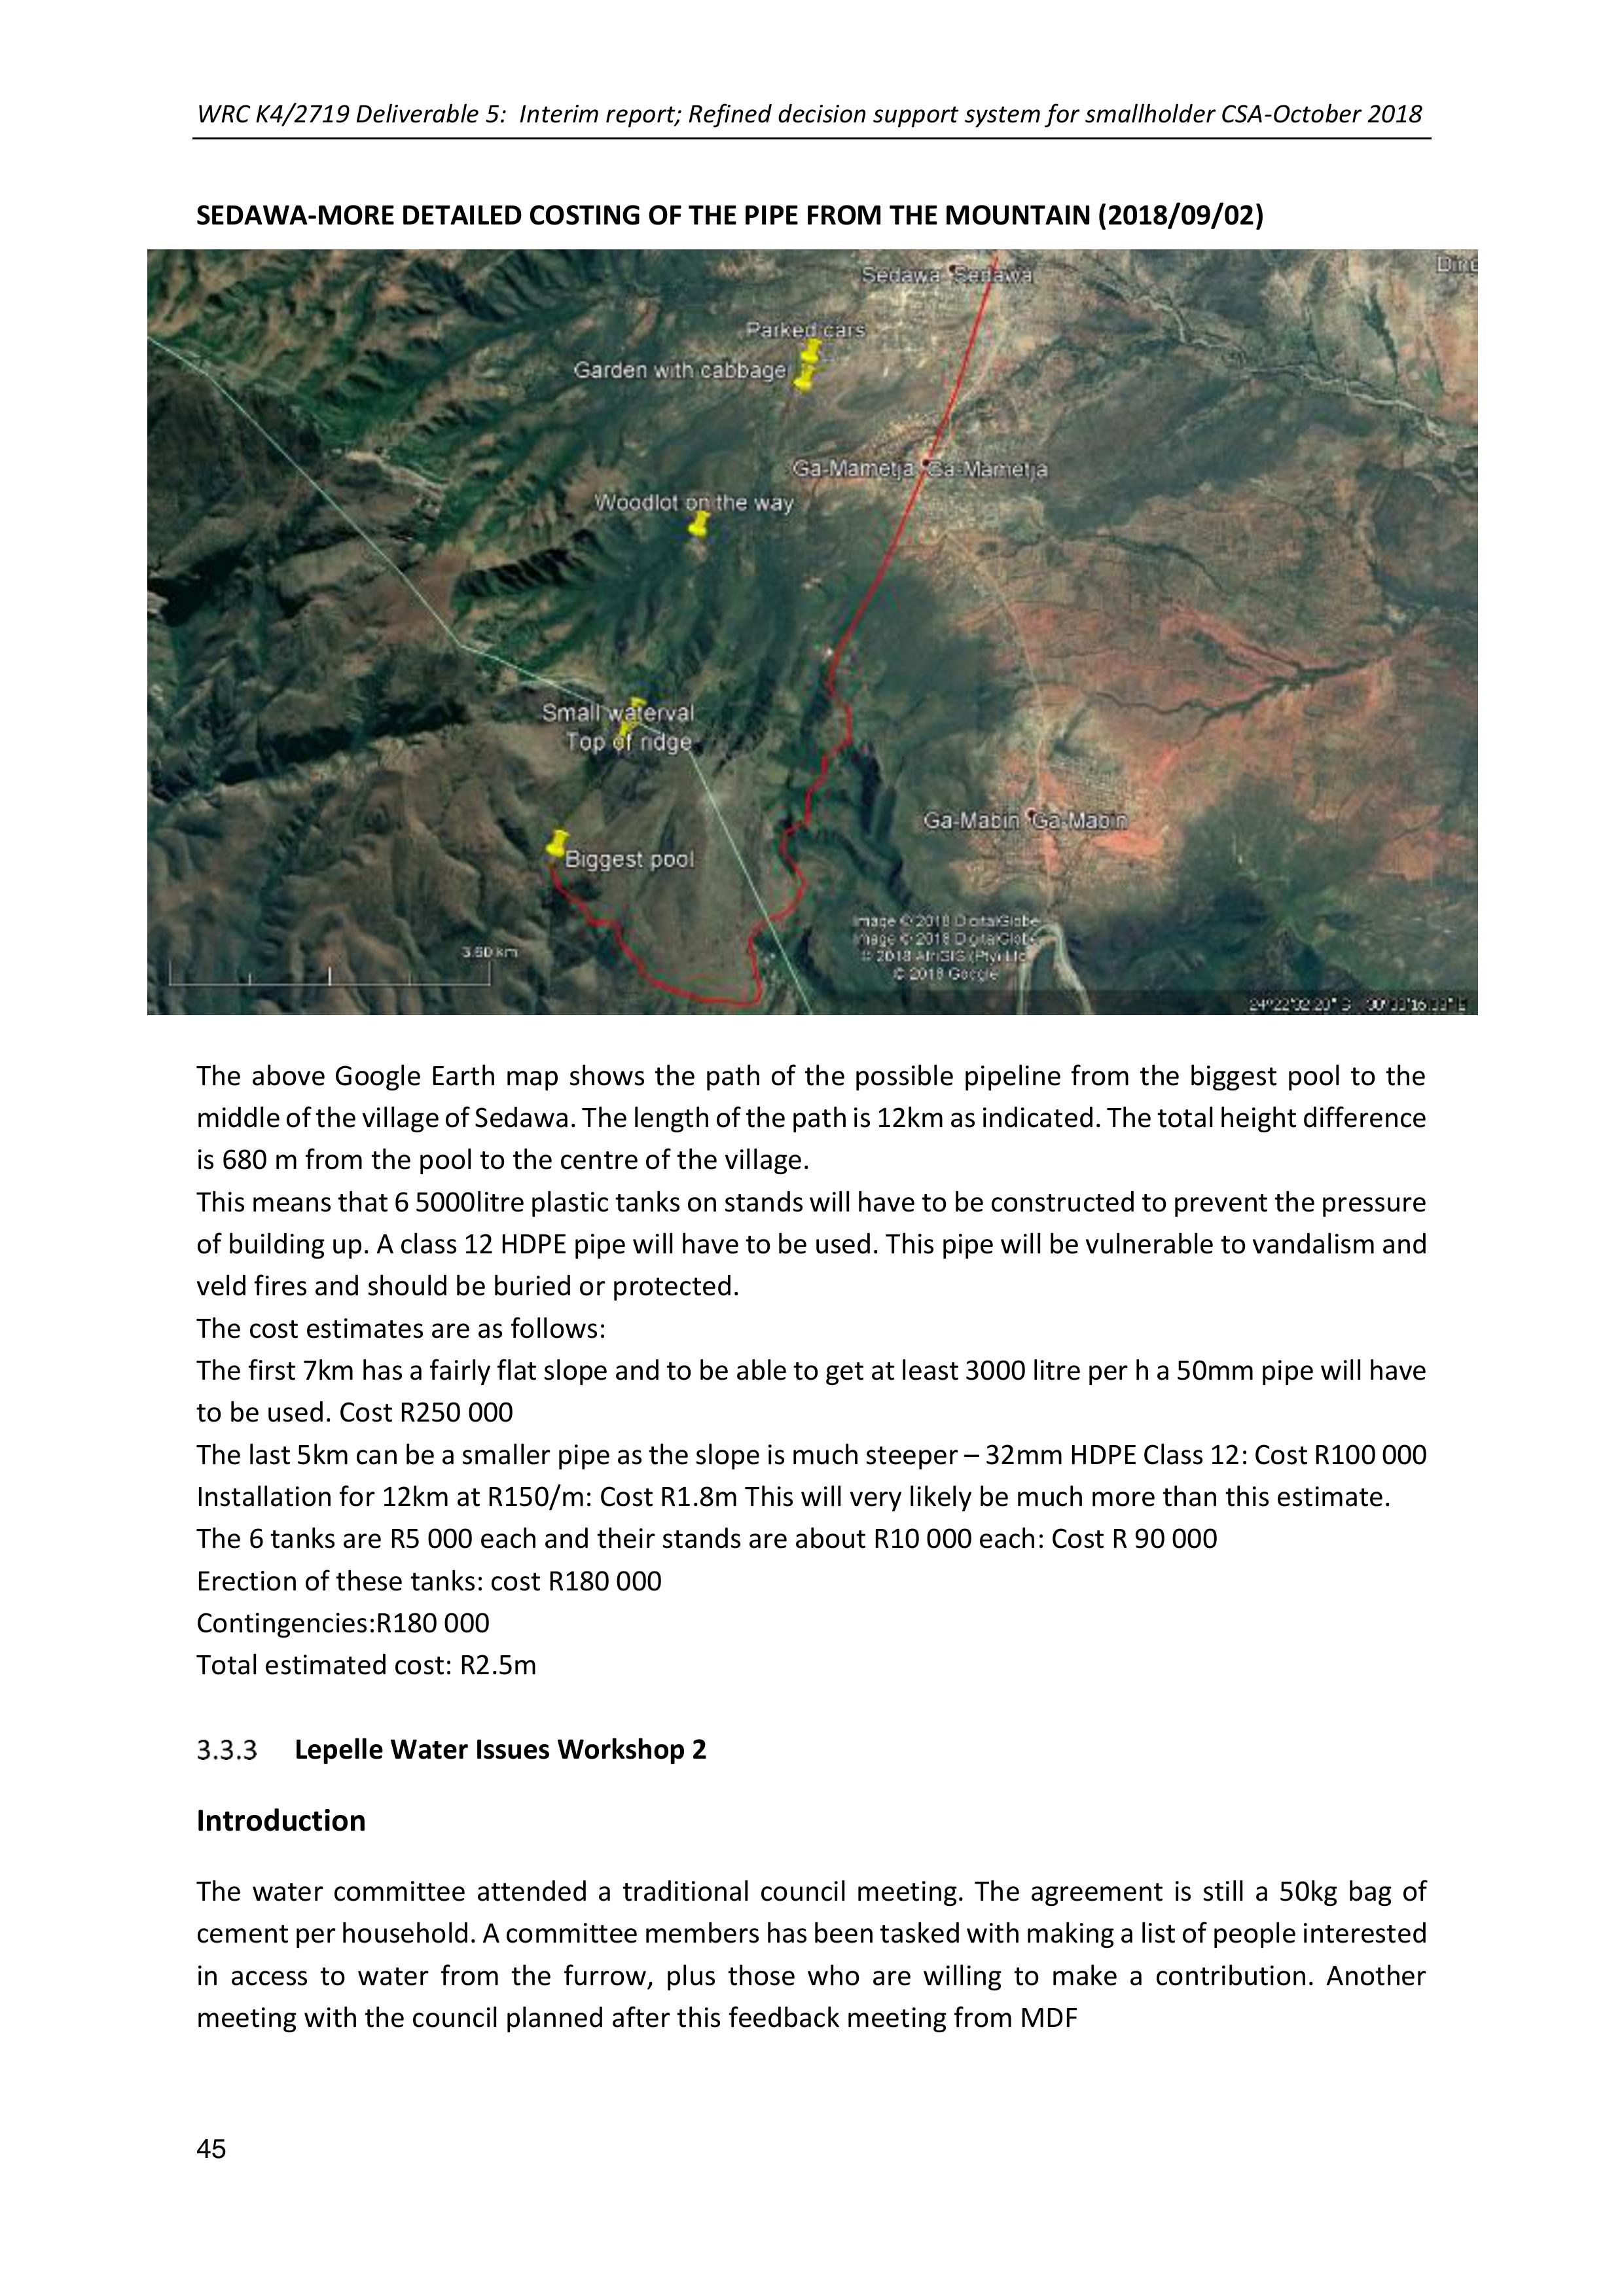
WRC K4/2719 Deliverable 5: Interim report; Refined decision support system for smallholder CSA-October 2018
45
SEDAWA-MORE DETAILED COSTING OF THE PIPE FROM THE MOUNTAIN (2018/09/02)
The above Google Earth map shows the path of the possible pipeline from thebiggest pool to the
middle of the village of Sedawa. The length of the path is 12km as indicated. The total height difference
is 680 m from the pool to the centre of the village.
This means that 6 5000litre plastic tanks on stands will have to be constructed to prevent the pressure
of building up. A class 12 HDPE pipe willhave to be used. This pipe will be vulnerable to vandalism and
veld fires and should be buried or protected.
The cost estimates are as follows:
The first 7km has a fairly flat slope and to be able to get at least 3000 litre per h a 50mm pipe will have
to be used. Cost R250 000
The last 5km can be a smaller pipeas the slope is much steeper –32mmHDPE Class 12: Cost R100 000
Installation for 12km at R150/m: Cost R1.8m This will very likely be much more than this estimate.
The 6 tanks are R5 000 each and their stands are about R10 000 each: Cost R 90 000
Erection of these tanks: cost R180 000
Contingencies:R180 000
Total estimated cost: R2.5m
Lepelle Water Issues Workshop 2
Introduction
The water committee attended a traditional council meeting. The agreement is still a 50kg bag of
cement per household. A committee members has been tasked with making a list of people interested
in access to water from the furrow, plus those who are willing to make a contribution. Another
meeting with the council planned after this feedback meeting from MDF
WRC K4/2719 Deliverable 5: Interim report; Refined decision support system for smallholder CSA-October 2018
46
The water committee was accepted by the TA and it now has 9 members. (4 more members added by
the TA)
A questions was asked whether MDF can assist with trying to raise funding: in answer MDF is in the
process of writing a proposal tothe Govt of Flanderswhich will leverage some funding (not a very
large amount, but enough to assist with the present plan) and also can write a proposal to a private
funder (details provided by Neville) who assist with community water projects.
The group reiterated that they also need assistance with planning and advice to do the repairs.
There was a question as to whether MDF and the engineer walked the whole length from start- end.
Apparently the furrowended much further along –below thesecond school and not at the first school
as presently indicated in the report back.
Comments on the screening of the movie
-We like it, but there was a lot of mention of drinking water (Did you only get the tip about
this needing to be agricultural water after you made the movie?)
-Also want to include the mango trees
-We can use it to attract funders for the water stuff
-The water committee and tribal authority should also have a copy
-If we use it for funder we need to do a lot of cuts to show how we use it for farming and not
“sharing the water with the baboons”.
-There is support for purifying this same water from government. The dept of Health (Matilda
Ledwaba) have done trainings on purification of water as part of a typhoid fever awareness
raising programme
-There is municipal water supply – 5 boreholes with pipes and taps. It is however not enough
and often the pumps break and then there is no water for long period
-We can share this movie with outside stakeholders- but it must be prettier first and we want
to see the updated version first
-We need some more shots of the impact of the shortage of water- some shots from the
“drier” side of the village would be good
-We should show some of the farming activities - may need some more footage of this as
there is some of George’s homestead and orchards only. We need to include all household
activities including making bricks, building, washing etc
-Want to include a bit more around the municipal supply
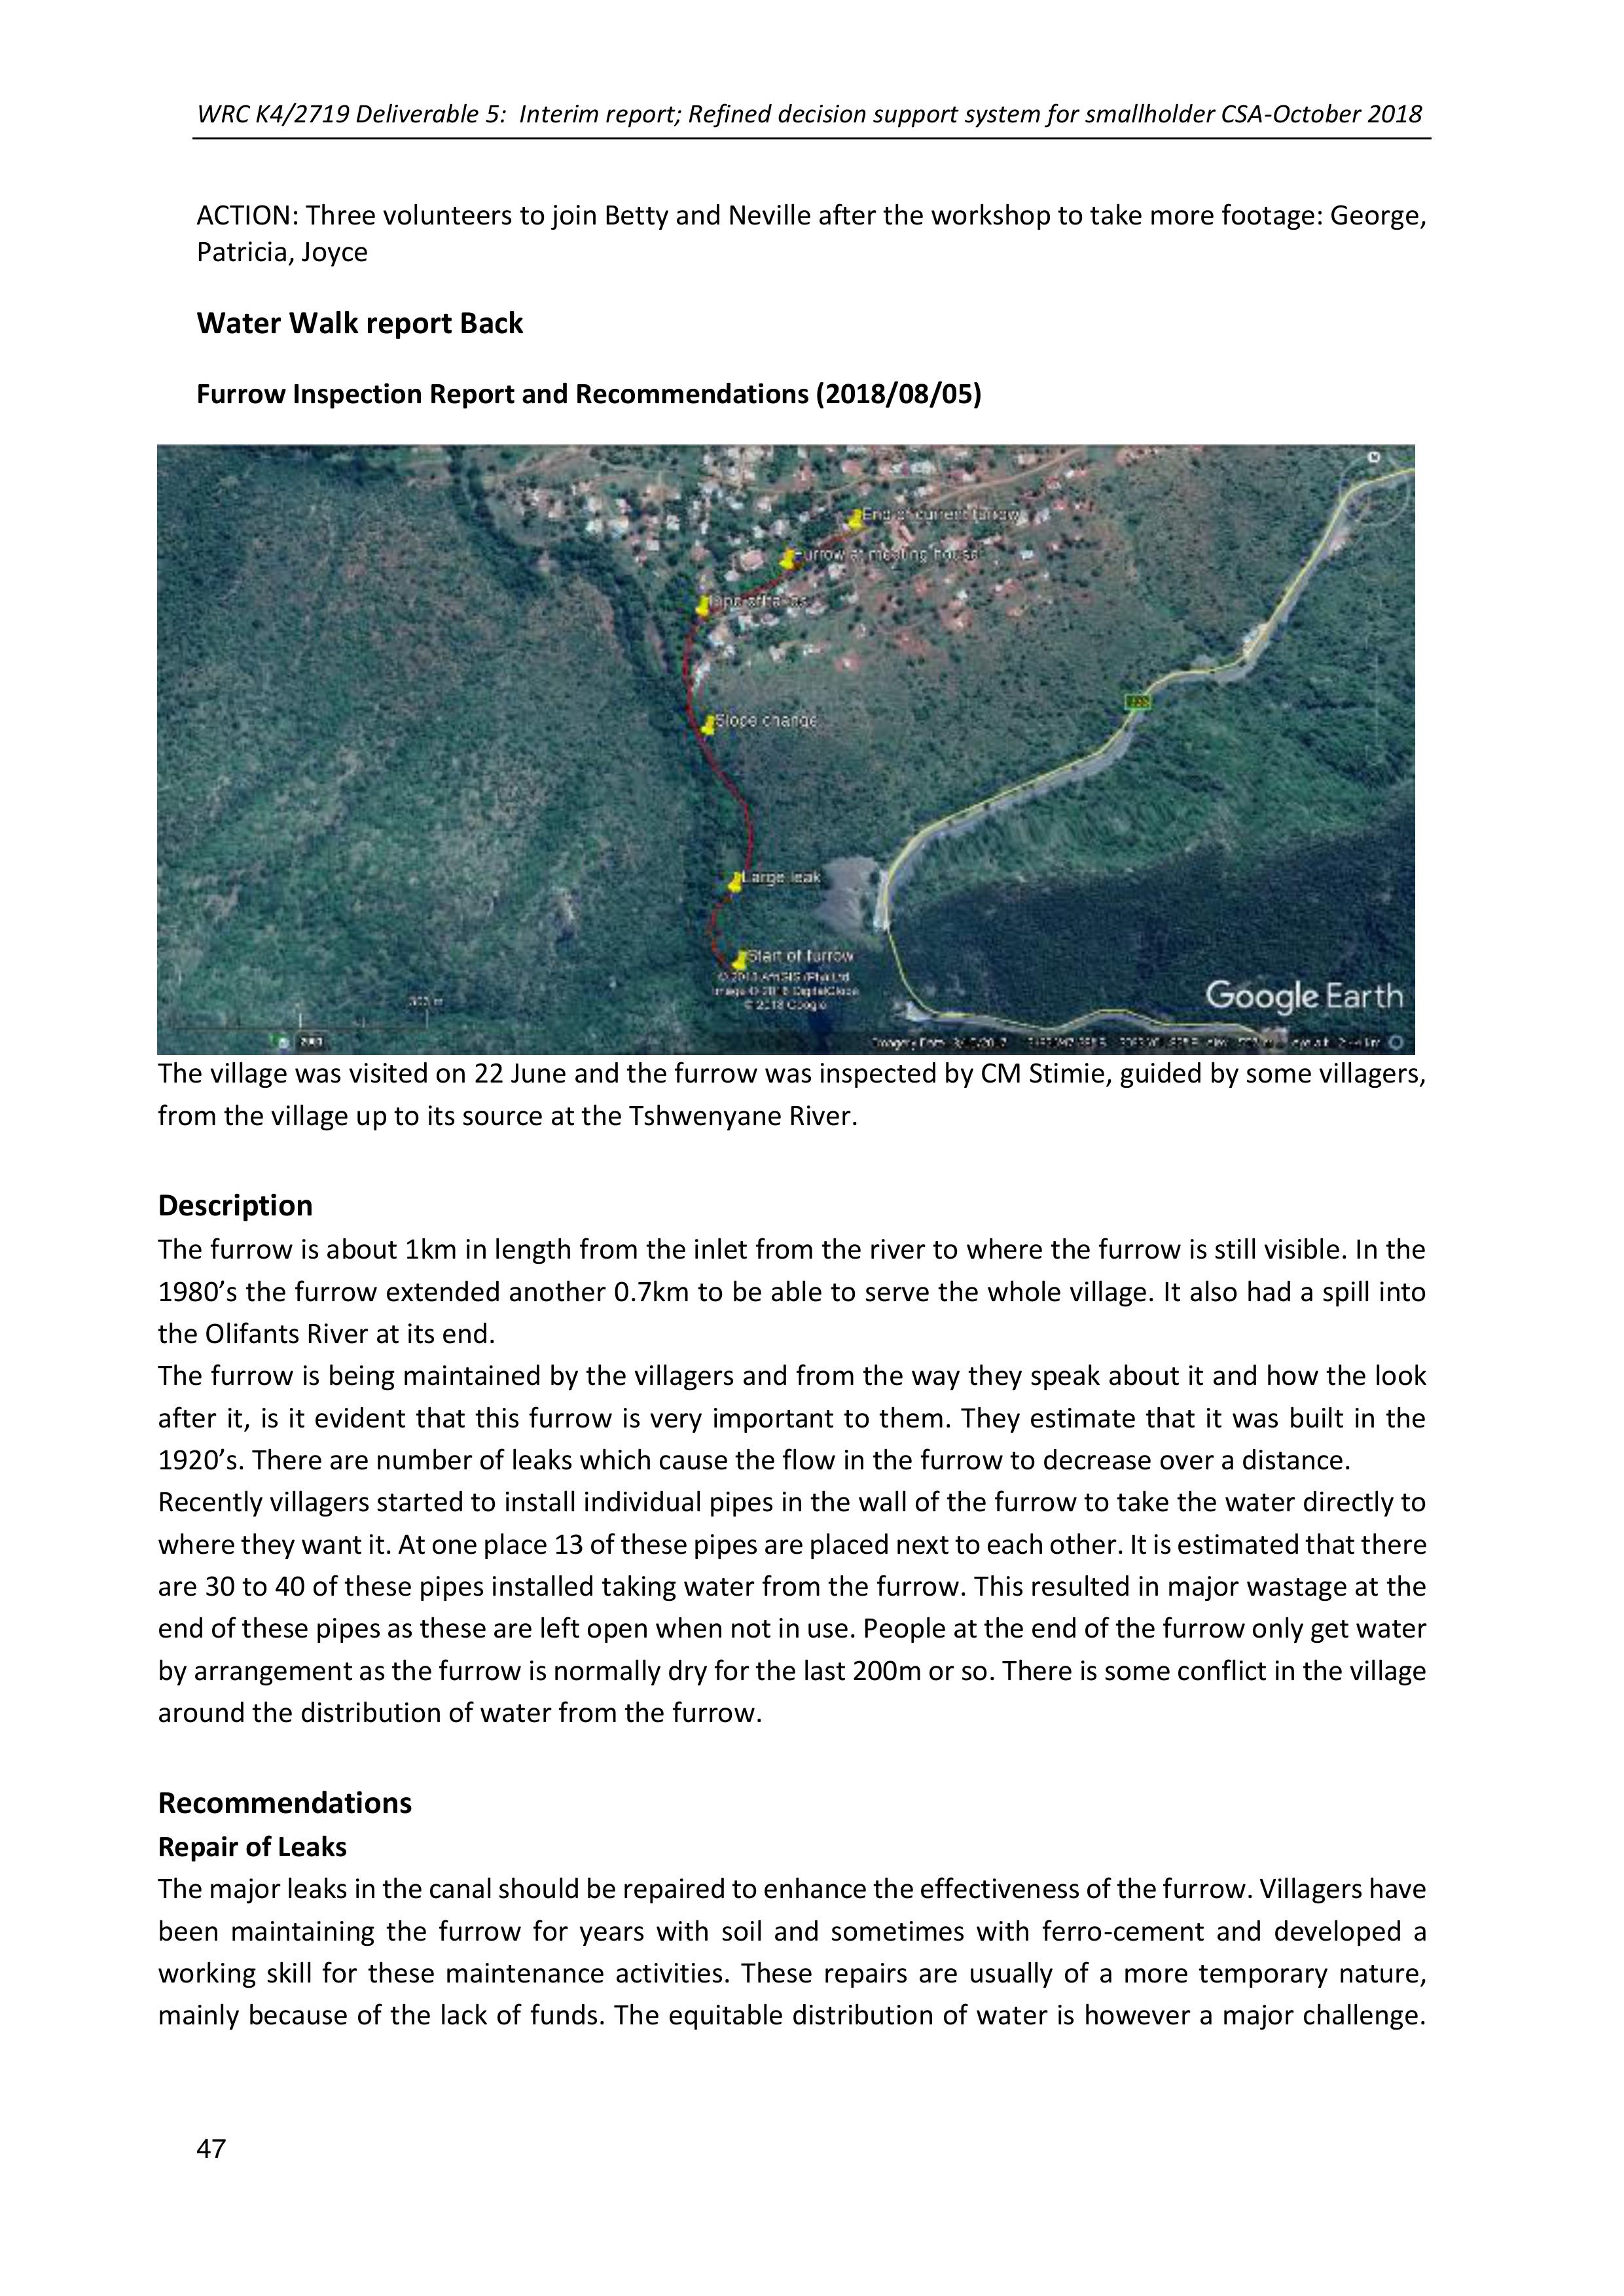
WRC K4/2719 Deliverable 5: Interim report; Refined decision support system for smallholder CSA-October 2018
47
ACTION: Three volunteers to join Betty and Neville after the workshop to take more footage: George,
Patricia, Joyce
Water Walk report Back
Furrow Inspection Report and Recommendations (2018/08/05)
The village was visited on 22 June and the furrow was inspected by CM Stimie, guided by some villagers,
from the village up to its source at the Tshwenyane River.
Description
The furrow is about 1km in length from the inlet from the river to where the furrow is still visible. In the
1980’s the furrow extended another 0.7km to beable to serve the whole village. It also had a spill into
the Olifants River at its end.
The furrow is being maintained by the villagers and from the way they speak about it and how the look
after it, is it evident that this furrow is very important to them. They estimate that it was built in the
1920’s. There are number of leaks which cause the flow in the furrow to decrease over a distance.
Recently villagers started to install individual pipes in the wall of the furrow to take the water directly to
where they want it. At one place 13 of these pipes are placed next to each other. It is estimated that there
are 30 to 40 of these pipes installed taking water from the furrow. This resulted in major wastage at the
end of these pipes as these are left open when not inuse. People at the end of the furrow only get water
by arrangement as the furrow is normally dry for the last 200m or so. There is some conflict in the village
around the distribution of water from the furrow.
Recommendations
Repair of Leaks
The major leaks inthe canal should be repairedto enhance theeffectiveness of thefurrow. Villagers have
been maintaining the furrow for years with soil and sometimes with ferro-cement and developed a
working skill for these maintenance activities. These repairs are usually of a more temporary nature,
mainly becauseof the lack of funds. The equitable distribution of water is however a major challenge.
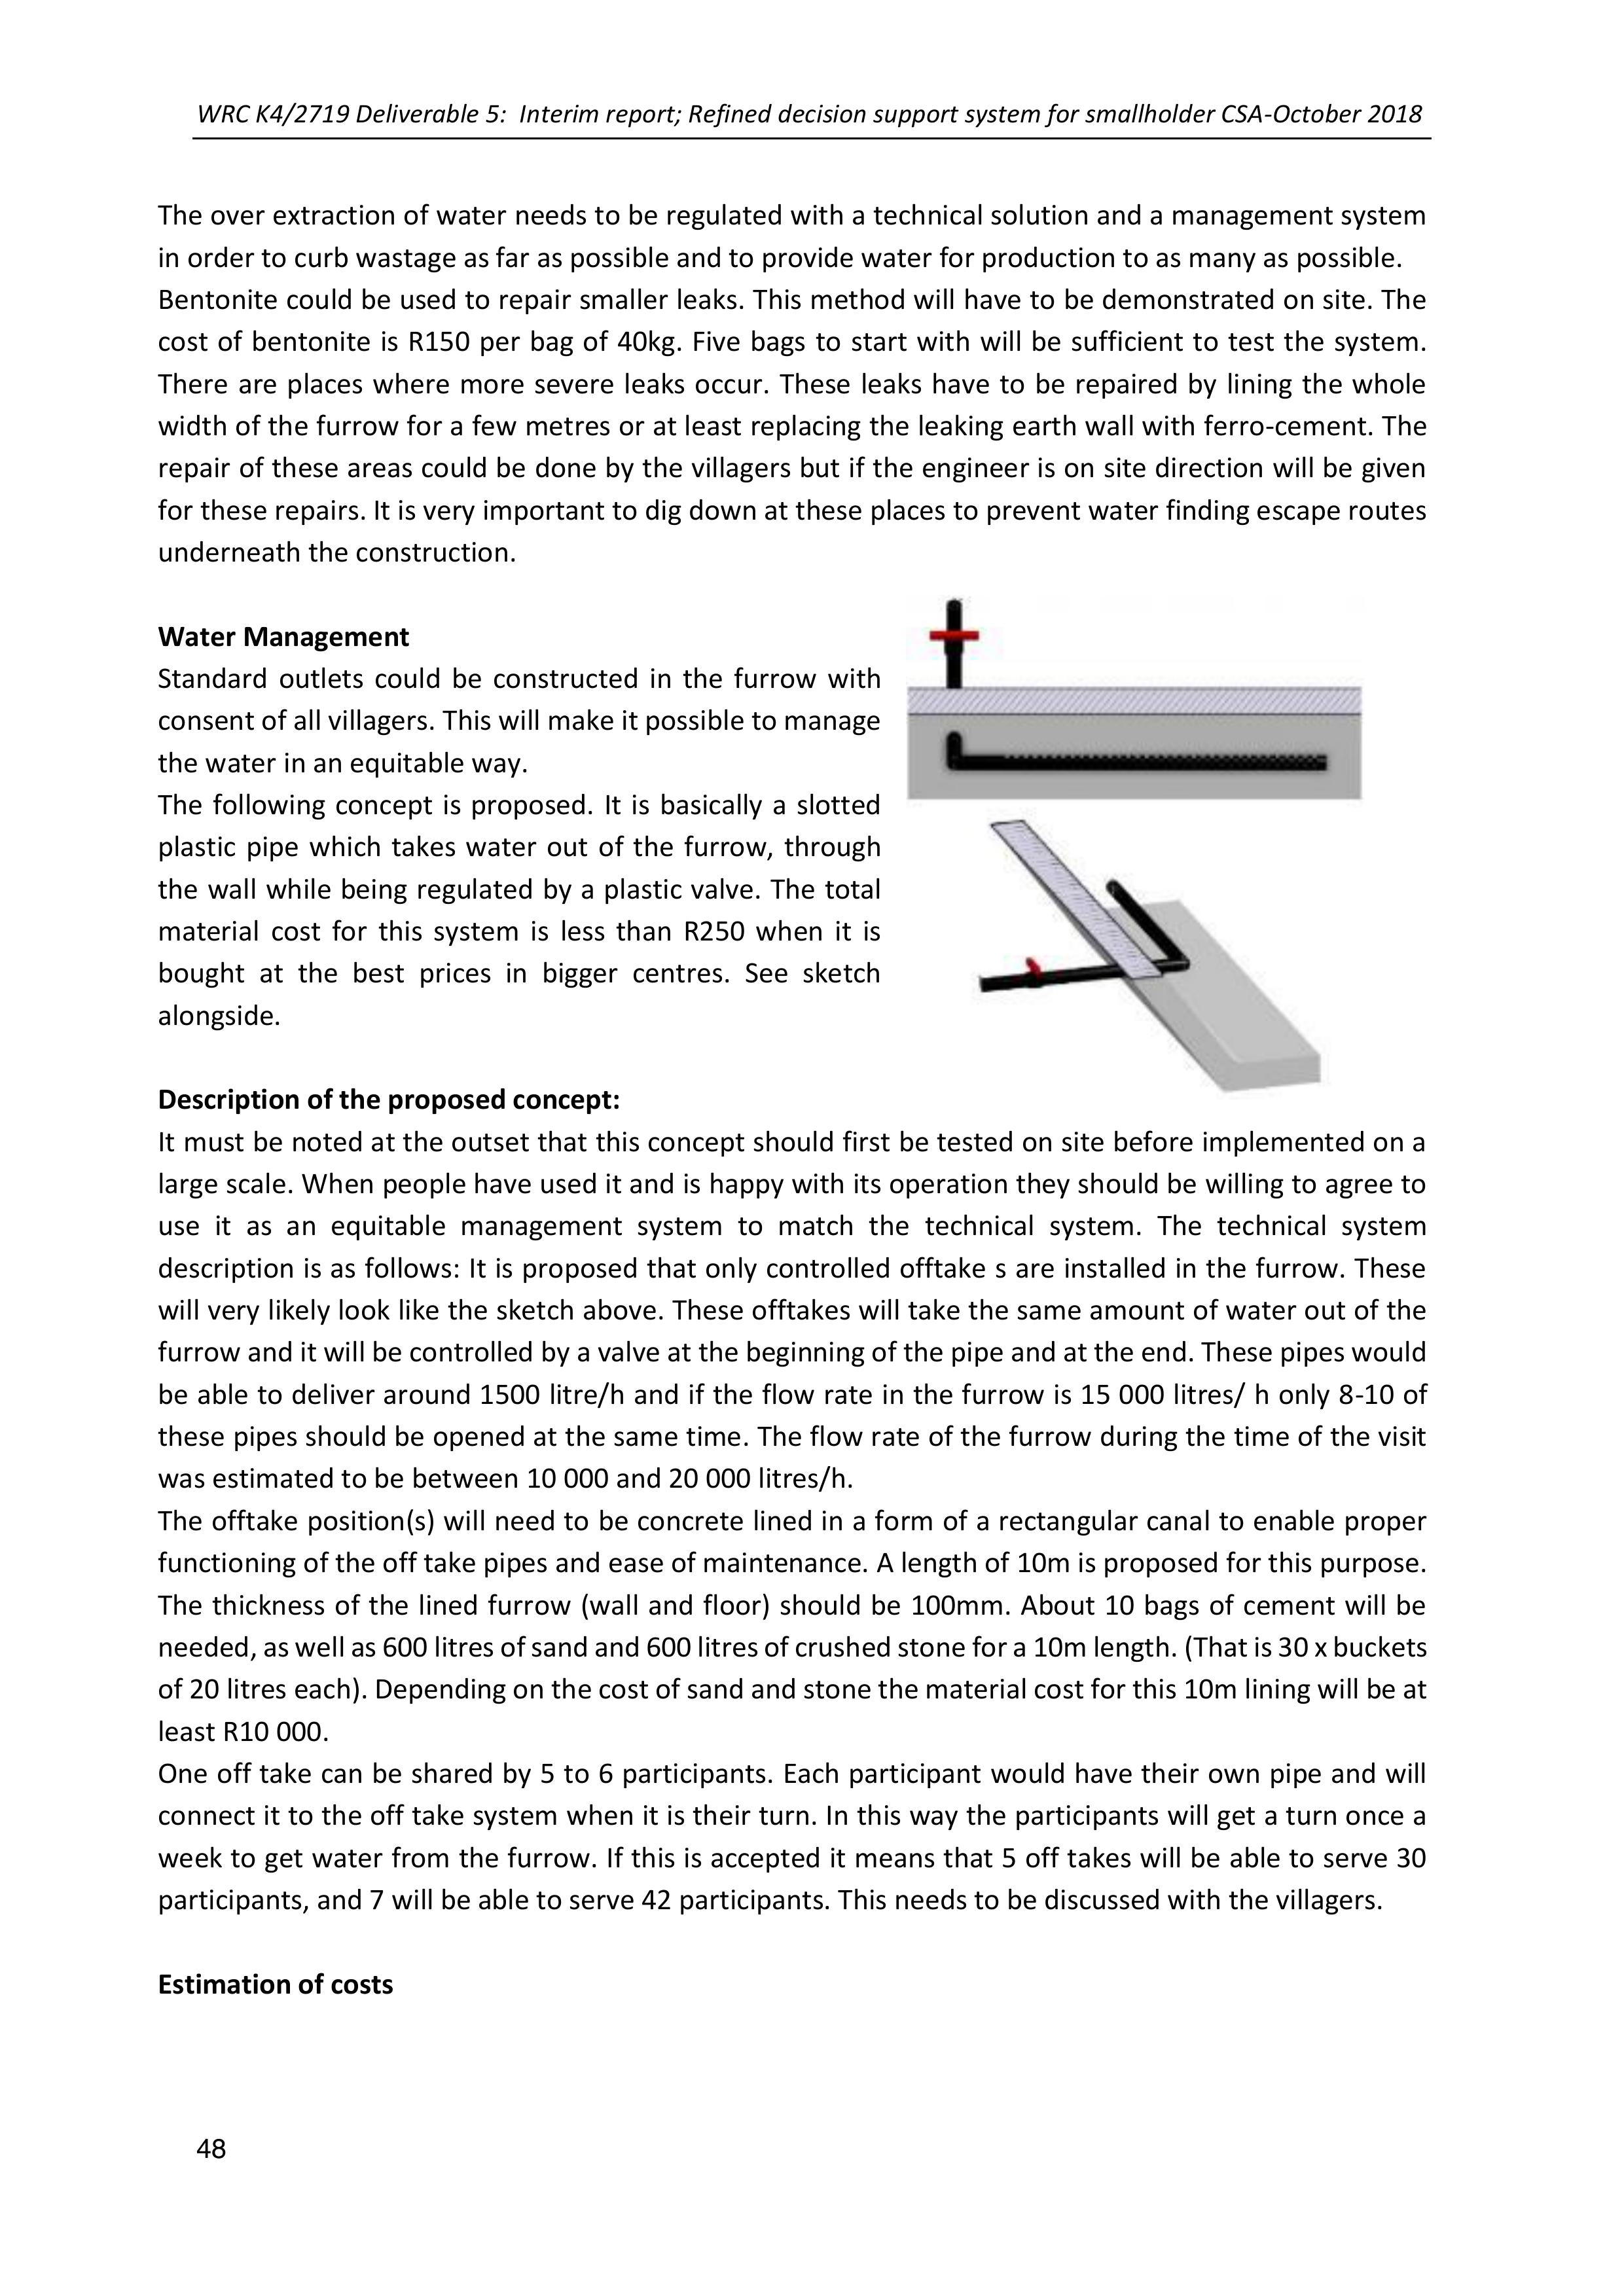
WRC K4/2719 Deliverable 5: Interim report; Refined decision support system for smallholder CSA-October 2018
48
The over extraction of water needs to be regulated with a technical solution and a management system
in order to curb wastage as far as possible and to provide water for production to as many as possible.
Bentonite could be used to repair smaller leaks. This method will have to be demonstrated on site. The
cost of bentonite is R150 per bag of 40kg. Five bags to start with will be sufficient to test the system.
There are places where more severe leaks occur. These leaks have to be repaired by lining the whole
width of the furrow for a few metres or at least replacing the leaking earth wall with ferro-cement. The
repair of these areas could be done by the villagers but if the engineer is on sitedirection willbe given
for these repairs. It is very important to dig down at these places to prevent water finding escape routes
underneath the construction.
Water Management
Standard outletscould be constructed inthefurrow with
consent of all villagers. This will make it possible to manage
the water in an equitable way.
The following concept is proposed. It is basically a slotted
plastic pipe which takes water out of the furrow, through
the wall while being regulated by a plastic valve. The total
material cost for this system is less than R250 when it is
bought at the best prices in bigger centres. See sketch
alongside.
Description of the proposed concept:
It must be noted at the outset that thisconcept should first be tested on site before implemented on a
large scale. When people have used it and is happy with its operation they should be willing to agree to
use it as an equitable management system to match the technical system. The technical system
description is as follows: It is proposed that only controlled offtake s are installed in the furrow. These
will very likely look like the sketch above. These offtakes will take the same amount of water out of the
furrow and it will be controlled by a valve at the beginning of the pipe and at the end. These pipes would
be able to deliver around 1500 litre/h and if the flow rate in the furrow is 15 000 litres/ h only 8-10 of
these pipes should be opened at the same time. The flow rate of the furrow during the time of the visit
was estimated to be between 10 000 and 20 000 litres/h.
The offtake position(s) will need to be concrete linedin a form of a rectangular canal to enable proper
functioning of the off take pipes and ease of maintenance. A length of 10m is proposed for this purpose.
The thickness of the lined furrow (wall and floor) should be 100mm. About 10 bags of cement will be
needed, as well as 600 litres ofsand and600litres of crushed stone for a 10m length. (That is 30 x buckets
of 20 litres each). Depending on the cost of sand and stone the material cost for this 10m lining will be at
least R10 000.
One off take can be shared by 5 to 6 participants. Each participant would have their own pipe and will
connect it to the off take system when it is their turn. In this way the participants will get a turn once a
week to get water from the furrow. If this is accepted it means that 5 off takes will be able to serve 30
participants, and 7 will be able to serve 42 participants. This needs to be discussed with the villagers.
Estimation of costs
WRC K4/2719 Deliverable 5: Interim report; Refined decision support system for smallholder CSA-October 2018
49
Item
description
Costs
Bentonite (powder clay)
4x40kg bags @R150
R600
Fix 2 large leaks in furrow
2 x Cement (4 bags, 240l sand, 240l
stones)
R8 000
Offtake basin; 100mm depth of floor
Cement (10 bags, 600 l sand, 600l
stones)
R10 000
Individual slotted pipes with valves
(40mm/50mm)
2 x Valves , fittings, 1m slotted pipe,
R250per participant x 40
R10 000
Summary and discussions
The furrow provides around 15 000l/hr. A 40mm valve
in the furrow provides for around 1 500l/hr, which is
around 30 000l ina 24hr period. If a 50mm pipe is used
this pulls out 9 500l/hr (225 000l/24hrs). As the overall
flow of the furrow is onlyaround 15 000l/hr 40mm
pipes are recommended. In this way10 pipescan be
placed in the furrow at a time.
Suggestions (cheaper version)
1. Make 8-10 permanent valves or off take points with taps at the offtake basin and at the household
(around R200/participant). As there are presently around 40 beneficiaries, it would mean each person
would have access to water for a 24hr period every 5-7 days
2. This would then require arranging for storage options at the households
3. Fix the offtake basin and cement in these valves as the first step (~R10000 ‘ 10 bags cement, 600l
of sand)
4. Then fix the main leaks in the furrow (R 8 000(cement, stone, sand) and R600 (bentonite)
5. First start with the existing beneficiaries and then think of expanding, when it becomes clear how
much water there is (once the leaks have been reduced)
COMMENTS
-Yes, to money rather than cement
-The more pipes there are the less flow there will be in the furrow. Then it cannot go far – so
the decision is around more pipes or longer furrow, but both are not possible. It also means
that those further away will need to have longer pipes and it will be more expensive for
them
-New people accept the idea of pipes and the greater expense.
-Once things start moving there will be a lot more people wanting water and that could be an
issue.
-The committee’s first suggestion was to use cement paving blocks in the furrow - why did
MDF not quote on that for the whole furrow?
-Our reason for taking the whole stream form the source is because of all the leaks. If we fix
the whole furrow then we can leave some of the water in the stream for the reserve
-The problem with not fixing the whole furrow is that leaks will develop again; crabs will
make holes in the banks etc
~40 people with pipes
~5 people using furrow directly
~30 new people who want to put in
pipes
WRC K4/2719 Deliverable 5: Interim report; Refined decision support system for smallholder CSA-October 2018
50
-We were hoping for the “expensive” version, but as it seems that this furrow can never
serve everybody in the community, the cheaper option may be better as a group activity, as
then we ca not be expected to provide water for everyone (without them contributing)
-We understand that this is a starting point, but most of the contributions have and are
coming from those who presently do not have access to the furrow – so that makes it
complicated.
-It is good to tackle the issues of leaking pipes as a start. And we should involve the
traditional authority. Individuals with leaking pipes need to fix those
-We must get a better sense of who the new people are and how many
-And we want to remove those not contributing.
-Generally, the idea of the permanent valves at the offtake basin is a good idea. But I think
each valve should have a t piece with 5 pipes linked in so that the pipes are there
permanently and people do not need to go and link their pipes to the valve every time
-We should start with the two big leaks first
-Regarding people who don’t contribute to
maintenance. We cannot forget this is a community
thing, so we need to work on ways that the committee
can enforce – its not as easy as removing pipes fo
those who did not contribute.
-The committee has to earned the power as yet. The
Traditional authority says it’s a communal thing. It still
ahs to be requested that it is managed by the water
committee and only those who pay have access to the
pipes
-Neville; if the committee is trusted by the community,
you get the mandate form them rather than the TA
-MDF contribution: Engineer’s time for 3-4 days and we
can match the community contribution
-Contribution in money rather than cement makes sense
-Still worry that section 2 above the road is not included. MDF; It is not – this is a separate
area with a different water source, different issues and will need to be tackled separately.
-Presently those who do not have water through the furrow still have hope to be included. It
DOES mean that they will have to buy pipes, but they feel that they have permission to sue
the water as it stands now
COMMUNITY HOMEWORK
-Go to the TA to do a report back – 1stweekend of September. _the plan is now based on
recommendations and also talk about how and when to make contributions
-Contribution equivalent to cement is ~R100
Make a list of potential participants and what they promise to contribute. We are hoping collect
around R4 000
MDF HOMEWORK
-Get Chris to draw up specific options for the leaks
-Lepelle will let us know when they are ready to do something practical. Chris can come back
for a few days to assist
-Mango training and fruit tree deliveries Sept-Oct. (Community need to be informed in
advance so that they can organise the cash for the trees (r25/tree)
PRIORITIZED ACTION PLAN
1. Those with pipes should
contribute to maintenance (not just
new people)
2. Pipes should have taps, so not run
all the time to save water
3. We need to get more water to be
able to provide access to new people
4. Fix leakages in existingpipes
5. Fix the main leaks in the furrow.
WRC K4/2719 Deliverable 5: Interim report; Refined decision support system for smallholder CSA-October 2018
51
4CSA PRACTICES / DECISION SUPPORT SYSTEM
By Catherine van den Hoof1 and Erna Kruger
1 Post- doctoral fellow at the global change research and sustainability Institute, WITS.
Dr van den Hoof has assisted us inframing the decision support system and developing a model for
this process, as the first step towards designing the web- based platform for this process.
Objectives of DSS
The objective of this decision support system is to assist the smallholder farmers in South Africa in
selecting appropriate options for management practices to sustain and increase farm productivity
given current biophysical environmental conditions; i.e. climate, soil and topography, as well as
farming practices and socio-economic conditions at the householdfarm level. The DSS considers
individual circumstances, needs and aspirations. The aim of the DSS is forindividual farmers or farming
collectives to be capacitated to strengthen their farming practices not only under current conditions
but also in the light of climate change impacts.
The proposed architecture allows different agricultural actors; i.e. farmers, experts and facilitators, to
participate in the decision flow.It is based on a participatory approach, with those actors, for the
identification of site-specific CSA interventions. The DSS has been built to be accessible to most
farmers. The data requiredas input for the DSS is either specialist technical information, which is freely
available, or information provided by the farmers themselves.
Development of DSS
The development of a DSS requires the identification of a range of technical and social criteria relevant
to thecontext, which decision-makersneedto analyse in order to reach their decisions.In our case
the set of criteria that helped to make informed decisions on management practices were the current
farming systems, thephysical environmental conditions, which limit theproductivity of the framing
systems, and the socio-economic background of the farmer, that together with the farming system
and the environmental conditions can limitthecapacity of the farmer to adoptspecific practices. Each
of these above-mentionedfactorsneed to be translated into proxies that can be used asindicators
for those complex realities. Besides this, the resources and related management strategies as well as
a list of practices need to be provided as input to the system.
All information, except the physical environment; i.e. climate, soil and topography, and the resources
and management strategies, were derived through the useof a range of participatory approaches.
The practices have been identified by both farmers (traditional or local practices) and experts. Data
on the physical environmental conditions are by default taken from datasets freely available online.
This information can however be customised by the DSS user, in case more appropriate information
is available for the specific farmer concerned.
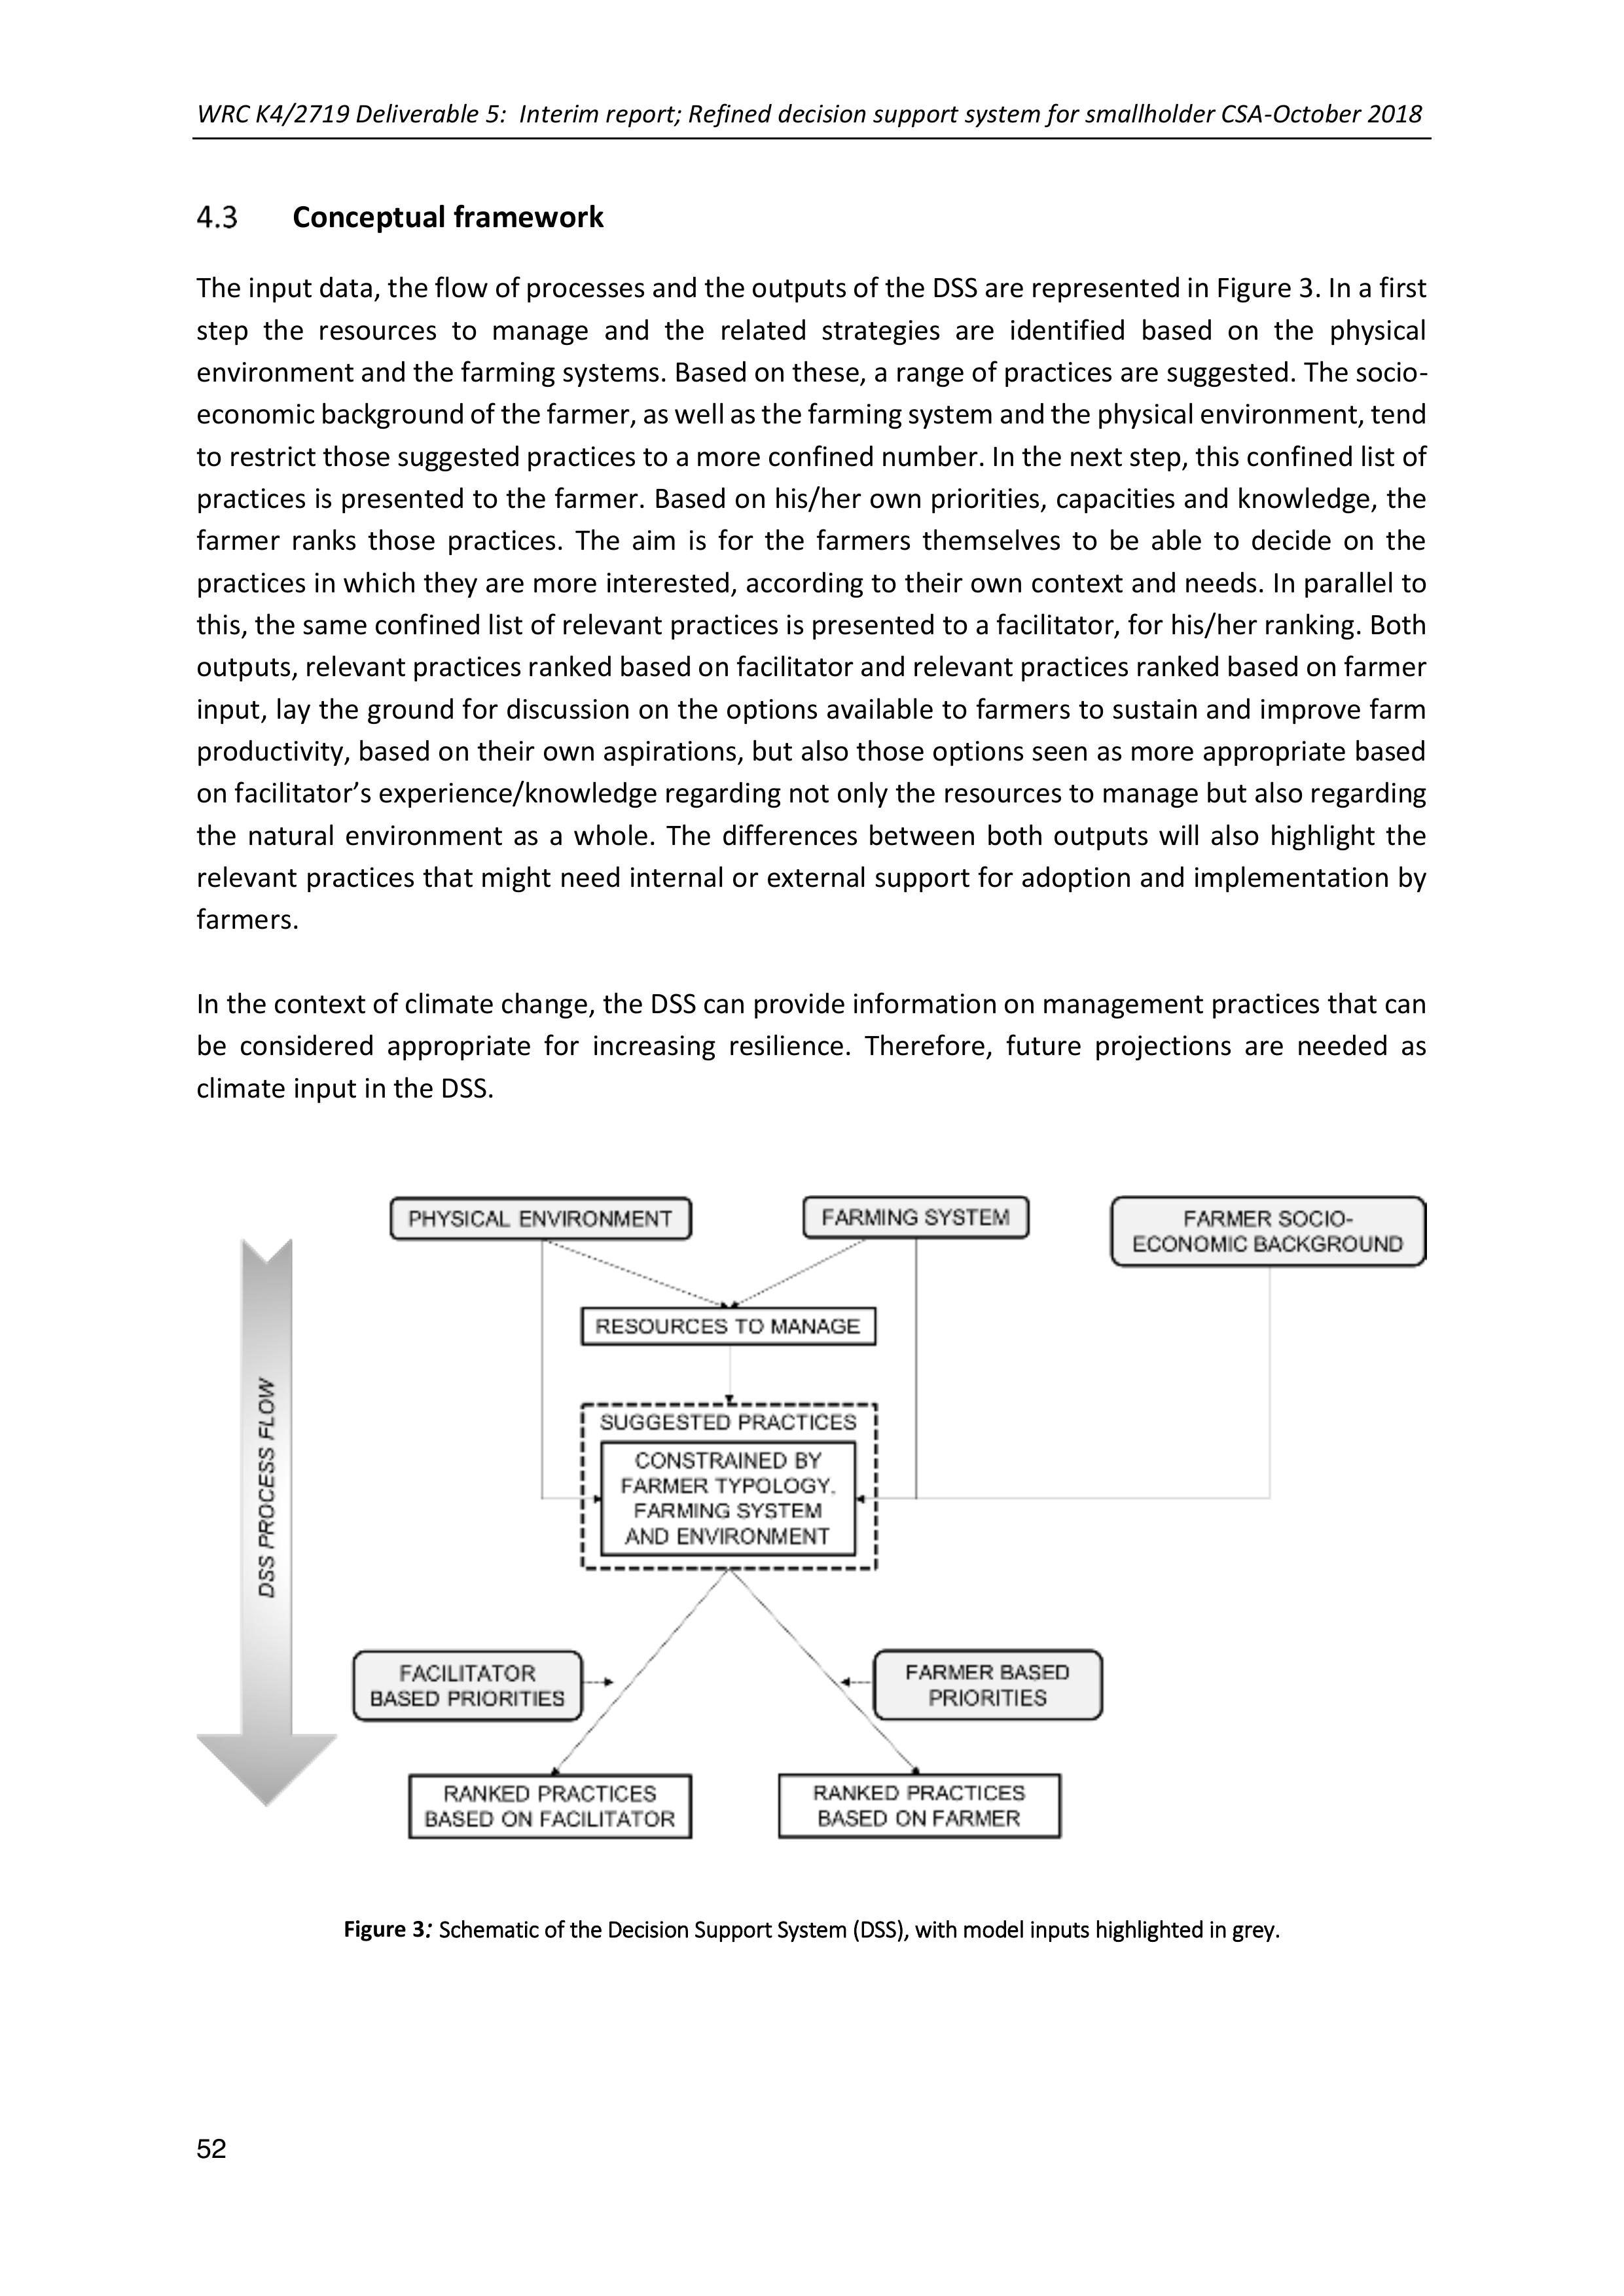
WRC K4/2719 Deliverable 5: Interim report; Refined decision support system for smallholder CSA-October 2018
52
Conceptual framework
The input data, the flow of processes and the outputs of the DSS are represented in Figure 3. In a first
step the resources to manage and the related strategiesare identified based on the physical
environment and the farming systems. Based on these, a range of practices are suggested. The socio-
economic background of the farmer, as well as thefarming system andthe physical environment, tend
to restrict those suggested practices to a more confined number. In the next step, this confined list of
practices is presented to the farmer. Based on his/her own priorities, capacities and knowledge, the
farmer ranks those practices. The aim is for the farmers themselves to be able to decide on the
practices in which they are more interested, according to their own context and needs. In parallel to
this, the same confined list of relevant practices is presented to a facilitator, for his/her ranking. Both
outputs, relevant practices ranked based on facilitator and relevant practices ranked based on farmer
input, lay the ground for discussion on the options available to farmers to sustain and improve farm
productivity, based on their own aspirations, but also those options seen as more appropriate based
on facilitator’s experience/knowledge regarding not only the resources to manage but also regarding
the natural environment as a whole. The differences between both outputs will also highlight the
relevant practices that might need internal or external support for adoption and implementation by
farmers.
In the context of climate change, the DSS can provide information on management practices that can
be consideredappropriate for increasing resilience. Therefore, future projections are neededas
climate input in the DSS.
Figure 3: Schematic of the Decision Support System (DSS), with model inputs highlighted in grey.
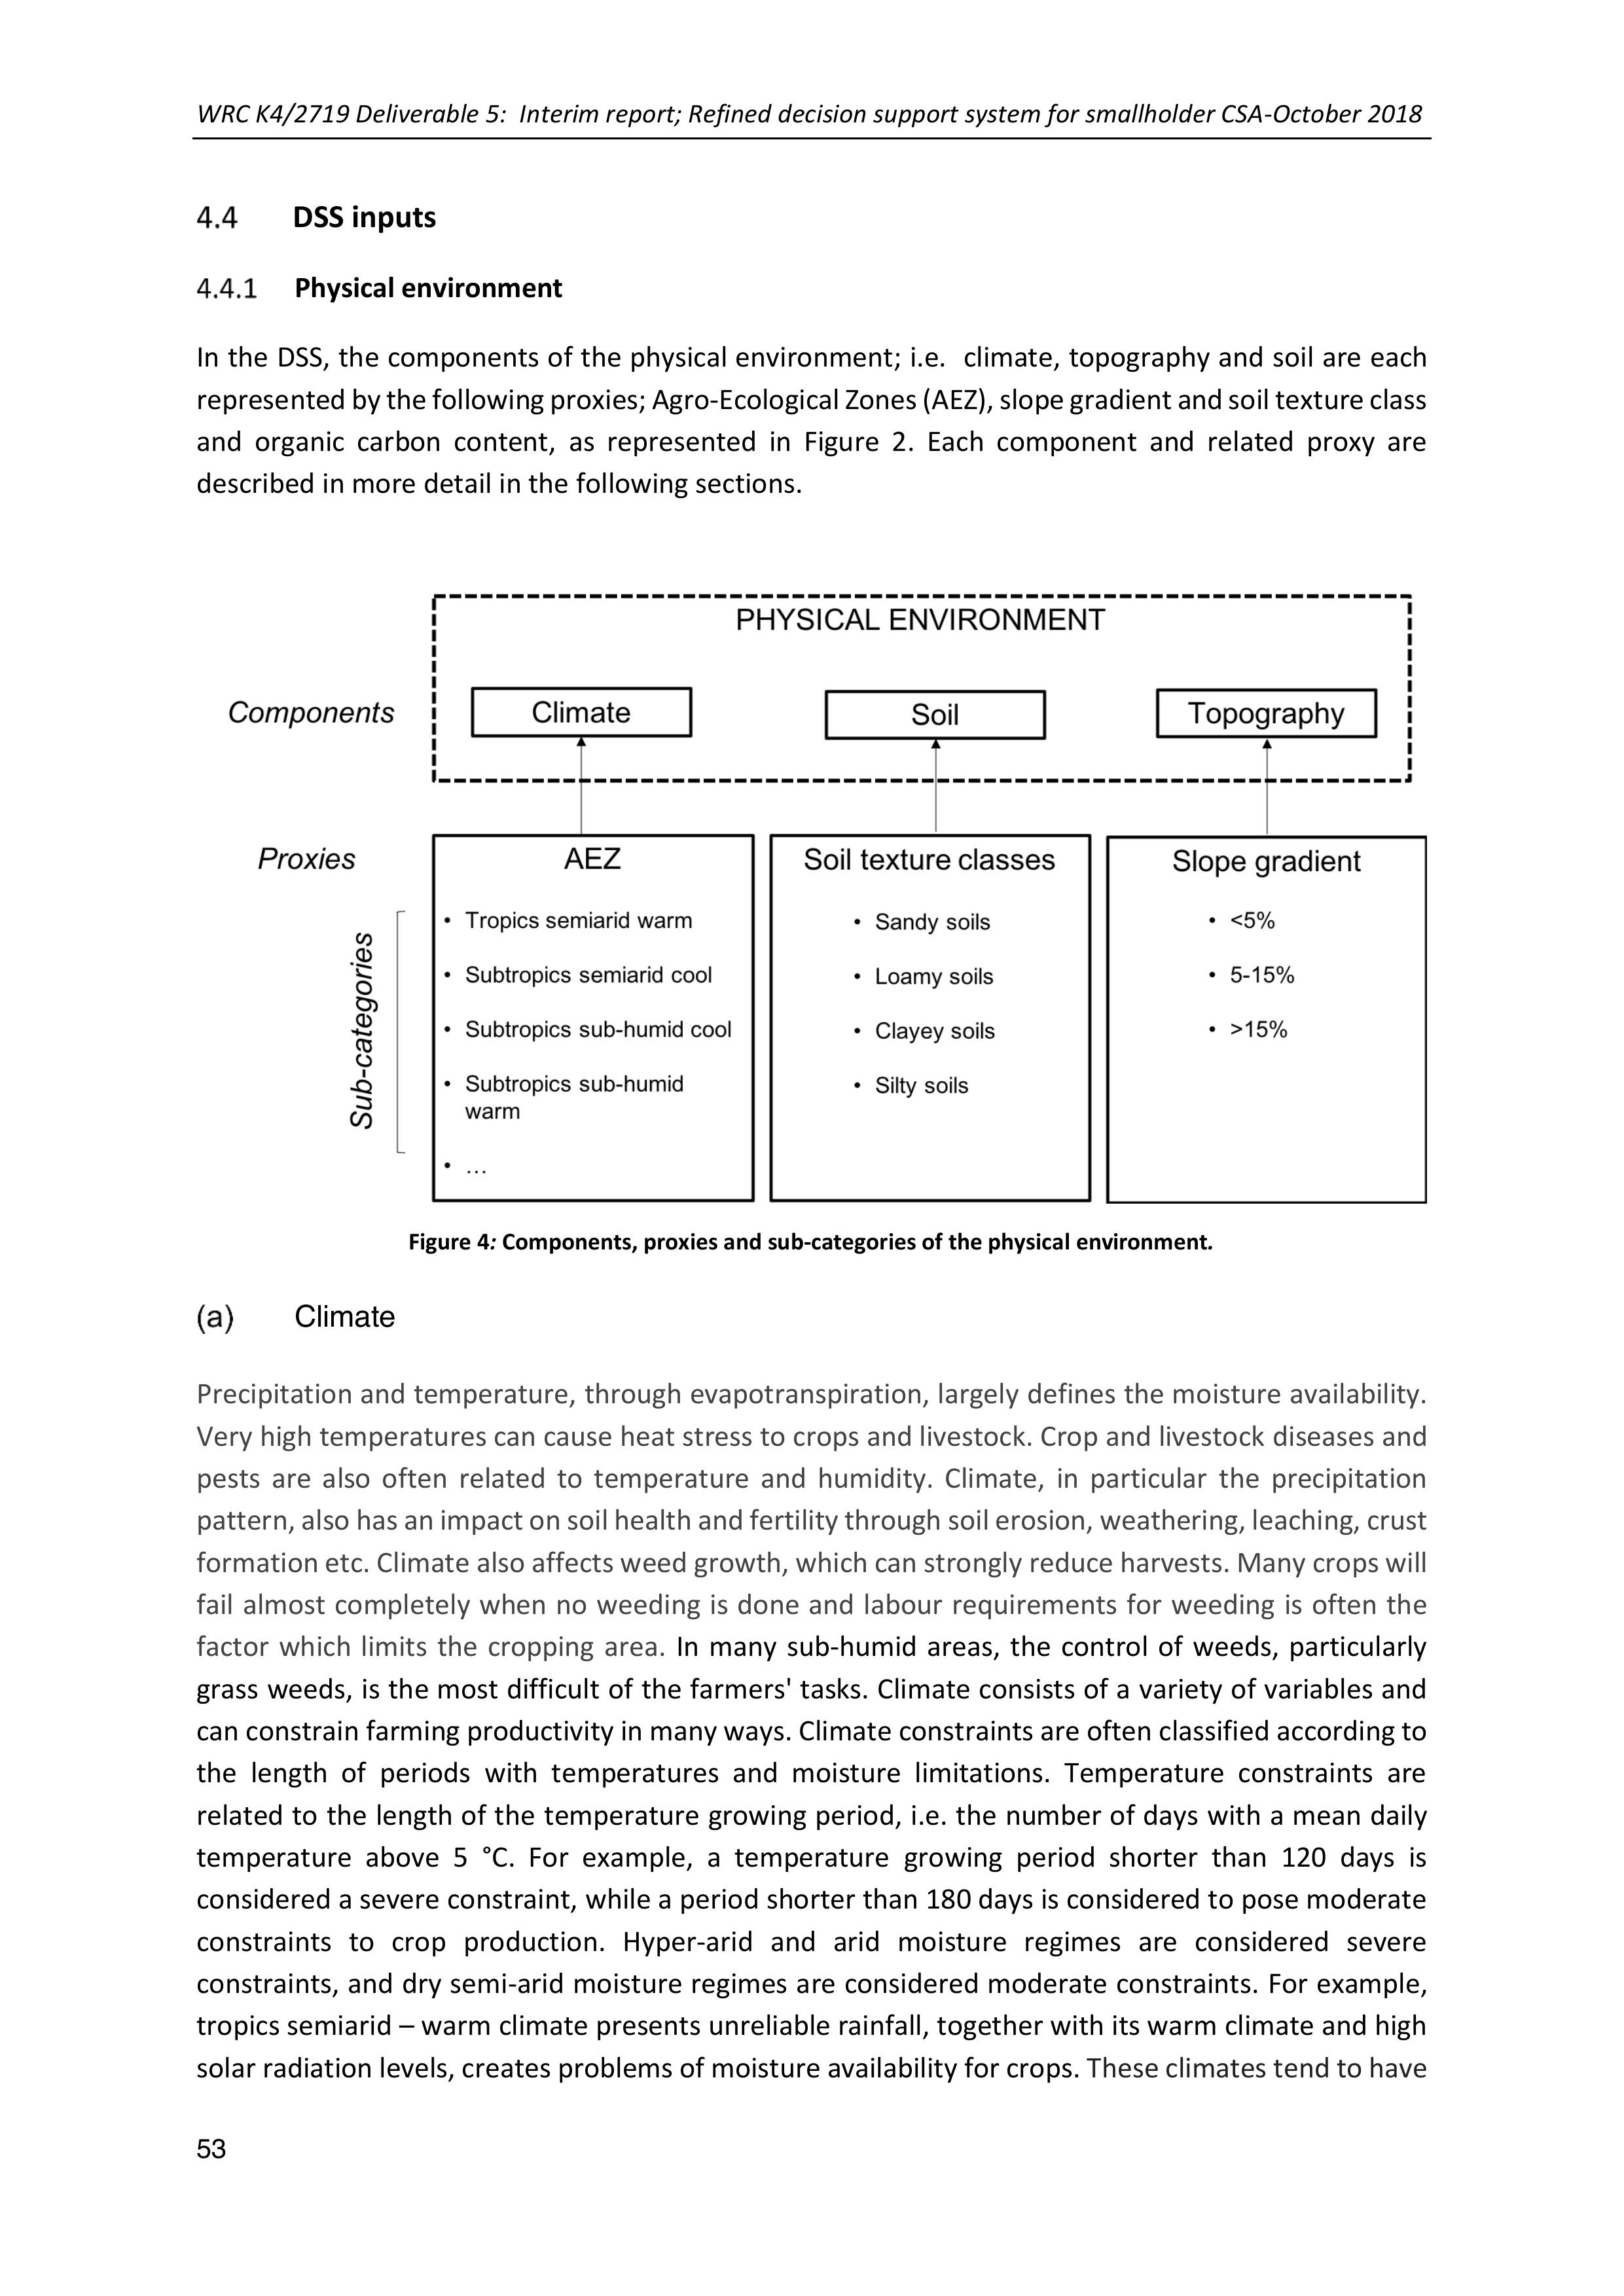
WRC K4/2719 Deliverable 5: Interim report; Refined decision support system for smallholder CSA-October 2018
53
DSS inputs
Physical environment
In the DSS, the components of the physical environment; i.e. climate, topography and soil are each
represented by the following proxies; Agro-Ecological Zones (AEZ), slope gradient and soil texture class
and organic carbon content, as represented in Figure 2. Each component and related proxy are
described in more detail in the following sections.
Figure 4: Components, proxies and sub-categories of the physical environment.
Climate
Precipitation and temperature, through evapotranspiration,largely defines the moistureavailability.
Very high temperatures can cause heat stress to crops and livestock. Crop and livestock diseases and
pests are also often related to temperature and humidity. Climate, inparticular the precipitation
pattern, also has an impact on soil health and fertility through soil erosion, weathering, leaching, crust
formation etc. Climate also affects weed growth, which can strongly reduce harvests. Many crops will
fail almost completely when no weeding is done and labour requirements for weeding is often the
factor which limits the cropping area. In many sub-humid areas, the control of weeds, particularly
grass weeds, is the most difficult of the farmers' tasks. Climate consists of a variety of variables and
can constrain farming productivity in many ways. Climate constraints are often classified according to
the length of periods with temperatures and moisture limitations. Temperature constraints are
related to the length of the temperature growing period, i.e. the number ofdays with a mean daily
temperature above 5 °C. For example, a temperature growing period shorter than 120 days is
considered a severe constraint, while a period shorter than 180 days is considered to pose moderate
constraints to crop production. Hyper-arid and arid moisture regimes areconsidered severe
constraints, and dry semi-arid moistureregimes are considered moderate constraints. For example,
tropics semiarid – warm climate presents unreliable rainfall, together with its warm climate and high
solar radiation levels, creates problems of moisture availability for crops. These climates tend to have
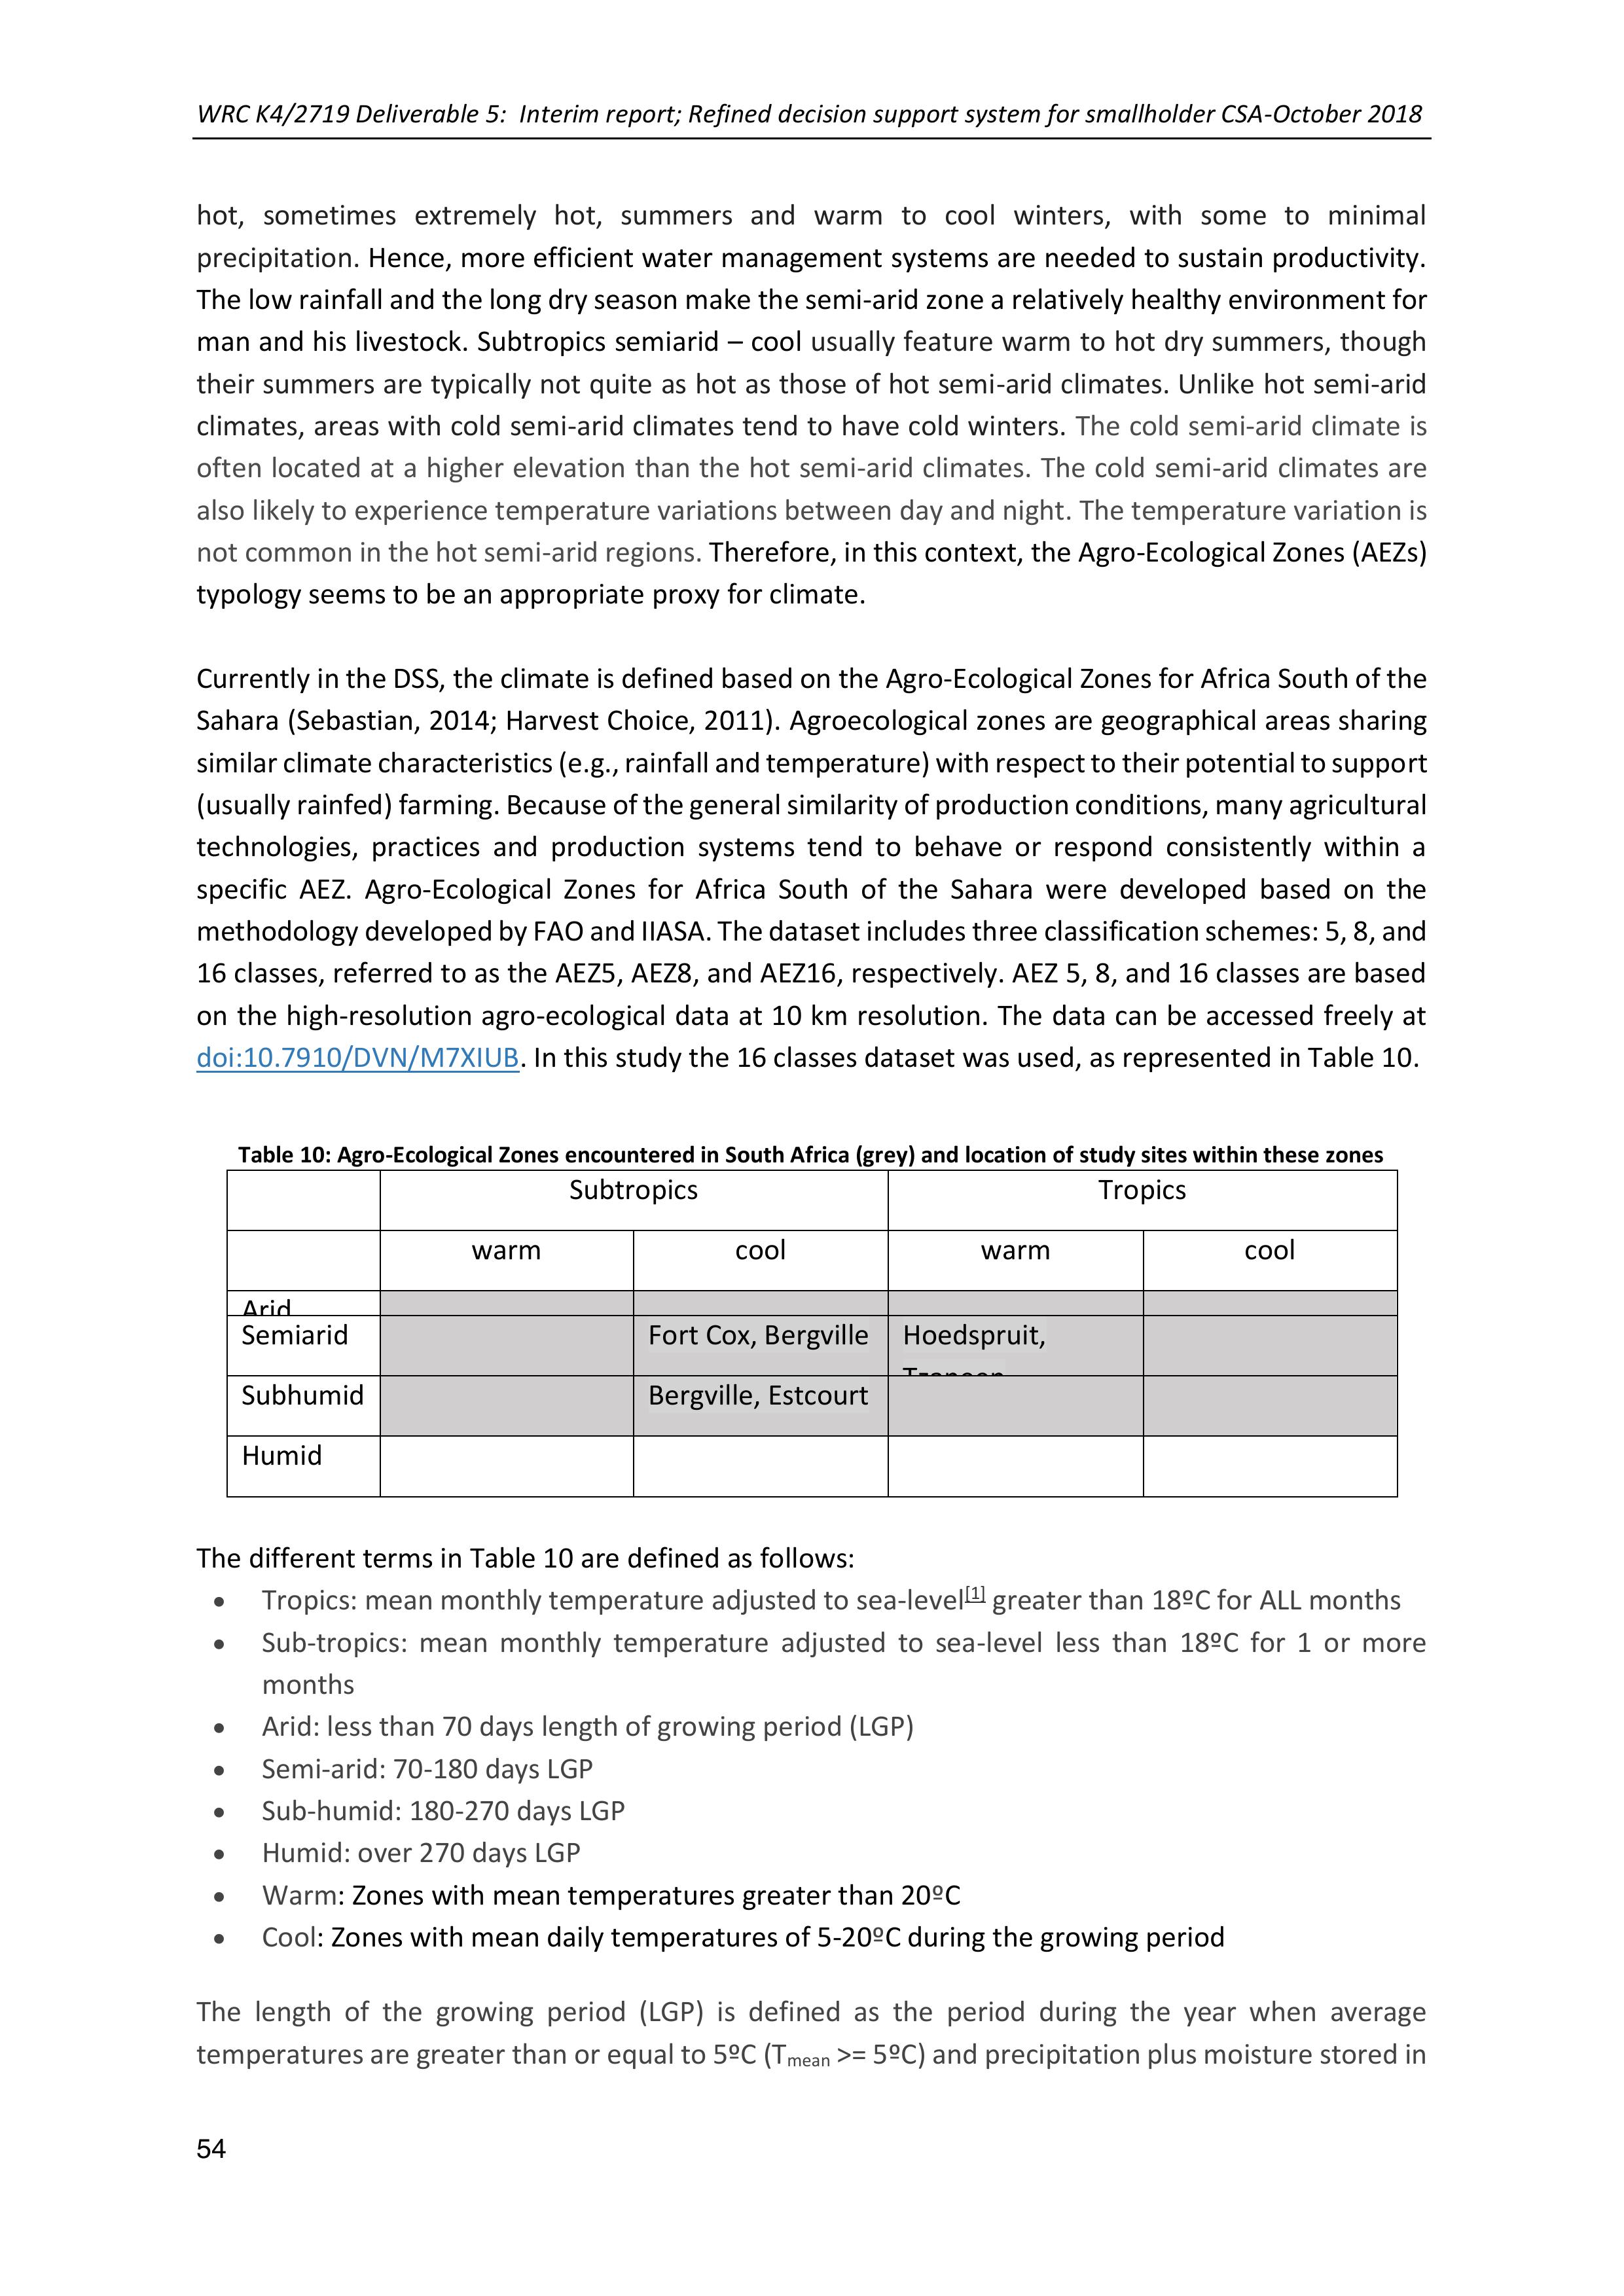
WRC K4/2719 Deliverable 5: Interim report; Refined decision support system for smallholder CSA-October 2018
54
hot, sometimes extremely hot, summers and warm to cool winters, with some to minimal
precipitation. Hence, more efficient water management systems are needed to sustain productivity.
The low rainfall and the long dry season make the semi-arid zone a relatively healthy environment for
man and his livestock. Subtropics semiarid– cool usually feature warm to hot dry summers, though
their summers are typically not quite as hot as those of hot semi-arid climates. Unlike hot semi-arid
climates, areas with cold semi-arid climates tend to have cold winters. The cold semi-arid climate is
often located at a higher elevation than the hot semi-arid climates. The cold semi-arid climates are
also likely to experience temperature variations between day and night. The temperature variation is
not common in the hot semi-arid regions. Therefore, in this context, the Agro-Ecological Zones (AEZs)
typology seems to be an appropriate proxy for climate.
Currently in the DSS, the climate is defined based on the Agro-Ecological Zones for Africa South of the
Sahara (Sebastian, 2014; Harvest Choice, 2011). Agroecologicalzones are geographical areas sharing
similar climate characteristics (e.g., rainfall and temperature) with respect to their potential to support
(usually rainfed) farming. Because of thegeneralsimilarity ofproductionconditions, manyagricultural
technologies, practices and production systems tend to behave or respond consistently within a
specific AEZ. Agro-Ecological Zones for Africa South of the Sahara were developed based on the
methodology developed byFAO and IIASA. The dataset includes three classification schemes: 5, 8, and
16 classes, referred to as the AEZ5, AEZ8, and AEZ16, respectively. AEZ 5, 8, and 16 classes are based
on the high-resolution agro-ecological data at 10 km resolution. The data can be accessed freely at
doi:10.7910/DVN/M7XIUB. In this study the 16 classes dataset was used, as represented in Table 10.
Table 10: Agro-Ecological Zones encountered in South Africa (grey) and location of study sites within these zones
Subtropics
Tropics
warm
cool
warm
cool
Arid
Semiarid
Fort Cox, Bergville
Hoedspruit,
Tzaneen
Subhumid
Bergville, Estcourt
Humid
The different terms in Table 10 are defined as follows:
•Tropics: mean monthly temperature adjusted to sea-level[1] greater than 18ºC for ALL months
•Sub-tropics: mean monthly temperature adjusted to sea-level less than 18ºC for 1or more
months
•Arid: less than 70 days length of growing period (LGP)
•Semi-arid: 70-180 days LGP
•Sub-humid: 180-270 days LGP
•Humid: over 270 days LGP
•Warm: Zones with mean temperatures greater than 20ºC
•Cool: Zones with mean daily temperatures of 5-20ºC during the growing period
The length of the growing period (LGP) is defined as the period during the year when average
temperatures are greater than or equal to 5ºC (Tmean >= 5ºC) and precipitation plus moisture stored in
WRC K4/2719 Deliverable 5: Interim report; Refined decision support system for smallholder CSA-October 2018
55
the soil exceed half the potential evapotranspiration (P > 0.5PET). A normal growing period is defined
as one when there is an excess of precipitation over PET (i.e. a humid period). Such a period meets the
full evapotranspiration demands of crops and replenishes the moisture definite of the soil profile. An
intermediate growing period is defined as one in which precipitation does not normally exceed PET
but does for part of the year. No growing period is when temperatures are not conducive to crop
growth or P never exceeds PET (FAO 1978).
South Africacovers 12 different AEZ. These arehighlighted in grey In Table 1. The sites currently
covered in this study arelocated in three of these 12 AEZs: i.e.tropics semiarid –warm, subtropics
semiarid – cool and subtropics subhumid – cool. Those are also represented in Table 10.
The geographical distribution of these AEZ have been delineated based on the averageclimate
between 1961 and 1990, using the data from the Climate Research Unit (CRU) at the University of East
Anglia and the data from VASClimO (Variability Analysis of Surface Climate Observations),a joint
climate research project of the German Weather Service (Global Precipitation Climatology Centre ‐
GPCC) and the Johann Wolfgang Goethe‐University Frankfurt (Institute for Atmosphere and
Environment ‐ WorkingGroup for Climatology). The data can be accessed from the
http://gaez.fao.org/ website.
Concerning future climateprojections, various available climate predictions of General Circulation
Models (GCM) were used for characterization of future climates. The geographical distribution of the
AEZ under future projections are based on four major GCMs andcover a range of IPCC emission
scenarios. GCM model outputs for individual climate attributes were applied as follows: deviations of
the monthly means of three 30-year periods (the 2020s: years 2011-2040; the 2050s: years 2041-2070;
and the 2080s: years 2071-2100) from the GCM ‘baseline’ climate were calculatedfor each grid of the
respective GCMs, interpolated to 30 arc-minute resolution and subsequently applied to the CRU
baseline climatology (1961-1990) to represent respective future climates.
Most scenarios for southern Africa suggest increasing temperatures, and associated increases in
evapotranspiration, with less certainty over changes in precipitation (IPCC 2007; Cooper et al. 2008;
Bryan et al. 2013). Rainfall is generally expected to become more erratic, with delayed onsets, with
increases in both inter- andintra-seasonal droughts, and with more frequent and intense flood events
(Cooper et al. 2008; Twomlow et al. 2008; IPCC, 2014). Climate change will amplify existing stress on
water availability and on agricultural systems, particularly in semi- arid environments (IPCC, 2014).
Given those projected increases in variability, it is suggested not only to account for change in mean
but also in interannual variability; increasing variability and unpredictabilitywill increase the
vulnerability of the farmers to climate.
Soil
Soil texture and organic matter content are important soil characteristics that influence water quantity
and soil fertility and health. Soil organic matter affects the chemical and physical properties of the soil
and its overall health by providing nutrients and habitat to organisms living in the soil, its composition
and breakdown rate, which affect the soil structure and porosity, the water infiltration rate and
moisture holding capacity of soils; the diversity and biological activity of soil organisms; and plant
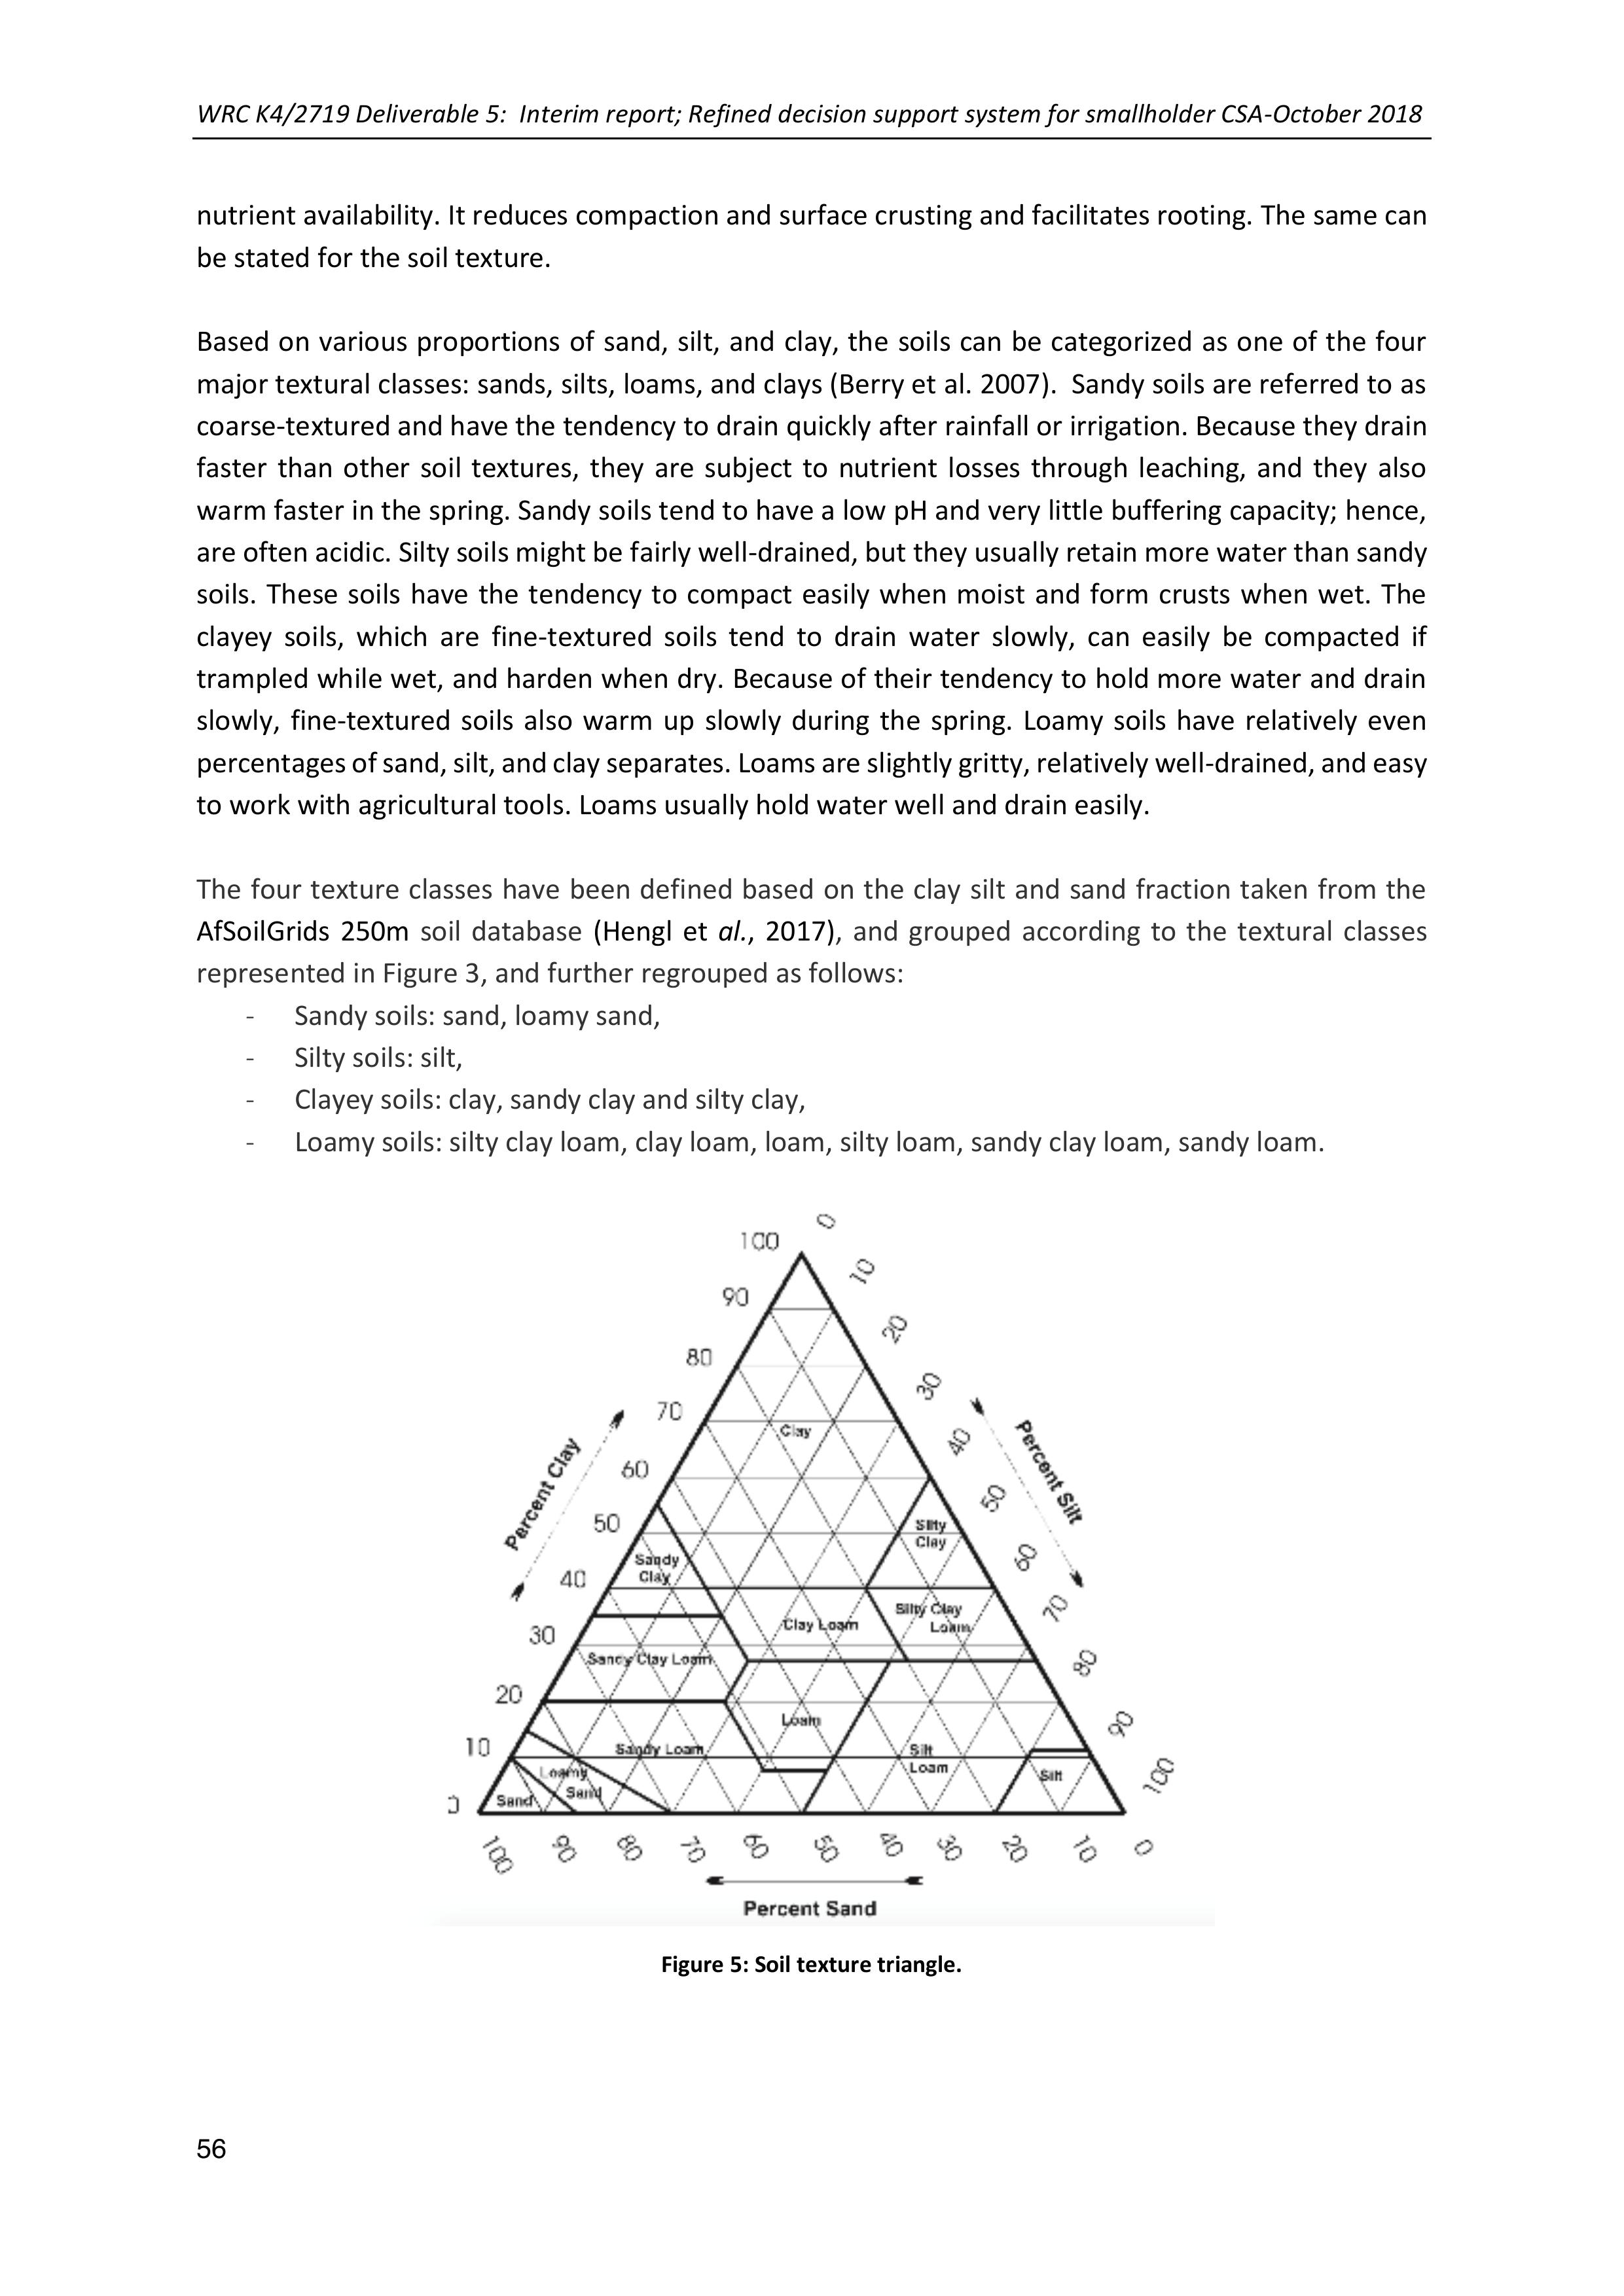
WRC K4/2719 Deliverable 5: Interim report; Refined decision support system for smallholder CSA-October 2018
56
nutrient availability. It reduces compaction and surface crusting and facilitates rooting. The same can
be stated for the soil texture.
Based on various proportions of sand, silt, and clay,the soils can be categorized as one of the four
major textural classes: sands, silts, loams, and clays (Berry et al. 2007). Sandy soils are referred to as
coarse-textured and have the tendency to drain quickly after rainfall or irrigation. Because they drain
faster than other soil textures, they are subject to nutrient losses through leaching, and they also
warm faster in the spring. Sandy soils tend to have a low pH and very little buffering capacity; hence,
are often acidic. Silty soils might be fairly well-drained, but they usually retain more water than sandy
soils. These soils have the tendency to compact easily when moist and form crusts when wet. The
clayey soils, which are fine-textured soils tend to drain water slowly, can easily be compacted if
trampled while wet, and harden when dry. Because of their tendency to hold more water anddrain
slowly, fine-textured soils also warm up slowly during the spring. Loamy soils have relativelyeven
percentages of sand, silt, and clay separates. Loams are slightly gritty, relatively well-drained, and easy
to work with agricultural tools. Loams usually hold water well and drain easily.
The four texture classes havebeen defined based on the clay silt and sandfraction taken from the
AfSoilGrids 250m soil database (Hengl et al., 2017), and grouped according to the textural classes
represented in Figure 3, and further regrouped as follows:
-Sandy soils: sand, loamy sand,
-Silty soils: silt,
-Clayey soils: clay, sandy clay and silty clay,
-Loamy soils: silty clay loam, clay loam, loam, silty loam, sandy clay loam, sandy loam.
Figure 5: Soil texture triangle.
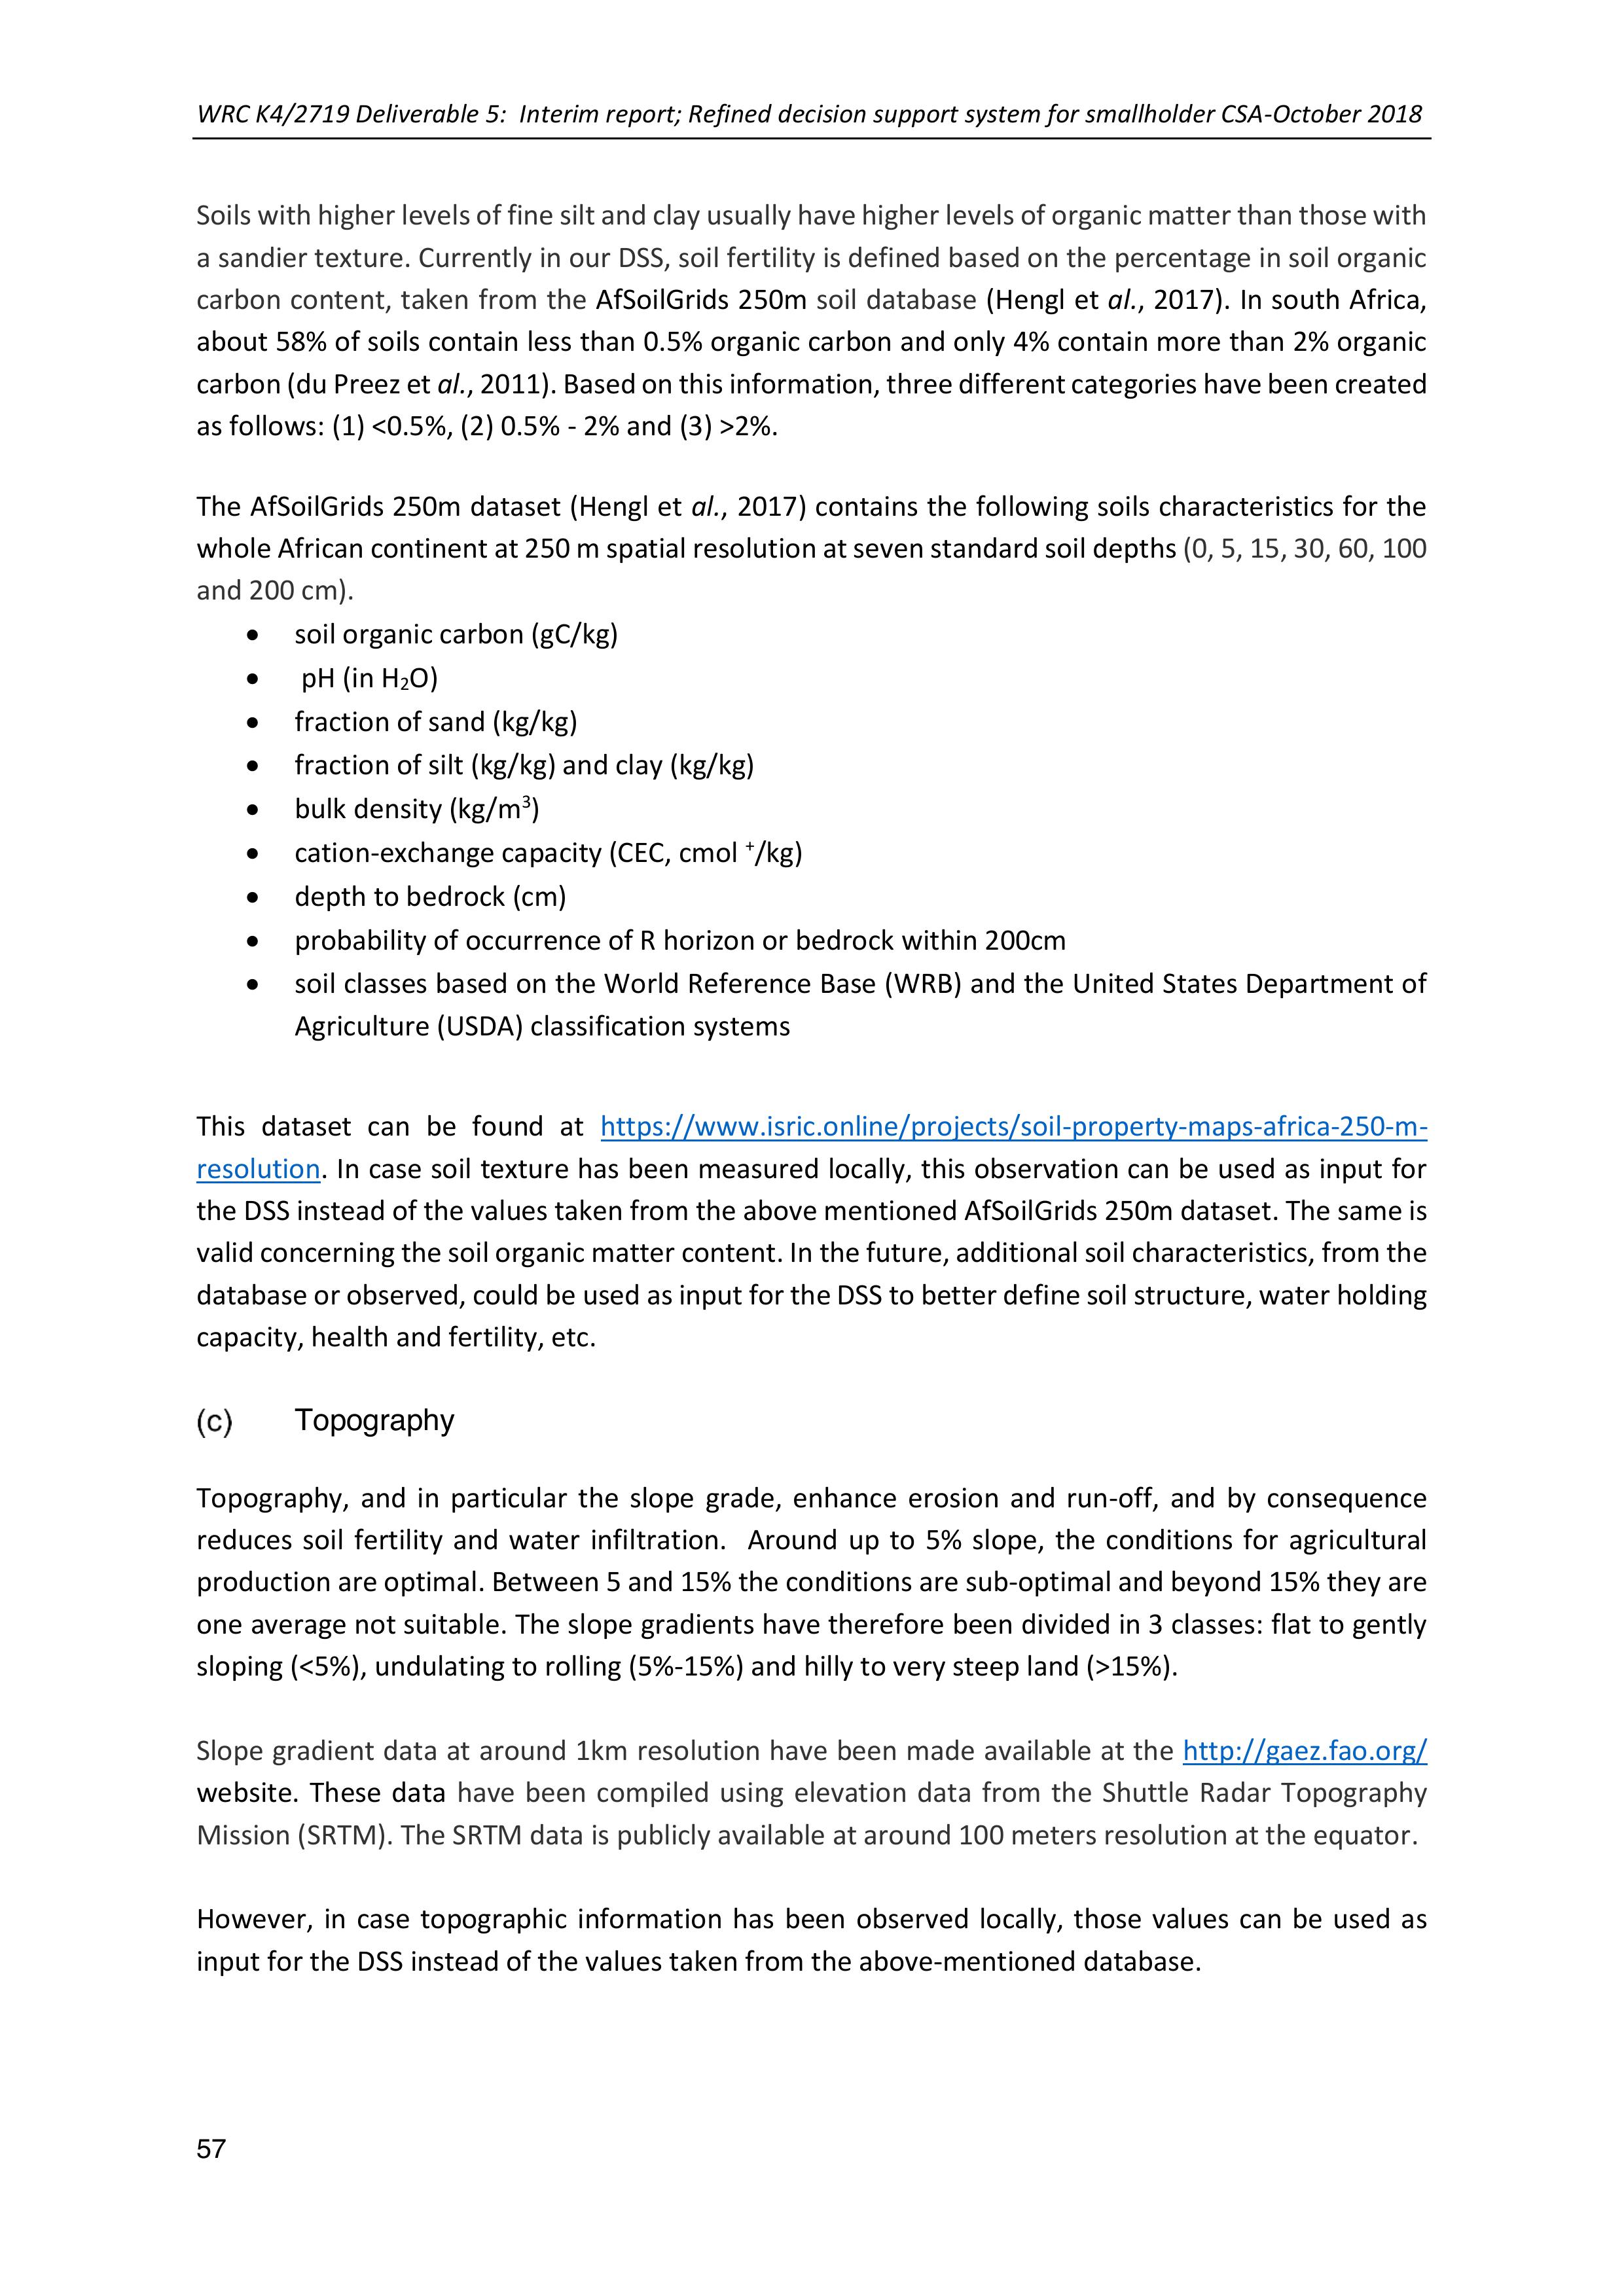
WRC K4/2719 Deliverable 5: Interim report; Refined decision support system for smallholder CSA-October 2018
57
Soils with higher levels of fine silt and clay usually have higher levels of organic matter than those with
a sandier texture. Currently in our DSS, soil fertility is defined based on the percentage in soil organic
carbon content, taken from the AfSoilGrids 250m soil database (Hengl et al., 2017). In south Africa,
about 58% of soils contain less than 0.5% organic carbon and only 4% contain more than 2% organic
carbon (duPreez et al., 2011). Based on this information, three different categories have been created
as follows: (1) <0.5%, (2) 0.5% - 2% and (3) >2%.
The AfSoilGrids250m dataset (Hengl et al., 2017) contains the following soils characteristics for the
whole African continent at 250 m spatial resolution at seven standard soil depths (0, 5, 15, 30, 60, 100
and 200 cm).
•soil organic carbon (gC/kg)
• pH (in H2O)
•fraction of sand (kg/kg)
•fraction of silt (kg/kg) and clay (kg/kg)
•bulk density (kg/m3)
•cation-exchange capacity (CEC, cmol +/kg)
•depth to bedrock (cm)
•probability of occurrence of R horizon or bedrock within 200cm
•soil classes based on the World Reference Base (WRB) and the United States Department of
Agriculture (USDA) classification systems
This dataset can befound at https://www.isric.online/projects/soil-property-maps-africa-250-m-
resolution. In case soil texture has been measuredlocally, thisobservation can be used as input for
the DSS instead of the values taken from the above mentioned AfSoilGrids 250m dataset. The same is
valid concerning the soil organic matter content. In the future,additional soil characteristics, from the
database or observed, could be used asinput for theDSS to betterdefine soil structure, water holding
capacity, health and fertility, etc.
Topography
Topography, and in particular the slope grade, enhance erosion andrun-off, and by consequence
reduces soil fertility and water infiltration. Around up to 5% slope, the conditions for agricultural
production are optimal. Between 5 and 15% the conditions are sub-optimal and beyond 15% they are
one average not suitable. The slope gradients have therefore been divided in 3 classes: flat to gently
sloping (<5%), undulating to rolling (5%-15%) and hilly to very steep land (>15%).
Slope gradient data at around 1kmresolution have been made available at the http://gaez.fao.org/
website. These data have been compiled using elevation data from the Shuttle Radar Topography
Mission (SRTM). The SRTM data is publicly available at around 100 meters resolution at the equator.
However, in case topographic information has been observed locally, those values can be used as
input for the DSS instead of the values taken from the above-mentioned database.
WRC K4/2719 Deliverable 5: Interim report; Refined decision support system for smallholder CSA-October 2018
58
Farming systems
The vast majority of SouthAfrica’s rural residents derive their livelihoods from a number of diverse
on-farm and off-farm sources. The on-farm sources can be divided as follows: crops, livestock and
other natural resources.Crops have been divided intofield cropping and vegetable gardening, since
the management practices differ strongly between both, in particular due todifferences in plot size
and location; gardens are smaller and generally closer to the house. Vegetable gardening is also often
a dry-season activity. The extent of this activity is then largely influenced by availability of a reliable
water source. By consequence the DSS differentiates the following farming systems:
•Vegetable gardening
•Field cropping
•Livestock
•Trees and other natural resources
Information on the farming systems has been collected during the field work. It has to be mentioned
that a farmer can belong to more than one farming system type.
Farmer socio-economic background
Extensive socio-economic and demographic background information from the different farming
households (HH) involved in this study has been compiled during the field work. The different themes
are listed below:
•Demographic information
oGender HH head
oAge HH head
oDependency ratio HH head
•Learning and access to education (level of education)
•Source of income (unemployment vs. external employment, own business, grants, farm, etc.)
•Total income
•Access to services, infrastructure, technology
oElectricity
oWater (tap, borehole, rainwater harvesting, etc.)
oIrrigation (buckets, standpipes, etc.)
oFencing
oFarming tools (hand vs traction/other)
•Social organisation (saving clubs, cooperatives, others)
•Market access (formal vs. informal)
•Farm size
•Farming purpose (food vs. selling)
Based on their vulnerability to shocks and stresses, the farminghouseholds have been subdivided into
three categories. The most vulnerable have been assigned to typology A andthe less vulnerable to
typology C. Farmer typology is a way of segmenting farmers into groups to assist in developing
targeted farm extension programs. Both typologies A and B can be considered to have a high level of
vulnerability, but A is more extreme. Typology C indicates a much smaller group of smallholder farmers

WRC K4/2719 Deliverable 5: Interim report; Refined decision support system for smallholder CSA-October 2018
59
who have better or more reliable access to infrastructure and support, are generally better educated,
have access tolarger fieldsand more livestock and farm primarily for income generation purposes.
They fund these farming enterprises primarilythrough incomesearned from employed members
within the household, or a combination of employment and social grants (including pensions). These
farmers are also more likely to belong to cooperatives and farmers associations and to have access to
formal market linkages.
From this, we can state that the typology of a farming HH can be differentiated by the HH headgender,
dependency ratio, level of education,employment status, income, access to services and formal
markets, farming purpose and farm size. The differentoptions of outcome for those 9 socio-economic
and demographic characteristics are provided in Table 11, as well as towhich typology they belong.
An outcomecan belong to different typologies; for example, typology A as wellas typologyB are often
characterised by a female headed farming HH.
In the DSS, the typology with the most frequent outcome is assigned as the mean typology to the
farming HH. In casetwo typologies are equally frequent, the typology with the lowest levelis assigned
to the HH. This HH typology is further used as proxy for the socio-economic background of the HH. An
example of how a specific typology is assigned to a farming HH is provided below and is based on the
information provided in Table 11.
Table 11: Socio-economic characteristics and range of values used to define the three typologies
The farming HH consideredin this example is characterised by a male head (typology B or C), with a
dependency ratio less than 0.33 (typology A), who went to school up to grade 9 (typology A or B), is
employed with a total income of R1500 (typology A or B), has access to electricity but has no tap-water
(typology B), has no access to formal markets (typology A or B), with food as the main farming purpose
(typology A or B) and witha farm size of around 0.2ha (typology B). The outcome of five out of the
nine socio-economiccharacteristics could be assigned to typology A, seven to typology B and one to
typology C. This means that there is a similar probability that the farming HH belongs to typology A
and B. Based in the factthat in case two typologies are equally frequent, the farming HH will be
assigned with the typology with the lowest level; by consequence, this farming HH will be assigned
typology A.
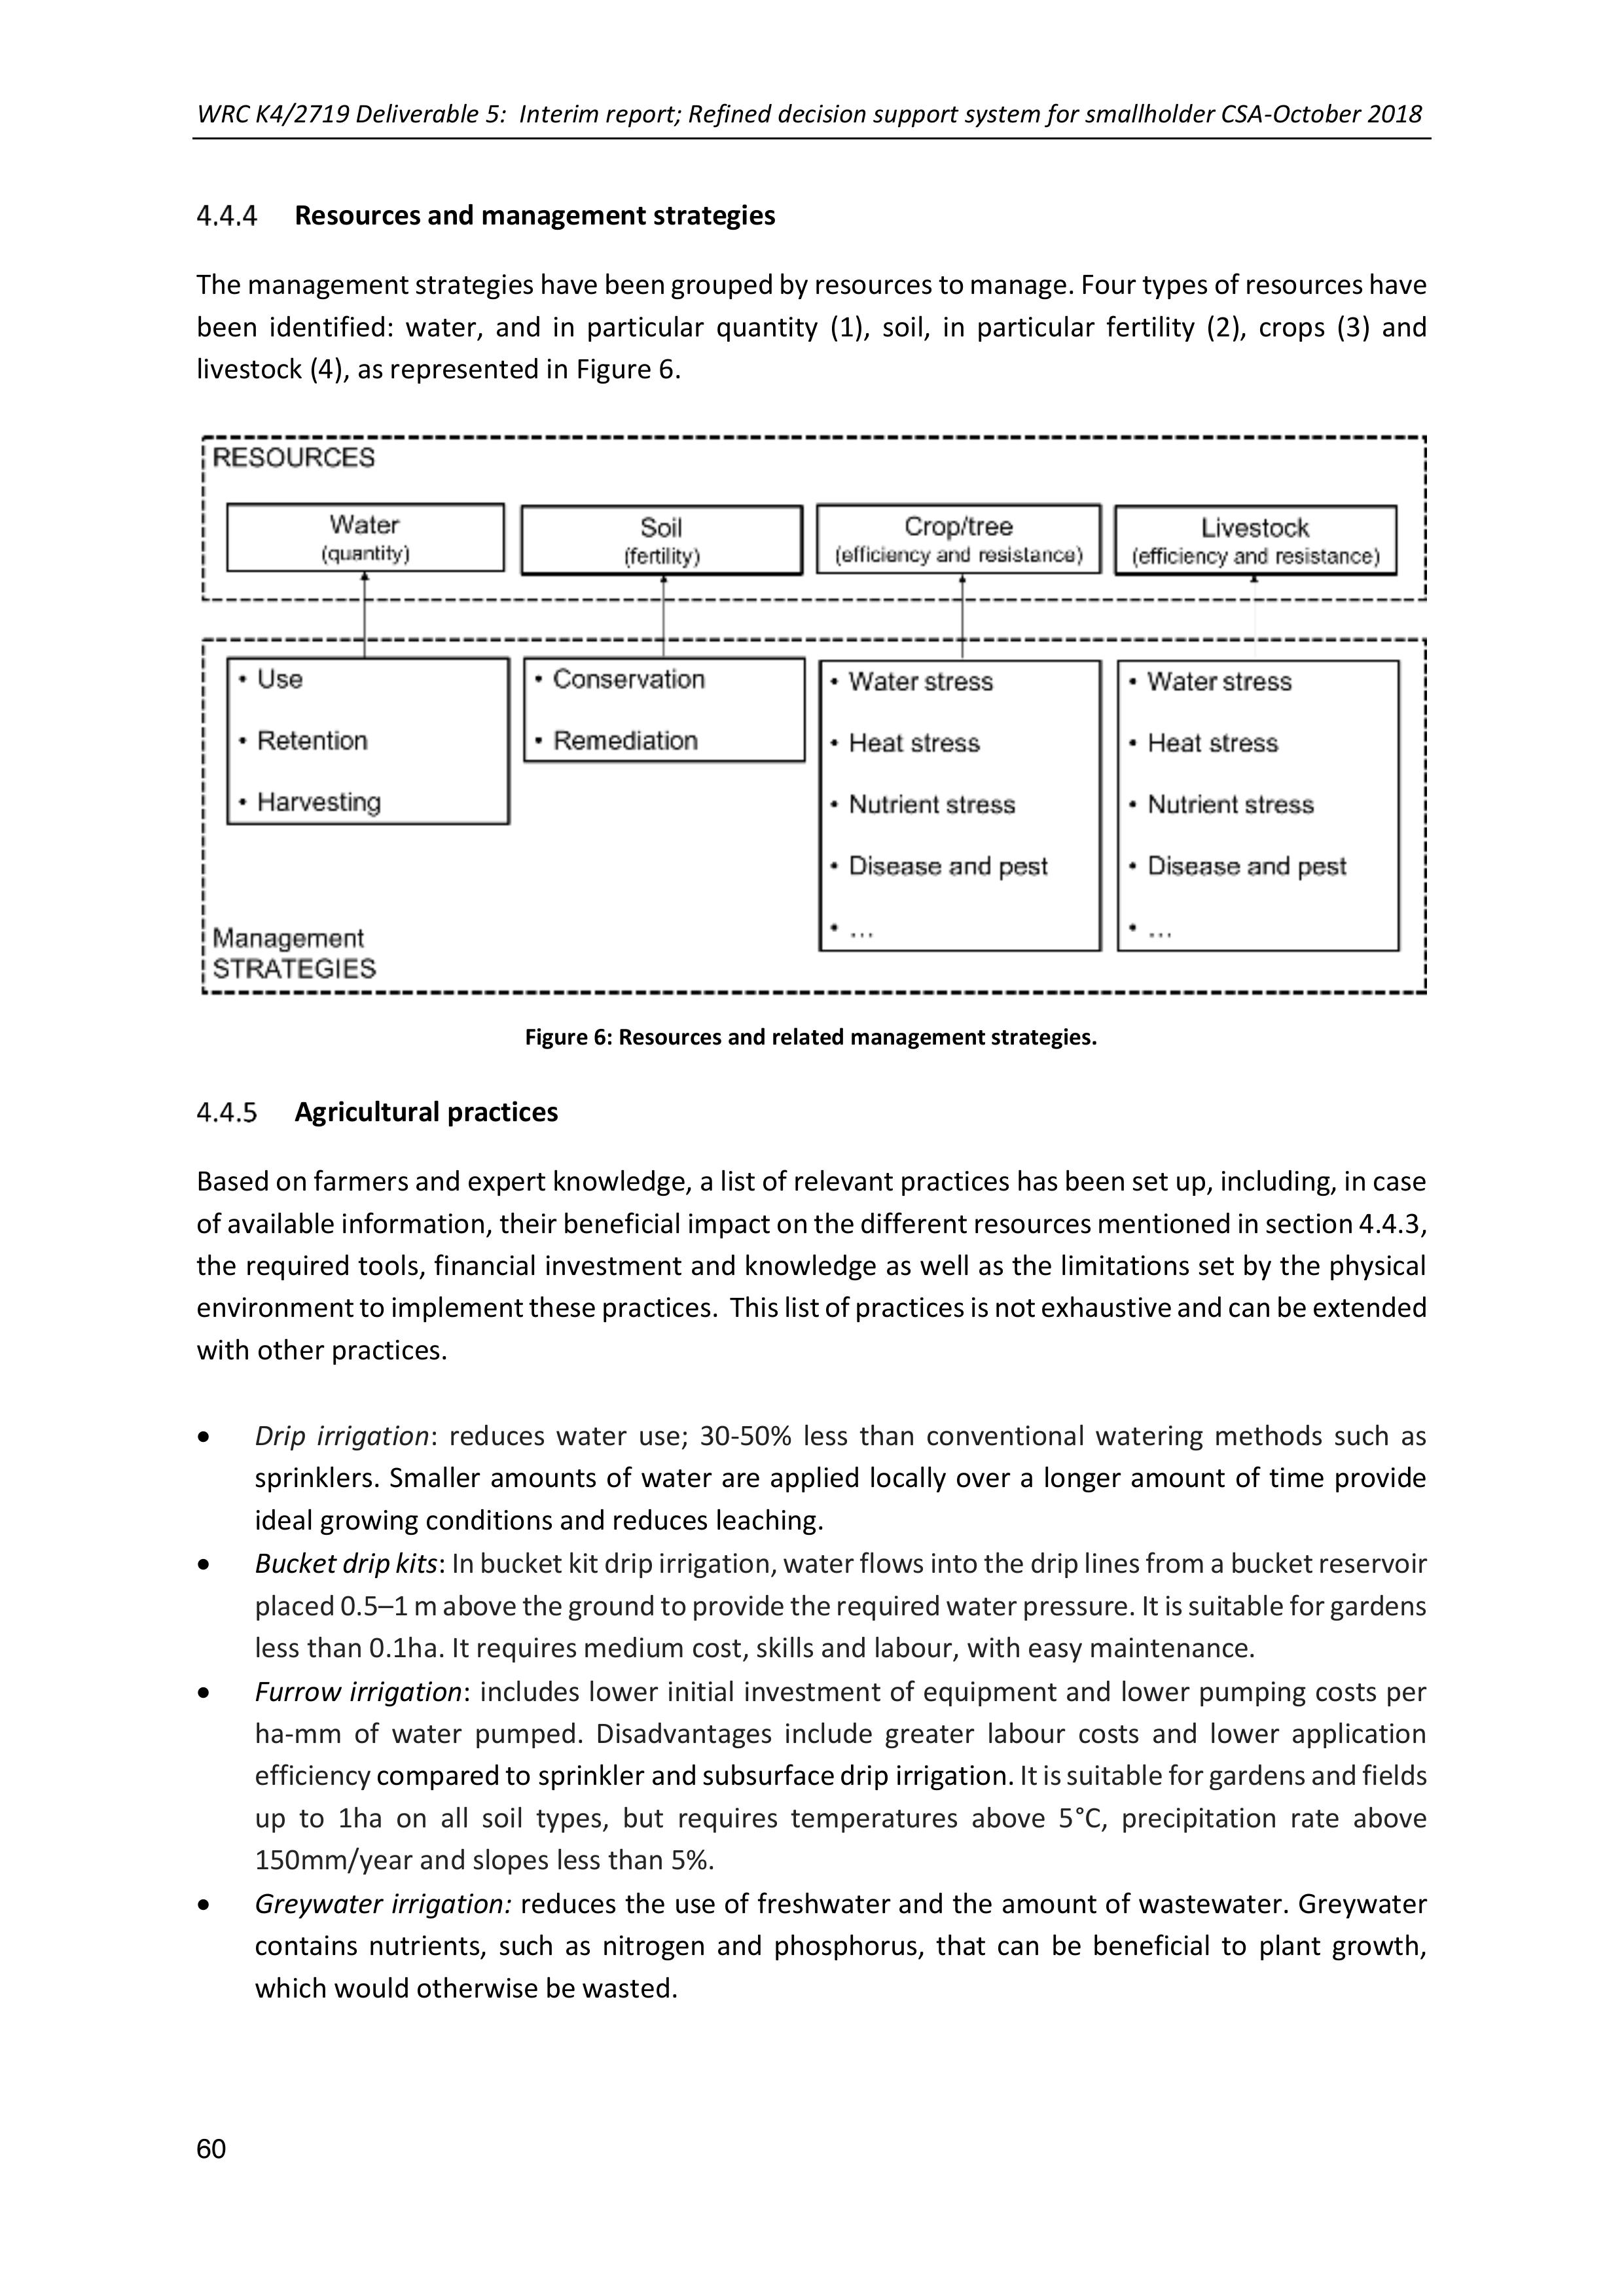
WRC K4/2719 Deliverable 5: Interim report; Refined decision support system for smallholder CSA-October 2018
60
Resources and management strategies
The management strategies have been grouped by resources to manage. Four types of resources have
been identified: water, and in particular quantity (1), soil, in particular fertility (2), crops (3) and
livestock (4), as represented in Figure 6.
Figure 6: Resources and related management strategies.
Agricultural practices
Based on farmers and expert knowledge, a list of relevant practices has been set up, including, in case
of available information, their beneficial impact on the differentresourcesmentioned in section 4.4.3,
the required tools, financial investment and knowledge as well as the limitations set by the physical
environment to implement these practices. This list of practices is not exhaustive and can be extended
with other practices.
•Drip irrigation: reduces water use; 30-50% less than conventional watering methods such as
sprinklers. Smaller amounts of water are applied locally over a longer amount of time provide
ideal growing conditions and reduces leaching.
•Bucket drip kits: In bucket kit dripirrigation, water flows into the driplines froma bucket reservoir
placed 0.5–1 m above the ground to provide the required water pressure. It is suitable for gardens
less than 0.1ha. It requires medium cost, skills and labour, with easy maintenance.
•Furrow irrigation: includes lower initialinvestment of equipment and lower pumping costs per
ha-mmof water pumped. Disadvantages include greater labour costs and lower application
efficiency compared to sprinkler and subsurface drip irrigation. It is suitable for gardens and fields
up to 1ha on all soil types, but requires temperatures above 5°C, precipitation rate above
150mm/year and slopes less than 5%.
•Greywater irrigation:reduces the use of freshwater and the amount of wastewater. Greywater
contains nutrients, such as nitrogenand phosphorus, that can be beneficialto plant growth,
which would otherwise be wasted.
WRC K4/2719 Deliverable 5: Interim report; Refined decision support system for smallholder CSA-October 2018
61
•Shade cloth tunnel: reduces heat and by consequence evapotranspiration, as well as pest
incidence. It is fitted for gardens less than 0.1ha. It requires medium cost, skills and low
maintenance.
•Mulching: Reduces water use as it protectsthe soil from evaporation. Provides
valuable nutrients as the mulch breaks down and thereby improves the soil's texture. Encourages
worms, which aerate the soil and provide fertiliser in the form of worm castings. Reduces the
number of weeds by inhibiting thegermination of weed seeds. It is fitted for gardens lessthan
0.1ha. It requires low cost and skills but is labour intensive. Temperatures need to be higher than
5°Cand precipitation rate above 150mm/year. There is no restriction concerning slopes or soil
type. Only local resources are required.
•Manure and crop residues: improve soil structure, increase organic matter content in the soil,
reduce evaporation, and help fix CO2 in the soil. They enhance the water holding capacity of sandy
soils, while it improves the drainage of clayey soils.
•Diversion ditches: are constructed along the contour lines and across slopes for the purpose to
intercept surface runoff and divert itto suitable outlets or for rain water harvesting. It is fitted
for gardens and fields up to 1ha. It requires low cost, skills and maintenance but is labour
intensive. Temperatures need to be higher than 5°C and precipitation rate above 150mm/year.
There is no restriction concerning slopes but the soil should be relatively stable. Only local
resources are required.
•Grass water ways: carry large flows, making it suited to safely carry runoff from large upstream
watersheds and divert it to suitable outlets or for rain water harvesting. Once vegetation is
established, maintenance is low. However, working around the waterway with farm equipment
can be difficult. Suitable for larger areas 0,1-1ha to >1ha, slope of 5-15% and precipitation rate
above 450mm/year.
•Infiltration pits(with e.g. banana): collect runoffwhich is stored in theinfiltration pit. This
technique is appropriatefor small-scale tree planting in any area which has a moisturedeficit.
Besides harvesting water for the trees, it simultaneously conserves soil. They are relatively easy
to construct and well suited for hand construction. Once the trees are planted, it is not possible
to operate and cultivate with machines between the tree lines.It is fitted for gardens less than
0.1ha. It requires low cost and skills but is labour intensive. Temperatures need to be higher than
5°Cand precipitation rate above 150mm/year. The slopes need to be less than 30% but there is
no soil type restriction. Only local resources are required.
•Zai pits (planting pits): improve infiltration of the captured runoff. The holes are deepened each
winter. Improvements in the traditional pits by the addition of fertilizer and organic matter
(compost) have resulted in dramatic improvements in yield. The pits are easy to manage. Suitable
for larger areas 0,1-1ha to >1ha, slope of 5-15% and precipitation rate above 150mm/year.
•Rain water harvesting storage: underground tanks collect runoff water. It requires high cost and
skills, intensive labour but medium maintenance. Temperatures need to be higher than 5°C and
precipitation rate above 450mm/year.Theslopes need to be less than 30% but there is no soil
type restriction.
•Tied ridges: collects rainfall from an unplanted slopingbasin and catching it with a furrow and
ridge. Plantingtakes place on either side of the furrow where the water has infiltrated. It requires
low cost but intensive labour. Temperatures need to be higher than 5°C and precipitation rate
above 400mm/year. The slopes need to be less than 7% and the soil should be relatively stable.
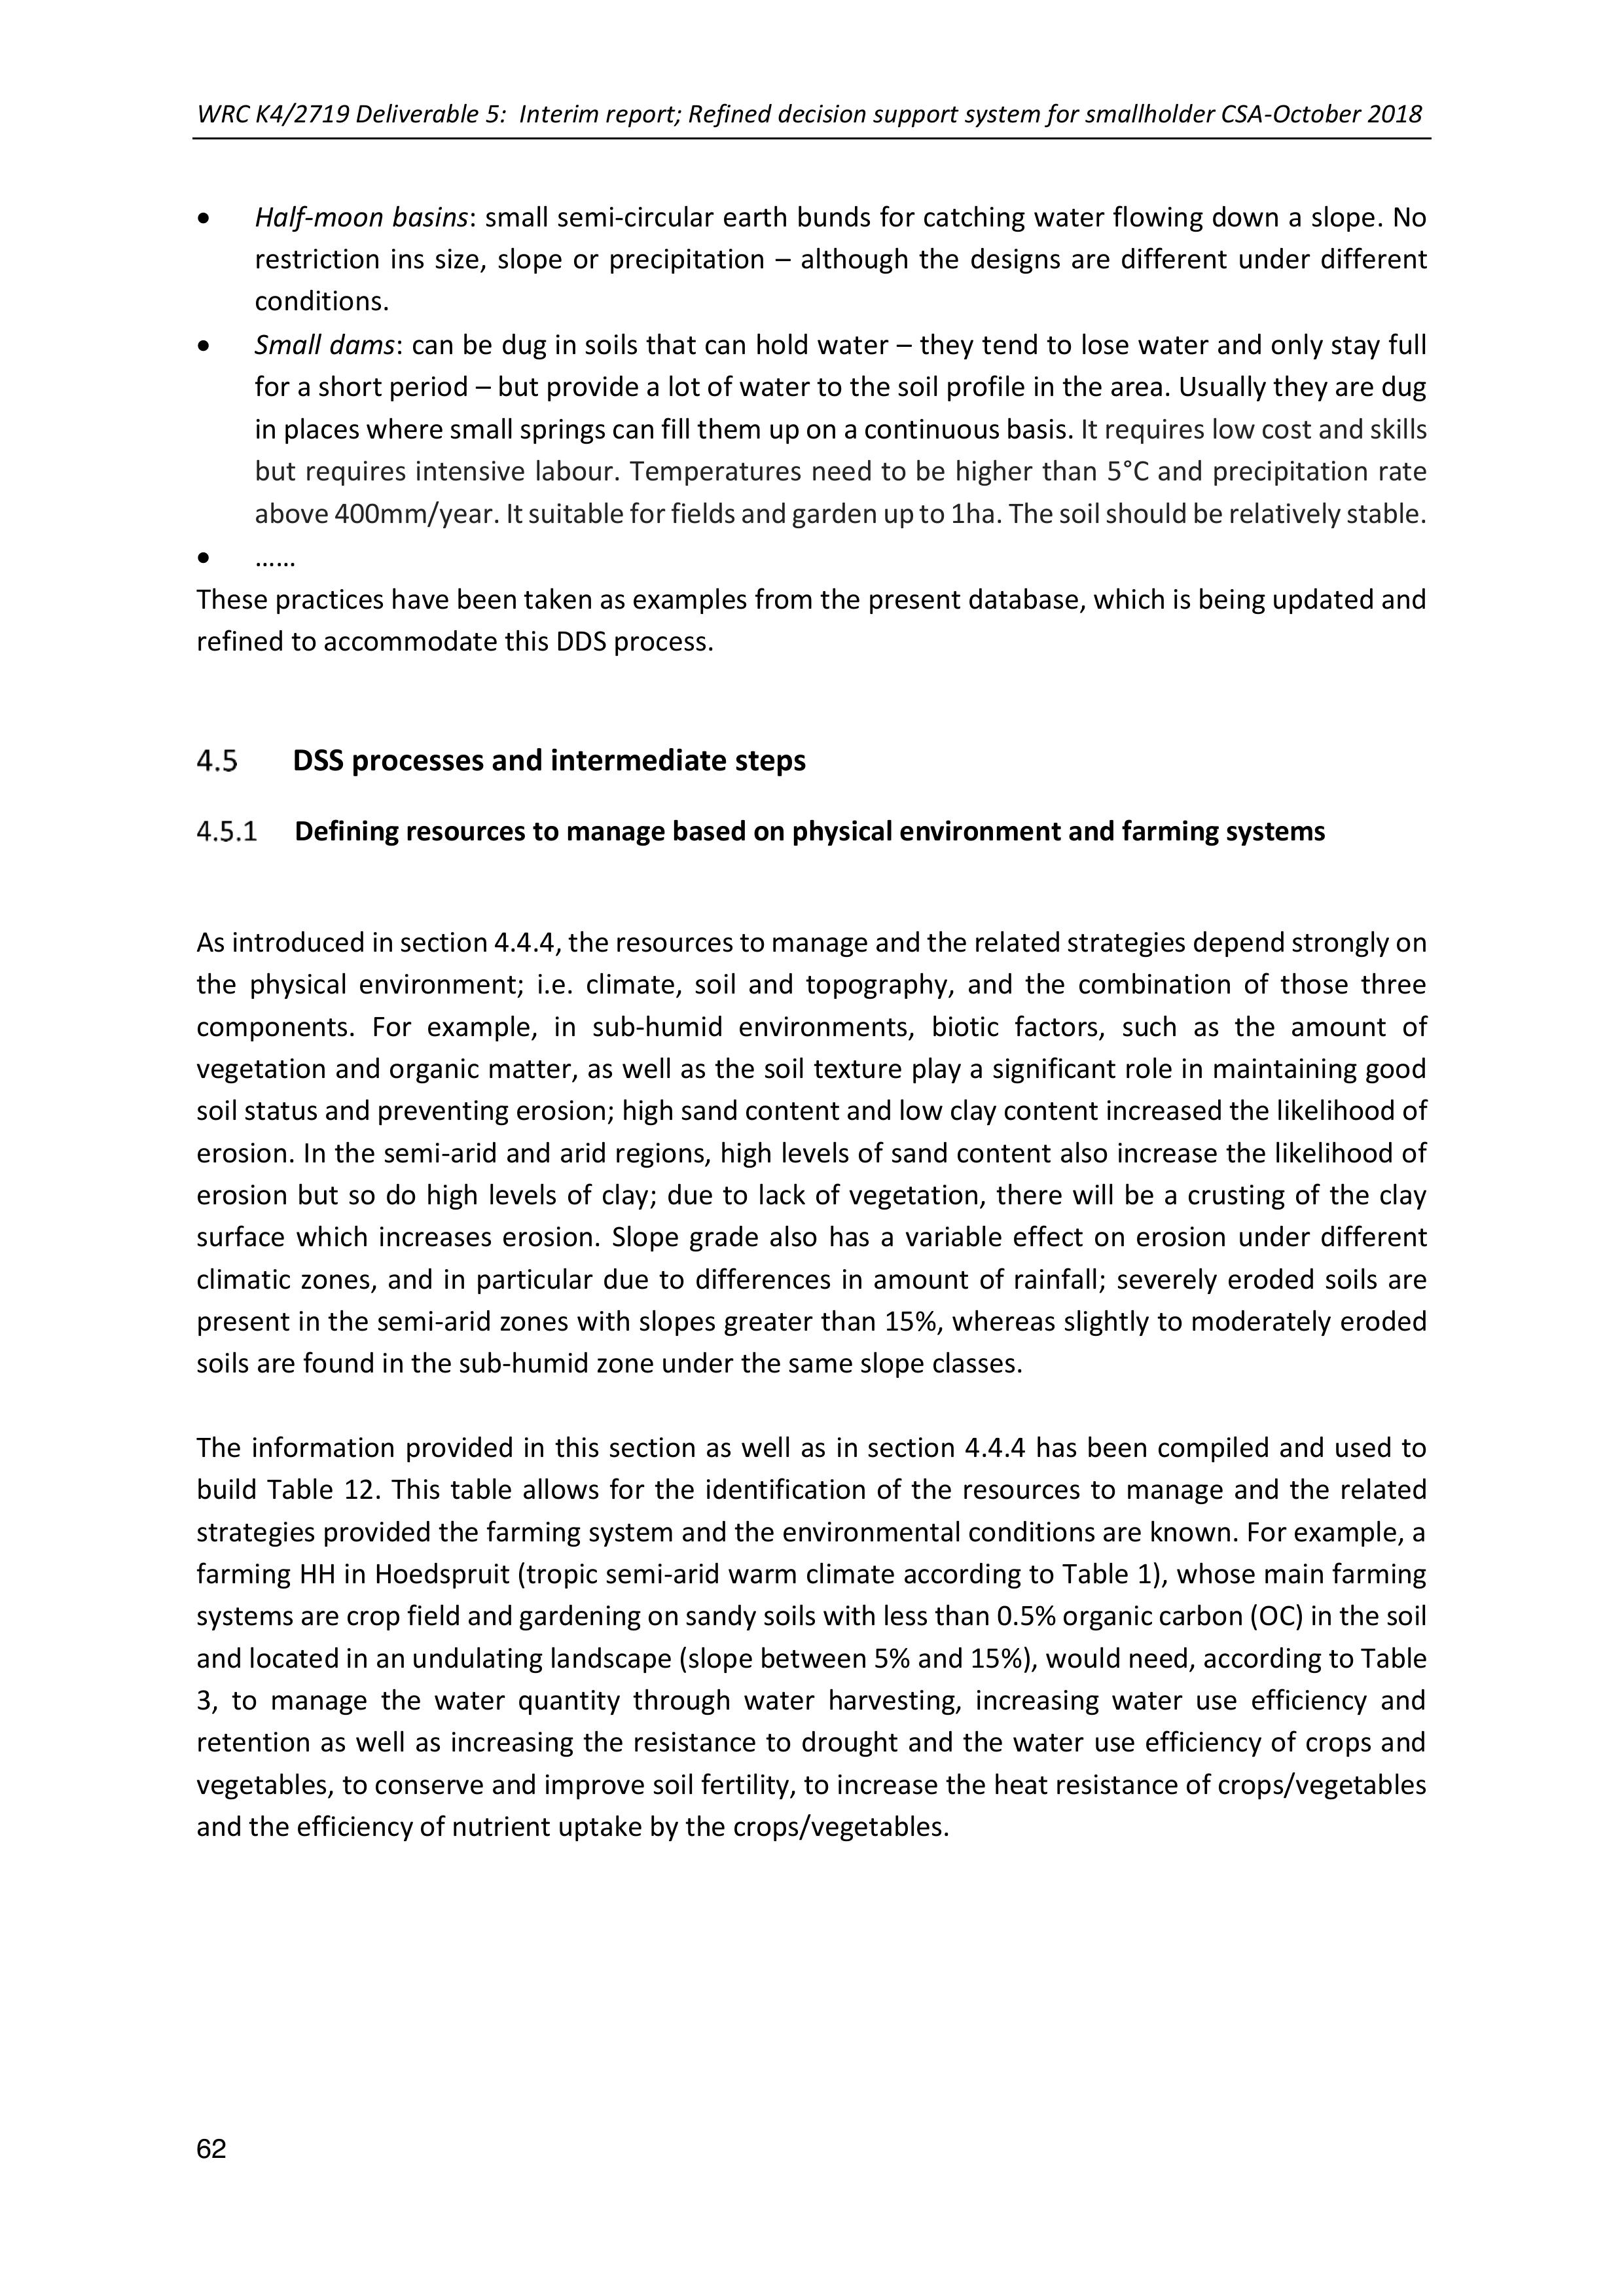
WRC K4/2719 Deliverable 5: Interim report; Refined decision support system for smallholder CSA-October 2018
62
•Half-moon basins: small semi-circular earth bunds for catching water flowingdown aslope. No
restriction ins size, slope or precipitation –although the designs are different under different
conditions.
•Small dams: canbe dugin soils that can hold water –they tend to lose water and only stay full
for a short period – but provide a lot of water to the soil profile in the area. Usually they are dug
in places where small springs can fill them upon a continuous basis. It requires low cost and skills
but requires intensive labour. Temperaturesneed to be higher than 5°C and precipitation rate
above 400mm/year. It suitable for fields and garden up to 1ha. The soil should be relatively stable.
•……
These practices have been taken as examples from the present database, which is being updated and
refined to accommodate this DDS process.
DSS processes and intermediate steps
Defining resources to manage based on physical environment and farming systems
As introduced in section 4.4.4, the resources to manage and the relatedstrategies depend strongly on
the physical environment;i.e. climate, soil and topography, and the combination of those three
components. For example, in sub-humid environments, bioticfactors, such as theamount of
vegetation and organic matter, as well as the soil texture play asignificant role in maintaininggood
soil status and preventing erosion; high sand content and low clay content increased the likelihood of
erosion. In the semi-arid and arid regions, high levels of sandcontent also increase the likelihood of
erosion but so do high levels of clay; due to lack of vegetation, there will be a crusting of the clay
surface which increases erosion. Slope grade also has a variable effect on erosion underdifferent
climatic zones, and in particular due to differences in amount of rainfall; severely eroded soils are
present in the semi-arid zones with slopes greater than 15%, whereas slightly to moderately eroded
soils are found in the sub-humid zone under the same slope classes.
The information provided in this sectionas well as in section 4.4.4 has been compiled and used to
build Table 12. This table allows for the identification of the resources to manage and the related
strategies provided the farming system and the environmental conditions are known. For example, a
farming HH in Hoedspruit (tropic semi-arid warm climate according to Table 1), whose main farming
systems are crop field and gardening on sandy soils with less than 0.5% organic carbon (OC) in the soil
and located in an undulating landscape (slope between 5% and 15%), would need, according to Table
3, to manage the water quantity through water harvesting, increasing water use efficiency and
retention as well as increasingthe resistanceto drought and the water use efficiency of crops and
vegetables, to conserve and improve soil fertility, to increase the heat resistance of crops/vegetables
and the efficiency of nutrient uptake by the crops/vegetables.
WRC K4/2719 Deliverable 5: Interim report; Refined decision support system for smallholder CSA-October 2018
63
Table 12:Criteria for defining the resources to manage and related strategies, based on the physical environment and
farming system (grey boxes) (*:solely for semiarid zone)
Each farming HH falls within a sub-category of the physical environmental components (see Figure 4);
i.e. AEZ, soil textures, OC and slope. If one of these sub-categories vs. resources and management
strategies box in Table 12is highlighted in grey, it suggests that the specificresource needs to be
managed by mean of the provided strategy but solely if the farming system suggests to do so. In case
of field cropping, vegetable gardening and others such as trees, the resources tomanage are restricted
to water quantity, soil and crop, while for livestock farming system, it is restricted to livestock, water
quantity and soil fertility. The boxes highlighted with an asterisk (*) suggest a conditional criterion; i.e.
farming on a clayey soil only needs soil conservation if it is located in a semi-arid region.
Suggesting management practices based on resources to manage
Based on the information provided in section 4.5.1 Table 13 has been built. This table associates the
practices to the resources and the management strategies that they cover. It can be seen that a
practice can be beneficialto differentresources through different mechanisms and strategies. This
table allows the selection of practices that could be used to manage the resources, through specific
strategies, that were identified in section 4.5.1
Table 13: Criteria for selecting practices based on the resources to manage and related strategies (grey boxes)

WRC K4/2719 Deliverable 5: Interim report; Refined decision support system for smallholder CSA-October 2018
64

WRC K4/2719 Deliverable 5: Interim report; Refined decision support system for smallholder CSA-October 2018
65
Confining suggested practice based on restrictions set by farmer’s socio-economic
background, by farming system and by environmental conditions
Table 14: Criteria for confining the selected practices based on farmer typology, physical environment and farming
system (grey boxes)

WRC K4/2719 Deliverable 5: Interim report; Refined decision support system for smallholder CSA-October 2018
66

WRC K4/2719 Deliverable 5: Interim report; Refined decision support system for smallholder CSA-October 2018
67
WRC K4/2719 Deliverable 5: Interim report; Refined decision support system for smallholder CSA-October 2018
68
Practices that have beensuggested in section 4.5.2 to manage specificresources might not be
appropriate under specific environmental conditions, farming systems and socio-economic
conditions. Environmental conditions such as steep slopes, too hard or too soft soils, too much or not
enough rain might limit the implementation of certain practices. Farming systems might also restrict
the choice of practices; for example, practices that require a significant area or mechanisation, are
solely appropriate to fields, since they are much larger than gardens. Finally, farmer socio-economic
background also limits the implementation of certain practices; for example, practices that are labour
intensive, costly, requiring significant mechanisation, input or skills, might not be appropriate for
farmers of typology A or B.Farmer typology, as defined in section 4.4.3, has been proven to be a good
indicator for the adoptionor not of a practice by a farmer. Those restrictions for practice
implementation due to physical environment, farmingsystem or farmer’s typology are represented in
Table 14.
This table highlights in grey the suitability of the practices under the different physical environmental
conditions, farming systems and farmer’s socio-economic background. In case the practice is not
suitable for one of these categories or sub-categories characterisingthe farming HH, the practice is
rejected from the list of suggested practices.
Ranking relevant practices based on farmer and facilitator input
Ranking based on facilitator input
The facilitators are asked to assign per resource for each practice a value between 0 and 3, according
to what the facilitator thinks to be the level of beneficial impact, direct or indirect, of the practice to
improve or sustain the specific resource, with 0 as no beneficial impact, 1 as low, 2 as medium and 3
as high beneficial impact on thespecific resource.Besides the impact on the fourresources mentioned
earlier; i.e. water, soil, crop and livestock, a score has tobe assigned to the beneficial impact of the
practice on the natural environment with regard to the ecosystem services it provides. An example of
scores given by a facilitator of Mahlathini Development Foundation is shown in Table 15.
The relevant practices that were selected in section 3.3.3based on the physical environment, the
farming system andtypology are ranked bysummingthe different scoresassigned to eachpractice
for the five different resources. The practices with the highest total score are assumed to contribute
the most, based on the facilitator’s knowledge/experience, to improve or to sustain the different
resources. A separate ranking can be made for the contribution to the natural resources only.
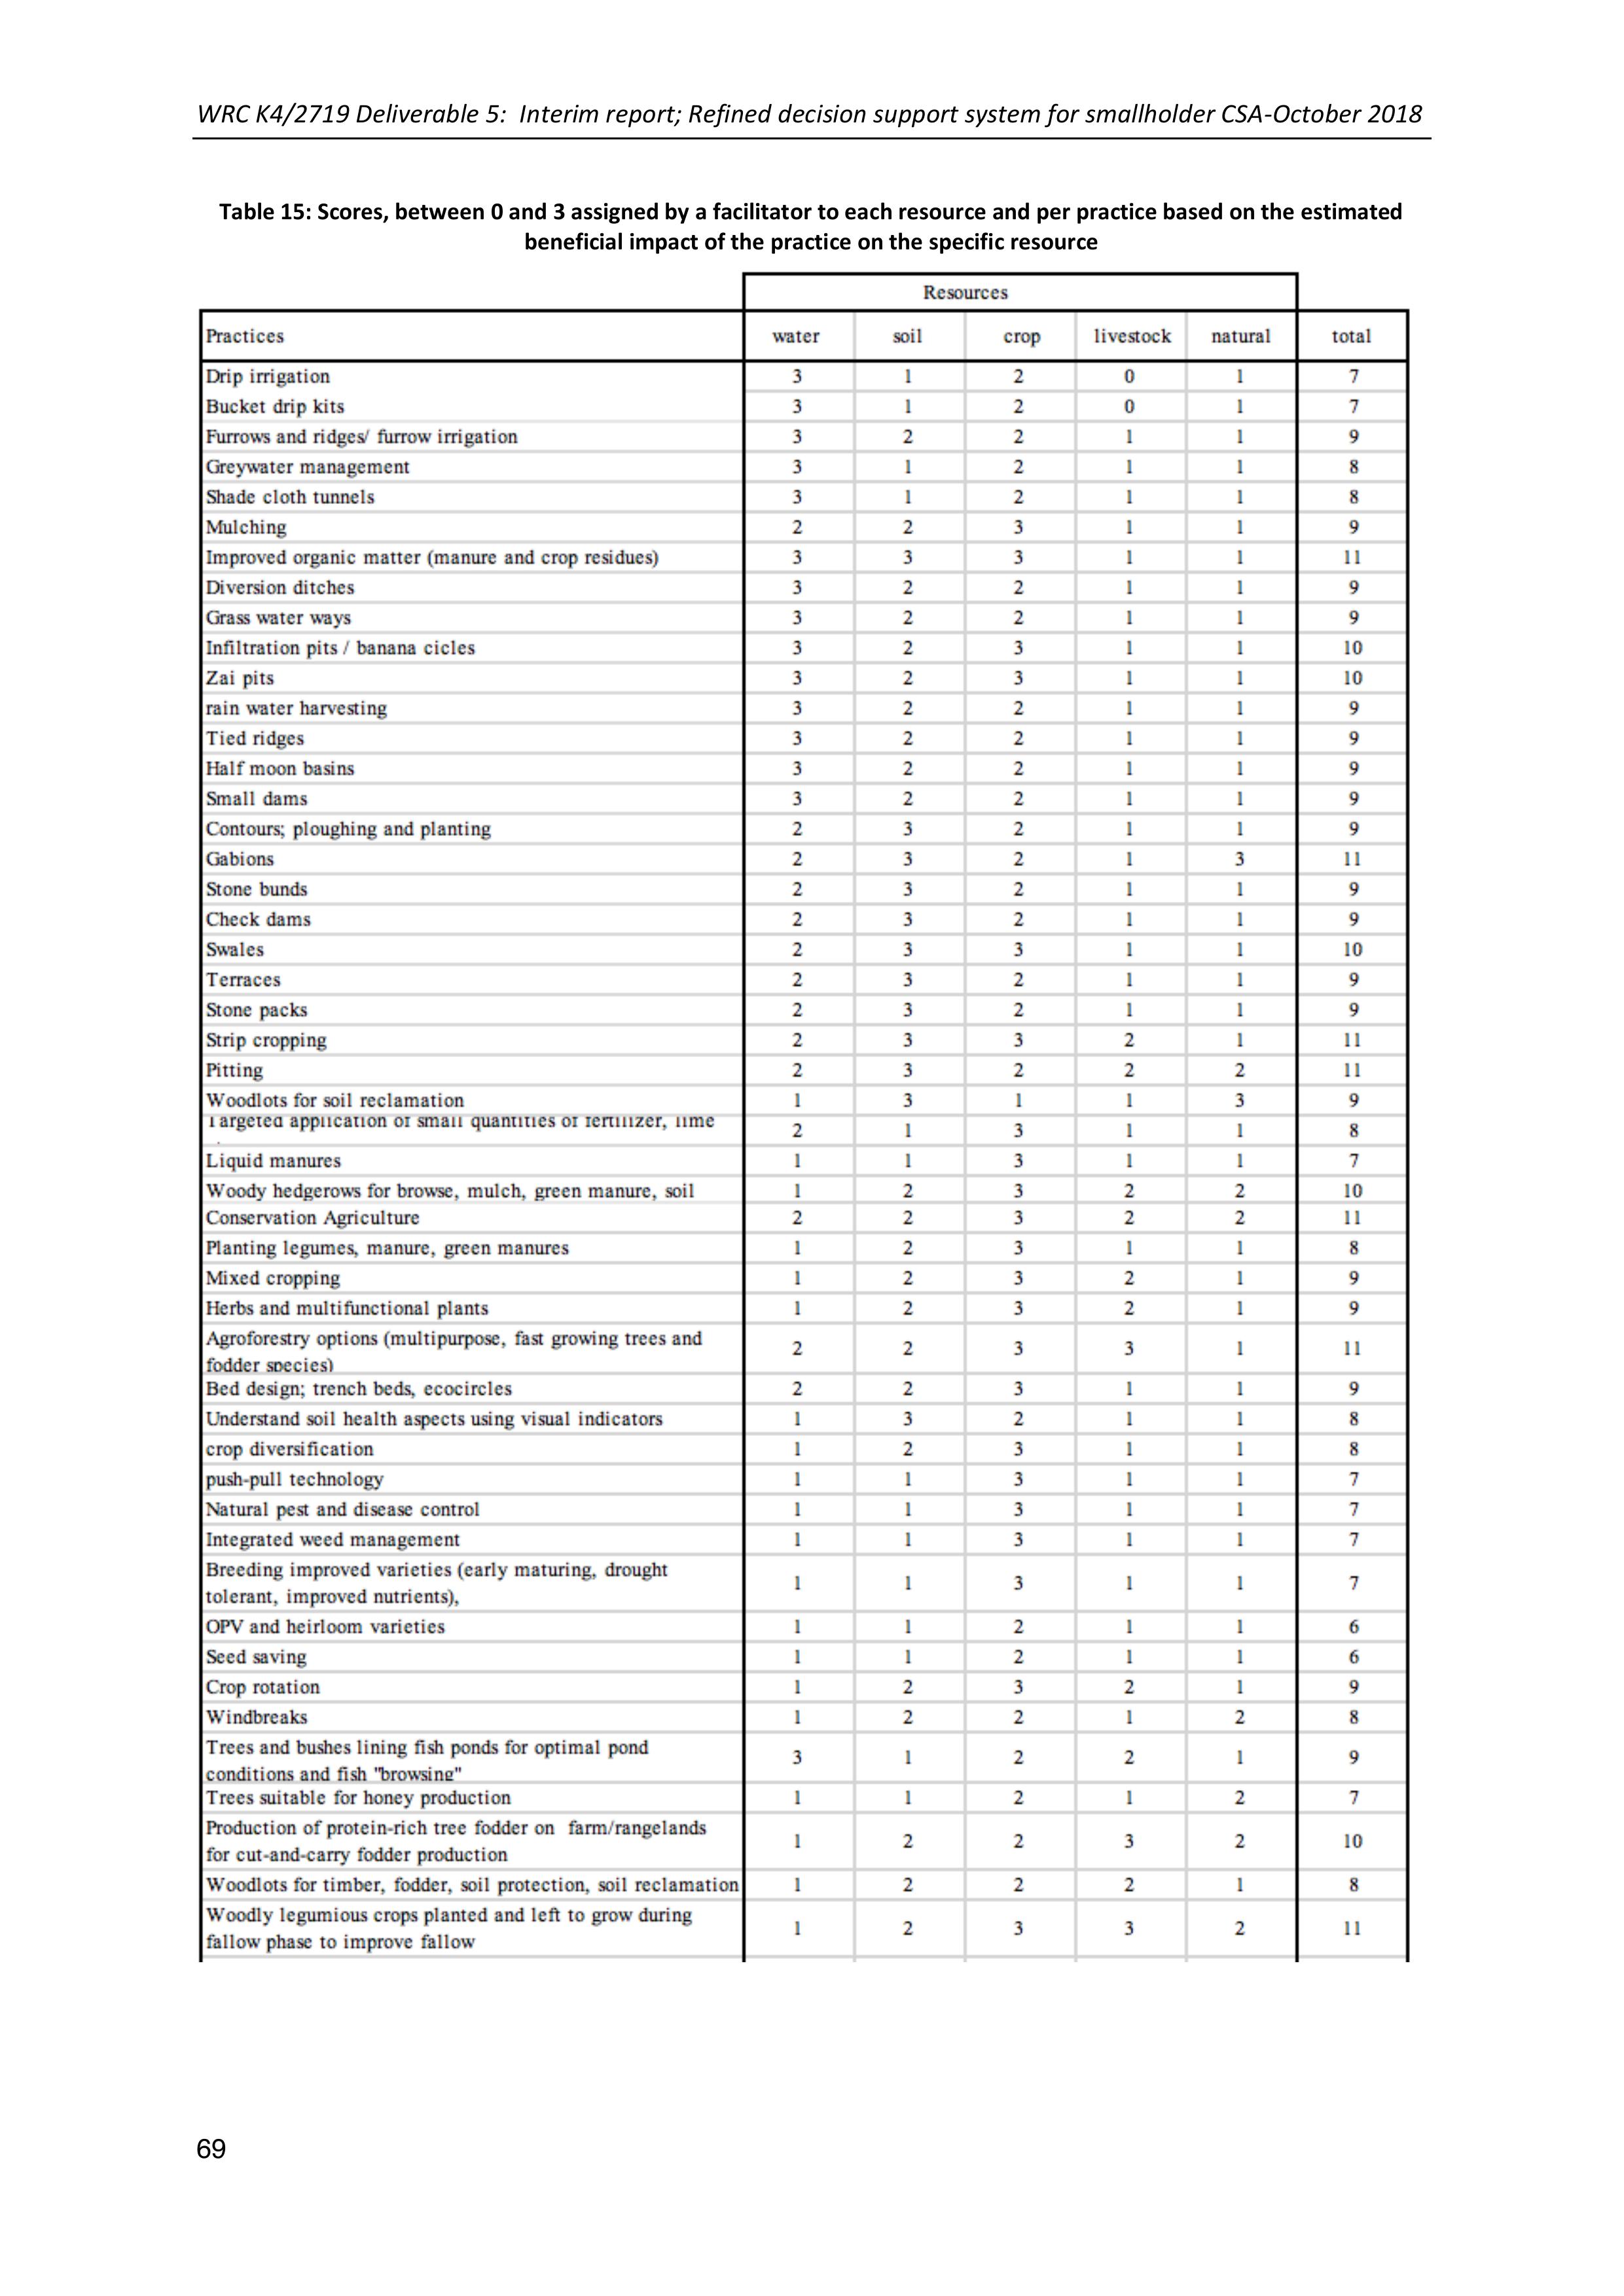
WRC K4/2719 Deliverable 5: Interim report; Refined decision support system for smallholder CSA-October 2018
69
Table 15: Scores, between 0 and 3 assigned by a facilitator to each resource and per practice based on the estimated
beneficial impact of the practice on the specific resource
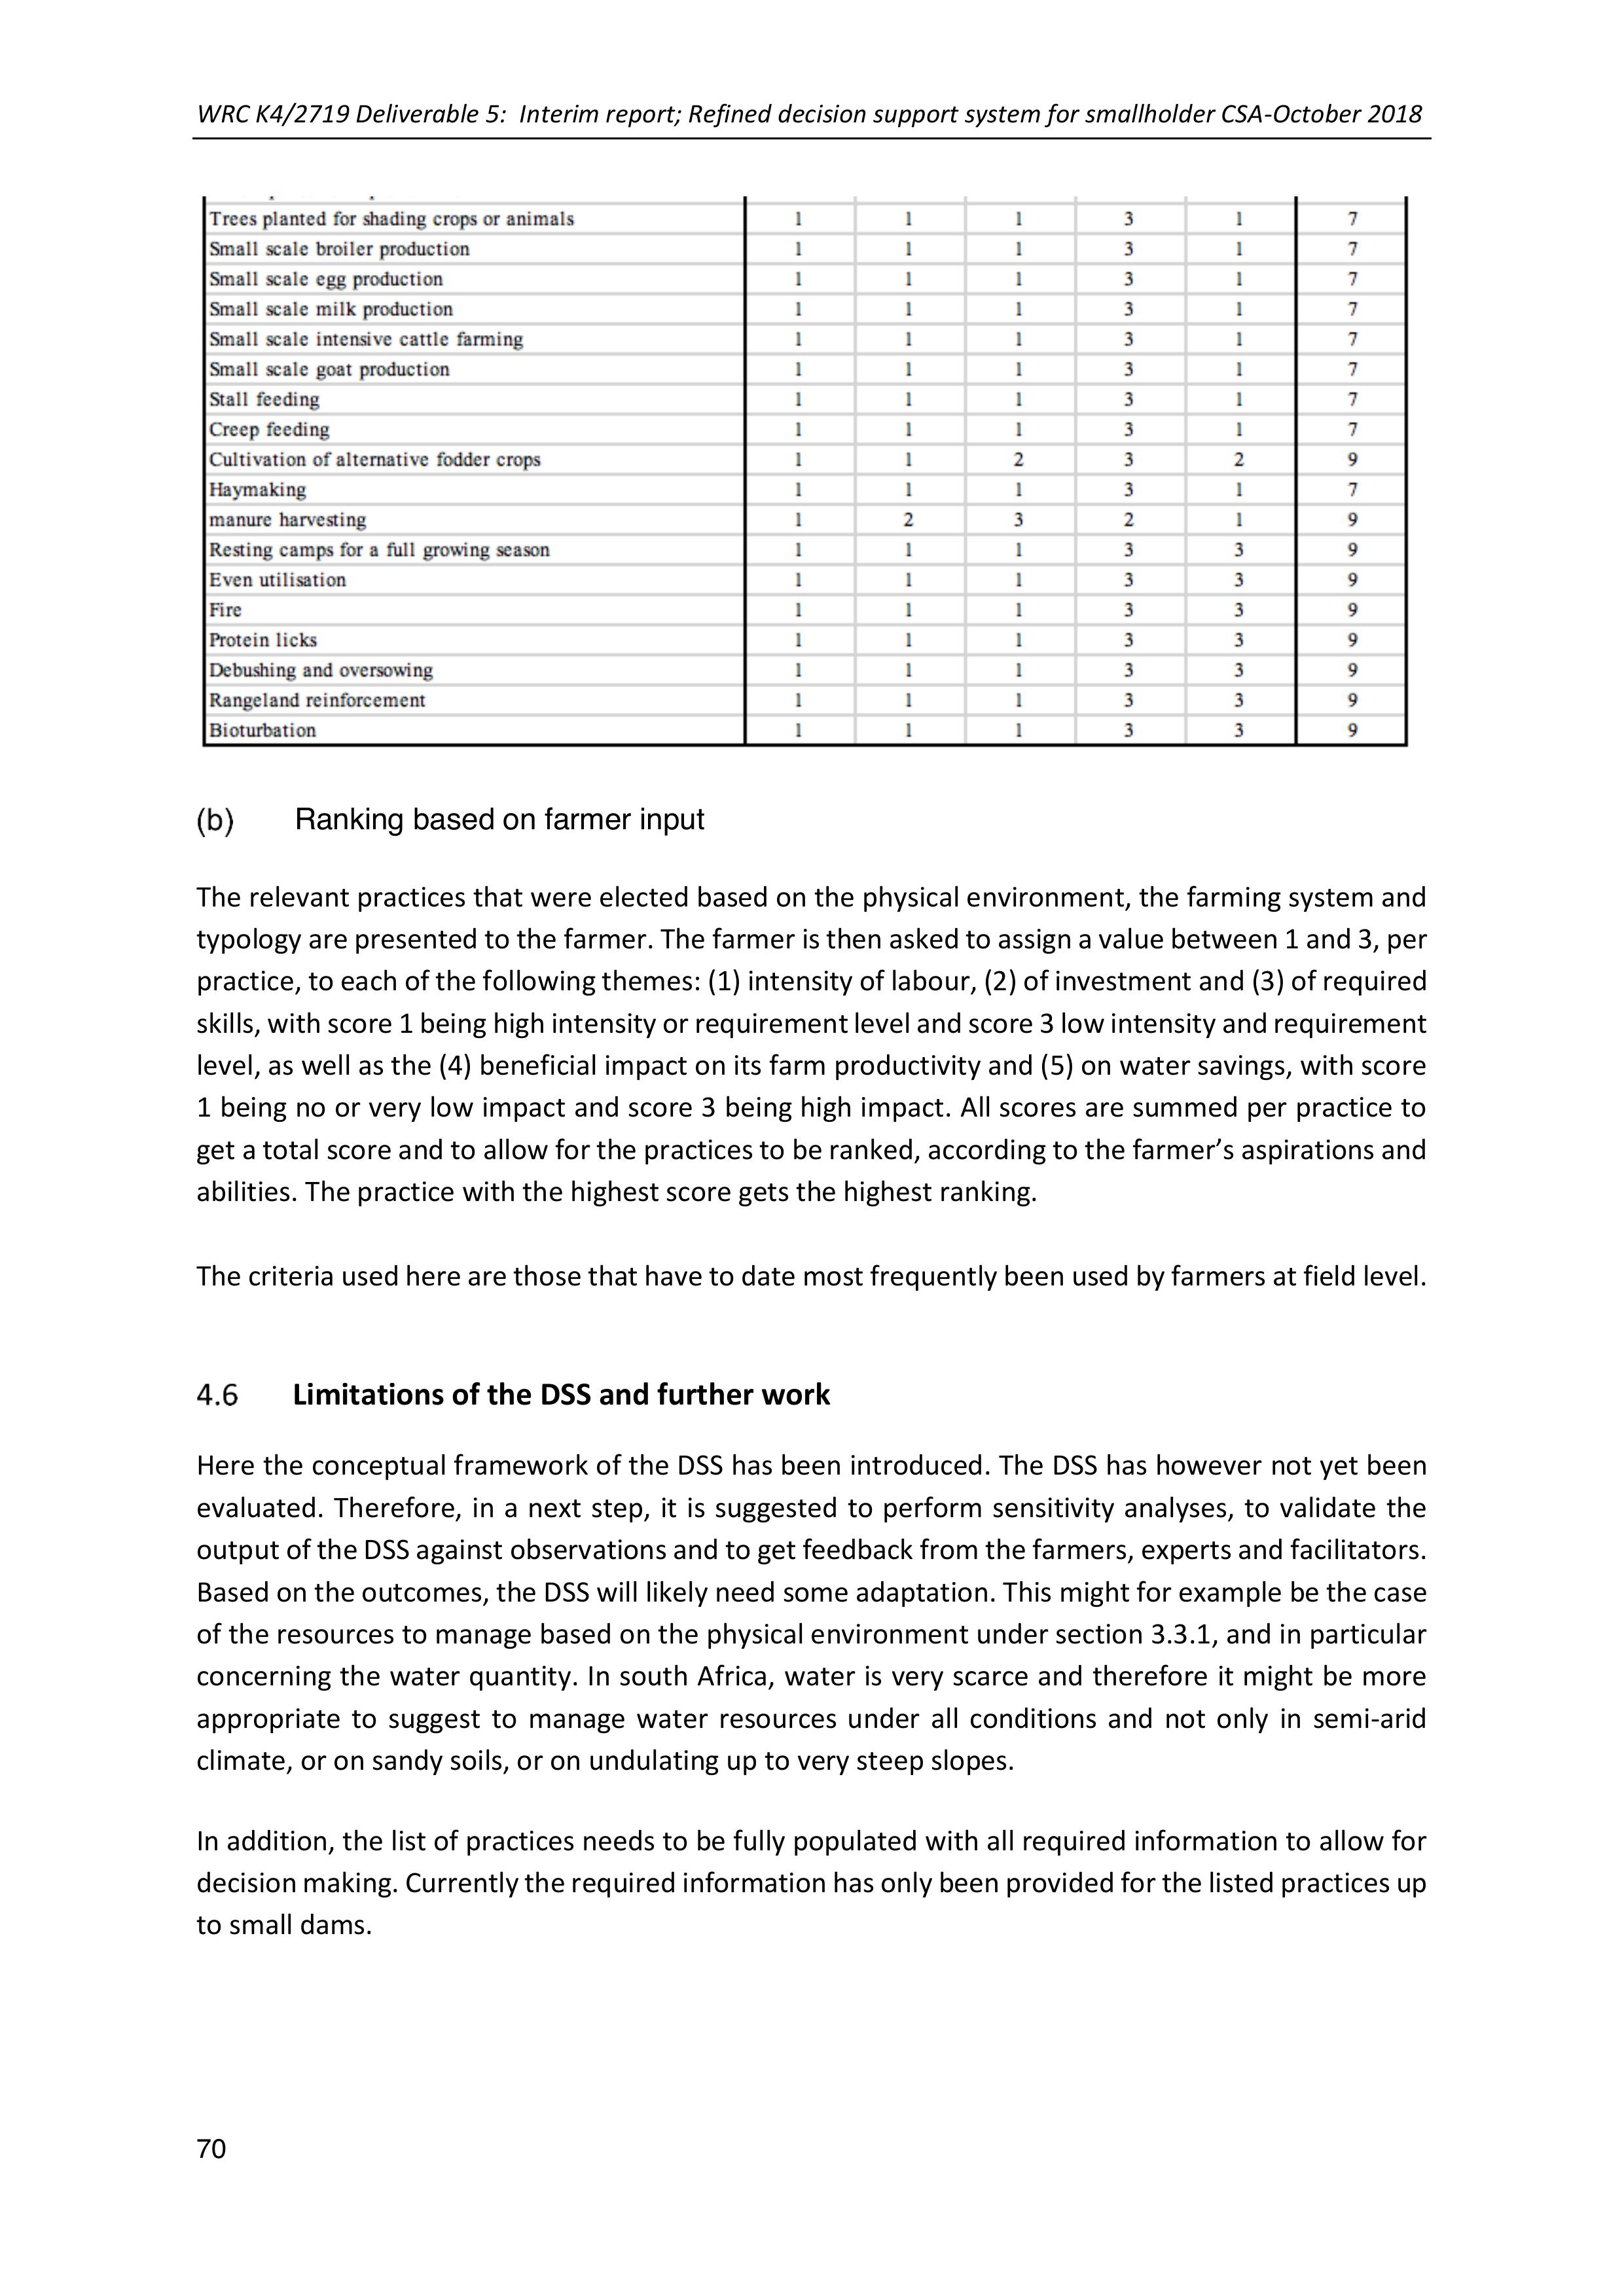
WRC K4/2719 Deliverable 5: Interim report; Refined decision support system for smallholder CSA-October 2018
70
Ranking based on farmer input
The relevant practices that were elected based on the physical environment, the farming system and
typology are presented to the farmer. The farmer is then askedto assign a value between 1 and 3, per
practice, to each of the following themes: (1) intensity of labour, (2) of investment and (3) of required
skills, with score 1 being high intensity or requirementleveland score 3 lowintensity and requirement
level, as well as the (4) beneficial impact on its farm productivity and (5) on water savings, with score
1 being no or very low impact andscore 3 being high impact. All scores aresummed per practice to
get a total score and to allow for the practices to be ranked, according to the farmer’s aspirations and
abilities. The practice with the highest score gets the highest ranking.
The criteria used here are those that have to date most frequently been used by farmers at field level.
Limitations of the DSS and further work
Here the conceptual framework of the DSS has been introduced. The DSS has however not yet been
evaluated. Therefore, in a next step, it is suggested to perform sensitivity analyses, to validate the
output of the DSS against observations and to get feedback from the farmers, experts and facilitators.
Based on the outcomes, the DSS will likely need some adaptation. This might for example be the case
of the resources to manage based on the physical environment under section 3.3.1, and in particular
concerning thewater quantity. In south Africa, water is very scarce and therefore it might be more
appropriate to suggest tomanage water resources under all conditions and not only in semi-arid
climate, or on sandy soils, or on undulating up to very steep slopes.
In addition, the list of practices needs to be fully populated with all required information to allow for
decision making. Currently the required information has only been provided for the listed practices up
to small dams.
WRC K4/2719 Deliverable 5: Interim report; Refined decision support system for smallholder CSA-October 2018
71
References
Berry, W., Ketterings, Q., Antes, S., Page, S., Russell-Anelli, J., Rao, R.and DeGloria, S., 2007. Soil
texture. Agron Fact Sheet Ser, 29, p.1e2.
Bryan, E., Ringler, C., Okoba, B., Roncoli, C., Silvestri, S. and Herrero, M.,2013. Adapting agriculture to
climate change in Kenya: Household strategies and determinants. Journal of environmental
management, 114, pp.26-35.
Cooper, P.J.M., Dimes, J., Rao, K.P.C., Shapiro, B., Shiferaw, B. and Twomlow, S., 2008. Coping better
with current climatic variability inthe rain-fed farming systemsofsub-Saharan Africa: An essential first
step in adapting to futureclimate change?. Agriculture, Ecosystems & Environment, 126(1-2), pp.24-
35.
Dicks, L.V., Walsh, J.C. and Sutherland, W.J., 2014. Organising evidence for environmental
management decisions: a ‘4S’hierarchy.Trends in ecology & evolution, 29(11), pp.607-613.
Du Preez, C.C., Van Huyssteen, C.W. andMnkeni, P.N., 2011. Land use and soil organic matter in South
Africa 2: A review on the influence of arable crop production. South African Journal of Science, 107(5-
6), pp.35-42.
FAO, 1978. Report on the agroecological zones project vol. 1:Methodology and results for Africa
World Soil Resources Report No. 48. FAO, Rome.
HarvestChoice, 2011. "AEZ (16-code) ." International Food Policy Research Institute, Washington, DC.,
and University of Minnesota, St. Paul, MN. Available online at http://harvestchoice.org/node/4772.
Hengl, T., de Jesus, J.M., Heuvelink, G.B., Gonzalez, M.R., Kilibarda, M., Blagotić, A., Shangguan, W.,
Wright, M.N., Geng, X., Bauer-Marschallinger, B. and Guevara, M.A., 2017.SoilGrids250m: Global
gridded soil information based on machine learning. PLoS one, 12(2), p.e0169748.
IPCC 2014. Barros, V.R., Field, C.B., Dokken, D.J., Mastrandrea, M.D., Mach, K.J., Bilir, T.E., Chatterjee,
M., Ebi, K.L., Estrada, Y.O., Genova, R.C. and Girma, B., 2014. IPCC, 2014: Climate Change 2014:
Impacts, adaptation, andvulnerability. Part B: Regional aspects. Contribution of working Group II to
the fifth assessment report of the intergovernmental panel on climate change.
IPCC 2007. Bernstein, L., Bosch, P., Canziani, O., Chen, Z., Christ, R. and Riahi, K., 2008. IPCC, 2007:
climate change 2007: synthesis report.
Parker, C.G., 2004. Decision support tools: barriers to uptake and use.Aspects of Applied Biology, 72,
pp.31-41.
Simon, U., Brüggemann, R. and Pudenz, S., 2004. Aspects of decision support in water management—
example Berlin and Potsdam (Germany) I—spatially differentiated evaluation. Water Research, 38(7),
pp.1809-1816.
Twomlow, S., Mugabe, F.T., Mwale, M., Delve, R., Nanja, D., Carberry, P. and Howden, M., 2008.
Building adaptive capacity to cope with increasing vulnerability due to climatic change inAfrica–A new
approach. Physics and Chemistry of the Earth, Parts A/B/C, 33(8-13), pp.780-787.
Sebastian, K. ed., 2014. Atlas of African agriculture research and development: Revealing agriculture's
place in Africa. Intl Food Policy Res Inst.
WRC K4/2719 Deliverable 5: Interim report; Refined decision support system for smallholder CSA-October 2018
72
5CCA WORKSHOP 3 AND 4: INDIVIDUAL PRIORITIZATION AND
FARMER EXPERIMENTATION
As a continuation of the CCA process this has been conducted in allthree sites(EC, KZN and Limpopo).
It is based on the group level prioritisation undertaken in the CCA workshop 2 process and builds in a
further levelof individual choice and experimentation. Training and mentoring are provided for
practices new to the community participants. This is summarised in table 2 of this report.
Eastern Cape (Alice, Middledrift, King Williams Town)
Written by Khethiwe Mthethwa and Erna Kruger
Introduction
The research team spent a week in the EC, to continue work started with the Fort Cox College and the
Imvotho Buboni learning network.
CoP: Climate smart agriculture meeting: Fort Cox college of Agriculture and forestry
Institute
The meeting was attended by lecturers from Fort Cox (animal science, crop production, business
studies, engineering and the academic head of thecollege), along with the WRC team. The purpose of
the meeting was to see whether more active collaborationin CSAcould be established in some way
with the college, to strengthen their interaction with the Amanzi for Food networking process they
are already involved in. One of the main concerns that was highlighted by Fort Cox staff members was
that theircurriculum does not include CSA,as it focusses on commercial farming. In their view the two
sets ofideas arenot directly compatible. So, although they have an active interestin CSA, they did not
see it as central to their present brief and curriculum. They felt also that curriculum reviews processes
are possible, but cumbersomeand time consuming. In addition, there are few or no opportunities
for students to work directly with farmers providedthrough the College. The Extension project
presently runby the college is a short- term interaction of a few weeks. There is however interest form
both lecturers and students to be involved in information dissemination processes, as well as
workshops and networking events.
CCA Workshop 3 agenda and process
Participants (24) of the workshop included members of the Imvotho Buboni network and lecturers
and students from Fort Cox Agricultural College.The agenda for the workshop consisted broadly of a
review of Workshop 2 (including prioritization of practices), discussion around climate change
predictions and weather forecasts and planningfor the demonstrations and individual
experimentation process.
The agenda is outlined below.

WRC K4/2719 Deliverable 5: Interim report; Refined decision support system for smallholder CSA-October 2018
73
Along with broad changes in climatic conditions,such as increased temperatures and rainfall
variability, the previous workshop highlighted that farmers are already taking measures towards
adapting to climate change. Farmers listed the practices that they can put into place to cope to the
changes with climate. Some of the practices mentioned were mulching, tunnels and trench beds.
SCION Weather projections
Here an overview was provided of the Seasonal Climate Watch projections that are provided through
the SA WeatherServices. Some of the quarterly temperature and rainfall maps were reviewed (Aug-
Sept-Oct 2018) and participants briefly discussed how useful they thought this information could be
to them.
Most felt that they could not rely on information like this to make decisions around plantingtimes,
although it does help to some extent with giving and indication of what the season would be like. The
maps corroborated their feeling that planting timesare later, as the summer rainfalls have been
starting later and later. It can now even be as late as the 1stweek of December. They do not know
when to plant, but just do it and hope for the best.
Lives stockfarmers suggested that they need to come up with practices that can be used, such as
making hay and silage in summer, for making food available in winter, as winter grazing is becoming
more and more of a problem.
Farmers liked the idea of being able to have some local indicators, such as rain gauges to help them
make decisions, but did not feel confident about relying on information such as the seasonal climate
watch forecasts.
Adaptive measures
The following table shows the impacts and adaptive measures that were discussed in the previous
workshop and were brought forward on the day of the workshop.
Agenda
Facilitation
1.1.Review of Climate Change discussion: Summery
Present pictures from a [previous workshop
Mazwi
1.2.SCION weather projections
Erna
2.1.Impact maps; Adaptive measures
Tema
3.1.Prioritisation of practices
Lawrence
3.1. Matrix
Erna
3.2.Research: Demonstration Sites
Sylvester, Mazwi
3.3.Presentation of Practices
*Conservation Agriculture (Handouts)
*Tunnels
*Furrows
*Mixed cropping and trench beds
Mazwi
Sylvester
Chris
Erna
3.4 Discussion of logistics for demo suites
Erna
3.5 Farmer experimentation
Erna
3.6 Individual choices
Lawrence
3.7 Scheduling (Finding out the locations)
Team
3.8. Scouting visit (4pm) to UmXhumbu (CA and furrow irrigation
Lawrence, Mazwi and Chris
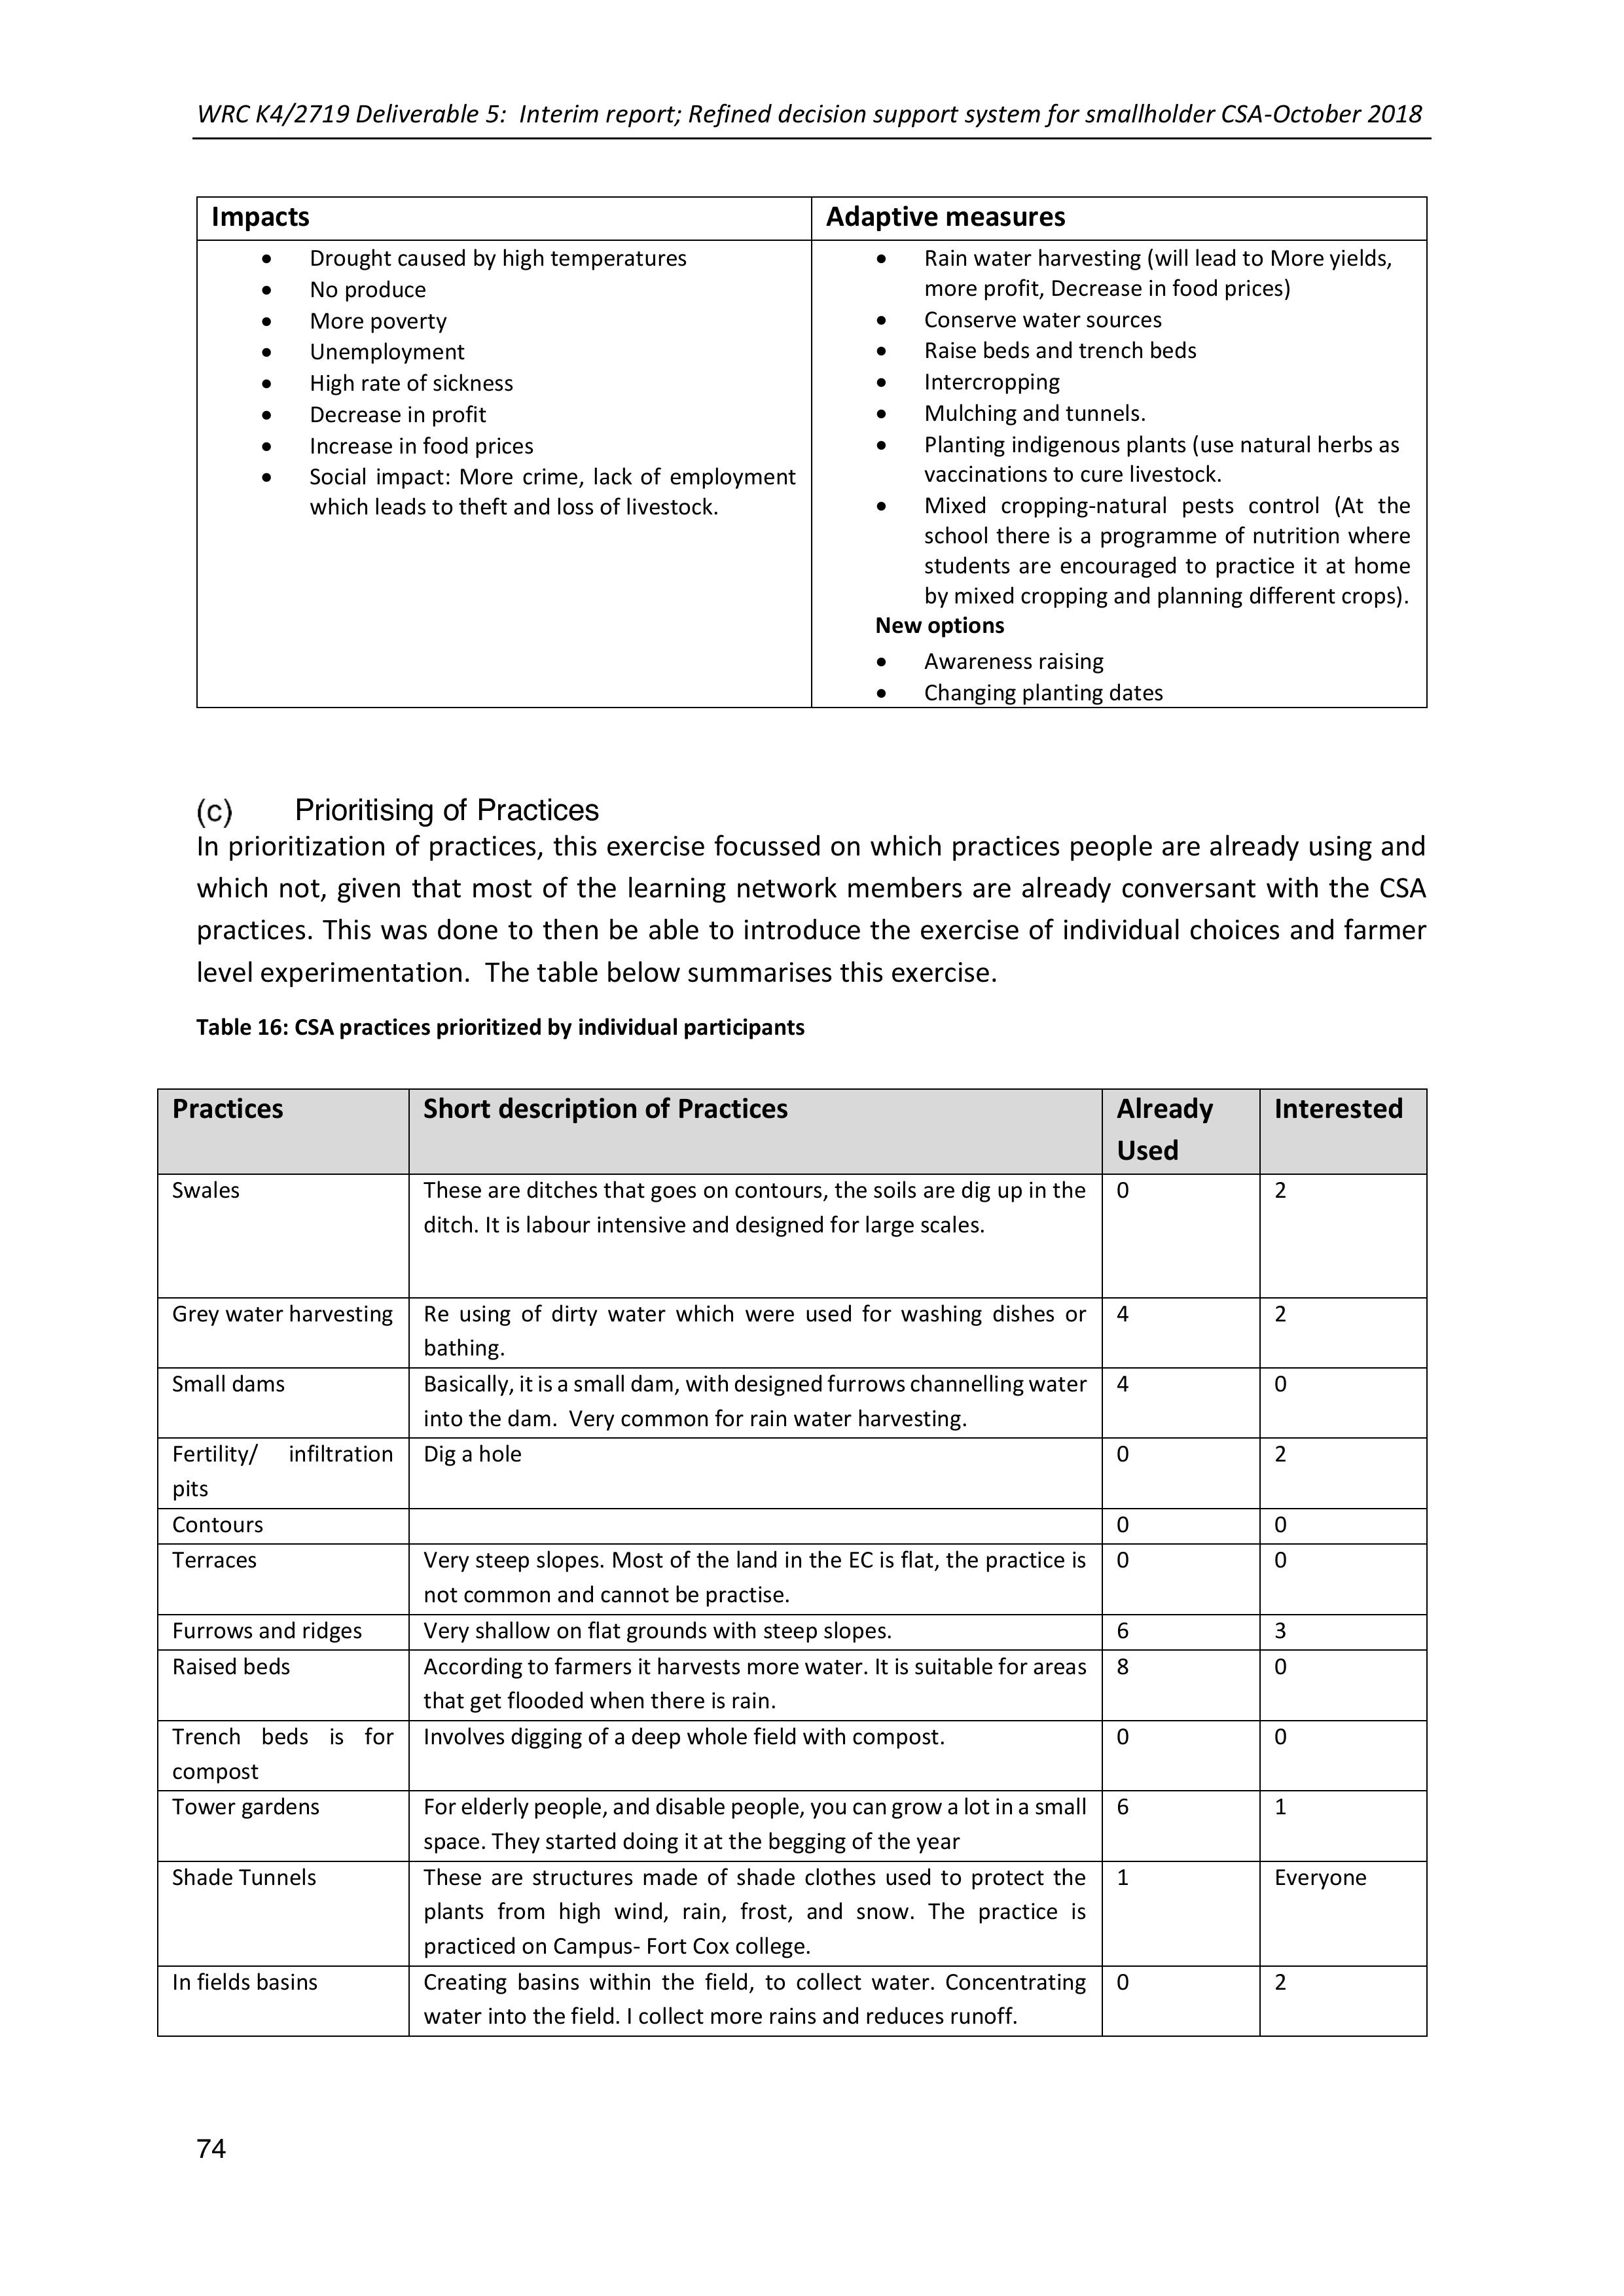
WRC K4/2719 Deliverable 5: Interim report; Refined decision support system for smallholder CSA-October 2018
74
Impacts
Adaptive measures
•Drought caused by high temperatures
•No produce
•More poverty
•Unemployment
•High rate of sickness
•Decrease in profit
•Increase in food prices
•Social impact: More crime, lack of employment
which leads to theft and loss of livestock.
•Rain water harvesting (will lead to More yields,
more profit, Decrease in food prices)
•Conserve water sources
•Raise beds and trench beds
•Intercropping
•Mulching and tunnels.
•Planting indigenous plants (use natural herbs as
vaccinations to cure livestock.
•Mixed cropping-natural pests control (At the
school there isa programme of nutrition where
students are encouraged to practice it at home
by mixed cropping and planning different crops).
New options
•Awareness raising
•Changing planting dates
Prioritising of Practices
In prioritization ofpractices, this exercise focussed on which practices people are already using and
which not, given that most of the learning network members are already conversant with the CSA
practices. This was done to then be able to introduce the exercise of individual choices and farmer
level experimentation. The table below summarises this exercise.
Table 16: CSA practices prioritized by individual participants
Practices
Short description of Practices
Already
Used
Interested
Swales
These are ditches that goes on contours, the soils are dig up in the
ditch. It is labour intensive and designed for large scales.
0
2
Grey water harvesting
Re using of dirty water which were used for washing dishes or
bathing.
4
2
Small dams
Basically, it isa small dam, with designed furrows channelling water
into the dam. Very common for rain water harvesting.
4
0
Fertility/ infiltration
pits
Dig a hole
0
2
Contours
0
0
Terraces
Very steep slopes. Most of the land in the EC is flat, the practice is
not common and cannot be practise.
0
0
Furrows and ridges
Very shallow on flat grounds with steep slopes.
6
3
Raised beds
According to farmers it harvests more water. It is suitable for areas
that get flooded when there is rain.
8
0
Trench beds is for
compost
Involves digging of a deep whole field with compost.
0
0
Tower gardens
For elderly people, and disable people, you can grow a lot in a small
space. They started doing it at the begging of the year
6
1
Shade Tunnels
These are structures made of shade clothes used to protect the
plants from high wind, rain, frost, and snow. The practice is
practiced on Campus- Fort Cox college.
1
Everyone
In fields basins
Creating basins within the field, to collect water. Concentrating
water into the field. I collect more rains and reduces runoff.
0
2

WRC K4/2719 Deliverable 5: Interim report; Refined decision support system for smallholder CSA-October 2018
75
Mulching
It is very common practice which involves using of dead plant
material and grass to cover the soil as a result of protecting it from
erosion and retaining soil moisture.
12
12
Mixed cropping,
intercropping and
close spacing
Putting different plants close together in one field or one plot.
8
Everyone
Crop rotation
Rotating different crops, in different seasons in one field i.e. The
farmers are already rotating cabbage, spinach, beetroot and
onions.
12
Everyone
Underground storage
0
0
Rain water harvesting
Include infiltration, diverging water also helpto increase organic
content of the soil.
Everybody
Everyone
Bucket Drip
Simple and a small-scale drip irrigation system.
0
6
Liquid manure
5
2
Herbs
Grown for health purposes and act as pest control in the garden.
Farmers also use it also for soil fertilisation.
3
3
Conservation
Agriculture
Practice described below
0
12
More detailed introduction to certain practices
Available learning materials, power-point presentations and learning videos were used to introduce a
number of topics, including Conservation Agriculture (CA), tunnels and dripirrigation, furrow irrigation
and mixed cropping. A discussion followed mostly centred around CA and definitions of minimum
tillage and zero tillage.
Farmers asked why CAis promoted ina way thatencourages the use of chemicals and fertiliser,which
does not keep the soil as sustainable as promoted. The response was that in some cases smallholders
prefer to us these chemicals, and MDF is no prescriptive in that regard. Also, it is tricky to start CA on
very depleted and infertile soils and often weeding becomes a major challenge for farmers.
Thus an approach of using chemicals in the beginning, but sparingly, has been advocated, with a
gradual conversion to a low external input system.
Furthermore, Lawrence said each farmer needsto make their own decisionsin their context. As an
ecological farmer you can choose not to use herbicides at all. Farmers were very convinced that they
are trying by all means to reduce dependency on fertiliser.
A further question regarding the tunnels and drip irrigation, was where drip irrigation is only suitable
for small areas.
What is the difference between minimum tillage and zero tillage?
*Minimum till entails littledisturbance of the soil- one makes basins or lines where you will directly
deposit your seeds and zero tillage is when you do not till the soil at all. Normally with zero tillage
implements are used.
*0% Disturbance -Zero tillage. 0-5% Disturbance - minimum tillage. 0-15% Disturbance –Conservation
tillage
How big is the piece of land to do drip irrigation and crop rotation?
It does not matter how big the space is, it all relies on the kind of soil. The spacing depends on the type
of soil then the type of plants. Drip irrigation is tested out on the soil.
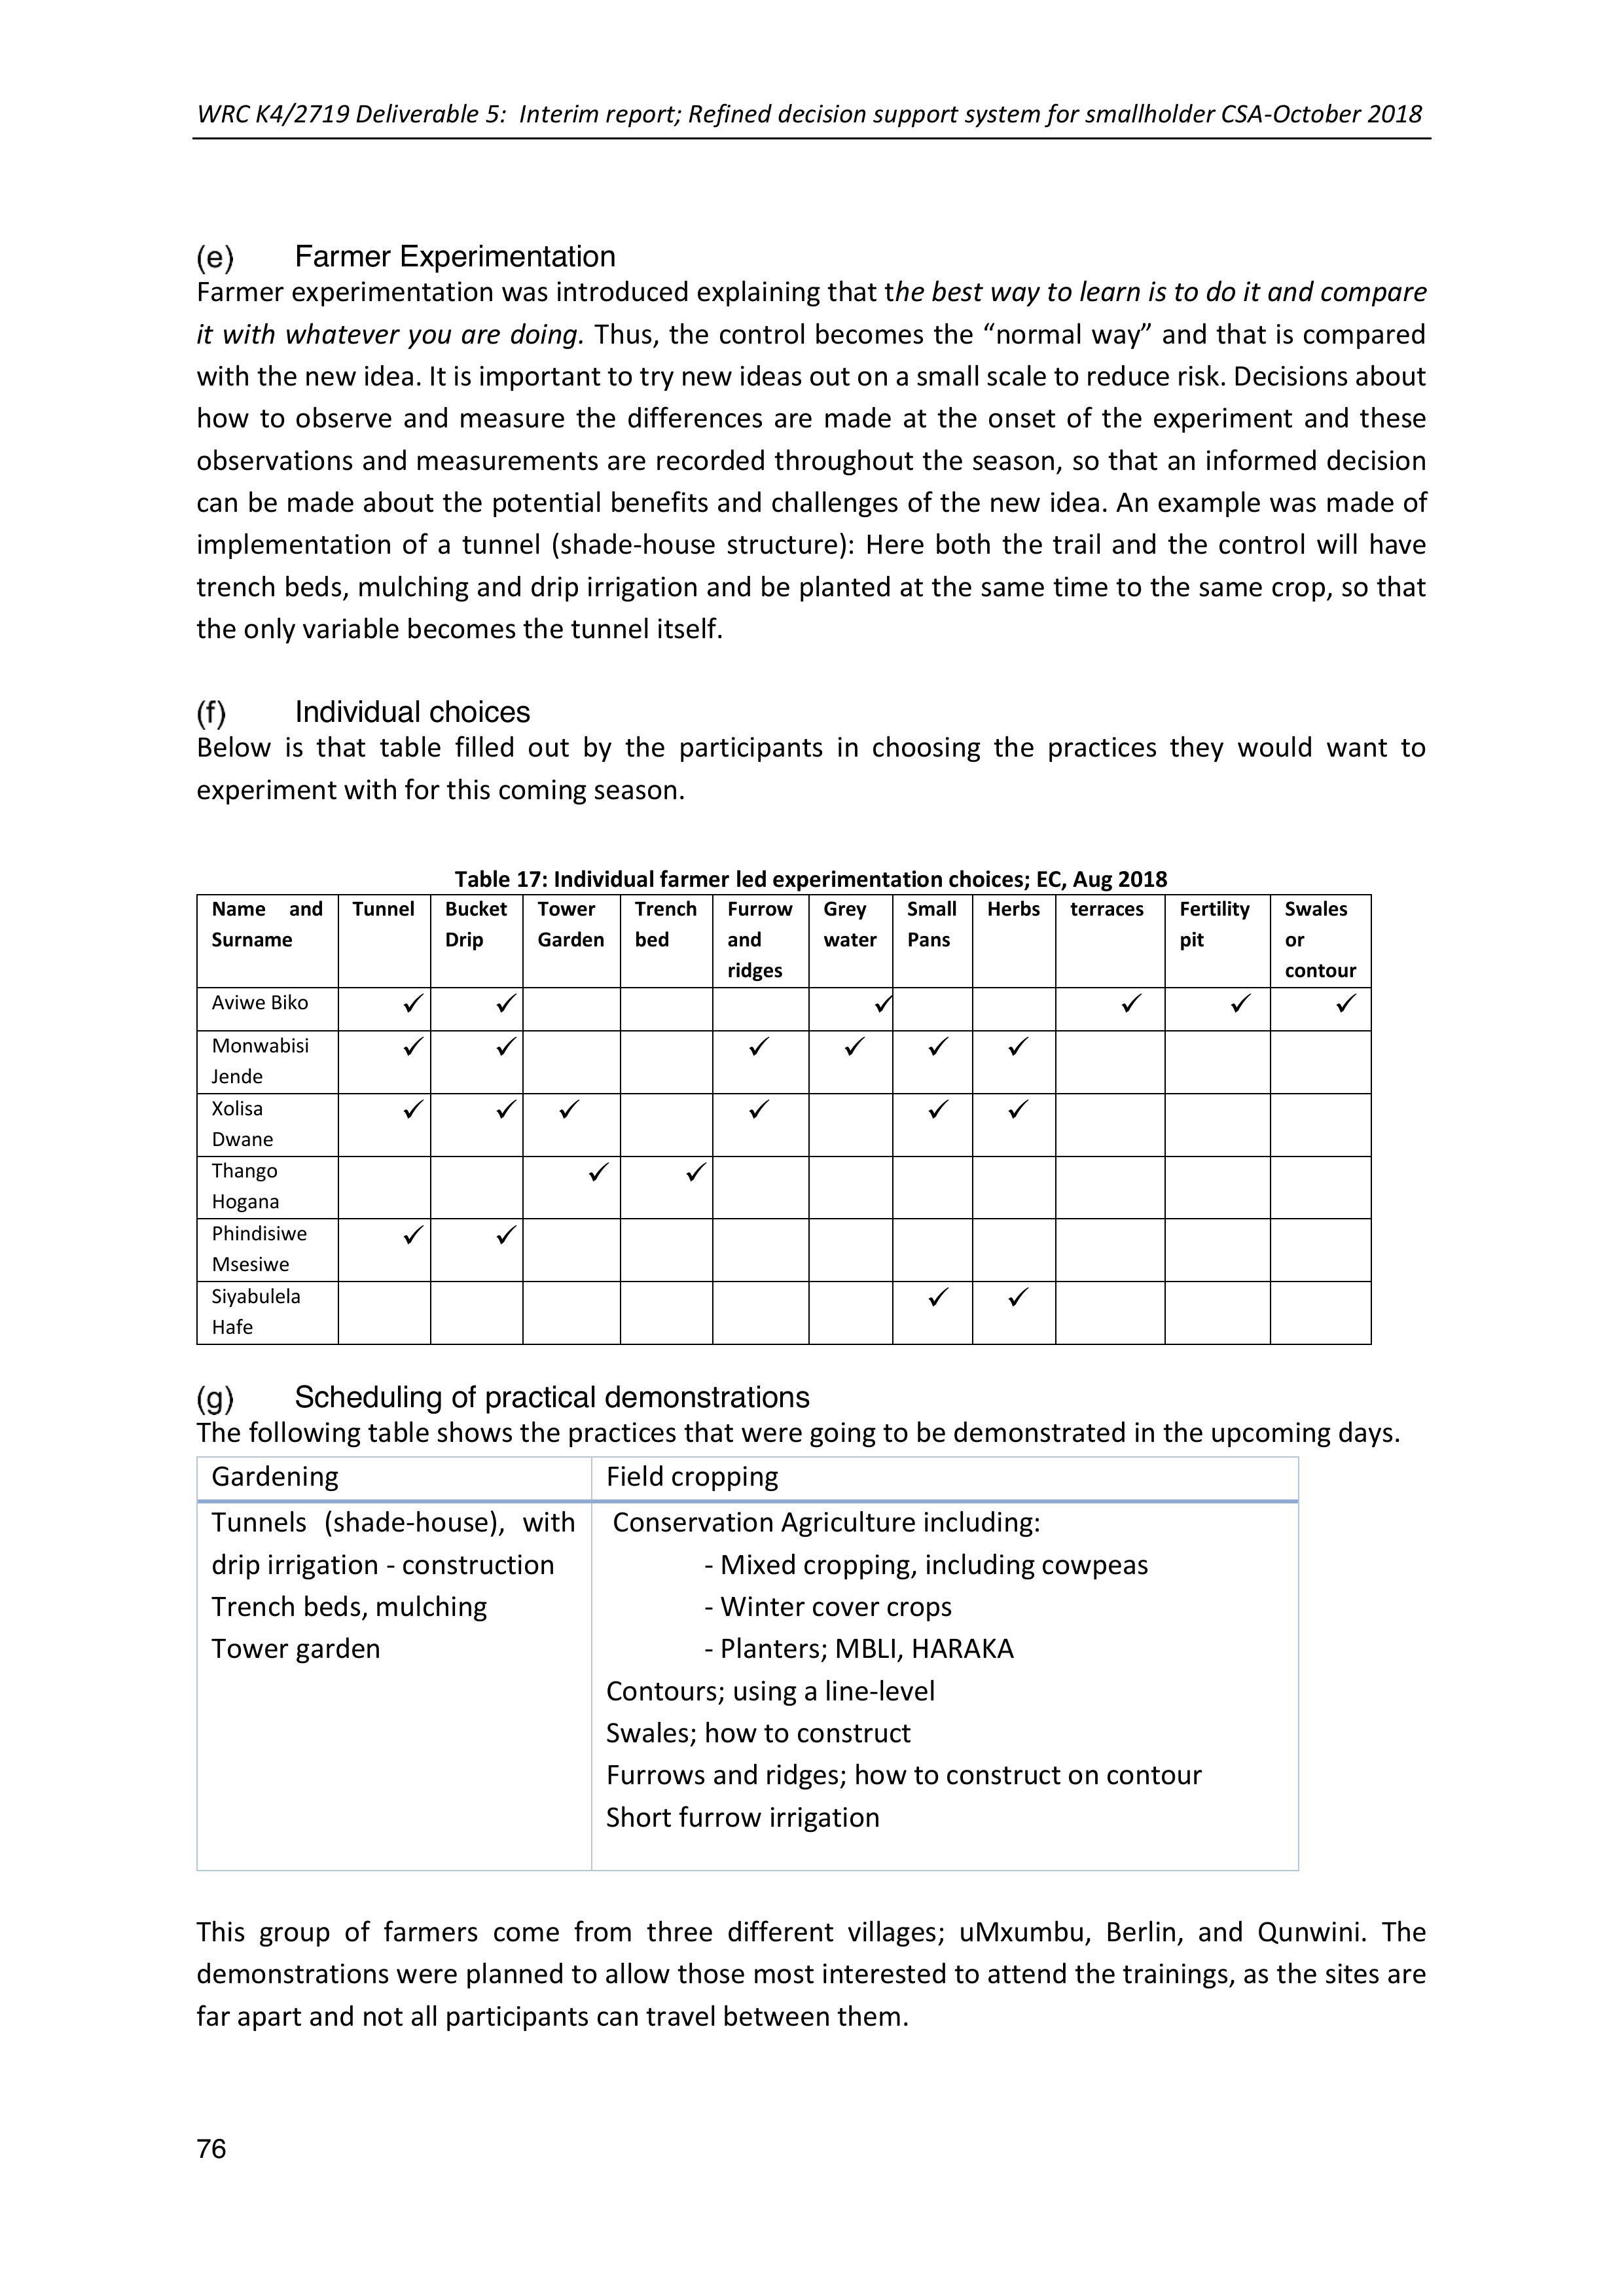
WRC K4/2719 Deliverable 5: Interim report; Refined decision support system for smallholder CSA-October 2018
76
Farmer Experimentation
Farmer experimentation was introduced explaining that the best way to learn is to do it and compare
it with whatever you are doing.Thus, the controlbecomes the “normal way” and that is compared
with the new idea. It is important to try new ideas out on a small scale to reduce risk. Decisions about
how to observe and measure the differences are made at the onset of theexperiment and these
observations and measurements are recorded throughout the season, so that an informed decision
can be madeabout the potential benefits and challenges of the new idea.An example was made of
implementation of a tunnel (shade-house structure): Here both the trail and the control will have
trench beds, mulching and drip irrigation and be planted at the same time to thesame crop, so that
the only variable becomes the tunnel itself.
Individual choices
Below is that table filled out by the participants in choosing the practices they would want to
experiment with for this coming season.
Table 17: Individual farmer led experimentation choices; EC, Aug 2018
Name and
Surname
Tunnel
Bucket
Drip
Tower
Garden
Trench
bed
Furrow
and
ridges
Grey
water
Small
Pans
Herbs
terraces
Fertility
pit
Swales
or
contour
Aviwe Biko
✓
✓
✓
✓
✓
✓
Monwabisi
Jende
✓
✓
✓
✓
✓
✓
Xolisa
Dwane
✓
✓
✓
✓
✓
✓
Thango
Hogana
✓
✓
Phindisiwe
Msesiwe
✓
✓
Siyabulela
Hafe
✓
✓
Scheduling of practical demonstrations
The following table shows the practices that were going to be demonstrated in the upcoming days.
Gardening
Field cropping
Tunnels (shade-house), with
drip irrigation - construction
Trench beds, mulching
Tower garden
Conservation Agriculture including:
- Mixed cropping, including cowpeas
- Winter cover crops
- Planters; MBLI, HARAKA
Contours; using a line-level
Swales; how to construct
Furrows and ridges; how to construct on contour
Short furrow irrigation
This group of farmers come from three different villages; uMxumbu, Berlin, and Qunwini. The
demonstrations were planned to allow those most interested to attend the trainings, as the sites are
far apart and not all participants can travel between them.

WRC K4/2719 Deliverable 5: Interim report; Refined decision support system for smallholder CSA-October 2018
77
Demonstration 1: Field cropping
The demonstration took place inMiddledrift in UMxumbu. The learning group ismade up of young 11
farmers from a community co-operative called UMxumbu Agricultural Youth co-op. The
demonstration took place on the 01stof August. Two group members were available and the
undertook to share their knowledge with group members.
For CA plot preparation and layout was demonstrated
and the use of the two types of planters shown with
the different seed types; maize, beans, cowpeas, saia
oats, fodderrye and fodder radish. Plantingwas not
done- as the participants felt they would rather plant
when there was a better chance of success
(November).
Right: Mazwi explaining layout; basins and rows in CA planting
to the participants
Similarly, the construction
of furrows, for short
furrow irrigation was
demonstrated at a
household level.
Participants would extend
this practice to their larger
fields when preparingfor
summer planting.
Right; Chris demonstrating the
construction and layout of short
furrows
Demonstration 2: Tunnel and bucket Drip
The training took place in Berlin at Izingisi Education Centre. There were 11 participantswho attended
the training. The practicesthat were demonstrated was the tunnel, bucket drip and a chameleon
water sensors.
Practice
Venue
Time
Contact
Person
Contact Details
Demo 1
(day 1)
Field cropping
UMxumbu location
9:30
Xolisa
Dwane
0790580774
Demo 2
(day 2)
Tunnel and bucket
Drip
Berlin. Izingisi
Education Centre-
No 6 CarlPape
street
8:30
Eddie
Parichi
0782971373
/0436852040Izingisi
Educational Project
Demo 3
(day 3
Tower Garden
Qunwini
09:00
Phindiwe
Msesiwe
0835926707
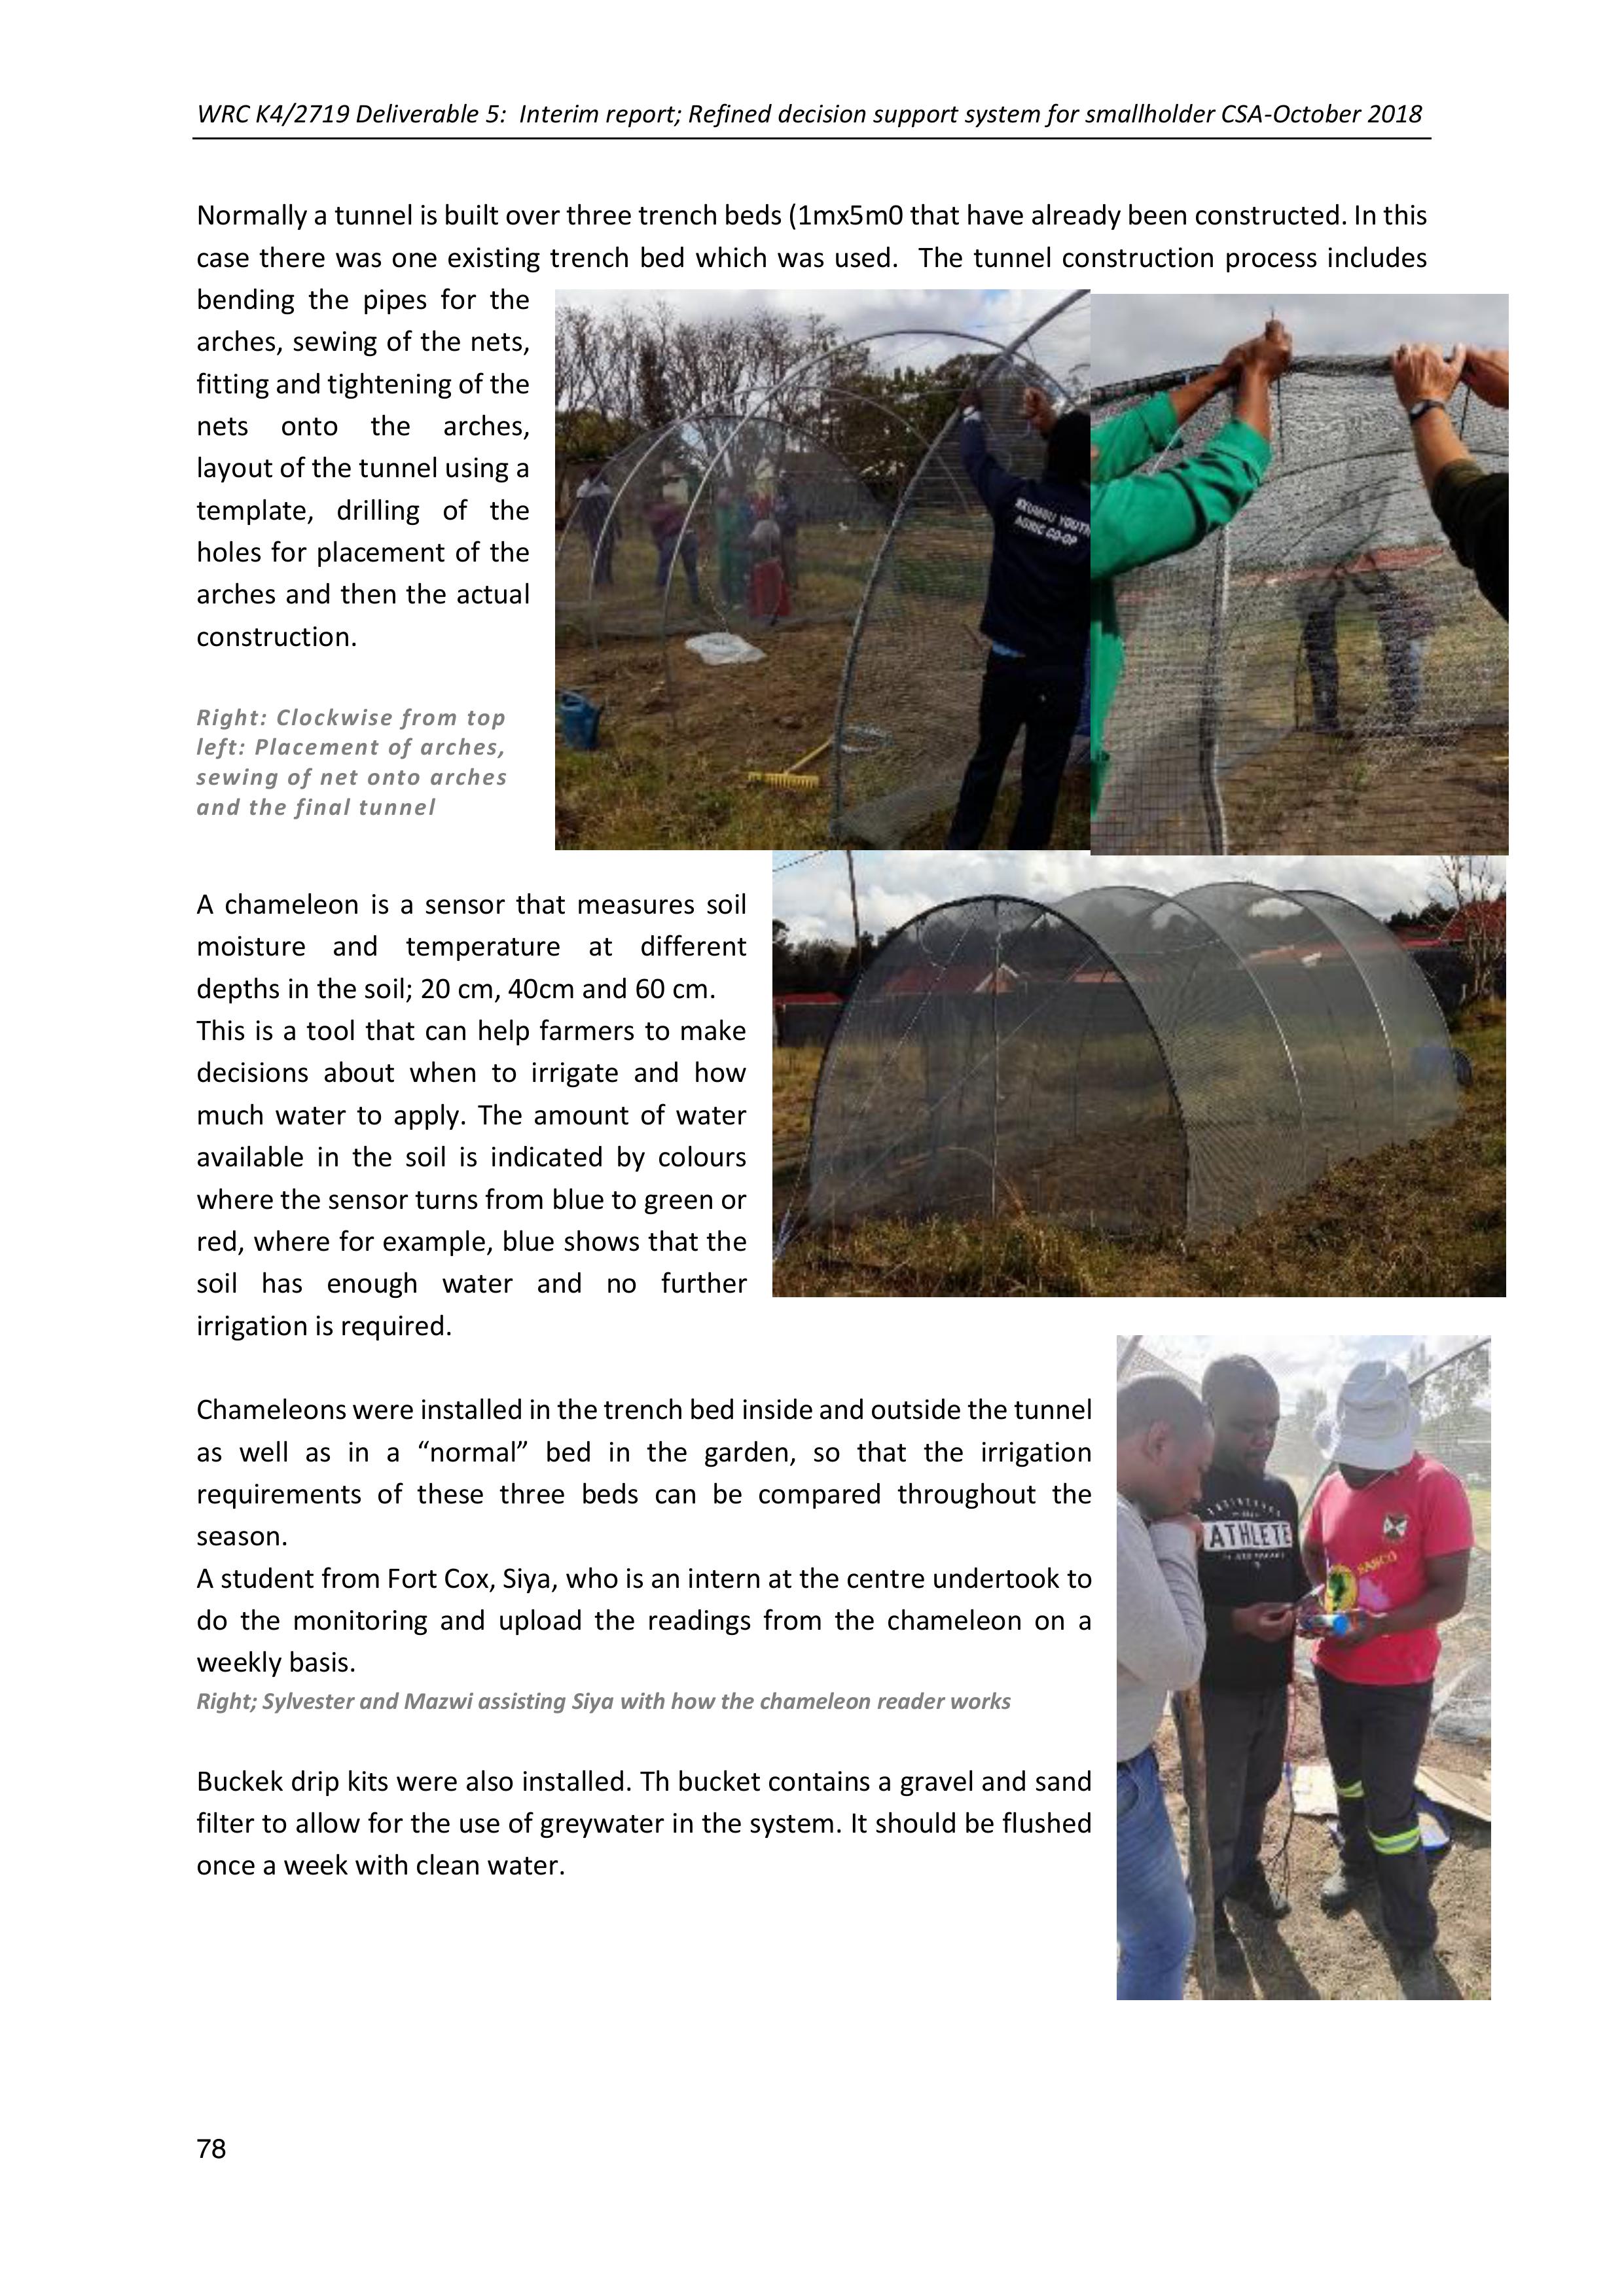
WRC K4/2719 Deliverable 5: Interim report; Refined decision support system for smallholder CSA-October 2018
78
Normally a tunnel isbuilt over three trench beds (1mx5m0 thathave alreadybeen constructed. In this
case there was one existing trench bed which was used. The tunnel construction process includes
bending the pipes for the
arches, sewing of the nets,
fitting and tightening of the
nets onto the arches,
layout of the tunnel using a
template, drilling of the
holes for placement of the
arches and then the actual
construction.
Right:Clockwisefromtop
left:Placementofarches,
sewingofnetontoarches
andthefinaltunnel
A chameleon is a sensor that measures soil
moisture and temperature at different
depths in the soil; 20 cm, 40cm and 60 cm.
This is a tool that can help farmers to make
decisions about when to irrigate and how
much water to apply. The amount of water
available in the soilis indicated by colours
where the sensor turns from blue to green or
red, where for example, blue shows that the
soil has enough water and no further
irrigation is required.
Chameleons were installed in the trench bed inside and outsidethe tunnel
as well as ina “normal” bed in the garden, so that the irrigation
requirements of these three beds can be compared throughout the
season.
A student from Fort Cox, Siya, who is an intern at the centre undertook to
do the monitoring and upload the readings from the chameleon on a
weekly basis.
Right; Sylvester and Mazwi assisting Siya with how the chameleon reader works
Buckek drip kits were also installed. Th bucket contains a gravel and sand
filter to allow for the use of greywater in the system. It should be flushed
once a week with clean water.

WRC K4/2719 Deliverable 5: Interim report; Refined decision support system for smallholder CSA-October 2018
79
Right; the gravel and sand placement in the bucket
to filter greywater
Demonstrations 3: Tower Garden and bucket drip
The MDF team split into two; one group remained in Berlin to finalise the tunnel and chameleons
installation and the other sub-groupwent to Quzini to do the tower garden demonstration in Mama
Phindiwe Msisiwe’s Garden.
Materials needed were a 3m shade net, 4 poles, spades, Soil: manure: ash mixture -6:3:2, a wheel
barrow, seedlings, tape measure, bucket, water and a knife. The soil mixturewasprepared by the
farmer the day before. The following explains the tower garden making process step by step.
Step 1: identifying space and measuring
The tower garden was installed ona
very flat surface. A 90mm diameter was
used to measure the length between
the poles. One pole was initially
installed. And holes were dug for other
three poles to be placed later on.
Step 2: Measuring and sewing of
the net
The net size that is required to
make atower garden is 3m long.
Once the net is properly
measured it is then sewed on the
ends. Sewing was done on the
ends of the net to achieve a
round skirt like shape.
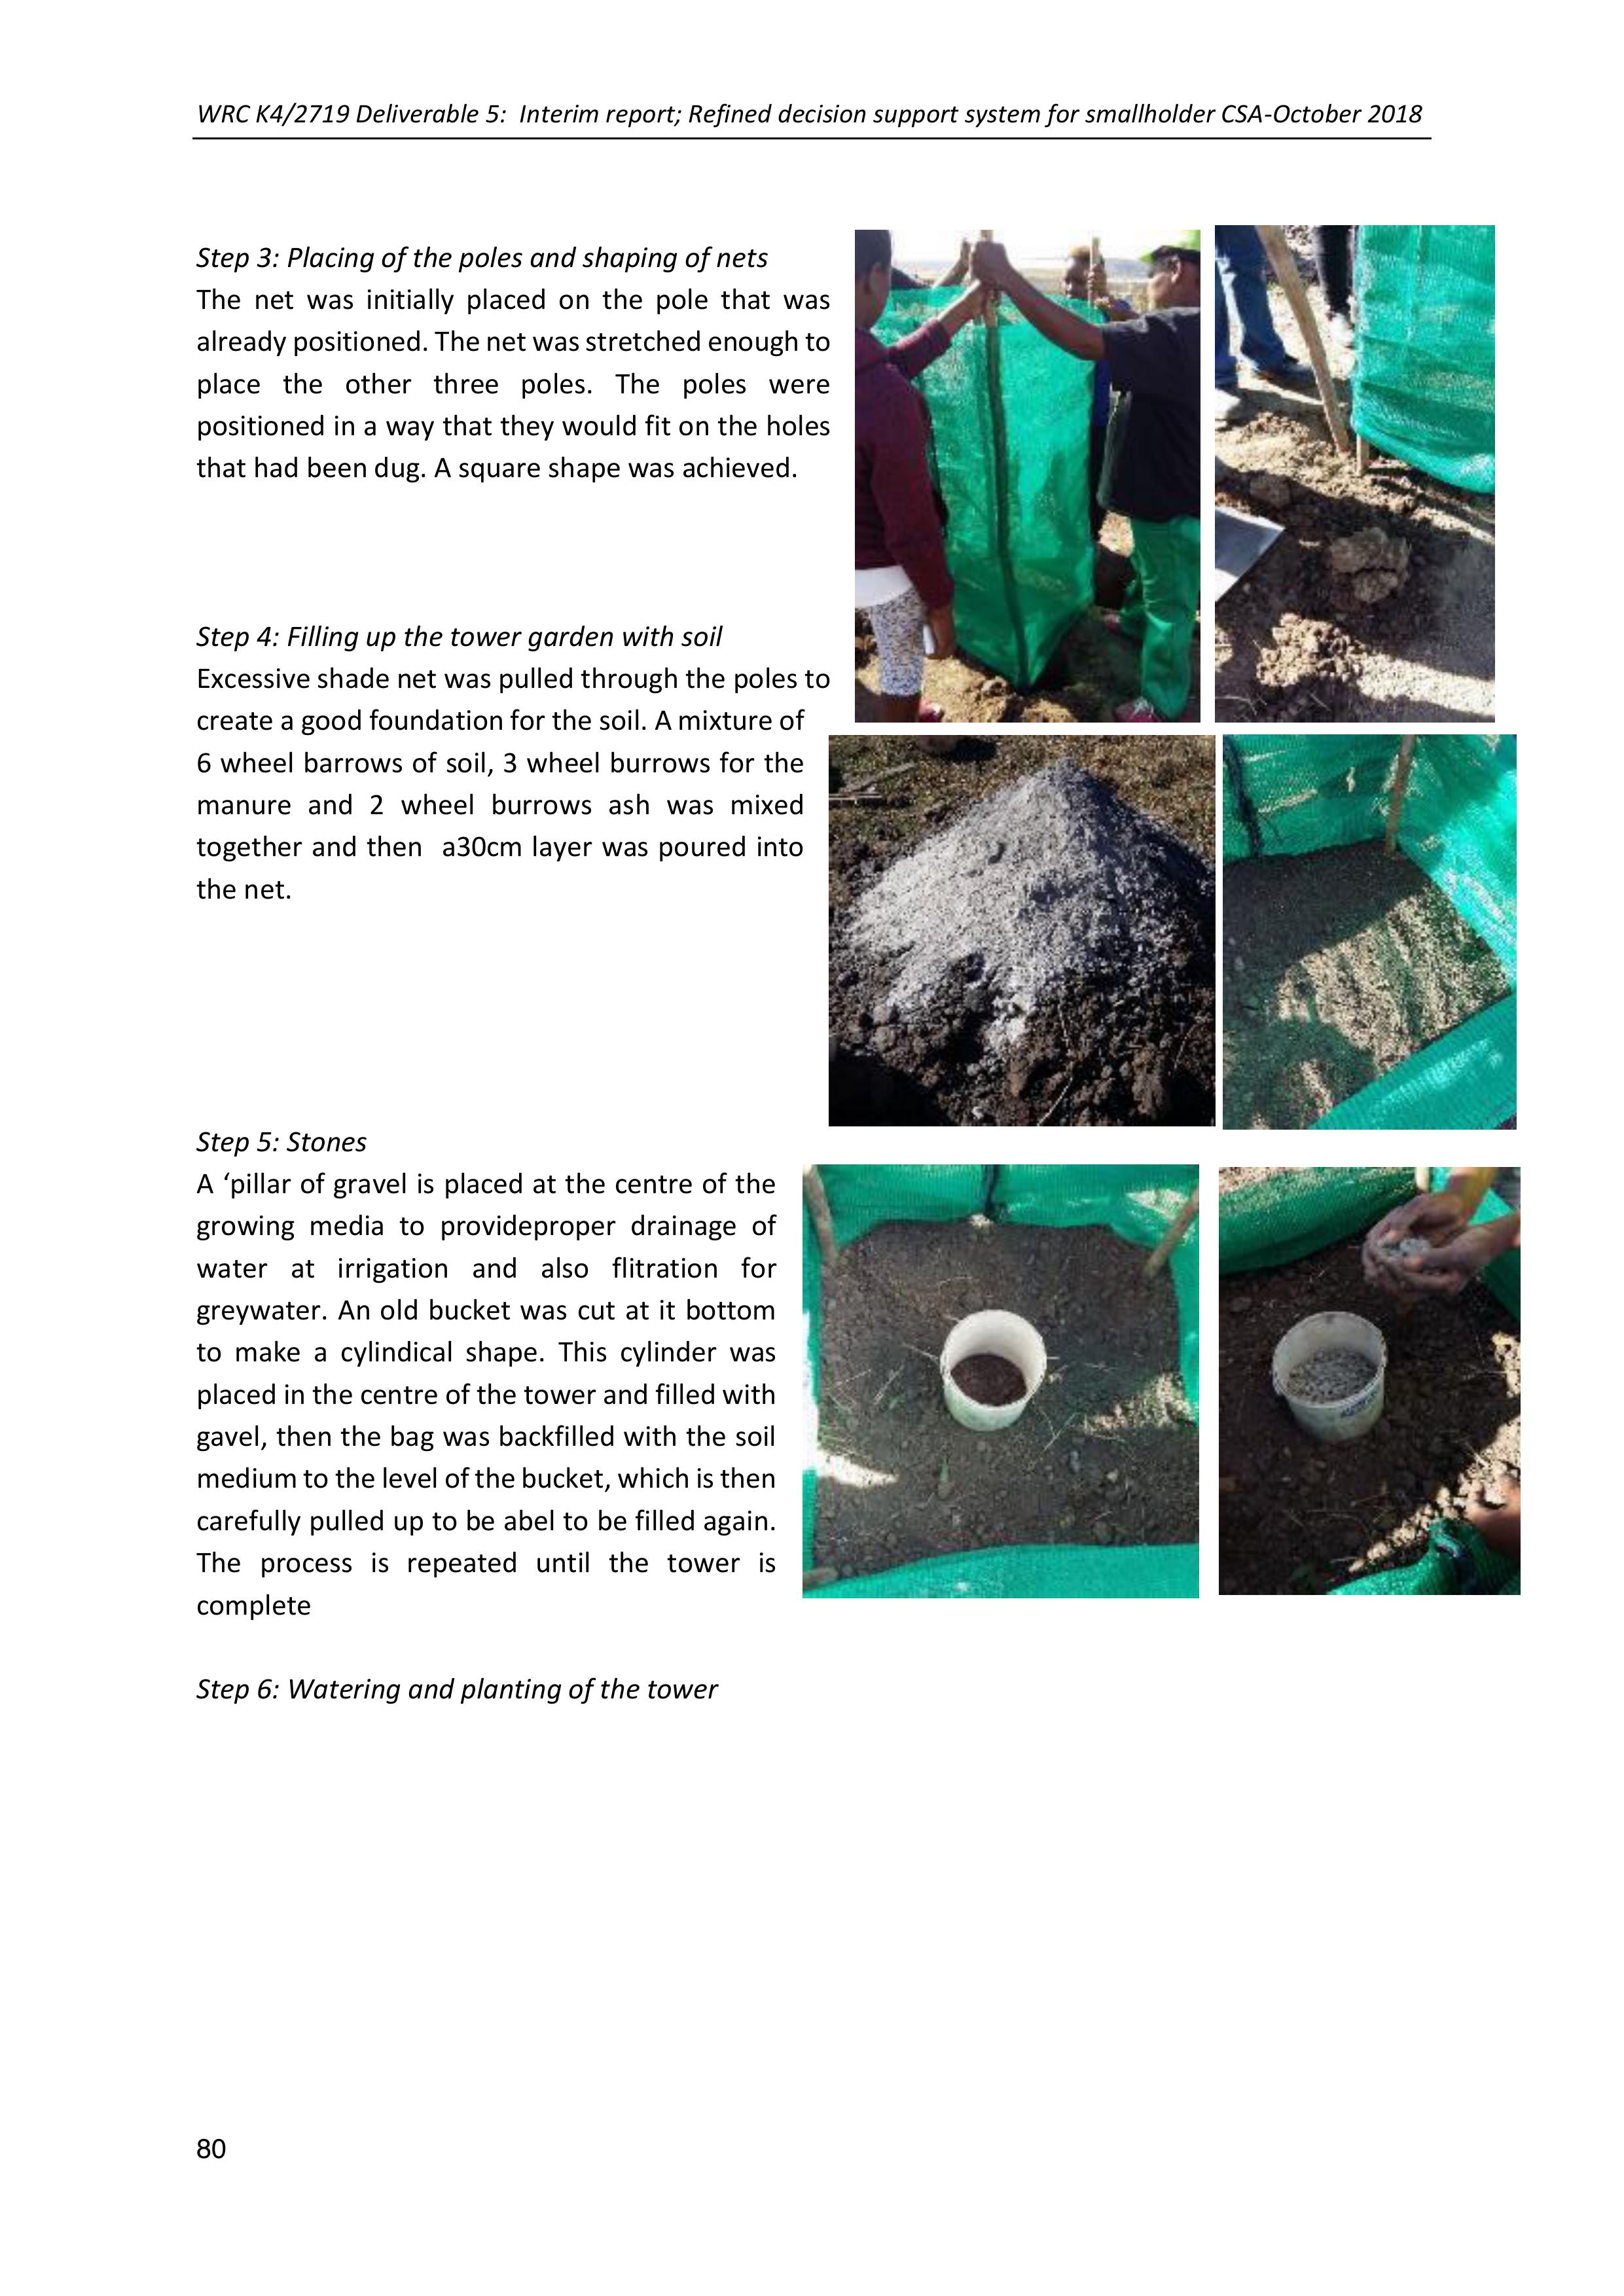
WRC K4/2719 Deliverable 5: Interim report; Refined decision support system for smallholder CSA-October 2018
80
Step 3: Placing of the poles and shaping of nets
The net was initially placed on the pole that was
already positioned. The net was stretched enough to
place the other three poles. The poles were
positioned in a way that they would fit on the holes
that had been dug. A square shape was achieved.
Step 4: Filling up the tower garden with soil
Excessive shade net was pulled through the poles to
create a good foundation for the soil. Amixture of
6 wheel barrows ofsoil, 3 wheel burrows for the
manure and 2 wheel burrows ash was mixed
together and then a30cmlayer was poured into
the net.
Step 5: Stones
A ‘pillar of gravel isplaced atthe centreof the
growing media to provideproper drainage of
water at irrigation and also flitration for
greywater. An old bucket was cut at it bottom
to make a cylindical shape. This cylinder was
placed in the centre of the tower and filled with
gavel, then the bag was backfilled with the soil
medium to the level of thebucket,which is then
carefully pulled up to be abel to be filled again.
The process is repeated until the tower is
complete
Step 6: Watering and planting of the tower
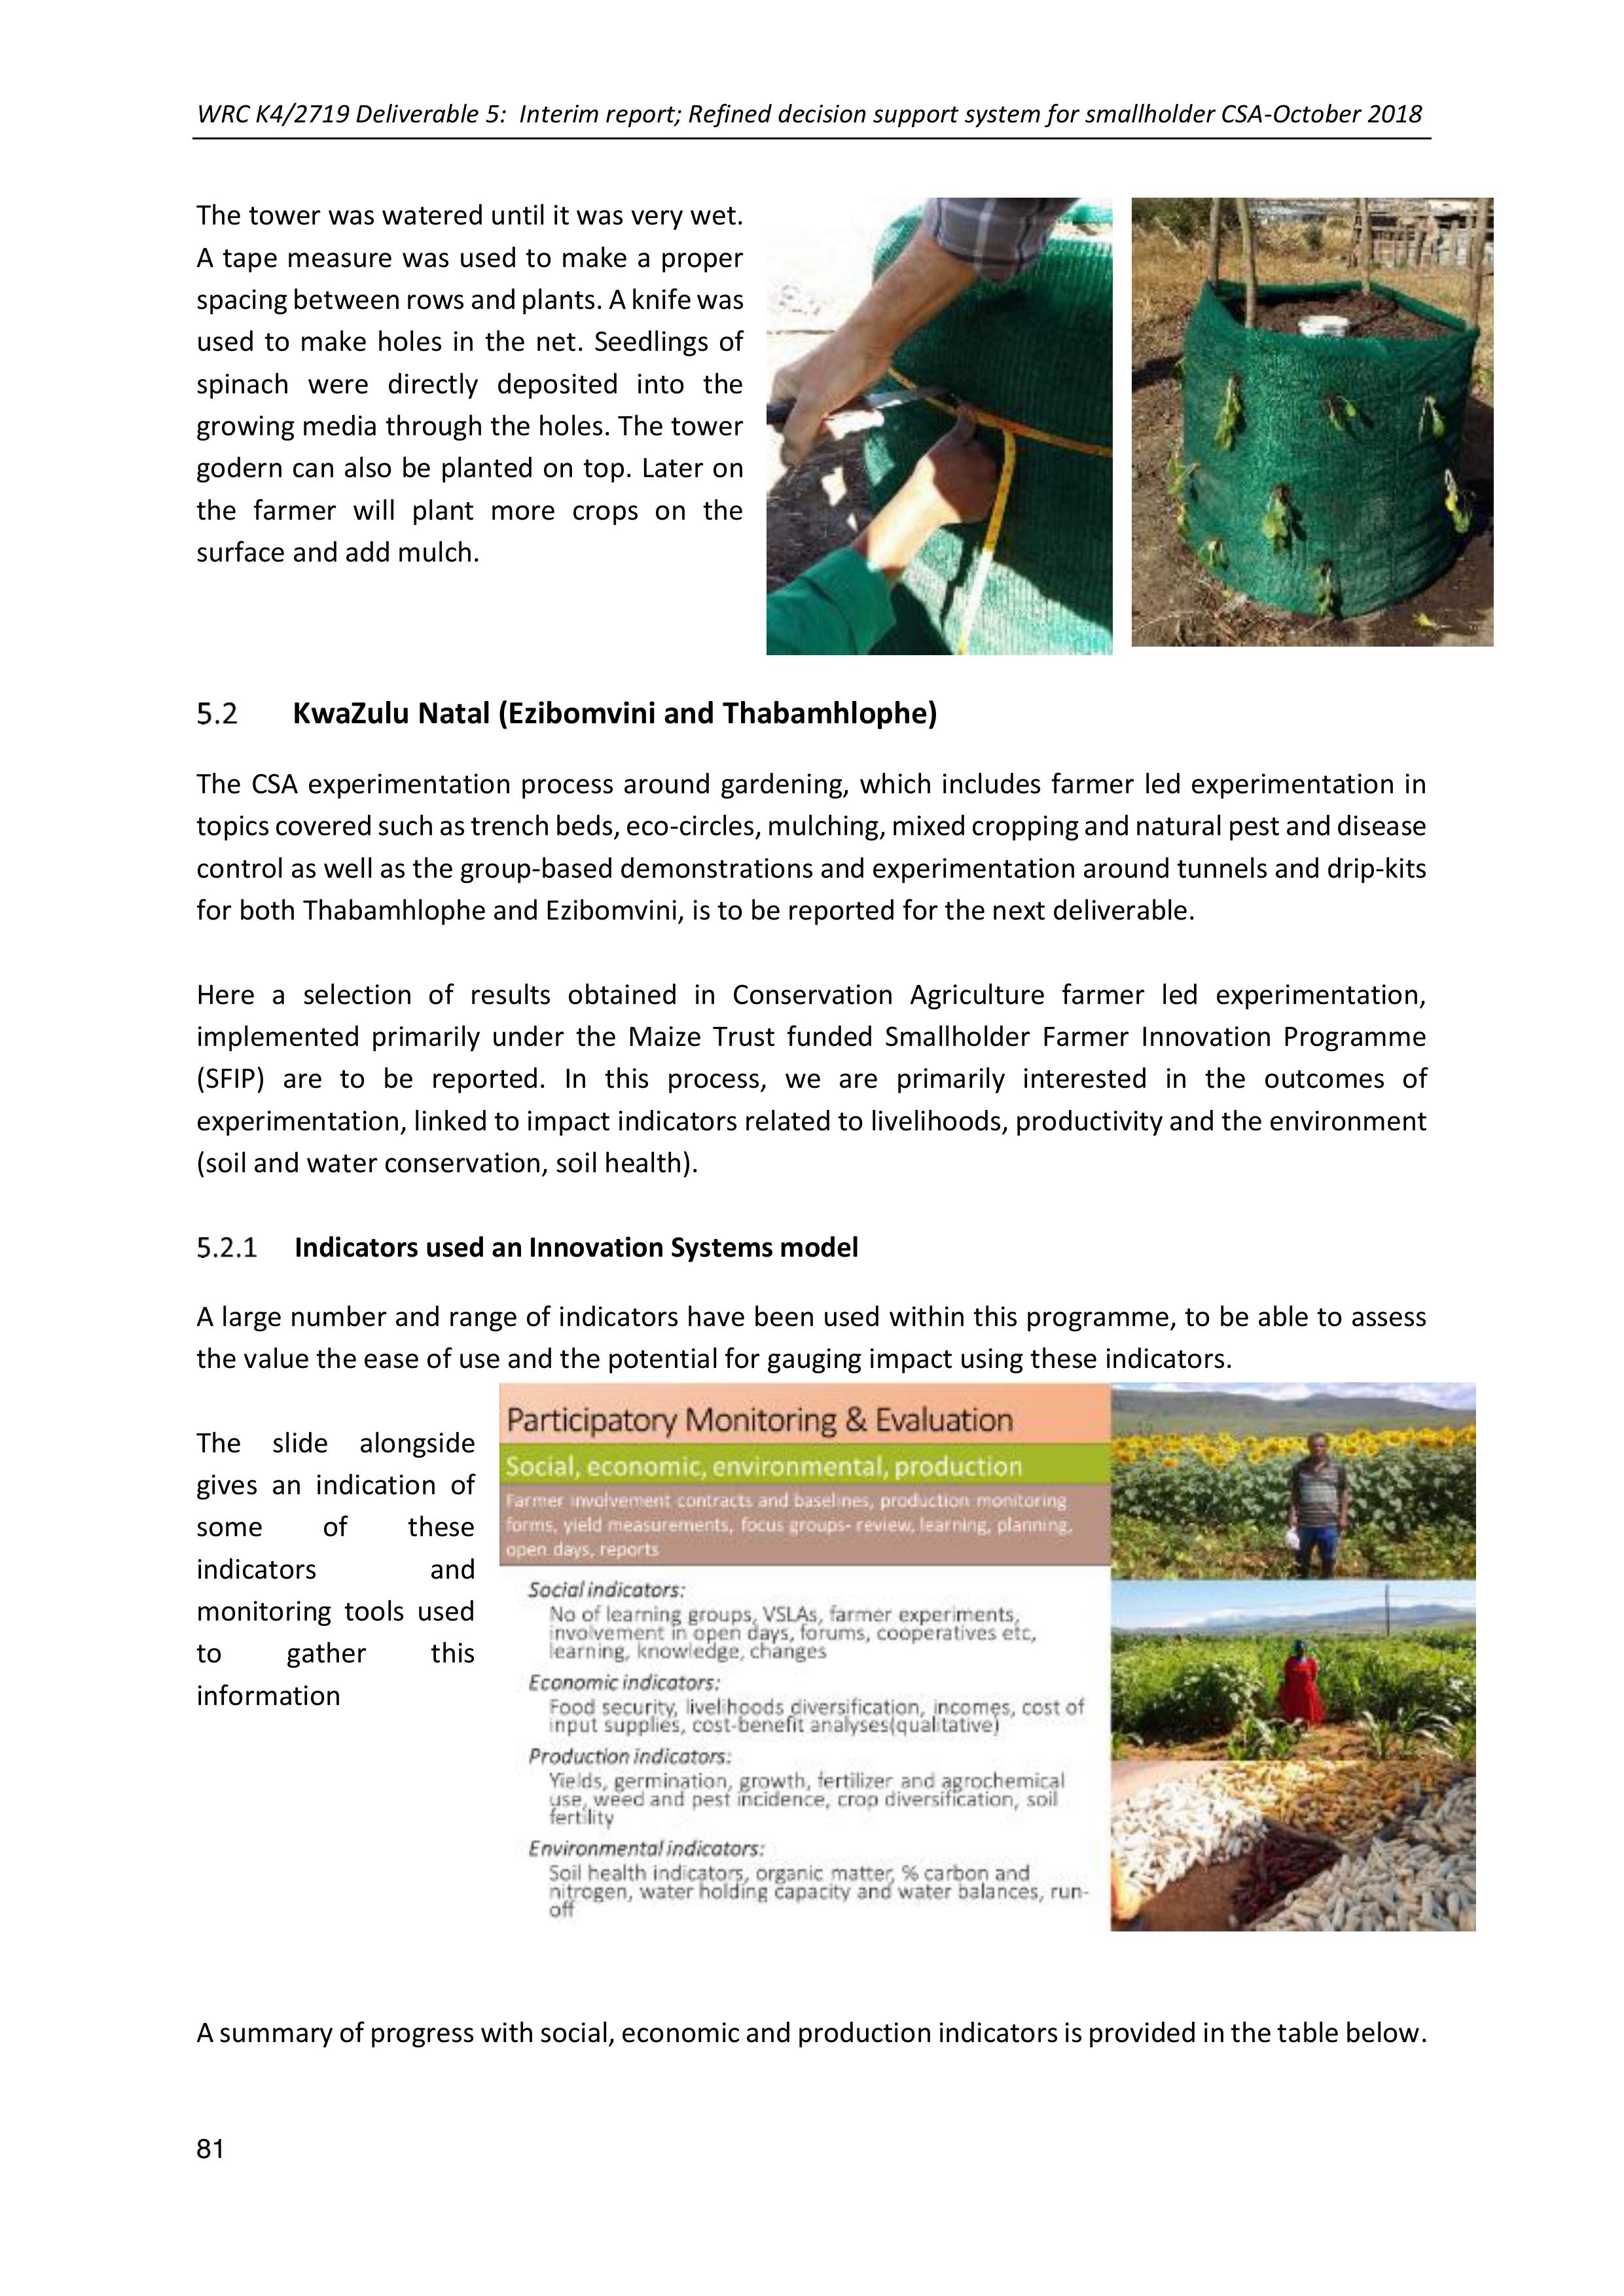
WRC K4/2719 Deliverable 5: Interim report; Refined decision support system for smallholder CSA-October 2018
81
The tower was watered until it was very wet.
A tape measure was used to make a proper
spacing between rows and plants. A knife was
used to make holes in the net. Seedlings of
spinach were directly deposited into the
growing media through theholes. The tower
godern can also be plantedon top. Later on
the farmer will plant more crops on the
surface and add mulch.
KwaZulu Natal (Ezibomvini and Thabamhlophe)
The CSA experimentation process around gardening,which includes farmer led experimentation in
topics covered such as trench beds, eco-circles, mulching, mixed cropping and natural pest and disease
control as well as the group-based demonstrations and experimentation around tunnels and drip-kits
for both Thabamhlophe and Ezibomvini, is to be reported for the next deliverable.
Here a selection of results obtained in Conservation Agriculture farmerled experimentation,
implemented primarily under the Maize Trust funded Smallholder Farmer InnovationProgramme
(SFIP) are to be reported. In thisprocess, we are primarilyinterested in the outcomes of
experimentation, linked to impact indicators related to livelihoods, productivity and the environment
(soil and water conservation, soil health).
Indicators used an Innovation Systems model
A large number and range of indicators have been used within this programme, tobe able to assess
the value the ease of use and the potential for gauging impact using these indicators.
The slide alongside
gives an indication of
some of these
indicators and
monitoring tools used
to gather this
information
A summary of progress with social,economicandproduction indicatorsis provided inthe table below.
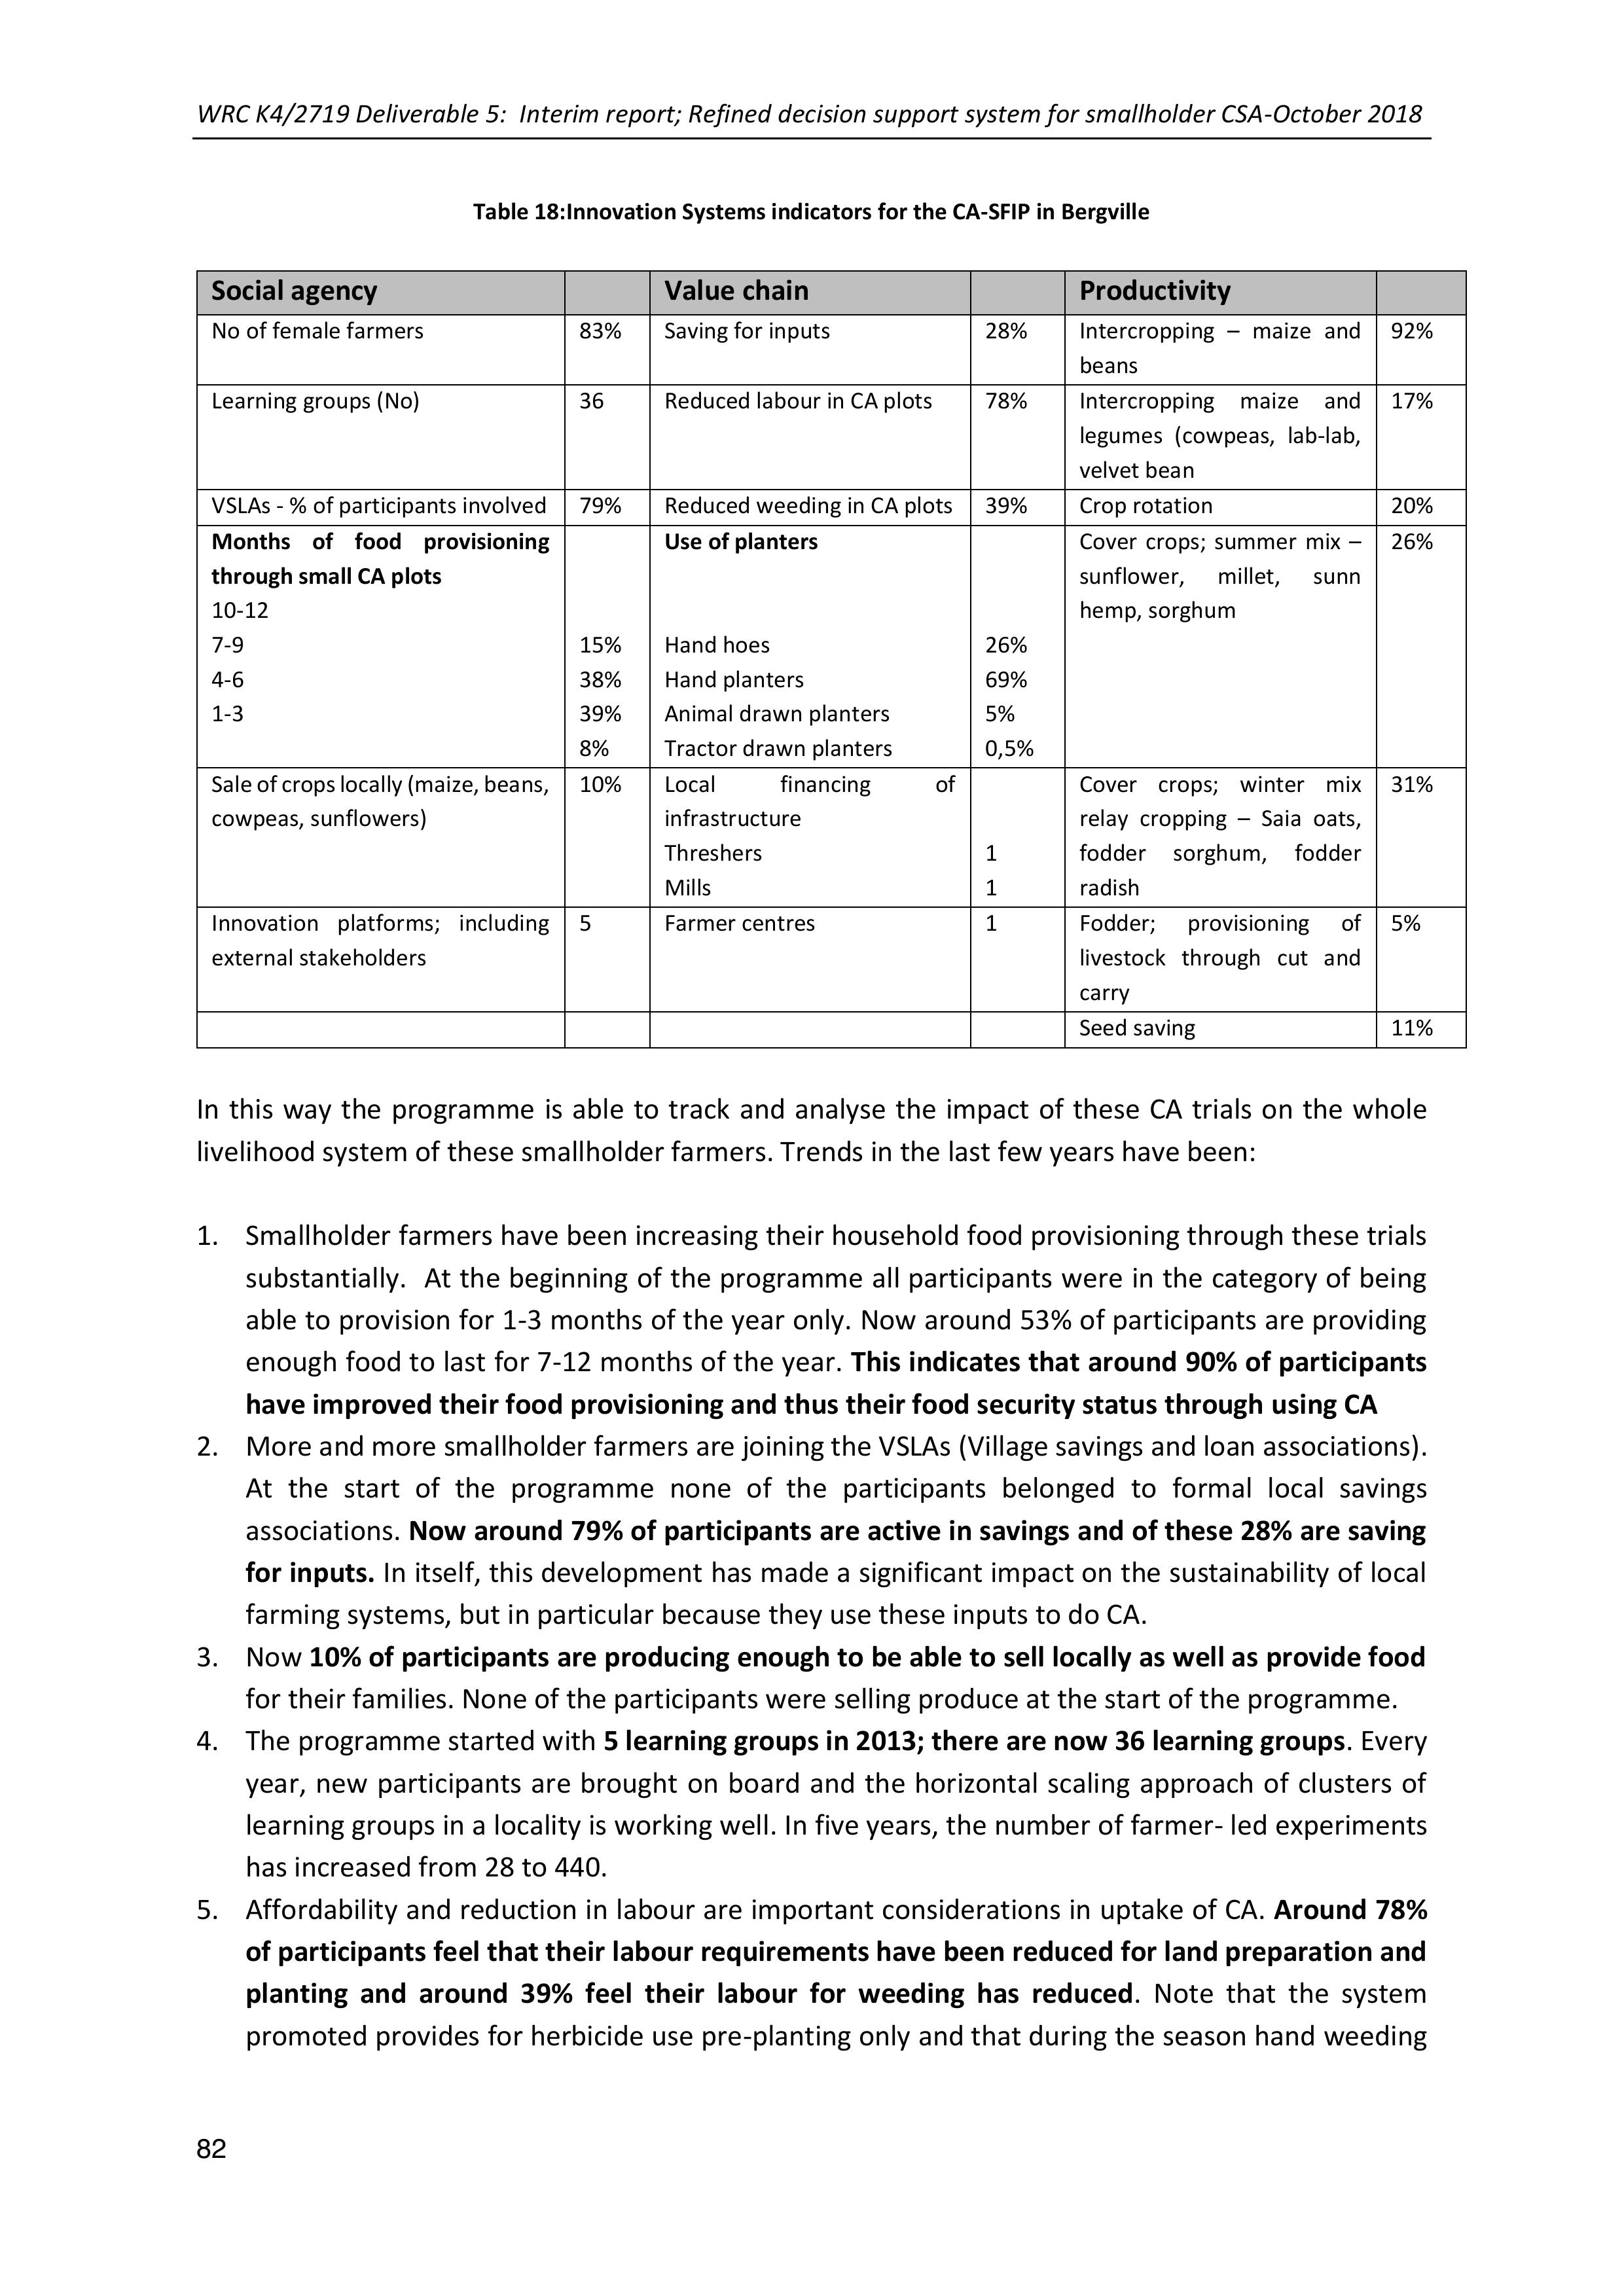
WRC K4/2719 Deliverable 5: Interim report; Refined decision support system for smallholder CSA-October 2018
82
Table 18:Innovation Systems indicators for the CA-SFIP in Bergville
In this way the programme is able to track and analyse the impact of these CA trials on the whole
livelihood system of these smallholder farmers. Trends in the last few years have been:
1.Smallholder farmers have been increasing their household food provisioning through these trials
substantially. At thebeginning of the programme allparticipants were in the category of being
able to provision for 1-3 months of the year only. Now around 53% of participants are providing
enough food tolast for 7-12 months of the year. This indicates that around 90% of participants
have improved their food provisioning and thus their food security status through using CA
2.More and more smallholder farmers are joining the VSLAs (Village savings and loan associations).
At the start of the programme none of the participants belonged to formal local savings
associations. Now around 79% of participants are active in savings and of these 28% are saving
for inputs. In itself, this development has made a significant impact on the sustainability of local
farming systems, but in particular because they use these inputs to do CA.
3.Now 10% of participants are producing enough to be able to sell locally as well as provide food
for their families. None of the participants were selling produce at the start of the programme.
4.The programme started with 5 learning groups in 2013; there are now 36 learning groups. Every
year, new participantsare brought on board and the horizontal scaling approach of clusters of
learning groups in a locality is working well. In five years, the number of farmer- led experiments
has increased from 28 to 440.
5.Affordabilityand reduction in labour are important considerations in uptake of CA. Around 78%
of participants feel that their labour requirements have been reduced for land preparation and
planting and around 39% feel their labour for weeding has reduced. Notethat the system
promoted provides for herbicide use pre-planting only and that during the season hand weeding
Social agency
Value chain
Productivity
No of female farmers
83%
Saving for inputs
28%
Intercropping –maize and
beans
92%
Learning groups (No)
36
Reduced labour in CA plots
78%
Intercropping maize and
legumes (cowpeas, lab-lab,
velvet bean
17%
VSLAs - % of participants involved
79%
Reduced weeding in CA plots
39%
Crop rotation
20%
Months of food provisioning
through small CA plots
10-12
7-9
4-6
1-3
15%
38%
39%
8%
Use of planters
Hand hoes
Hand planters
Animal drawn planters
Tractor drawn planters
26%
69%
5%
0,5%
Cover crops; summer mix –
sunflower, millet, sunn
hemp, sorghum
26%
Sale of cropslocally (maize, beans,
cowpeas, sunflowers)
10%
Local financing of
infrastructure
Threshers
Mills
1
1
Cover crops; winter mix
relay cropping – Saia oats,
fodder sorghum, fodder
radish
31%
Innovation platforms; including
external stakeholders
5
Farmer centres
1
Fodder; provisioning of
livestock through cut and
carry
5%
Seed saving
11%
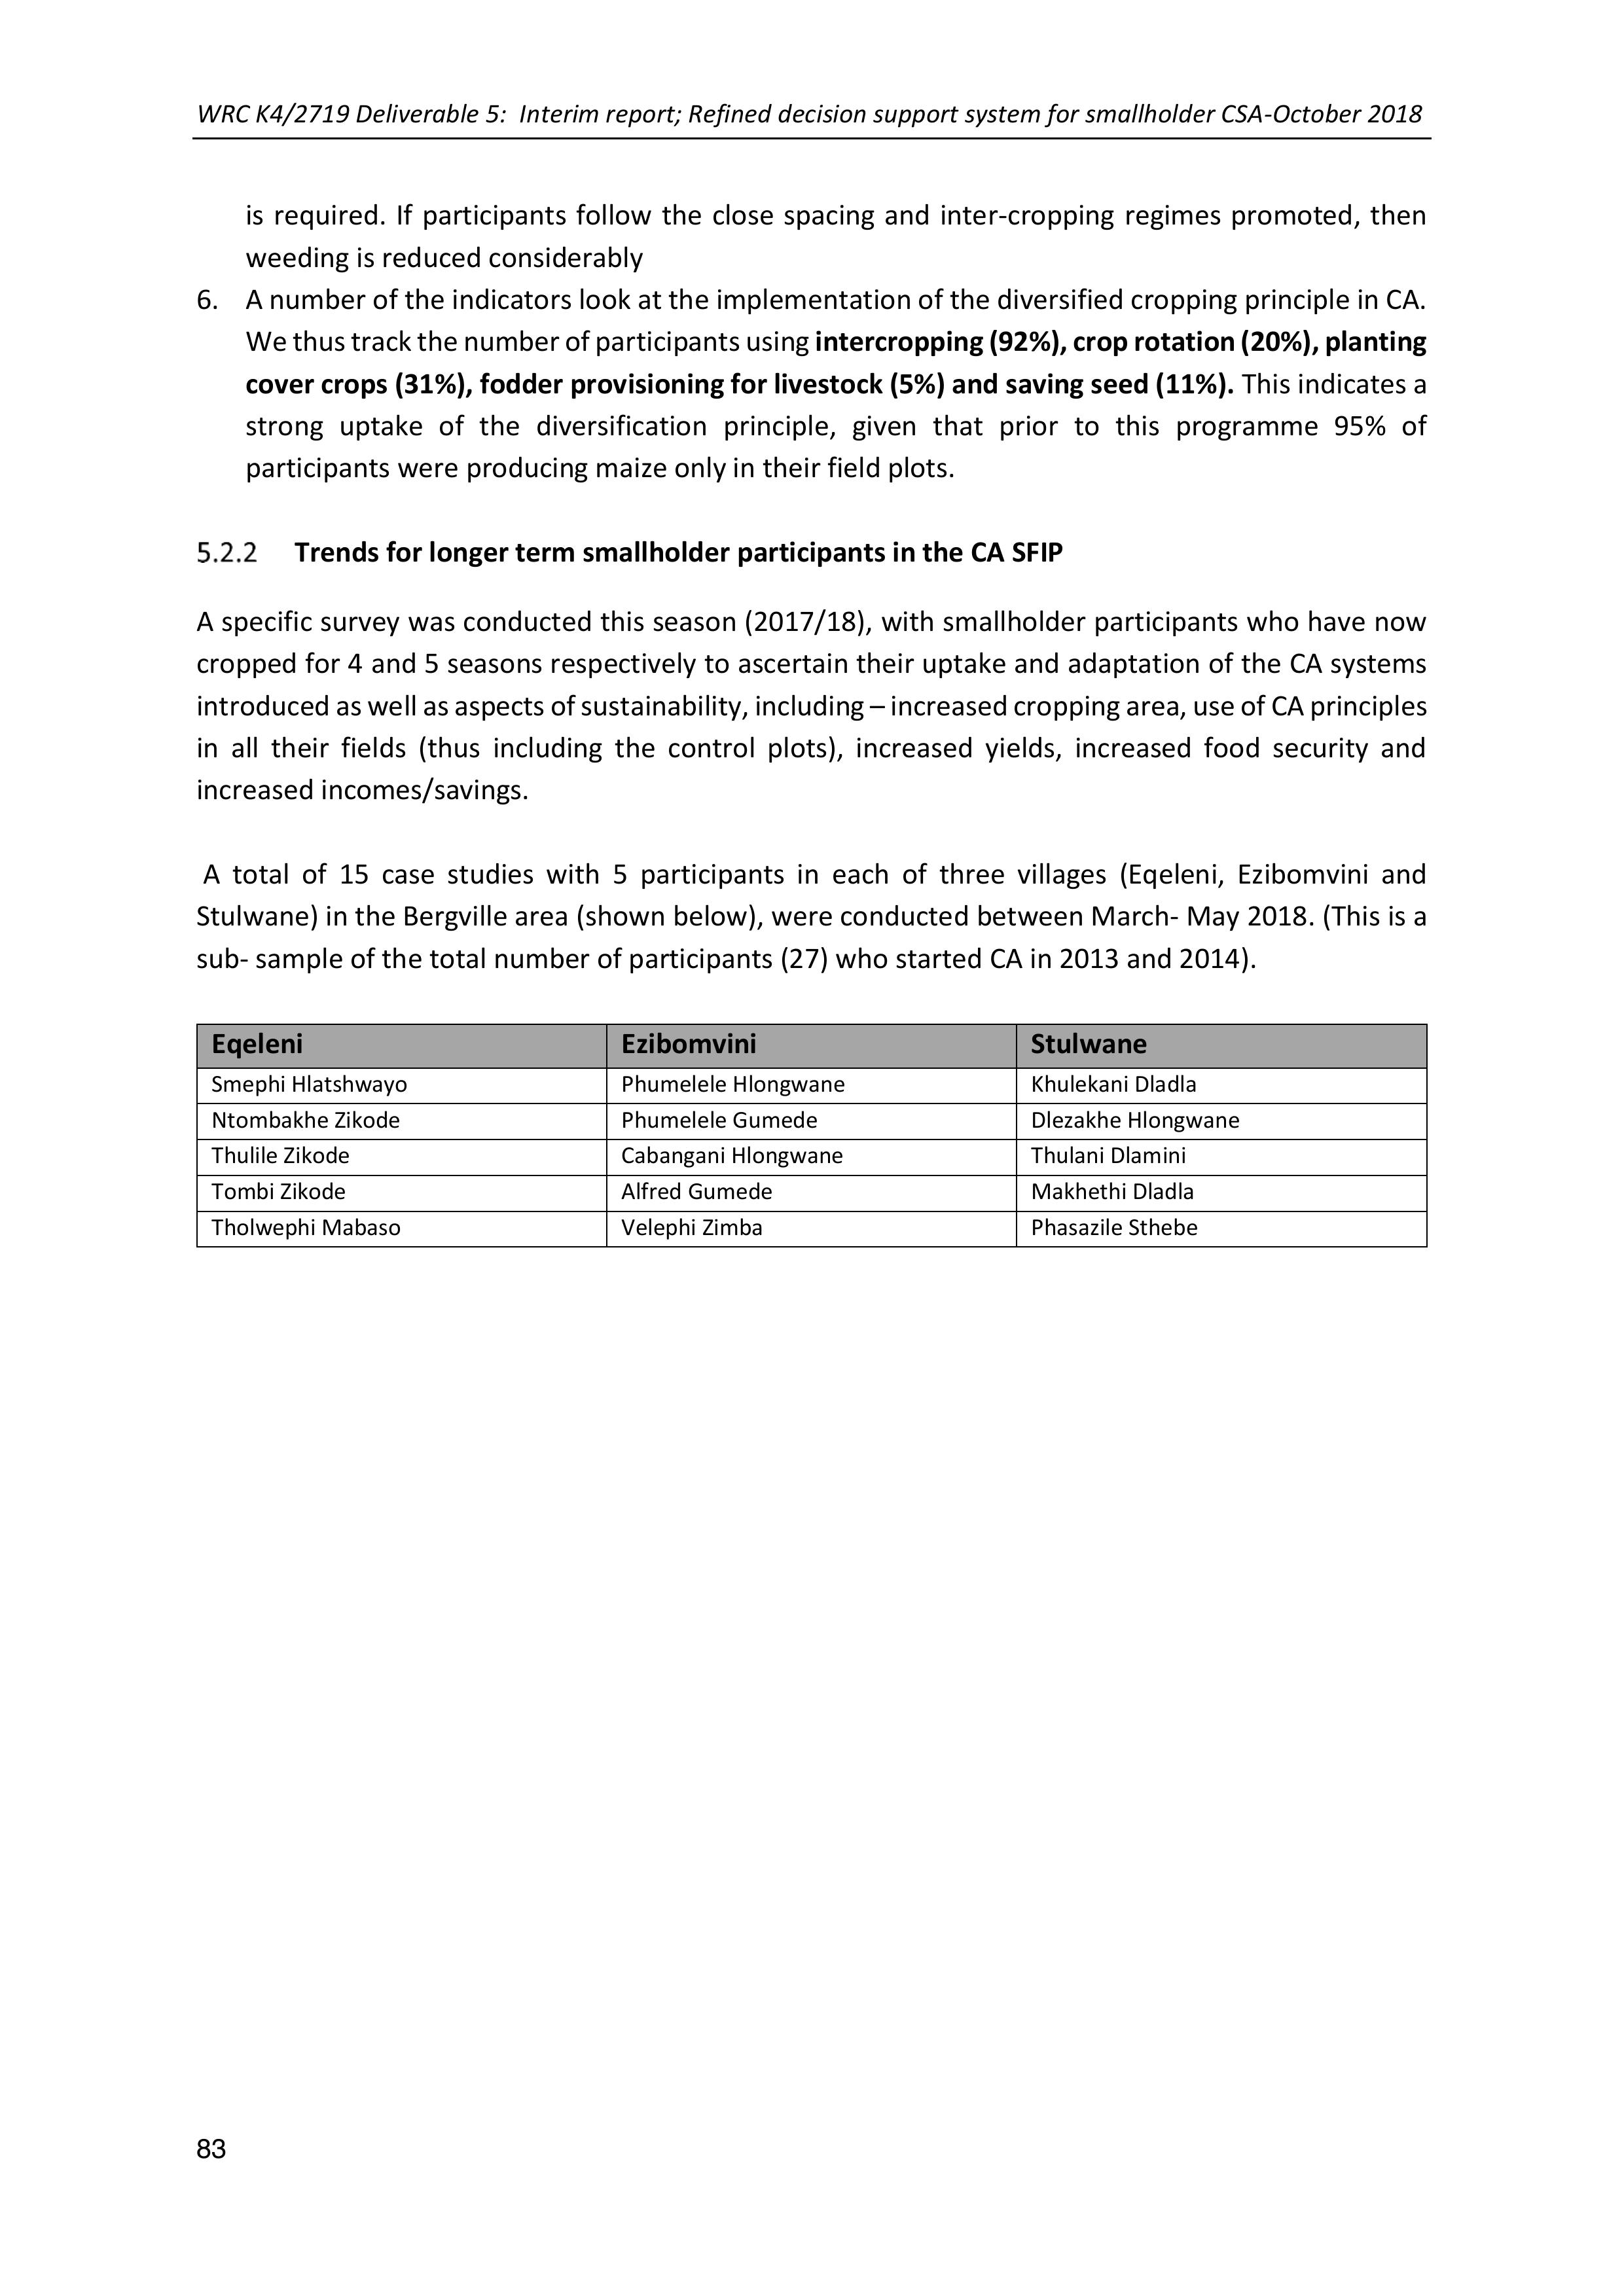
WRC K4/2719 Deliverable 5: Interim report; Refined decision support system for smallholder CSA-October 2018
83
is required.If participants follow the close spacing and inter-cropping regimes promoted, then
weeding is reduced considerably
6.A number of the indicators look at the implementation of the diversified cropping principle in CA.
We thus track the number of participants using intercropping (92%), croprotation (20%), planting
cover crops (31%), fodder provisioning for livestock (5%) and saving seed (11%). This indicates a
strong uptake of the diversification principle, given that prior to this programme 95% of
participants were producing maize only in their field plots.
Trends for longer term smallholder participants in the CA SFIP
A specific survey was conducted this season (2017/18), with smallholder participants who have now
cropped for 4 and 5 seasons respectively to ascertain their uptake and adaptation of the CA systems
introduced as wellasaspects of sustainability, including –increased cropping area, use of CAprinciples
in all their fields (thus including the control plots), increased yields, increasedfood security and
increased incomes/savings.
A total of 15 case studies with 5participants in each of three villages (Eqeleni, Ezibomvini and
Stulwane) in the Bergville area (shown below), were conducted between March- May 2018. (This is a
sub- sample of the total number of participants (27) who started CA in 2013 and 2014).
Eqeleni
Ezibomvini
Stulwane
Smephi Hlatshwayo
Phumelele Hlongwane
Khulekani Dladla
Ntombakhe Zikode
Phumelele Gumede
Dlezakhe Hlongwane
Thulile Zikode
Cabangani Hlongwane
Thulani Dlamini
Tombi Zikode
Alfred Gumede
Makhethi Dladla
Tholwephi Mabaso
Velephi Zimba
Phasazile Sthebe
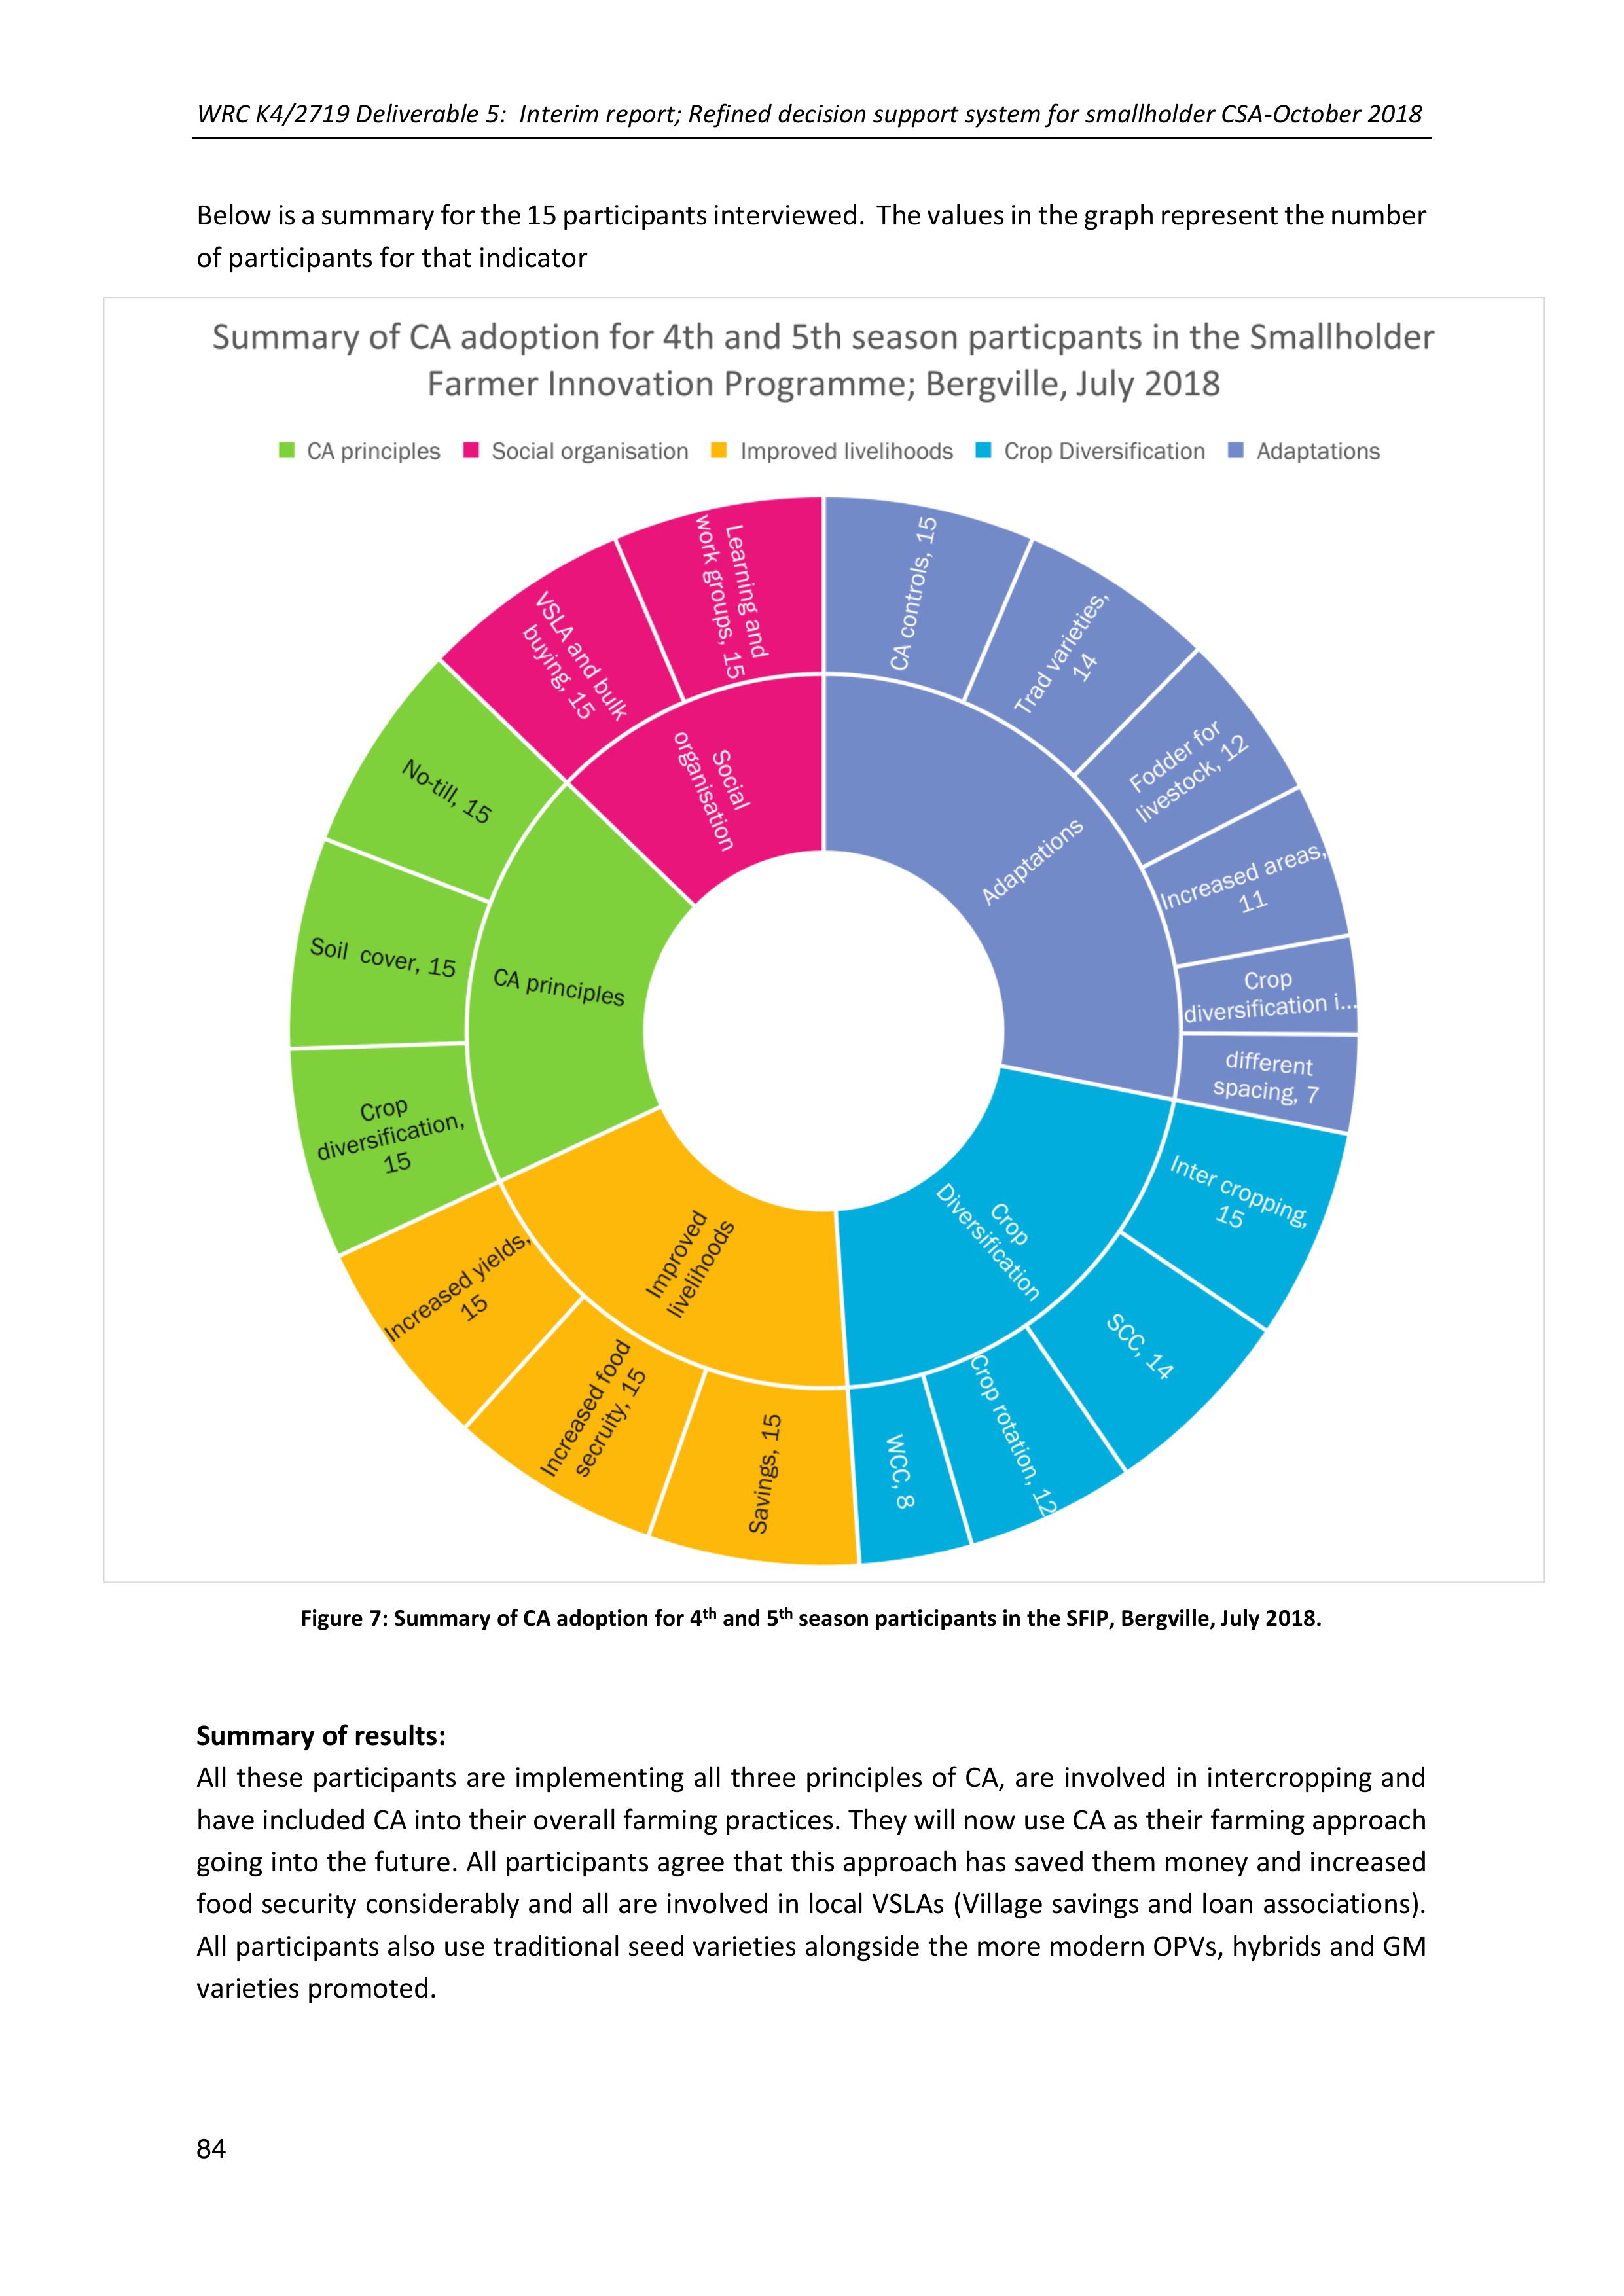
WRC K4/2719 Deliverable 5: Interim report; Refined decision support system for smallholder CSA-October 2018
84
Below isa summary for the 15 participants interviewed. The values in the graph representthenumber
of participants for that indicator
Figure 7: Summary of CA adoption for 4th and 5th season participants in the SFIP, Bergville, July 2018.
Summary of results:
All these participants are implementing all three principles of CA, are involved in intercropping and
have included CA into their overall farming practices. They will now use CA as their farming approach
going into the future. All participants agree that this approach has saved them money and increased
food security considerably and all are involved in local VSLAs (Villagesavings and loan associations).
All participants also use traditional seed varieties alongside the more modern OPVs, hybrids and GM
varieties promoted.
WRC K4/2719 Deliverable 5: Interim report; Refined decision support system for smallholder CSA-October 2018
85
There are some individual variations and adaptations in terms of crop rotation systems, spacing, use
of cover crops and use of fodder for livestock. Around 73% of these respondents have already
increased their area of cropping and feel that with the introduction of the animal drawn and tractor
drawn implements, they will be able to expand even further.
This summary provides a very clear indication that after around 5 years of experimentation with CA,
the farmers are nowwilling and able to implement CA without any further external mentoring.
Support in the form of farmer centres that can assist in the provision of access to implements and
inputs as well as the small subsidies for continued experimentation is however still important.
Present challenges are primarily around storage systems and capacity as all are producing more maize
than they can easily harvest and store. Stray livestock provide a challenge for many participants and
some still have somechallenges around weeding and pest incidence (such as cutwormsand Bagrada
beetles). In addition, we have as yet been unable to come up with a satisfactory process of inclusion
of winter cover crops (WCC’s) in this CA farmingsystem. Relaycropping and broadcastingof WCC’s
have been largely unsuccessful in this system.
A few other comments of interest are:
1.A proportion of participants have included the broadcasting of kraal manure into their
cropping system,along with the micro-dosing of fertilizer and believe this works well. This is
a practice that warrants further attention and experimentation
2.Around 36% of these participants have also been involved in the GrainSA Farmer
Development Programme’s Job Funds project. They have now all withdrawn given that the
inputs provided through this programme have become unaffordable. Most of these
participants have alsokept the seed they obtained through that process formore thanone
season as their cropping areas are in fact smaller than 1ha.
Below is a summary of comments made by the interviewees.
The Conservation Agriculture system
“I am very happy with my current method of farming (CA) and I try by all means to recruit people into
CA as it breaks the strong boundaries of poverty and food insecurity” (Ntombakhe Zikode)
“We really appreciate having Mahlathini as a stepping stone towards poverty alleviation in our village.
The learning groups and farmer’s day have played a huge role in enhancing our knowledge and
learning. It has taught me to experiment with the skills that I have picked up. Phumzile and her team
encourage us to keep our plots looking good. When they do monitoring rounds, we are able toask
more questions and share new ideas and in turn acquire more skills.” (Khulekani Dladla)
“The workshops that were given in the introductory phase of the programme led me to believe that
this system can be avery useful tool to solve our production problem of obtaining poor yields and also
at the same time contribute to better food security in my homestead. Soils that we worked were tired
after numerous years of tillage and had very little potential and the CA principles presented helped to
form a more complete picture of the factors influencing good productivity of the soil which includes
the combined use of practices such as intercropping, crop rotation and cover cropping and how these
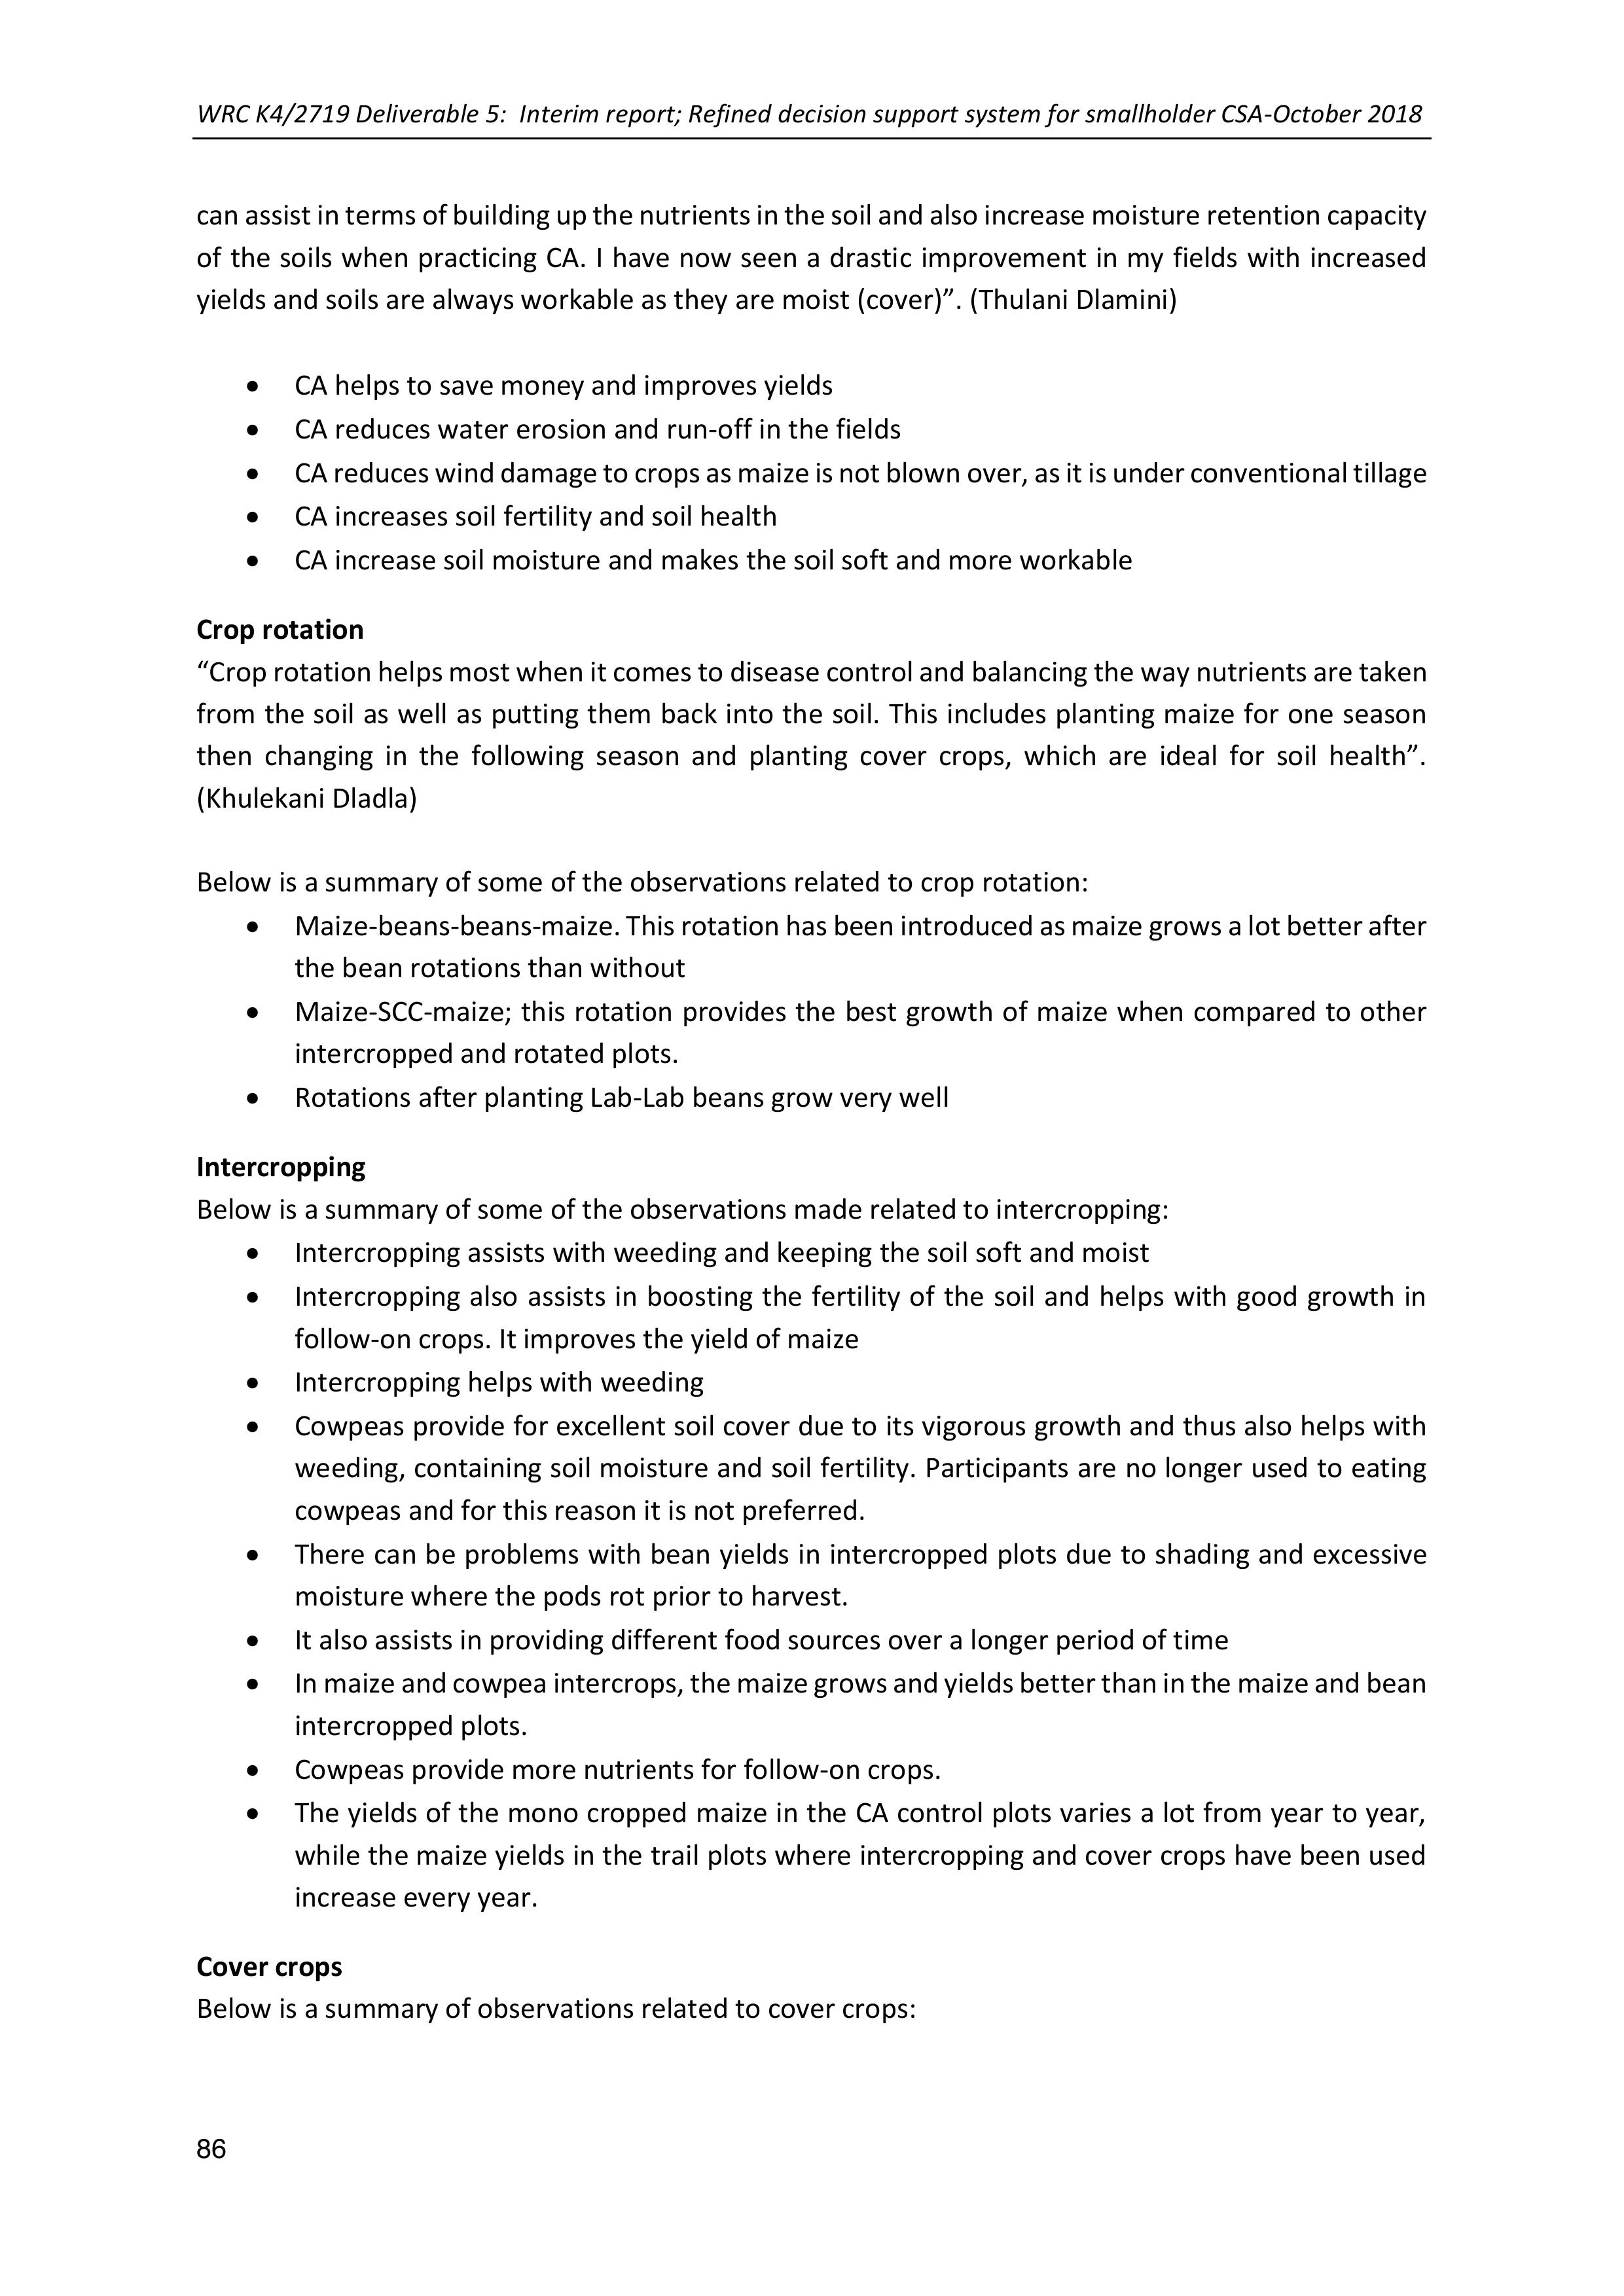
WRC K4/2719 Deliverable 5: Interim report; Refined decision support system for smallholder CSA-October 2018
86
can assist in terms of building up the nutrients in the soil and also increase moisture retention capacity
of the soilswhen practicing CA. I have now seen a drastic improvement inmy fields with increased
yields and soils are always workable as they are moist (cover)”. (Thulani Dlamini)
•CA helps to save money and improves yields
•CA reduces water erosion and run-off in the fields
•CA reduces winddamage to crops as maize is not blown over, as it is under conventional tillage
•CA increases soil fertility and soil health
•CA increase soil moisture and makes the soil soft and more workable
Crop rotation
“Crop rotation helps most when it comes to disease control and balancing the way nutrients are taken
from the soil as well as putting them back into the soil. This includes planting maize for one season
then changing in the following season and planting cover crops, which are ideal for soil health”.
(Khulekani Dladla)
Below is a summary of some of the observations related to crop rotation:
•Maize-beans-beans-maize. This rotation has been introduced as maize grows a lot better after
the bean rotations than without
•Maize-SCC-maize; this rotation provides the best growth of maizewhen compared to other
intercropped and rotated plots.
•Rotations after planting Lab-Lab beans grow very well
Intercropping
Below is a summary of some of the observations made related to intercropping:
•Intercropping assists with weeding and keeping the soil soft and moist
•Intercropping also assists in boosting the fertility of the soil and helps with good growth in
follow-on crops. It improves the yield of maize
•Intercropping helps with weeding
•Cowpeas provide for excellent soil cover due to itsvigorous growth and thus also helps with
weeding, containing soil moisture and soil fertility. Participants are no longer used to eating
cowpeas and for this reason it is not preferred.
•There can be problems with bean yields in intercropped plots due to shading and excessive
moisture where the pods rot prior to harvest.
•It also assists in providing different food sources over a longer period of time
•In maize and cowpea intercrops, the maize grows and yields better than in the maize andbean
intercropped plots.
•Cowpeas provide more nutrients for follow-on crops.
•The yields of themono cropped maize in the CA control plots varies a lot from year to year,
while the maize yields in the trail plots where intercropping and cover crops have been used
increase every year.
Cover crops
Below is a summary of observations related to cover crops:

WRC K4/2719 Deliverable 5: Interim report; Refined decision support system for smallholder CSA-October 2018
87
•Planting of millet improves soil quality (making it soft and easy to work with) and soil health.
It assists the follow-on crop substantially in terms of growth and yield
•Millet is eaten by birds and thus harvesting thegrain has been impossible formost
participants.
•Sunflowers grow well and most participants have harvested the seed to feed to their chickens.
Some participants prepare a feed of crushed maize and sunflower for their poultry and have
found this to greatly increase their survival rate.
•SCC’s are cut and dried as a fodder for livestock – both goats and cattle.
•Cover crops increase the fertility of the soil; especially cowpeas and millet.
•Lab-Lab beansalso have medicinal propertiesin assisting to regulate blood pressure. This is
preferred over the modern medications as it is more natural. It also provides for much
increased soil fertility and improved soil health.
•Cover crops help keeping the soil moist and in a good condition during the off season
•Cover crops help in providing fodder for livestock in winter when they do not have enough
food.
Crop varieties
“I like themodern cultivars,such as PAN6479 as they have the capacity to produce more as compared
to the traditional maize which I use in my control plot. The traditional maize is good when it comes to
disease resistance andadaptation to weather changes; however, it does not have the best yield”
(Smephi Hlatshwayo)
“The Gadra beans are more susceptible to pests and diseases as well as poor adaptation to weather
changes, which makes it better to plant this bean late in the planting season. Usuthu (a traditional
cultivar of climbing bean) is much more disease resistant and can adapt to weather changes, which is
why I have both these cultivars in my trial and control plots” (Smephi Hlatshwayo).
Traditional varieties are used as it is possibleto keepseed for following seasons and this isseen as
important. Participants also prefer the taste of the traditional maize. Below is a small table put
together from comments made by Khulekani Dladla on comparing different seed types.
Hybrid seed Pro’s
Hybrid seed cons
Yields big cobs with multiple lines
Sometimes it is too sensitive to chemicals
Produces quality maize
GM seeds Pro
GM seeds cons
Persistent and not too sensitive to weather and chemicals
Has many bad weather hazards
Easy to work with because they don’t require labour when
it comes to weeding (chemically friendly)
Has many bad health hazards
Traditional seeds Pro
Traditional seeds cons
Resistant to many diseases
Yield is too small (thetraditional seed cob has fewer lines
of seeds/pips).
It is filling
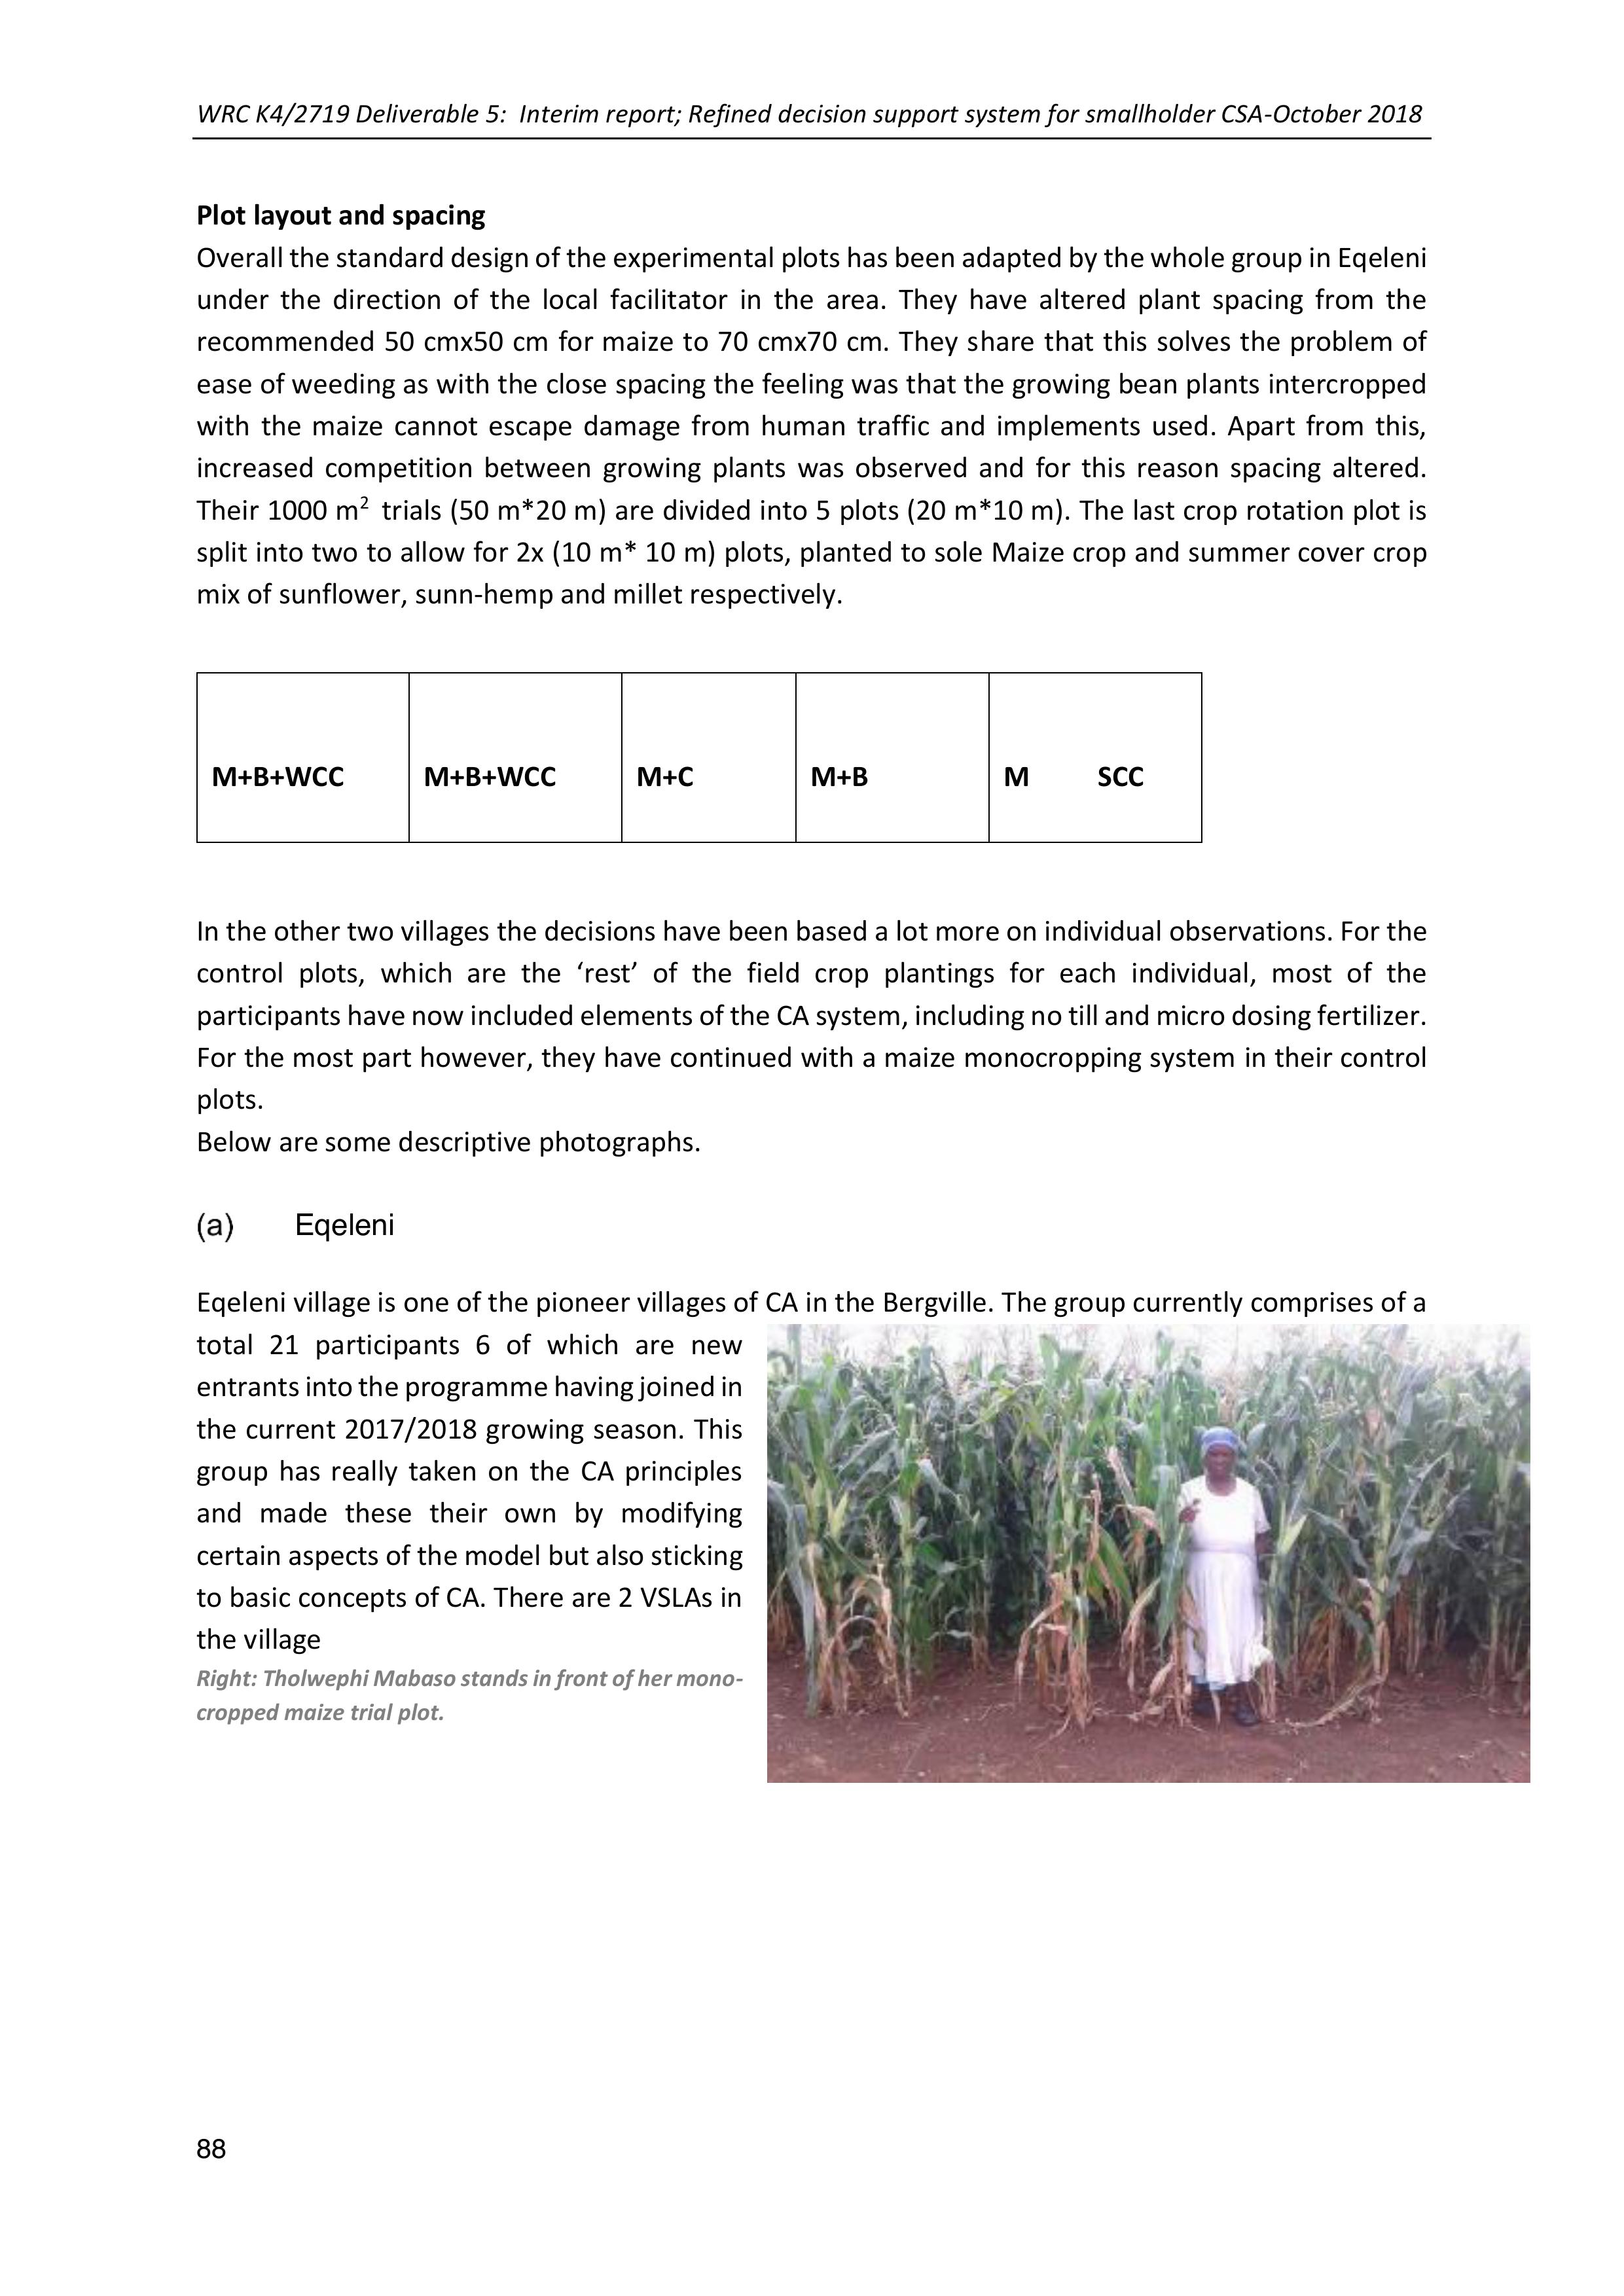
WRC K4/2719 Deliverable 5: Interim report; Refined decision support system for smallholder CSA-October 2018
88
Plot layout and spacing
Overall the standard designof the experimental plots has been adapted by the whole group in Eqeleni
under the direction of the local facilitator in the area. They have altered plant spacing from the
recommended50 cmx50 cm for maizeto 70 cmx70 cm. They share that this solves the problem of
ease of weeding as with the close spacing the feeling was that the growing bean plants intercropped
with the maize cannot escape damage from human traffic andimplements used. Apart from this,
increased competition between growing plants was observed and for this reason spacing altered.
Their 1000 m2 trials (50 m*20 m) are divided into 5 plots (20 m*10 m). The last crop rotation plot is
split into two to allow for 2x (10 m* 10 m) plots, planted to sole Maize crop and summer cover crop
mix of sunflower, sunn-hemp and millet respectively.
In the other two villages the decisions have been based a lot more on individual observations. For the
control plots, which are the ‘rest’ of the field crop plantings for each individual, most of the
participants have now included elements of the CAsystem,including no tillandmicro dosing fertilizer.
For the most part however, they have continued with a maize monocropping systemin their control
plots.
Below are some descriptive photographs.
Eqeleni
Eqeleni village is one of the pioneer villages of CA in the Bergville. The group currently comprises of a
total 21 participants 6 of which are new
entrants into the programme having joined in
the current 2017/2018 growing season. This
group has really taken on the CA principles
and made these their own by modifying
certain aspects of the model but also sticking
to basic concepts of CA. There are 2 VSLAs in
the village
Right: Tholwephi Mabaso stands in front of her mono-
cropped maize trial plot.
M+B+WCC
M+B+WCC
M+C
M+B
M SCC
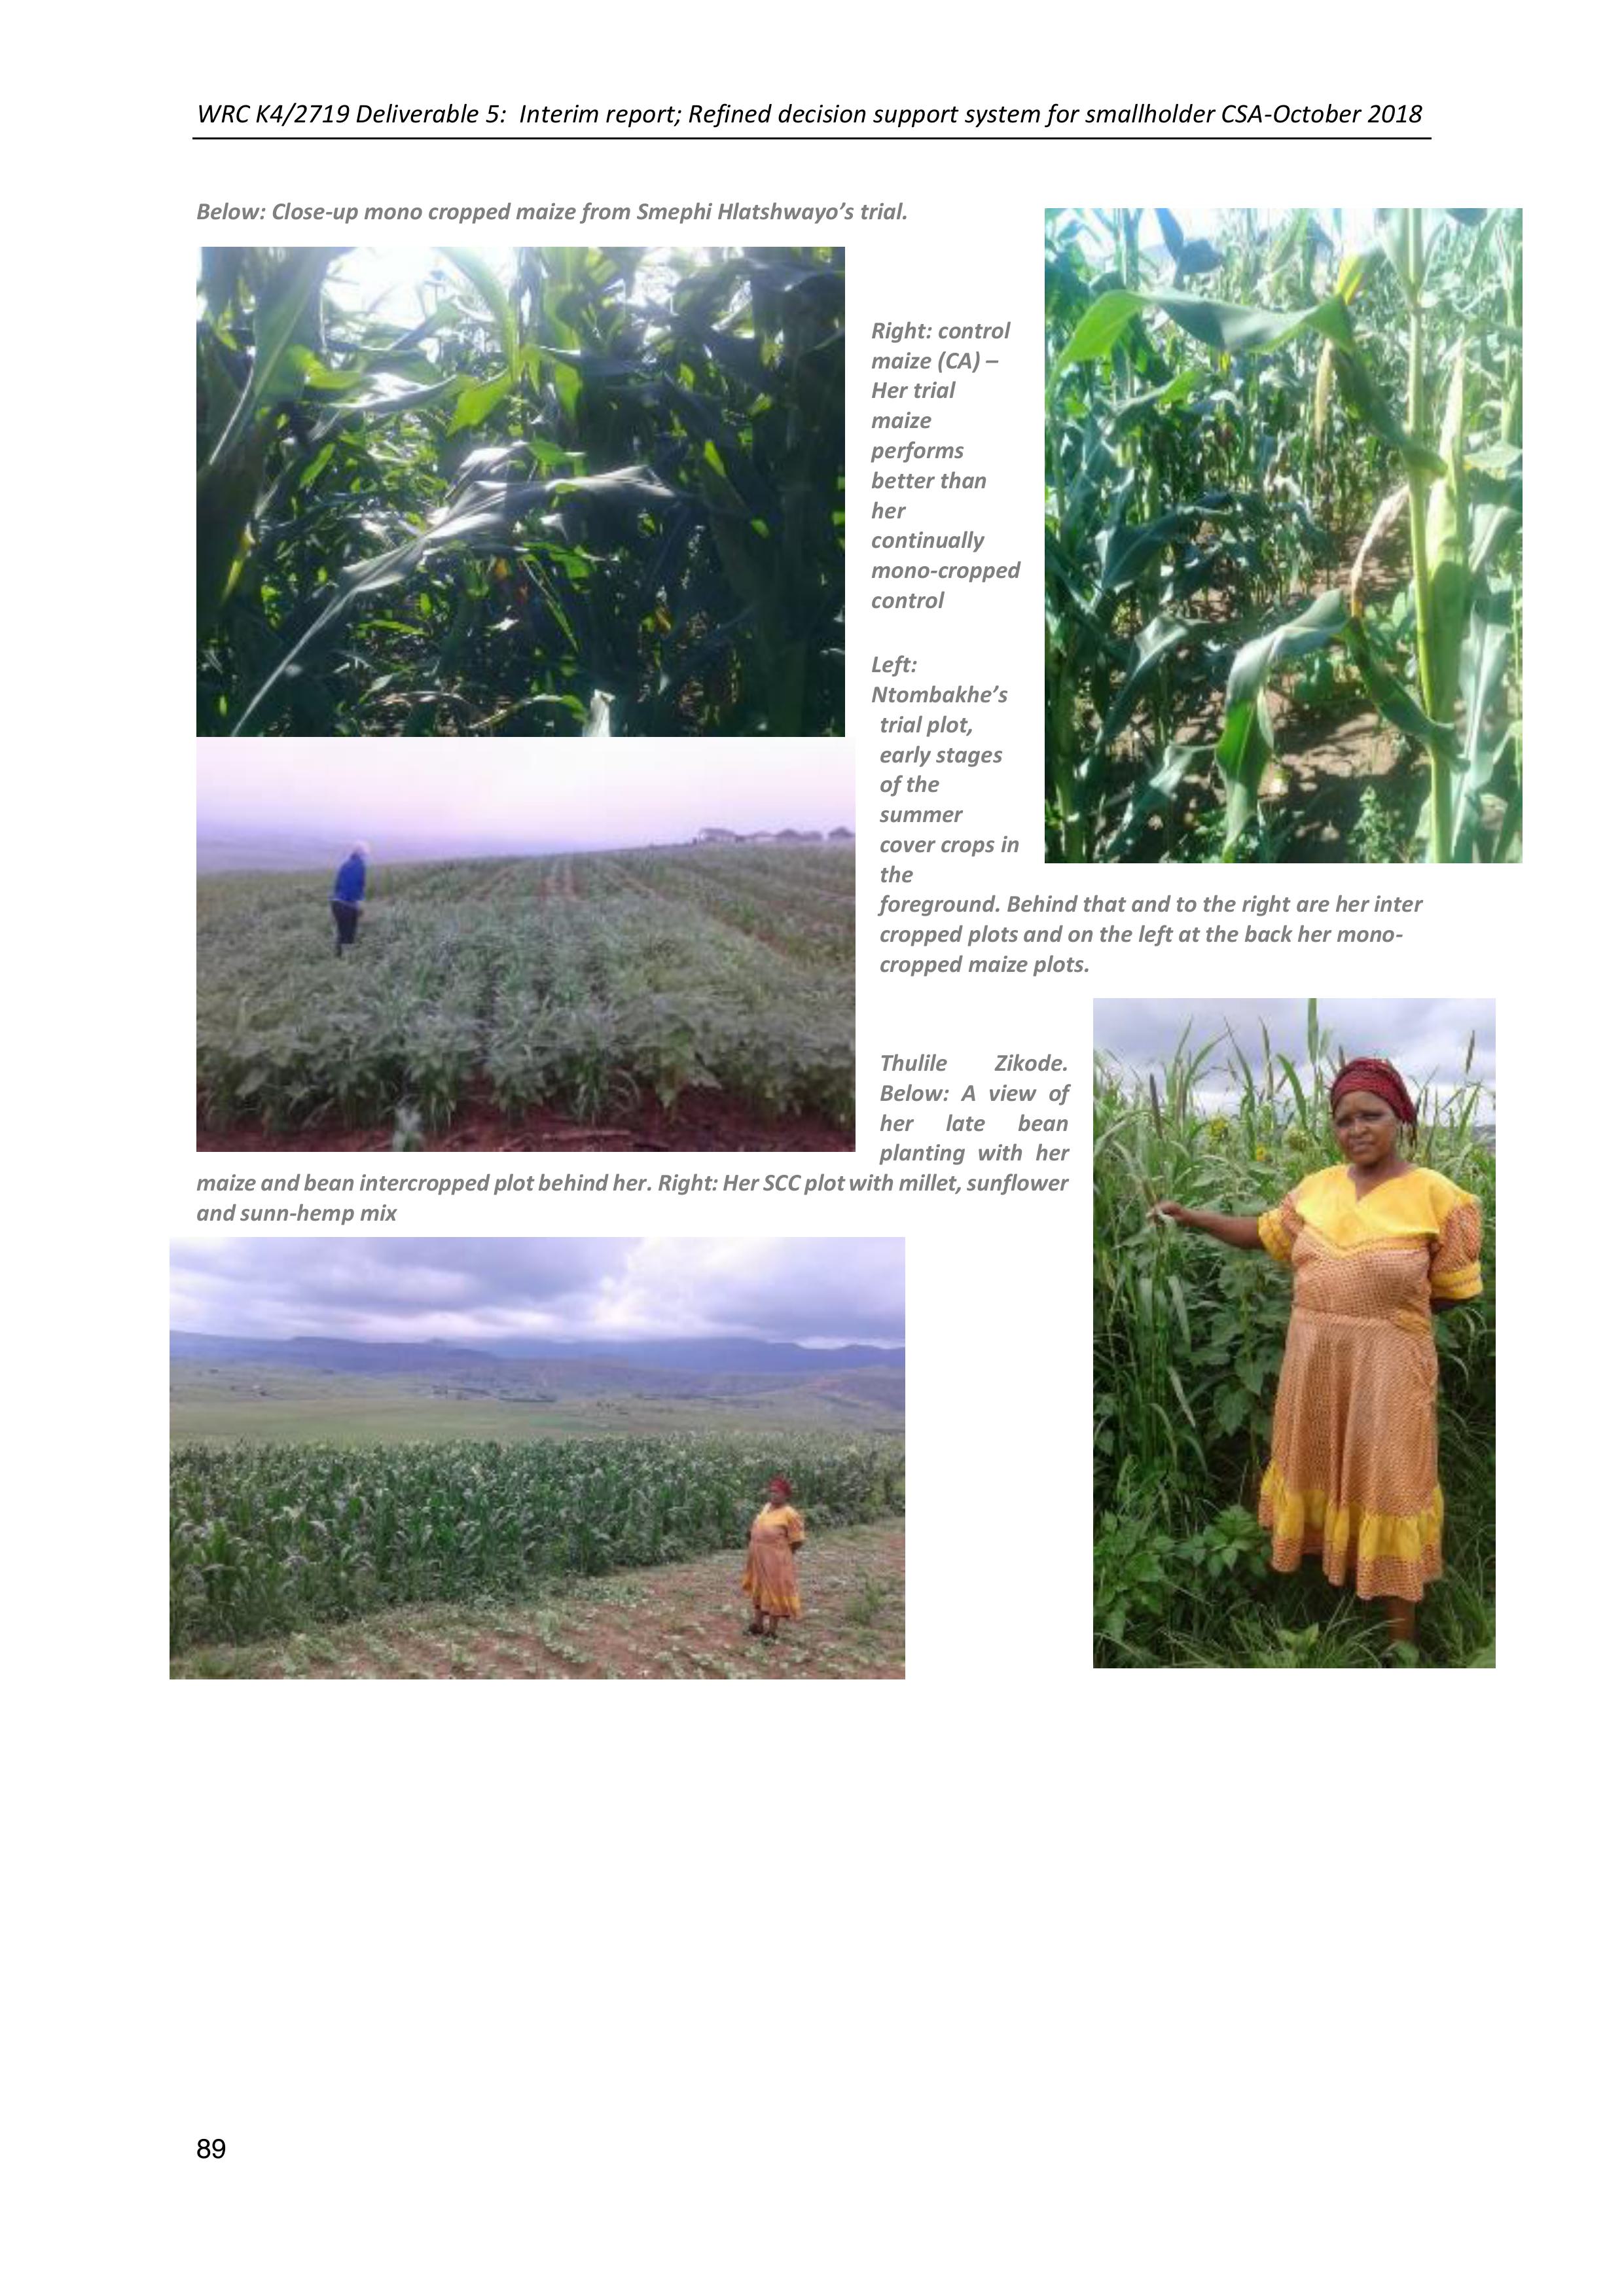
WRC K4/2719 Deliverable 5: Interim report; Refined decision support system for smallholder CSA-October 2018
89
Below: Close-up mono cropped maize from Smephi Hlatshwayo’s trial.
Right: control
maize (CA) –
Her trial
maize
performs
better than
her
continually
mono-cropped
control
Left:
Ntombakhe’s
trial plot,
early stages
of the
summer
cover crops in
the
foreground. Behind that and to the right are her inter
cropped plots and on the left at the back her mono-
cropped maize plots.
Thulile Zikode.
Below: A view of
her late bean
planting with her
maize and bean intercropped plot behind her. Right: Her SCC plot withmillet, sunflower
and sunn-hemp mix

WRC K4/2719 Deliverable 5: Interim report; Refined decision support system for smallholder CSA-October 2018
90
Ezibomvini
This village started the CA process in the 2015-
2015 season.There are presently 26
participants, of whom 6 are new entrants into
the programme. Ezibomvini hosts a farmer
centre and 2 VSLA groups.
Right: Alfred Gumede standing next to a plot of Lab-lab
beans planted in the 2015-2016 season. Towards the back
of the picture are the millet stalks from a SCC plot. Right
below: A view of one of his CA mono cropped maize plots.
Above- Velephi Zimba standing in her SCC plot (sunn-hemp, millet and sunflower)
Right- a view of Phumelele’s
maize and cowpea intercropped
plot and Far Right -A view of
Phumelele’s Lab-Lab plotin the
2017-2018 season. She rotates
these plots in her intercropping
and rotation system. Behind the
visitors is a plot of inter cropped
maize and sunflower.
Stulwane
This village started their CA process in 2013. There are presently 19 participants. A new group has
been started in another part of this village this past season, with 12 members
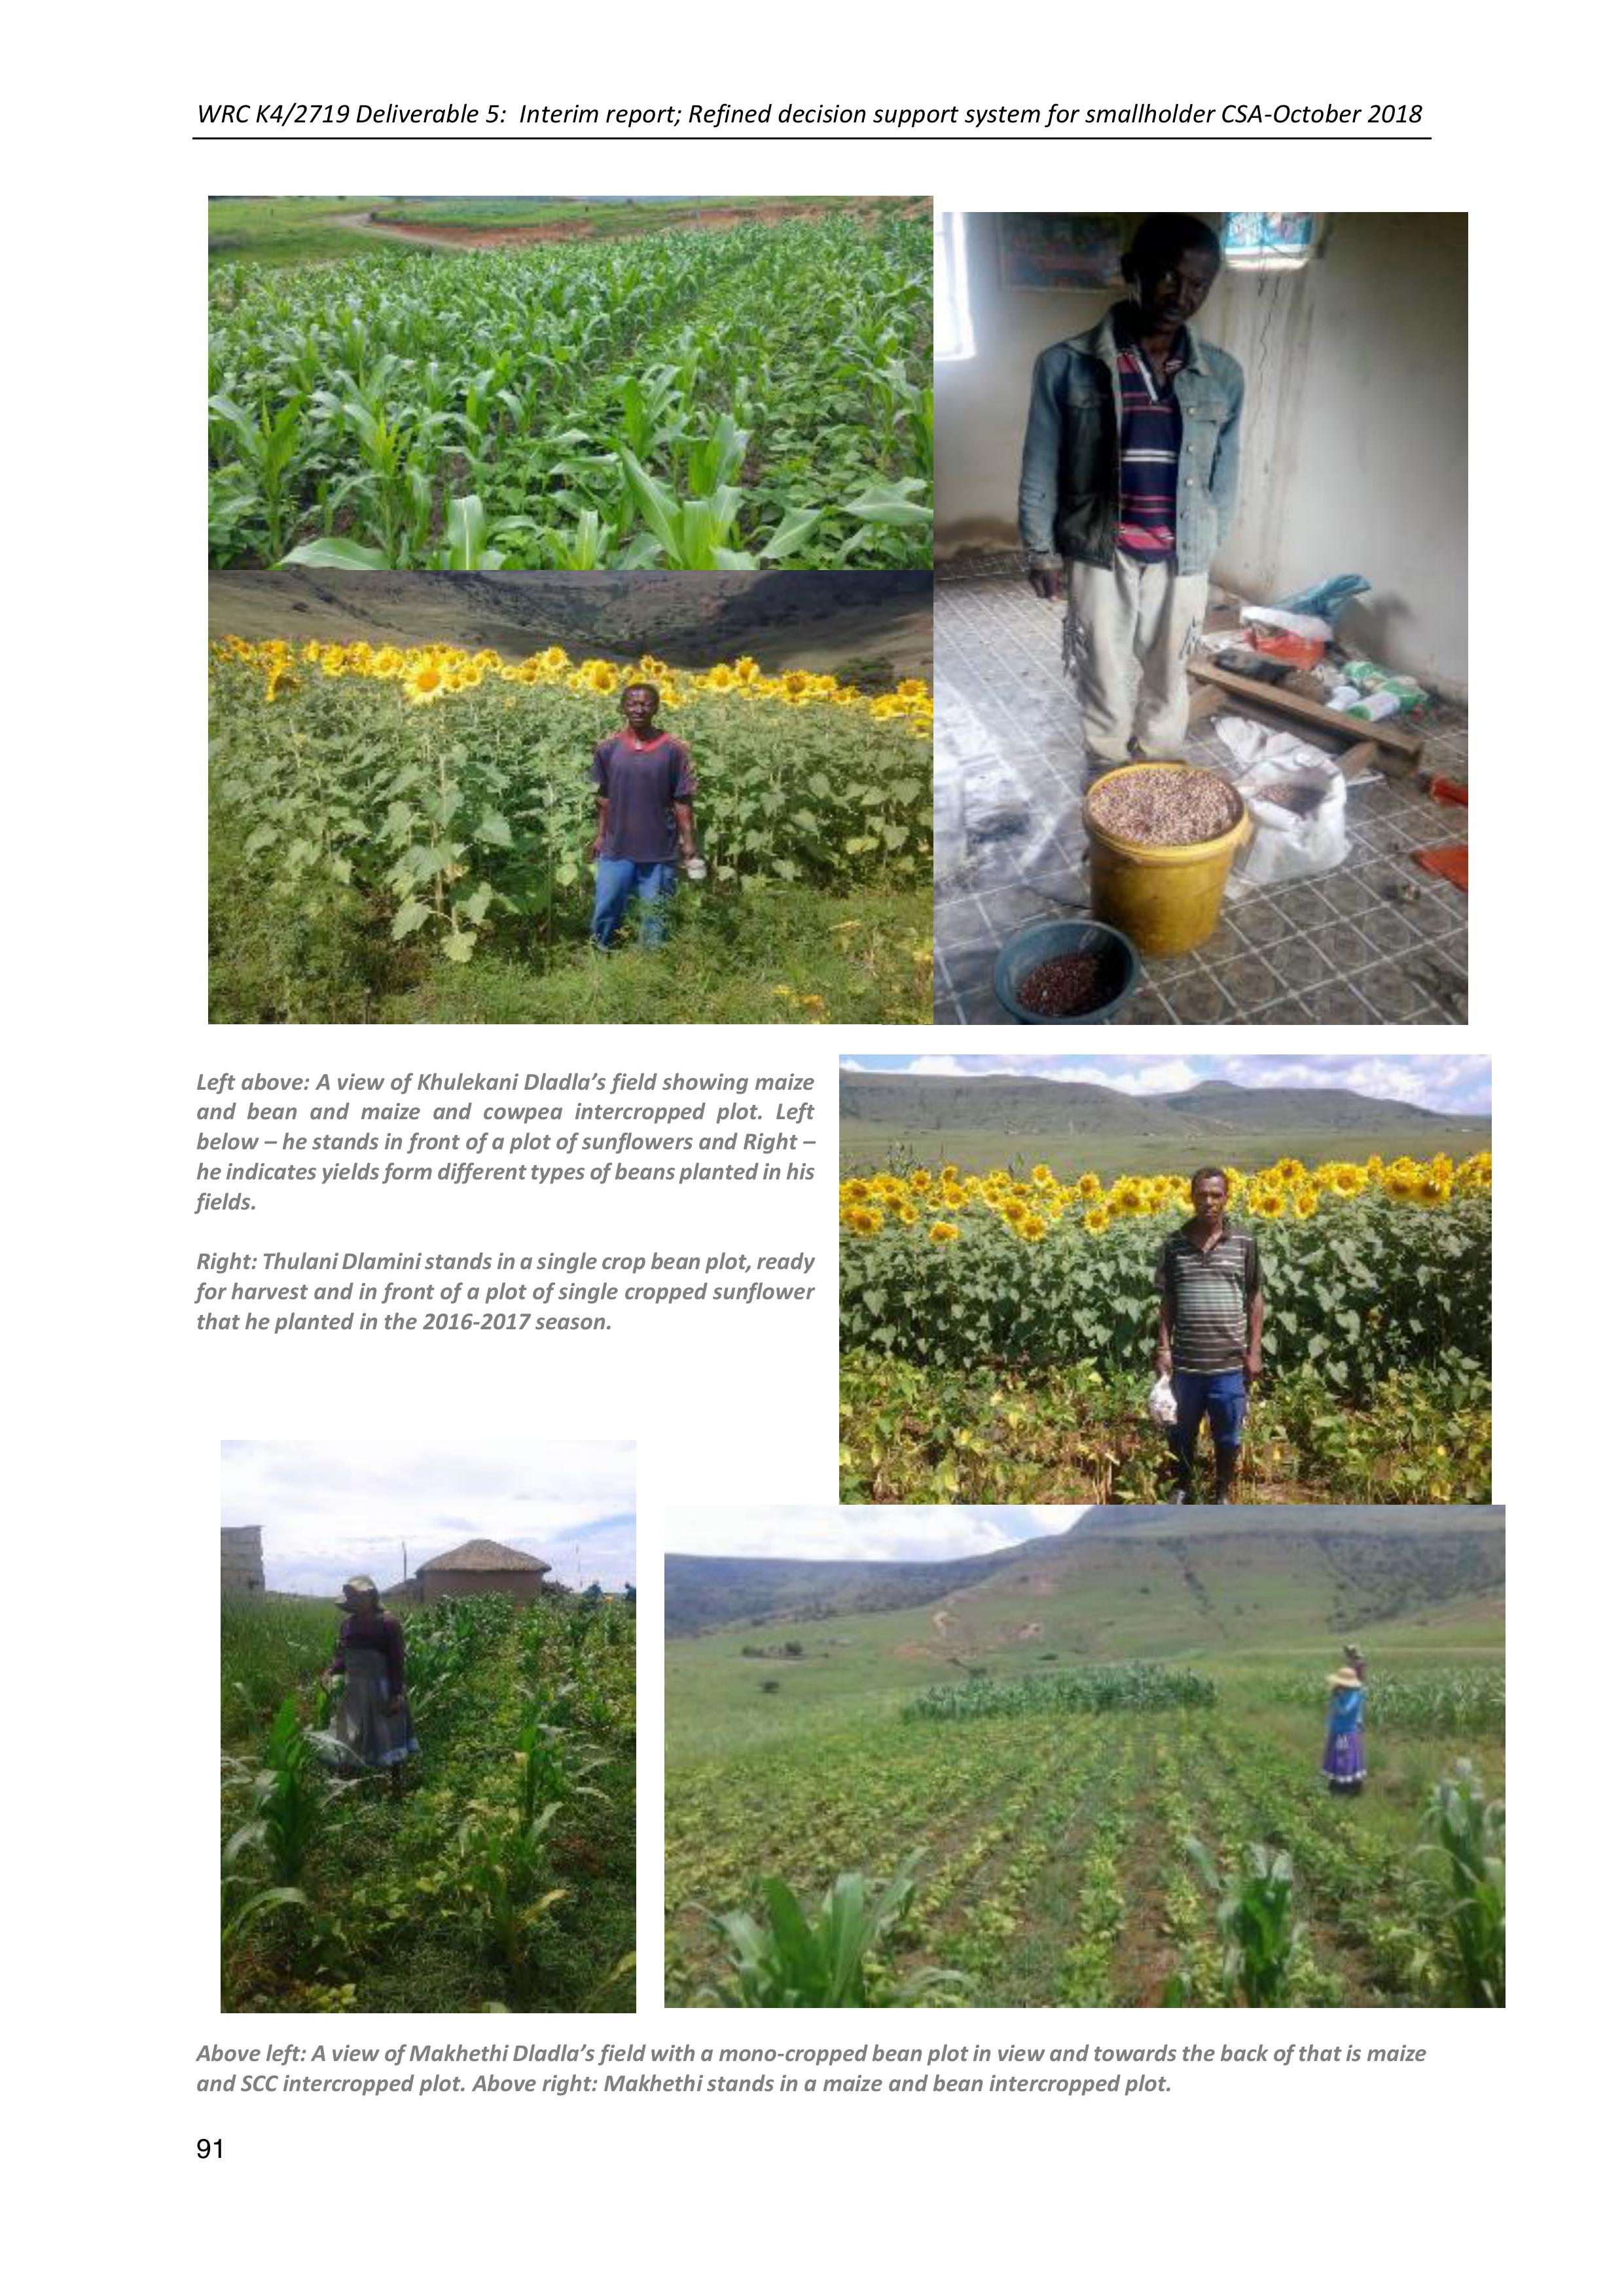
WRC K4/2719 Deliverable 5: Interim report; Refined decision support system for smallholder CSA-October 2018
91
Left above: A view of Khulekani Dladla’s field showing maize
and bean and maize and cowpea intercropped plot. Left
below – he stands in front of a plot of sunflowers and Right –
he indicates yields form different types of beans planted in his
fields.
Right: Thulani Dlamini stands in a single crop bean plot, ready
for harvest and in front of a plot of single cropped sunflower
that he planted in the 2016-2017 season.
Above left: A view of Makhethi Dladla’s field with a mono-cropped bean plot in view and towards the back of that is maize
and SCC intercropped plot. Above right: Makhethi stands in a maize and bean intercropped plot.
WRC K4/2719 Deliverable 5: Interim report; Refined decision support system for smallholder CSA-October 2018
92
Environmental and productivity indicators
In addition, more quantitative indicators have been measured; includingyields and soil and water
conservation indicators such as soil fertility, soil health (soil aggregates, organic matter, microbial
respiration percentage organic carbon and nitrogen, bulk density, gravimetric water content, run-off
and infiltration). Some of these results are to be reported in the next deliverable cycle.
Below a snapshot of indicators reported for the CA SFIP are provided, to give an indication of the
learning and trends coming out of that work.
Yields
Yields for the CA farmer-led trials are recorded for each participant on a yearly basis. They are
compared also with the participants’ control plots.
CA is understood to steadily improve soil fertility and soil health.This aspect of CA; improvementof
yield over time, is clearly visible in the yield summaries presented in the table below, where average
yields for maize, between 2013-2017 have increased from 3,74t/ha to5,7 t/ha, despite the challenging
weather conditions. This trend has not been matched in the control plots where average yields for
Bergville are still in the region of 3,44t/ha for maize. Bean yields have been a lot more variable, being
more susceptible to the varying weather conditions and have hovered around 1t/ha throughout.
Table 19: Crop yields in CA farmer-led trials in Bergville; 2013-2017
Bergville
Season
2013
2014
2015
2016
2017
No of villages
3
9
11
17
18
No of trial participants
28
83
73
212
259
Area planted (trials) - ha
2,8
7,2
5,9
13,5
17,4
Average yield maize (t/ha)
3,74
3,63
4,12
5,03
5,7
Min and max yield maize (t/ha)
2-4,3
1-6,7
0,6-7,4
0,3-11,7
0,5-12,2
Average trial quantity of maize (kg)
233
576
654
487
206
Rand replacement value (maizemeal) for
trial plots
R1 600
R4 500
R5 500
R4 900
R2350
Average yield beans (t/ha), trial plots
1,24
0,26
0,79
1,05
1,22
One of the aspectsof farmer-led experimentation is the great variability inproduction between the
different farmers involved in the experimentation. Althoughthe maximum yields obtained by some of
the farmers have increased dramatically, being around12,2 t/ha for maize in this last season, the
lower end (minimum) yields have remained low at around0,5t/ha. This is due both to the fact that
new participants comeon board every year (around 37% of participantsin 2017) and that some
participants fail to achieve the improved yields in their CA plots. Crop management and soilcondition,
especially acidity are important factors in yield reduction.
Soil health status
Soil health status is tested for a selection of the longer-term participants in the CA farmer-led trials to
ascertain levels of and changes in; microbial activity, percentage soil organic carbon, percentage
organic nitrogen, upstream availability of nutrients to follow-on crops and aggregate stability.
WRC K4/2719 Deliverable 5: Interim report; Refined decision support system for smallholder CSA-October 2018
93
Below an analysis has been done to ascertain soil health changes dependant on length of CA practice.
Results from Ezibomvini (three 4th year participants) are compared to Mhlwazini (two 2nd year
participants). These results are qualitative and give an indication of trends only.
Figure 8: Comparison of soil health test results for 2nd and 4th year CA participants
From the above figures the following comments can be made:
➢After 4 years the % OM accumulation for the CA plots (M+B and SCC) is higher than the veld
benchmark. This indicates good accumulation of organic matterin the intercropped and
summer cover crop plots of theCA trialsover time. The maize only plots do notaccumulate
organic matter tothe same extent. For the 2ndyear participants the % OM is lower than the
veld benchmark and there is as yet no distinction between the maize only and maize and bean
plots.
➢There is an increase in the average organic C from the maize(M) only plots, to the maize and
bean intercrops (M+B) to the summer cover crops (SCC), indicating an accumulation of
Organic C for the M+B plots from the 2ndyear onwards. Use of SCC over a period of time
provides for the highest increase in Organic C.
➢The largest accumulation of Organic N is for the 4th year M+B plots, when compared to M and
SCC plots. This indicates a cumulative effect ofincreased Organic N when intercropping is used
and the effect becomes more visible over time.
➢This links to the lower C:N ratio for M+B plots for 4th year participants.
➢C:N ratios for the CA plots (M, M+B and SCC) for the 4thyear participantsare lower than the
veld benchmarks. This is not the case for the 2nd year participants. This indicates the lowering
of C:N ratios over time for the CA practices.
In summary, the use of CA practices and especially including intercropping and summer cover crops in
the cropping system increases % soil organic matter and the accumulation of organic C and Organic N
Aver
age
of %
OM
Aver
age
of
CO2 -
C,
ppm
C
Aver
age
of
Orga
nic C
ppm
C
Aver
age
of
Orga
nic N
ppm
N
Aver
age
of
C:N
ratio
Aver
age
of
Soil
healt
h
calcu
latio
n
(new
)
Cont M3.873.1 233.5 19.112.613.9
M+B 4.769.9 243.5 22.211.213.2
SCC 4.073.7 263.3 20.313.114.0
Veld 3.984.8 285.3 17.816.315.2
0.0
50.0
100.0
150.0
200.0
250.0
300.0
Soil health Ezibomvini; 4th yr (N=3)
Ave
rag
e of
%
OM
Ave
rag
e of
CO2
- C,
pp
m C
Ave
rag
e of
Org
anic
C
pp
m C
Ave
rag
e of
Org
anic
N
pp
m N
Ave
rag
e of
C:N
rati
o
Ave
rag
e of
Soil
hea
lth
calc
ulat
ion
(ne
w)
Cont M (CA)3.754.1 252.0 18.713.512.3
M+B 3.653.1 255.5 17.714.612.2
0.0
50.0
100.0
150.0
200.0
250.0
300.0
Soil health Mhlwazini; 2nd yr (N=2)

WRC K4/2719 Deliverable 5: Interim report; Refined decision support system for smallholder CSA-October 2018
94
over time. C:N ratios decrease. These trends become clearer after a period of 4-5 years of
implementation of CA.
The savings in R for inorganic N that needs to be applied is also cumulative. For Mhlwazini (2ndyear)
this value is R374,50/ha and for Ezibomvini (4th year) the value is R437,13. These values are equivalent
to 12% and 14% of total fertilizer costs respectively.
This season an additional measurement has been included, that of soil bulk density (ρb). This
measurementis needed for the calculation of water productivity. Bulk density is directlyrelated to
soil porosity and indicates the degree of soil compaction (Assouline, 2006
1
). Consequently, ρbis
considered a good measure of soil quality as it affects other soil physical parameters such aswater
holding capacity and ease at which roots can penetrate the soil.
Soil tillage has been a popular agriculturalpractise throughout the world due to the initial
improvement of crop productivity, control of weeds and easewith which crops can be planted.
However, it has been recognised in many regions that this improved productivity is temporary and
overall, soil organic matter (SOM) content decreases under conventional tillage (CT).
This decrease inSOM results in a decline of soil quality as SOM plays a major role in the soil’s structural
and pore characteristics by influencing aggregate stability.
Bulk density samples weretaken for three participants, towards the end of thecropping season (early
May 2018). Samples were taken this late in the season as many authors report greater porosity, lower
ρb and reduced soil strength under CT than under (no-till) NT due to the creation of macro-pores
during ploughing. These provide for a lower ρbreading early in the season, as during the course of the
season the soil settles again and the readings increase (Basset, 2010)
2
.
Below is a summary of the results of the bulk density calculations for different cropping practices
within the CA system of the three participants. They were chosen for having differing period of
cropping under CA and for inclusion of a number of practices within their CA system; namely
intercropping and planting of summer cover crops (SCC).
Table 20: Bulk density results for three CA participants
Village
Period
undue
CA (yrs)
Name
and
Surname
Control
CT
Control
CA
M
M+B
M+CP
SCC
Average
Ezibomvini
4
Phumelele Hlongwane
1,30
1,36
1,38
1,33
1,38
1,28
1,34
Eqeleni
5
Ntombakhe Zikode
1,35
1,49
1,37
1,32
1,38
Thamela
1
Mkhuliseni Zwane
1,14
1,08
1,09
1,07
1,10
Average bulk density
1,27
11
Assouline S., 2006. Modelling the relationship between soil bulk density and the water retentioncurve.
Vadose Zone Journal, 5 (554-563).
2
Basset, T.S. 2010. A comparison of theeffects of tillage on Soil physical properties and microbialactivity at
different levels of nitrogen Fertilizer at Gourton farm, Loskop, Kwazulu-Natal. MSC thesis. Dept of Soil Science,
UKZN.
WRC K4/2719 Deliverable 5: Interim report; Refined decision support system for smallholder CSA-October 2018
95
These results indicate an increase in ρb over period of involvement in CA. There is little to no difference
between the CA practices, although in all three cases the planting of SCC has reduced the ρb
fractionally.
An explanation for this trend is that ploughing increases the presence of macro-pores in the short
term but, less structural stability under CT can lead tolower porosity, higher bulkdensities and greater
soil strength with time, as tillage-induced pores readily collapse. Although initial conversion from CT
to CA usually results in higher bulk densities it is unlikely that plant growth will suffer markedly as a
consequence of insufficient moisture and poor aeration status. Improved aggregation and pore
connectivity under CA allows the soil to maintain an adequate supply of moisture and air (Cavalieri et
al., 2009)
3
. The average ρb of 1,3g/cm3 is to be used for the water productivity calculations
Run-off and infiltration
Run-off plots have been installed for 1 participant in 2016-2017 and four participants in the last season
in Bergville. It has been extremely difficult for participants to practice the required amount of
meticulous measurementsrequired for this process and they very often did not record the run-off
after every rainfall event; especially at times when small amounts of rain fell for a number of days in
a row. This has meant that most of the data recorded has not be useable.
The two small analyses below however provide a good indication of the positive impact of CA on run-
off.
Runoff data was collected in 2016-2017 for Phumelele Hlongwane who hasbeen active in CA trails
since 2014. The results are shown in the table below. Only those rainfall events between November
2016-April 2017 where rainfall and runoff could be directly compared have been used
Table 21: Run-off data from Phumelele Hlongwane; 2016-2017
There was more runoff in conventional tillage plot compared to the CA plots. The percentage of rainfall
converted into runoff, ranges between 11,4% and 38,5% under conventional tillage, while it ranges
between 6,8% and 17,9 %under CA. These results agree with the study conducted in the Bergville are
3
Cavalieri K.M.V., da Silva A.P., Tormena C.A., Leão T.P., Dexter A.R. and Håkansson I., 2009.Long-term effects
of no-tillage on soil physical properties in a Rhodic Ferrasol in Paraná, Brazil. Soil and Tillage Research, 103 (158-
164).
Control plot
Trail plot
Rainfall
(mm)
Runoff (mm)
% rainfall converted into
runoff
Runoff (mm)
% rainfall converted into
runoff
14
4
28,5
2,5
17,9
22
2,5
11,5
1,5
6,8
9
1,25
13,9
1
11,1
20
3,25
16,2
2
10,0
13
5
38.,5
2,25
17,3
21
2,5
11,9
1,5
7,1
WRC K4/2719 Deliverable 5: Interim report; Refined decision support system for smallholder CSA-October 2018
96
by Mchunu et al. (2012), which shows that CA(even under <10% crop residue cover) hasthe potential
to significantly reduce soil and soil organic carbon losses by water under small-scale agriculture.
For the 2017-2018 planting season run-off plots were placed in 5 different plots within Phumelele
Hlongwane’s CA trial. In this case only monthly averages for both run-off and rainfall could be used
Date
Rainfall (mm)
Run-off plots litres
Maize +
Beans
Maize only
Maize +
Cowpea
Summer
cover crops
Control
Feb-18
169
35,61
18,53
37,05
35
57,59
Mar-18
114,7
7,5
1,52
8,9
7,7
23,32
Percentage rain converted to runoff
Feb-18
169
21%
11%
22%
21%
34%
Mar-18
114,7
7%
1%
8%
7%
20%
The results are very similar to the previous year with run-off in the CA plots being lower than the
control plot of conventionally tilledmaize and the average percentagerunoff is again between around
7-17% for the CA plots and between 20-34% for the control plot.
What ishowever unexpected is that the runoff in themono-cropped maize plot was lower for both
months than those with the intercrops and summer cover crops. It would appear from this result that
the reduction in run-off has a lot more to do with the fact that the soil was not disturbed during
planting than with the actual crop planted. This does make sense, although the assumption was that
the canopy cover providedin the mixed cropping plots would have an impact on the amount of run-
off.
Infiltration rates of water into the soil are expectedto increase for the CA trial plots over time. The
assumption is that the pore continuity and pore size distribution are improved due to greater
structural stability and biological activity and thus saturated hydraulic conductivity and the plant
available water are greater under CA than conventional tillage.
The infiltration tests were done to assess the impact of CA on water infiltration in the soil.
Results from infiltrometer tests (single ring) from 2016-2017 season for16 participants were
extremely varied and appeared unreliable. They werenot reported on. For the 2017-2018 a double
ring infiltrometer was acquired and readings were taken for 13 participants. The comparison of control
and trial plots is somewhat artificial, given that a number of participants have been practising CA on
their control plots as well.
The results are presented below.
Table 22: Summary of water infiltration results for 13 participants in Bergville; 2017-2018
Village
Name and Surname
Yrs under
CA
infiltration rate
(mm/hr) control
infiltration rate
(mm/hr) trial
Stulwane
Khulekani Dladla
5
587,4
531,4
Dlezakhe Hlongwane
5
226,2
423,8
Thulani Dlamini
5
422,7
450,0
Makhethi Dladla
5
226,6
587,4
Pasazile Sithebe
5
544,4
478,3
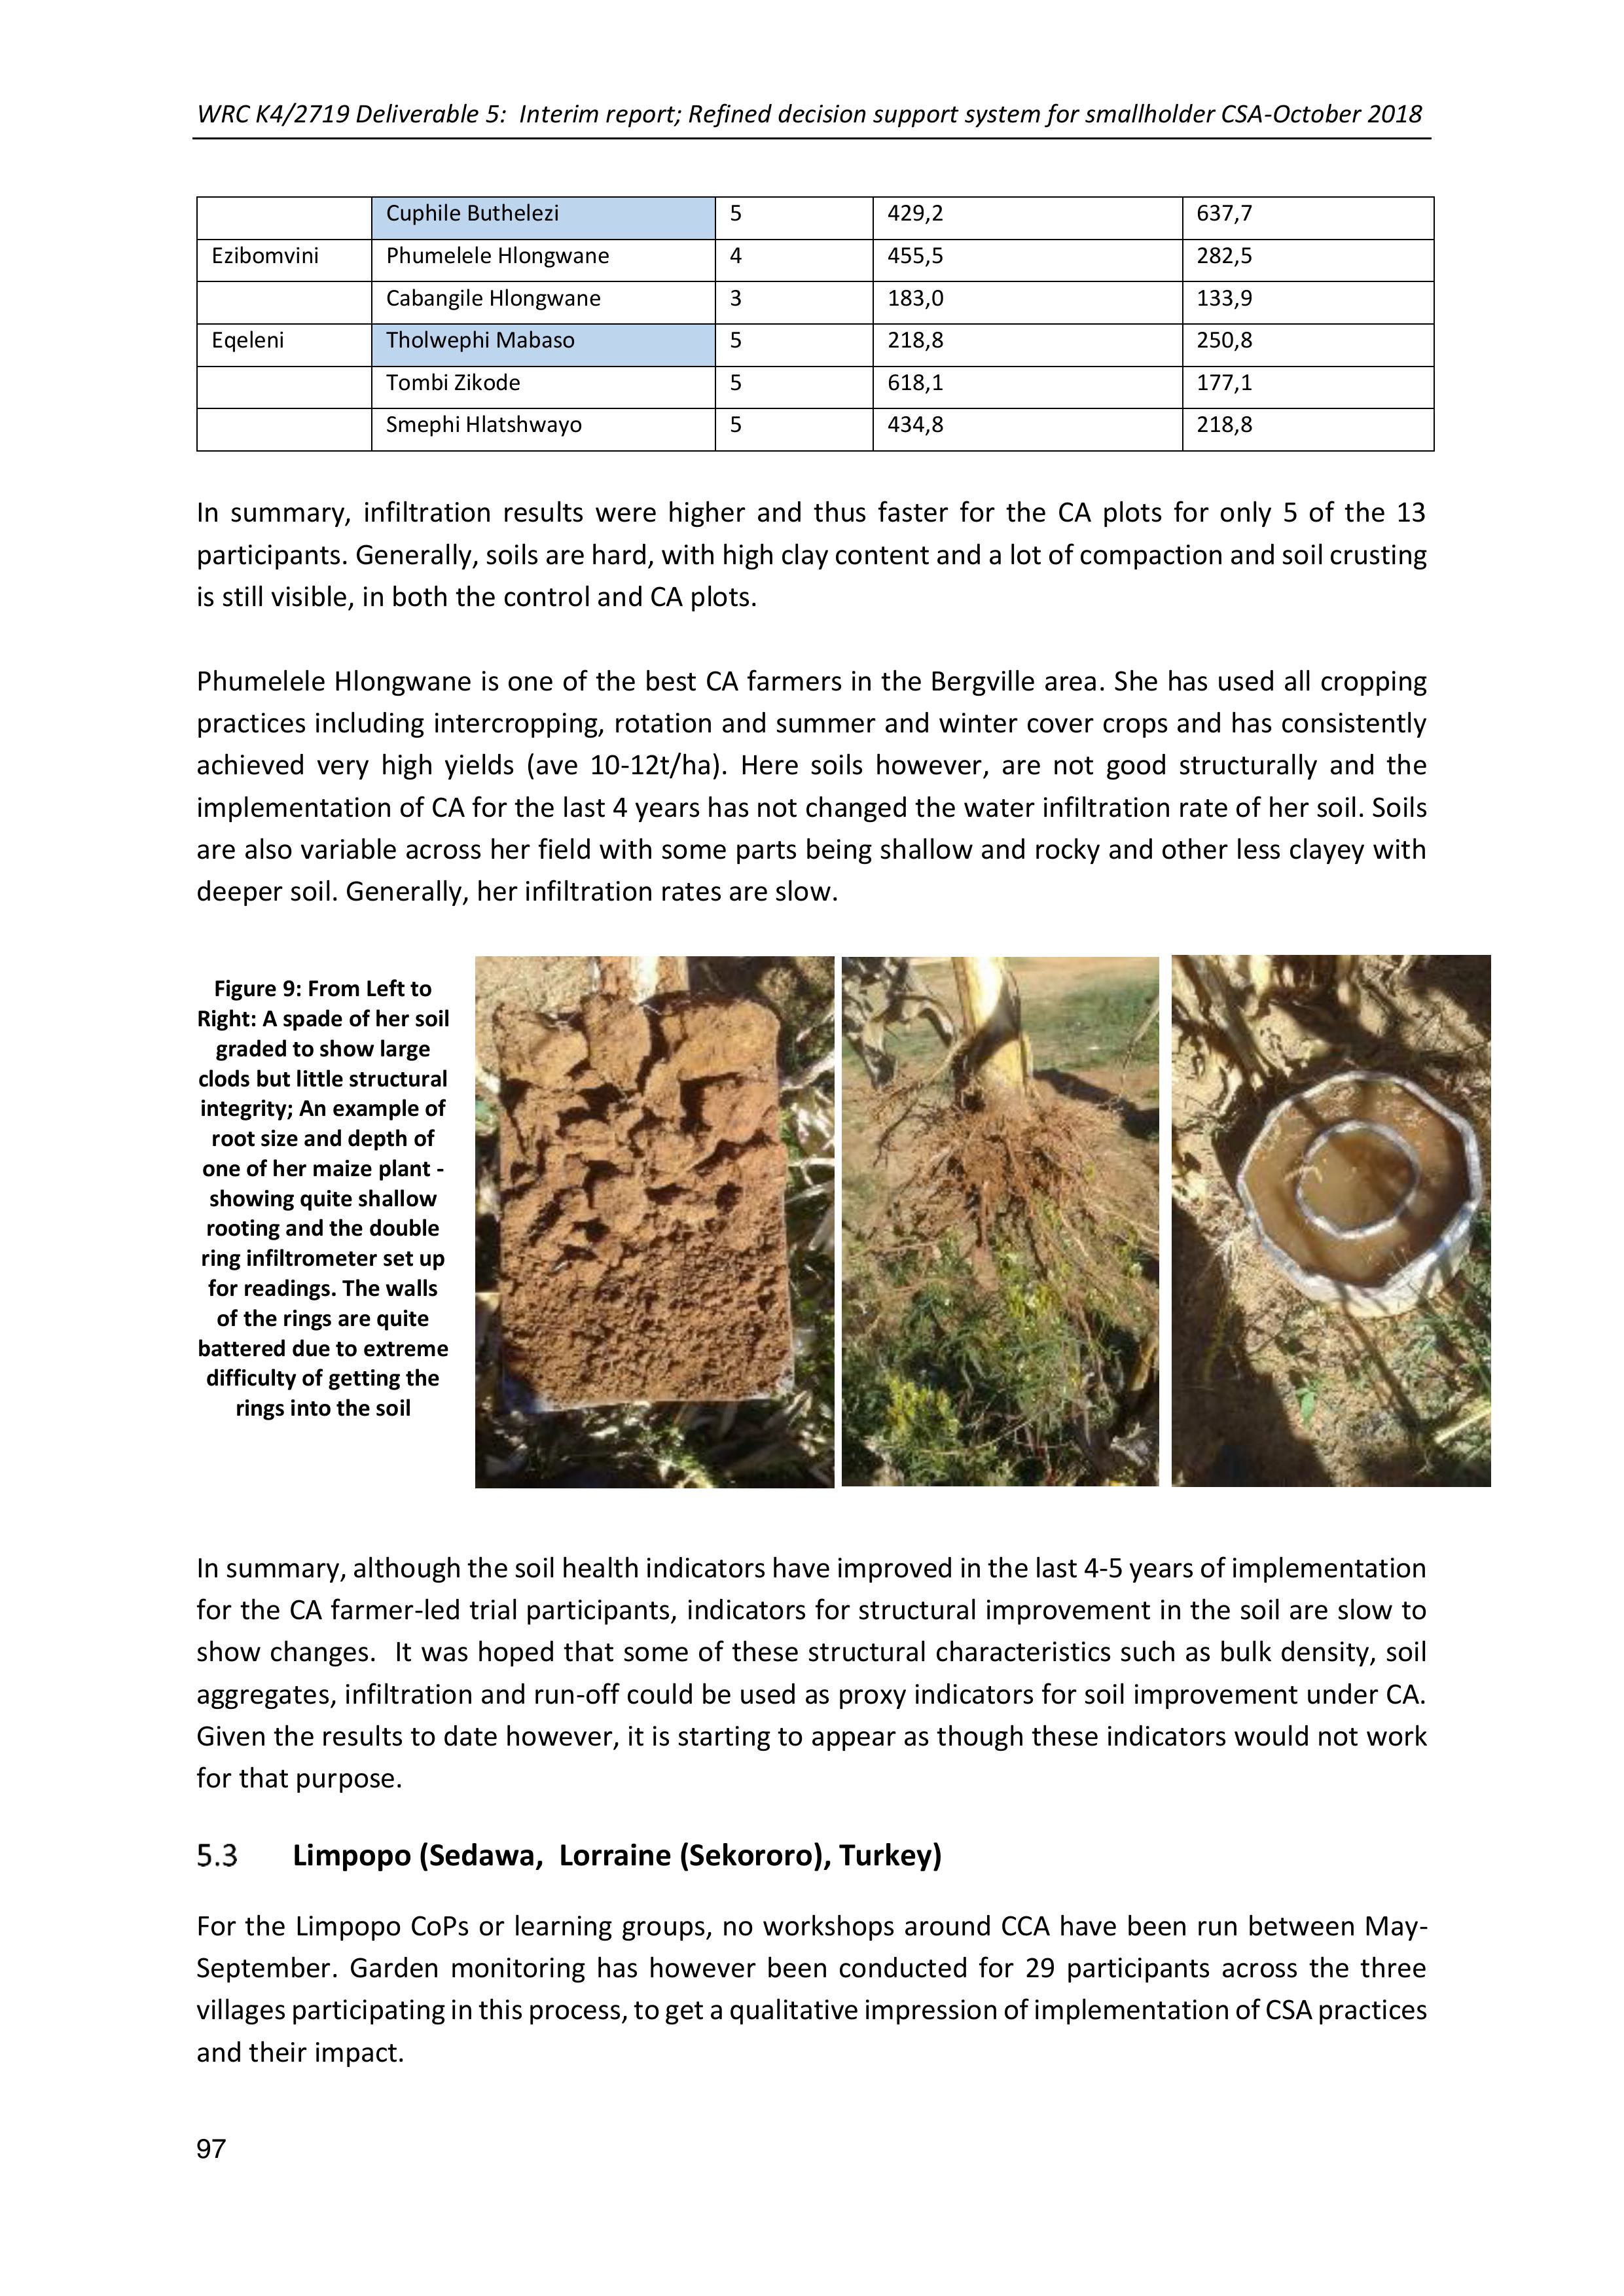
WRC K4/2719 Deliverable 5: Interim report; Refined decision support system for smallholder CSA-October 2018
97
Cuphile Buthelezi
5
429,2
637,7
Ezibomvini
Phumelele Hlongwane
4
455,5
282,5
Cabangile Hlongwane
3
183,0
133,9
Eqeleni
Tholwephi Mabaso
5
218,8
250,8
Tombi Zikode
5
618,1
177,1
Smephi Hlatshwayo
5
434,8
218,8
In summary, infiltration results were higher and thus faster for the CA plots for only 5of the 13
participants. Generally, soils are hard, with high clay content and a lot of compaction and soil crusting
is still visible, in both the control and CA plots.
Phumelele Hlongwane isone of the best CAfarmersin the Bergville area. Shehas used all cropping
practices including intercropping, rotation and summer andwinter cover crops and has consistently
achieved very high yields (ave 10-12t/ha). Here soils however, are not good structurally and the
implementation of CA for the last 4 years has not changed the water infiltration rate of her soil. Soils
are also variable across her field with some parts beingshallow and rocky and other less clayeywith
deeper soil. Generally, her infiltration rates are slow.
Figure 9: From Left to
Right: A spade of her soil
graded to show large
clods but little structural
integrity; An example of
root size and depth of
one of her maize plant -
showing quite shallow
rooting and the double
ring infiltrometer set up
for readings. The walls
of the rings are quite
battered due to extreme
difficulty of getting the
rings into the soil
In summary, although the soil health indicators have improved in the last4-5 years of implementation
for the CA farmer-led trialparticipants, indicators for structural improvement in the soil are slow to
show changes. It was hoped that some of these structural characteristics such as bulk density, soil
aggregates, infiltration and run-off could be used as proxy indicators for soil improvement under CA.
Given the results to date however, it is starting to appear as though these indicators would not work
for that purpose.
Limpopo (Sedawa,Lorraine (Sekororo), Turkey)
For the Limpopo CoPs or learning groups, no workshops around CCA havebeen run between May-
September. Garden monitoringhas however been conducted for 29 participants across the three
villages participating in this process, to get a qualitativeimpression of implementation of CSA practices
and their impact.

WRC K4/2719 Deliverable 5: Interim report; Refined decision support system for smallholder CSA-October 2018
98
For the period of July-September 2018, 29 garden monitoring forms have been filled in by the
intern, Betty Maimela, with assistance from the Local Facilitator for Sedawa, Christinah Thobejane.
Monitoring has been conducted for the following villages: Sedawa, Mabins A, Botshabelo, Turkey
and Lorraine (Sekororo). Lorraine is a village where MDF worked in partnership with Lima-RDF to
introduce tunnels (4 participants) and farmer experimentation. This collaboration was started in
the 2017-2018 project period, but has not continued, due to staff and project changes within Lima.
We conducted the monitoring to check progress for these participants in the last year and to
provide some closure for this activity.
The two graphs below indicate the implementation for the participants monitored during this
period.
Figure 10: Percentage implementation of new interventions and new innovations for a selection of participants from 3
villages; July-September 2018
From Figure 10above, the implementation of new interventions (CSA practices) is high for vegetable
production practices; including for example keeping seed, growing seedlings from seed, mixed
cropping, trench beds and RWH storage. It is clear that these participants are active in gardening and
focussing on activities that can maximise their production. Practices related to soil and water
conservation show much less enthusiastic uptake.
Farmer experimentation shows a high level of uptake (76%). The small table below shows the
experiments undertaken by these participants. In all cases participants have experimented with
different bed designs that could maximise production and efficient use of scarce water resources.
Trench beds are by far the most popular option. Here participants have made an average of 3 trench
beds each for the 29 participants where monitoring was conducted. A few participants now have as
many as 10 trench beds, indicating their level of commitment to this practice.
Farmer Experimentation
No of participants (N=29)
trench beds
21
tower gardens
4
34%
21%
14%
76%
31%
93%
97%
38%
24%
21%
0%
21%
21%
93%
76%
Cut off drains/diversion…
Contours, line levels
Stone bunds
trench beds
Eco circles
Mixed cropping
Seed and seedlings
mulching
Liquid manure
Nat P&D control
CA
Bucket filters/ drip kits
Tunnel
RWH storage
Experimentation
% Implementation of new ideas (N=29); July-
September 2018
Series1
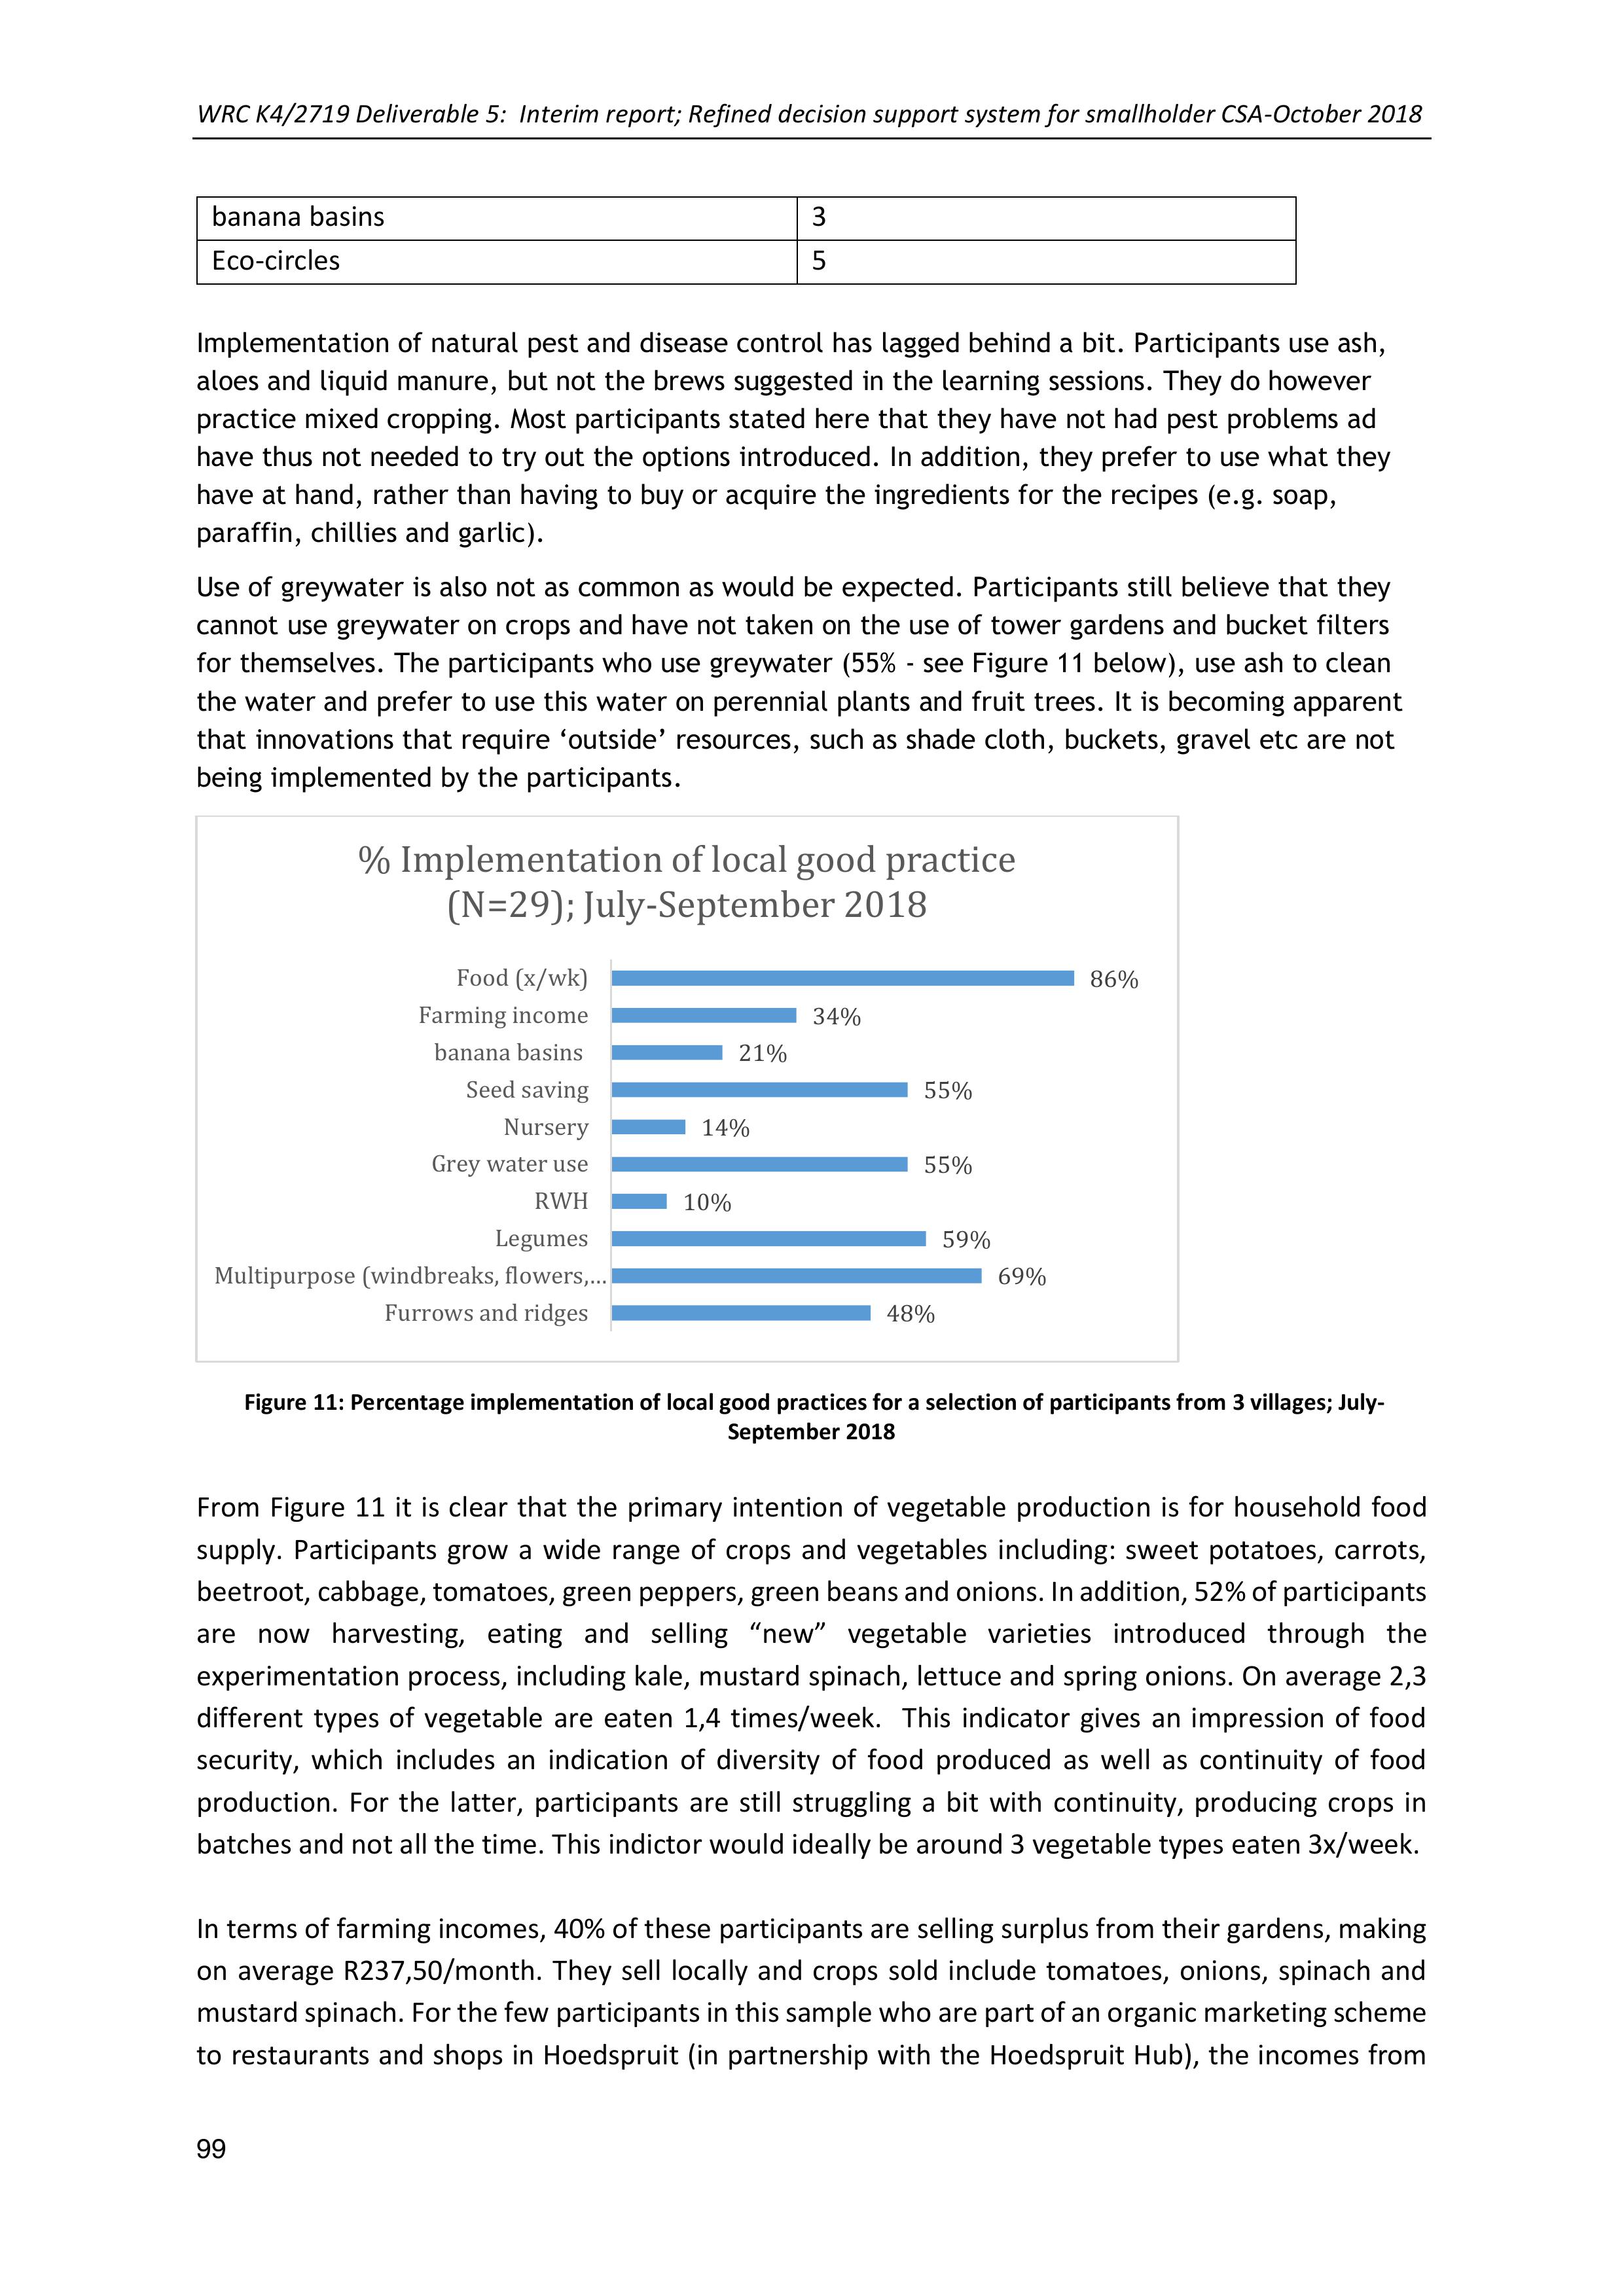
WRC K4/2719 Deliverable 5: Interim report; Refined decision support system for smallholder CSA-October 2018
99
banana basins
3
Eco-circles
5
Implementation of natural pest and disease control has lagged behind a bit. Participants use ash,
aloes and liquid manure, but not the brews suggested in the learning sessions. They do however
practice mixed cropping. Most participants stated here that they have not had pest problems ad
have thus not needed to try out the options introduced. In addition, they prefer to use what they
have at hand, rather than having to buy or acquire the ingredients for the recipes (e.g. soap,
paraffin, chillies and garlic).
Use of greywater is also not as common as would be expected. Participants still believe that they
cannot use greywater on crops and have not taken on the use of tower gardens and bucket filters
for themselves. The participants who use greywater (55% - see Figure 11 below), use ash to clean
the water and prefer to use this water on perennial plants and fruit trees. It is becoming apparent
that innovations that require ‘outside’ resources, such as shade cloth, buckets, gravel etc are not
being implemented by the participants.
Figure 11: Percentage implementation of local good practices for a selection of participants from 3 villages; July-
September 2018
From Figure 11it is clear that the primary intention of vegetableproduction is for household food
supply. Participants grow a wide range of crops and vegetables including: sweet potatoes, carrots,
beetroot, cabbage, tomatoes, green peppers, green beans and onions. In addition, 52% of participants
are now harvesting, eating and selling “new” vegetable varieties introduced through the
experimentation process, including kale, mustard spinach, lettuce and spring onions. On average 2,3
different types of vegetable are eaten 1,4 times/week. This indicator gives animpression of food
security, which includes an indicationof diversity of food produced as well as continuity of food
production. For the latter, participants are still struggling a bit with continuity, producingcrops in
batches and not all the time. This indictor would ideally be around 3 vegetable types eaten 3x/week.
In terms of farming incomes, 40% of these participants are selling surplus from their gardens, making
on average R237,50/month. Theysell locallyand crops sold include tomatoes, onions, spinach and
mustard spinach. For the few participants in this sample who arepart of anorganic marketing scheme
to restaurants andshops inHoedspruit(in partnershipwith the HoedspruitHub), the incomes from
48%
69%
59%
10%
55%
14%
55%
21%
34%
86%
Furrows and ridges
Multipurpose (windbreaks, flowers,…
Legumes
RWH
Grey water use
Nursery
Seed saving
banana basins
Farming income
Food (x/wk)
% Implementation of local good practice
(N=29); July-September 2018

WRC K4/2719 Deliverable 5: Interim report; Refined decision support system for smallholder CSA-October 2018
100
herbs and vegetables have averaged R600/month. This indicates the potential of increased incomes
given a committed and reliable market outside the community.
The percentage of participants saving seed is around 55%. This is significantly higher than the
percentage of participants who saved seed in the corresponding period last year, which was around
25%, forthe 38 participantsfor whom monitoring wasdone in July-August 2017. This could potentially
be due to the renewed focus and interest in seed saving as a result of the seed saving workshops and
trainings that have been conducted in these villages.
Below are a few case studies for selected participants.
Case study: Matibela Moradiya (Sedawa)
Matibela is an active participant whohas tried out most of the new interventions and innovations
introduced in the learning sessions. She has experimented with trench beds, eco-circles, mixed
cropping, seeds and seedlings, mulching and liquid manure. She also has a tunnel and drip kits. Like
many other participants she is really struggling withwater supply and
is purchasing water in210ldrums for irrigating her garden. This has
meant that she has focussed almost exclusively on her tunnel. She
manages to eat 1-2x/week from her tunnel and also sells small
quantities of surplus vegetables and herbs.
Clockwise from top Left: Matibela’s tunnel; with
spinach and peas visible; her yard which is now
almost entirely devoid of other crops due to drought;
a bed ofcarrots in her tunnel; andthe drip kit
irrigating a bed of spring onions and parsley in the
tunnel.
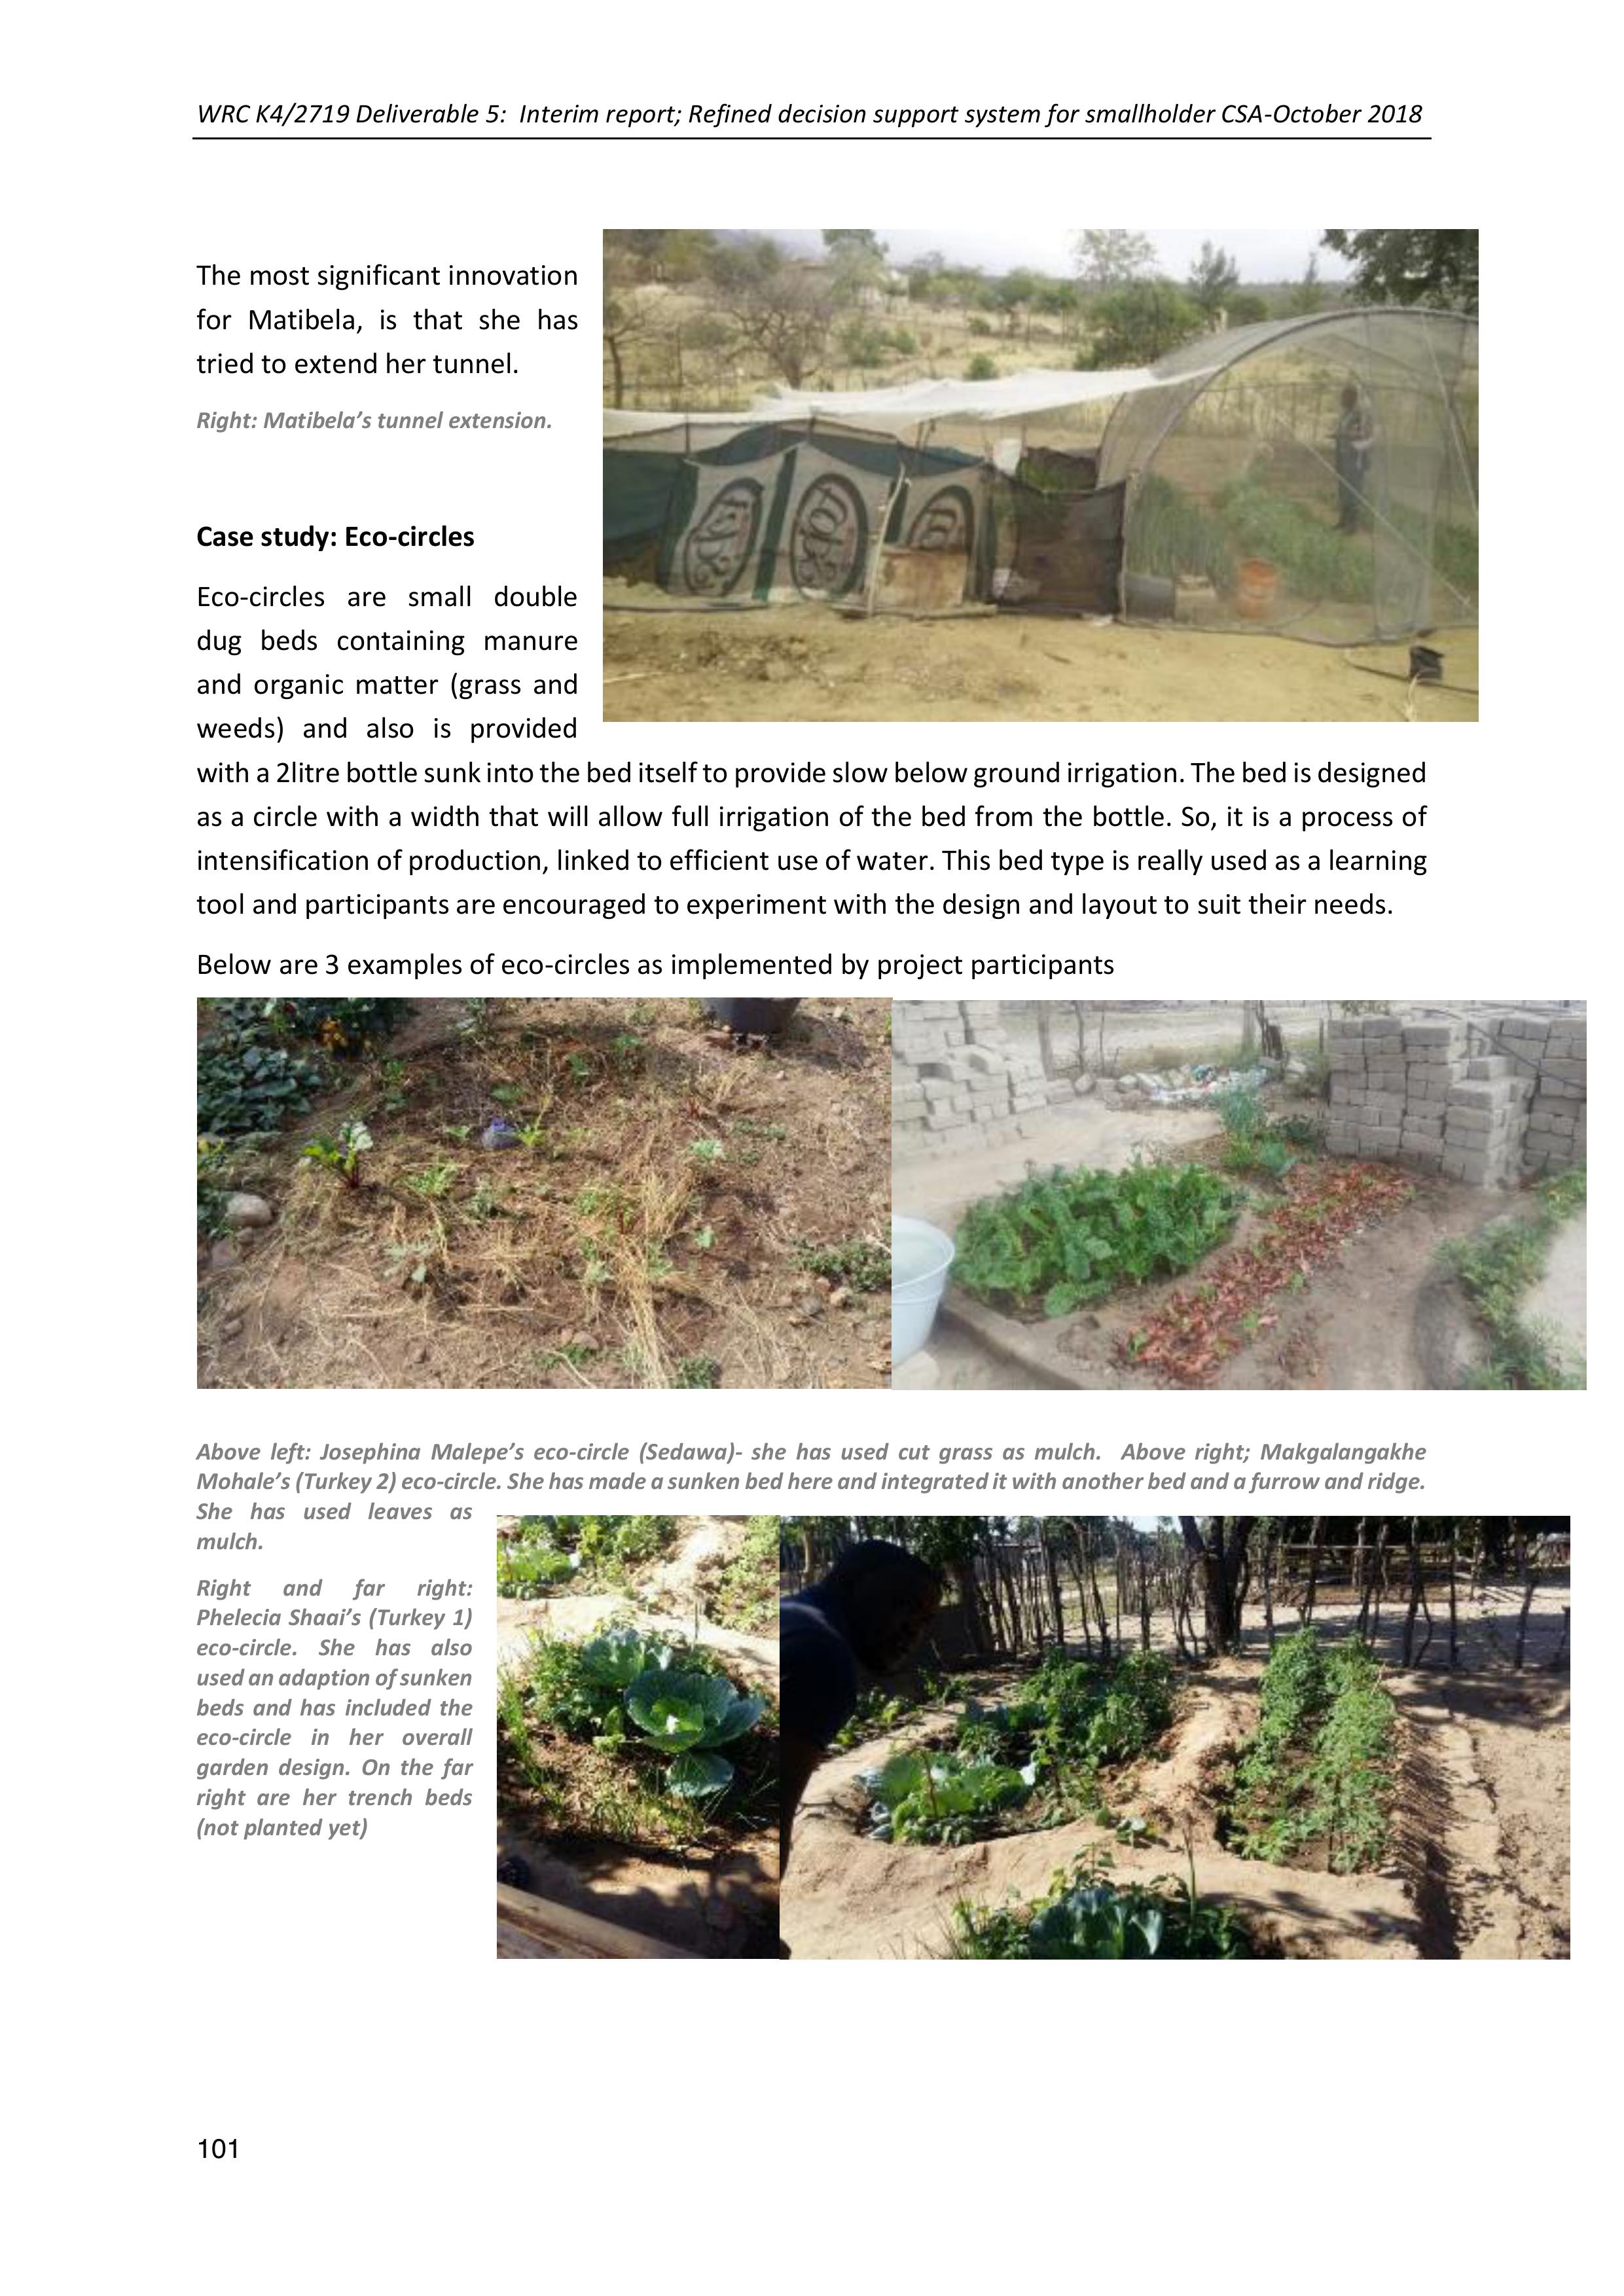
WRC K4/2719 Deliverable 5: Interim report; Refined decision support system for smallholder CSA-October 2018
101
The most significant innovation
for Matibela, is that she has
tried to extend her tunnel.
Right: Matibela’s tunnel extension.
Case study: Eco-circles
Eco-circles are small double
dug beds containing manure
and organic matter (grass and
weeds) and also is provided
with a 2litre bottle sunk into the bed itself toprovide slow below ground irrigation. The bed is designed
as a circle with a width that will allow full irrigation of the bed from the bottle. So, it is a process of
intensification of production, linked to efficient use of water. This bed type is really used as a learning
tool and participants are encouraged to experiment with the design and layout to suit their needs.
Below are 3 examples of eco-circles as implemented by project participants
Above left: Josephina Malepe’s eco-circle (Sedawa)- she has used cut grass as mulch. Above right; Makgalangakhe
Mohale’s(Turkey 2) eco-circle. She has made a sunken bed here and integrated it with another bed and a furrow and ridge.
She has used leaves as
mulch.
Right and far right:
Phelecia Shaai’s (Turkey 1)
eco-circle. She has also
used an adaption of sunken
beds and has included the
eco-circle in her overall
garden design. On the far
right are her trench beds
(not planted yet)
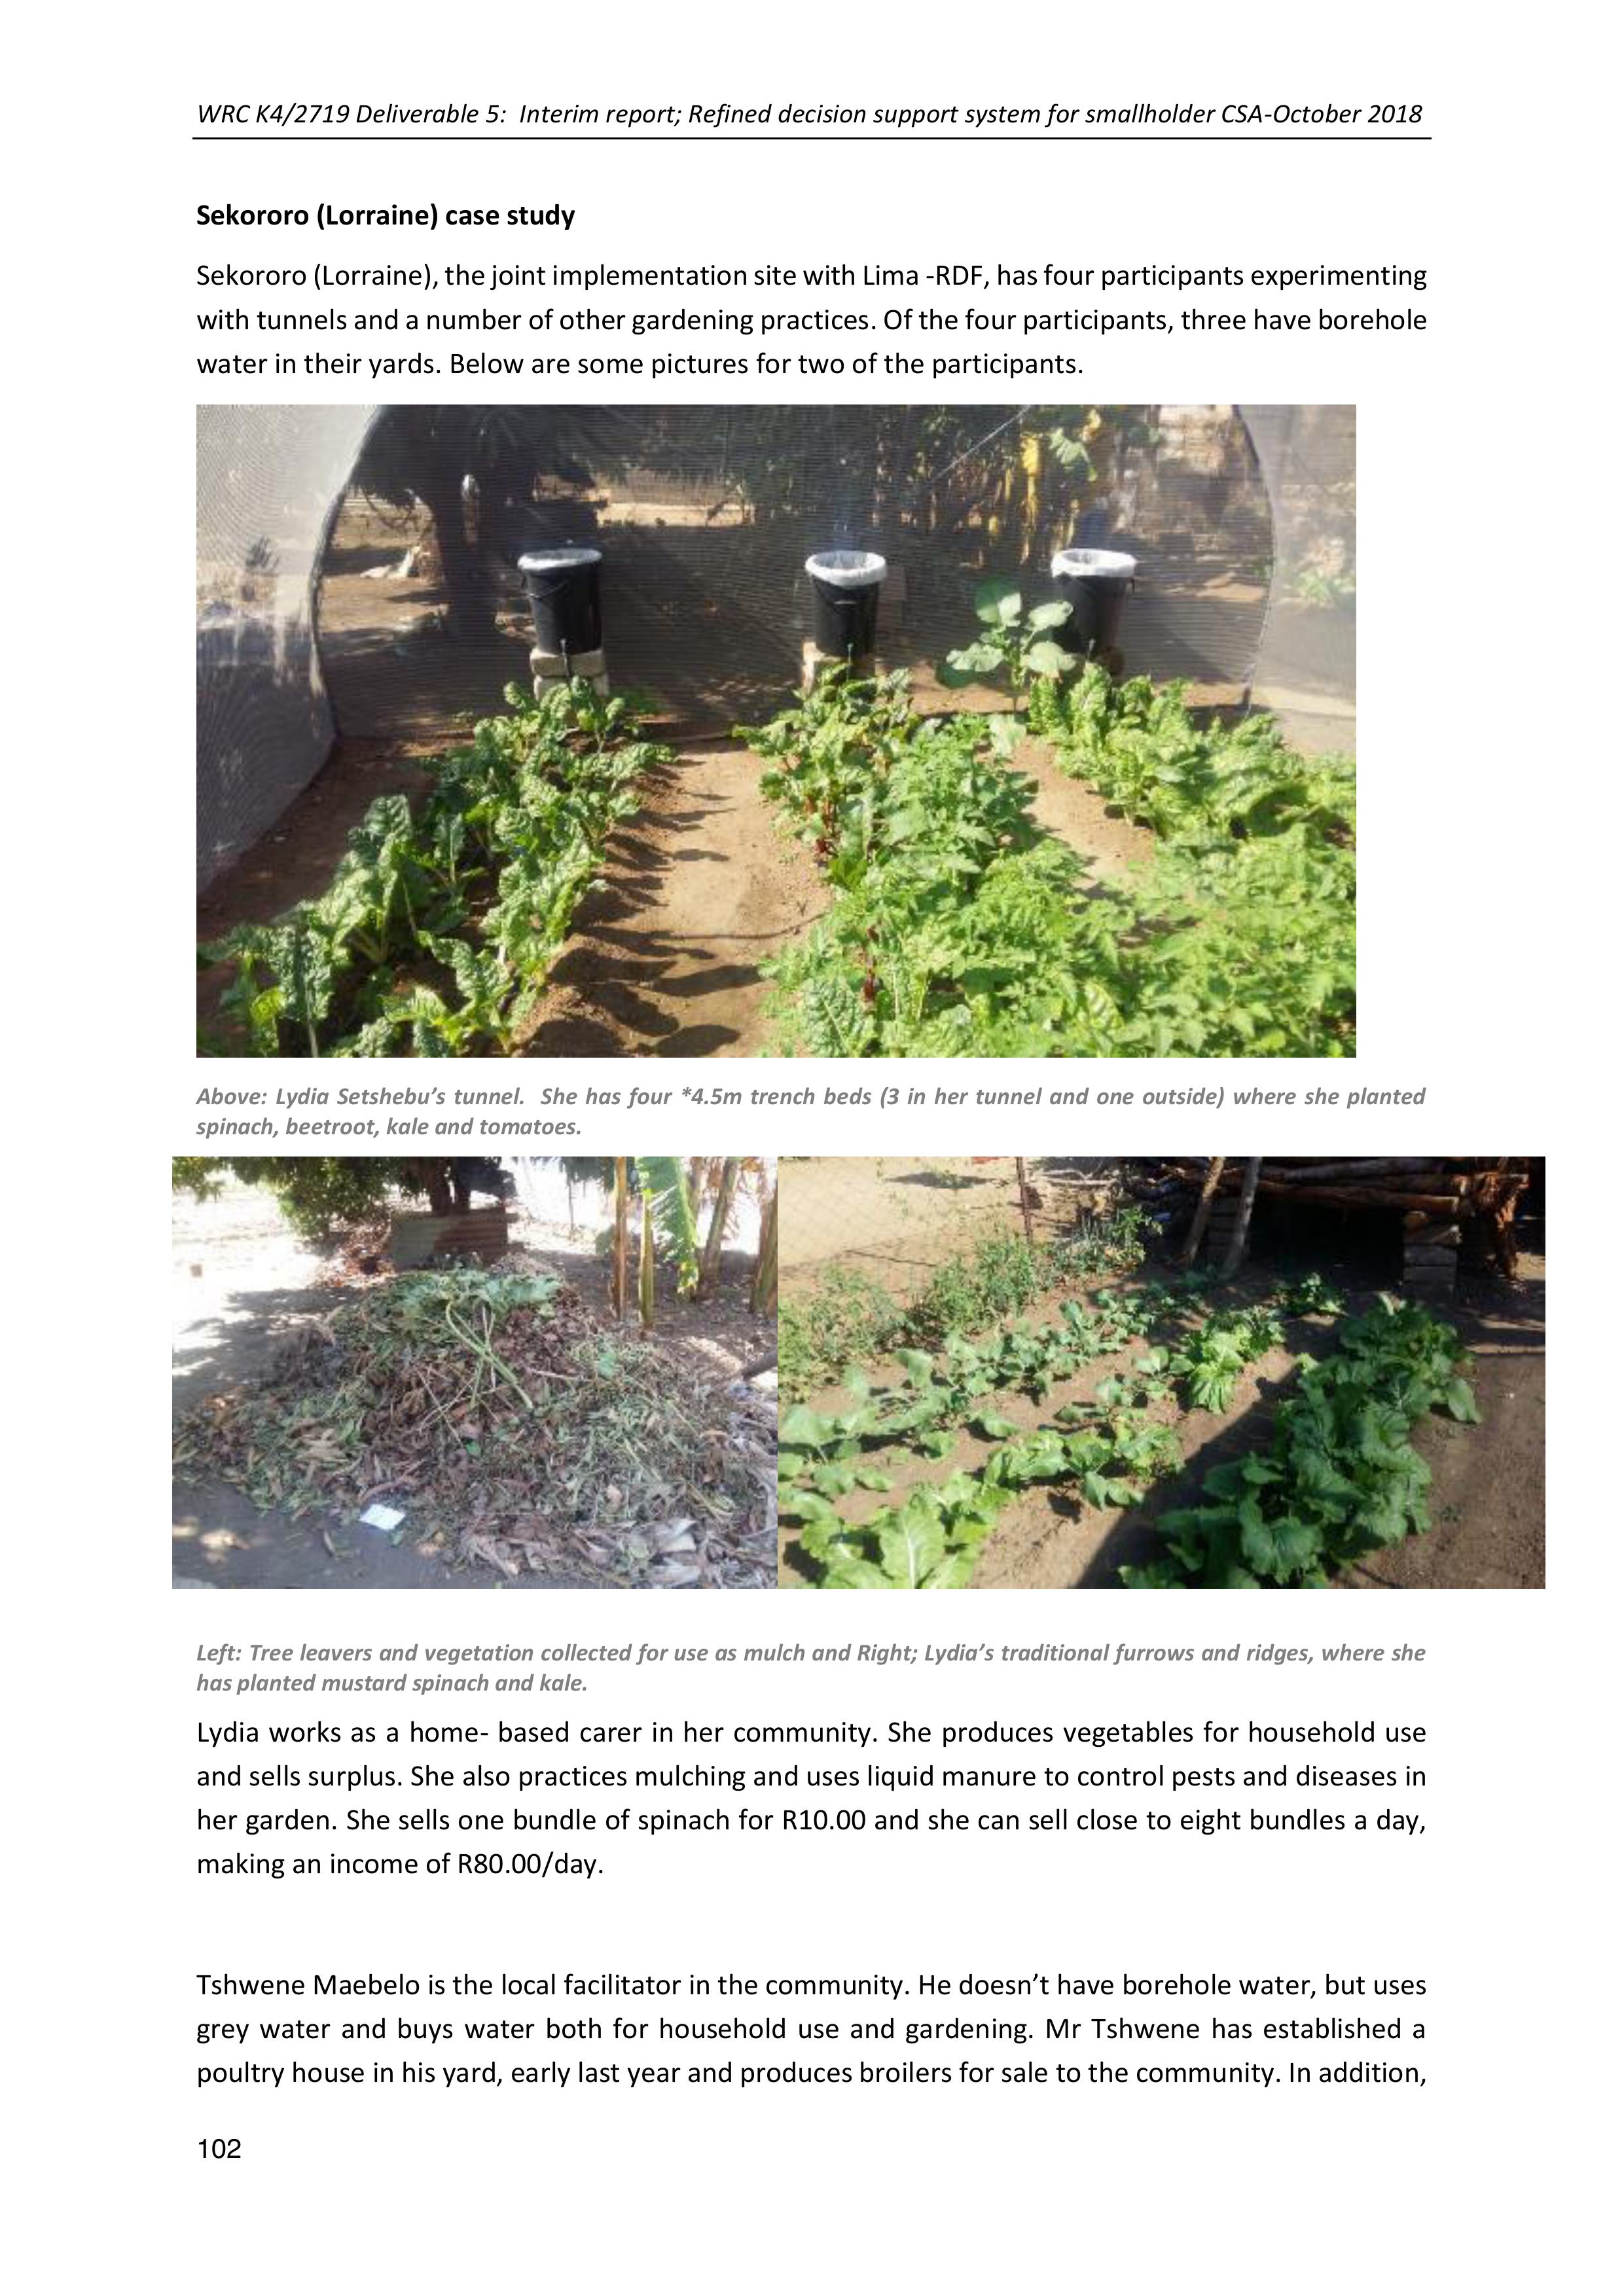
WRC K4/2719 Deliverable 5: Interim report; Refined decision support system for smallholder CSA-October 2018
102
Sekororo (Lorraine) case study
Sekororo (Lorraine), the joint implementation site with Lima -RDF, has four participants experimenting
with tunnels and a number of other gardening practices. Of the four participants, three have borehole
water in their yards. Below are some pictures for two of the participants.
Above: Lydia Setshebu’s tunnel. She has four *4.5m trench beds (3 in her tunnel and one outside) where she planted
spinach, beetroot, kale and tomatoes.
Left: Tree leavers and vegetation collected for use as mulch and Right; Lydia’s traditional furrows and ridges, where she
has planted mustard spinach and kale.
Lydia works as a home- based carer in her community. She produces vegetables for household use
and sells surplus. She also practices mulching and uses liquid manure to control pests and diseases in
her garden. She sells one bundle of spinach for R10.00 and she can sell close to eight bundles a day,
making an income of R80.00/day.
Tshwene Maebelo is the local facilitator in the community. He doesn’t have borehole water, but uses
grey water and buys water both for household use and gardening. Mr Tshwene has established a
poultry house in his yard, early last year and produces broilers for sale to the community. In addition,
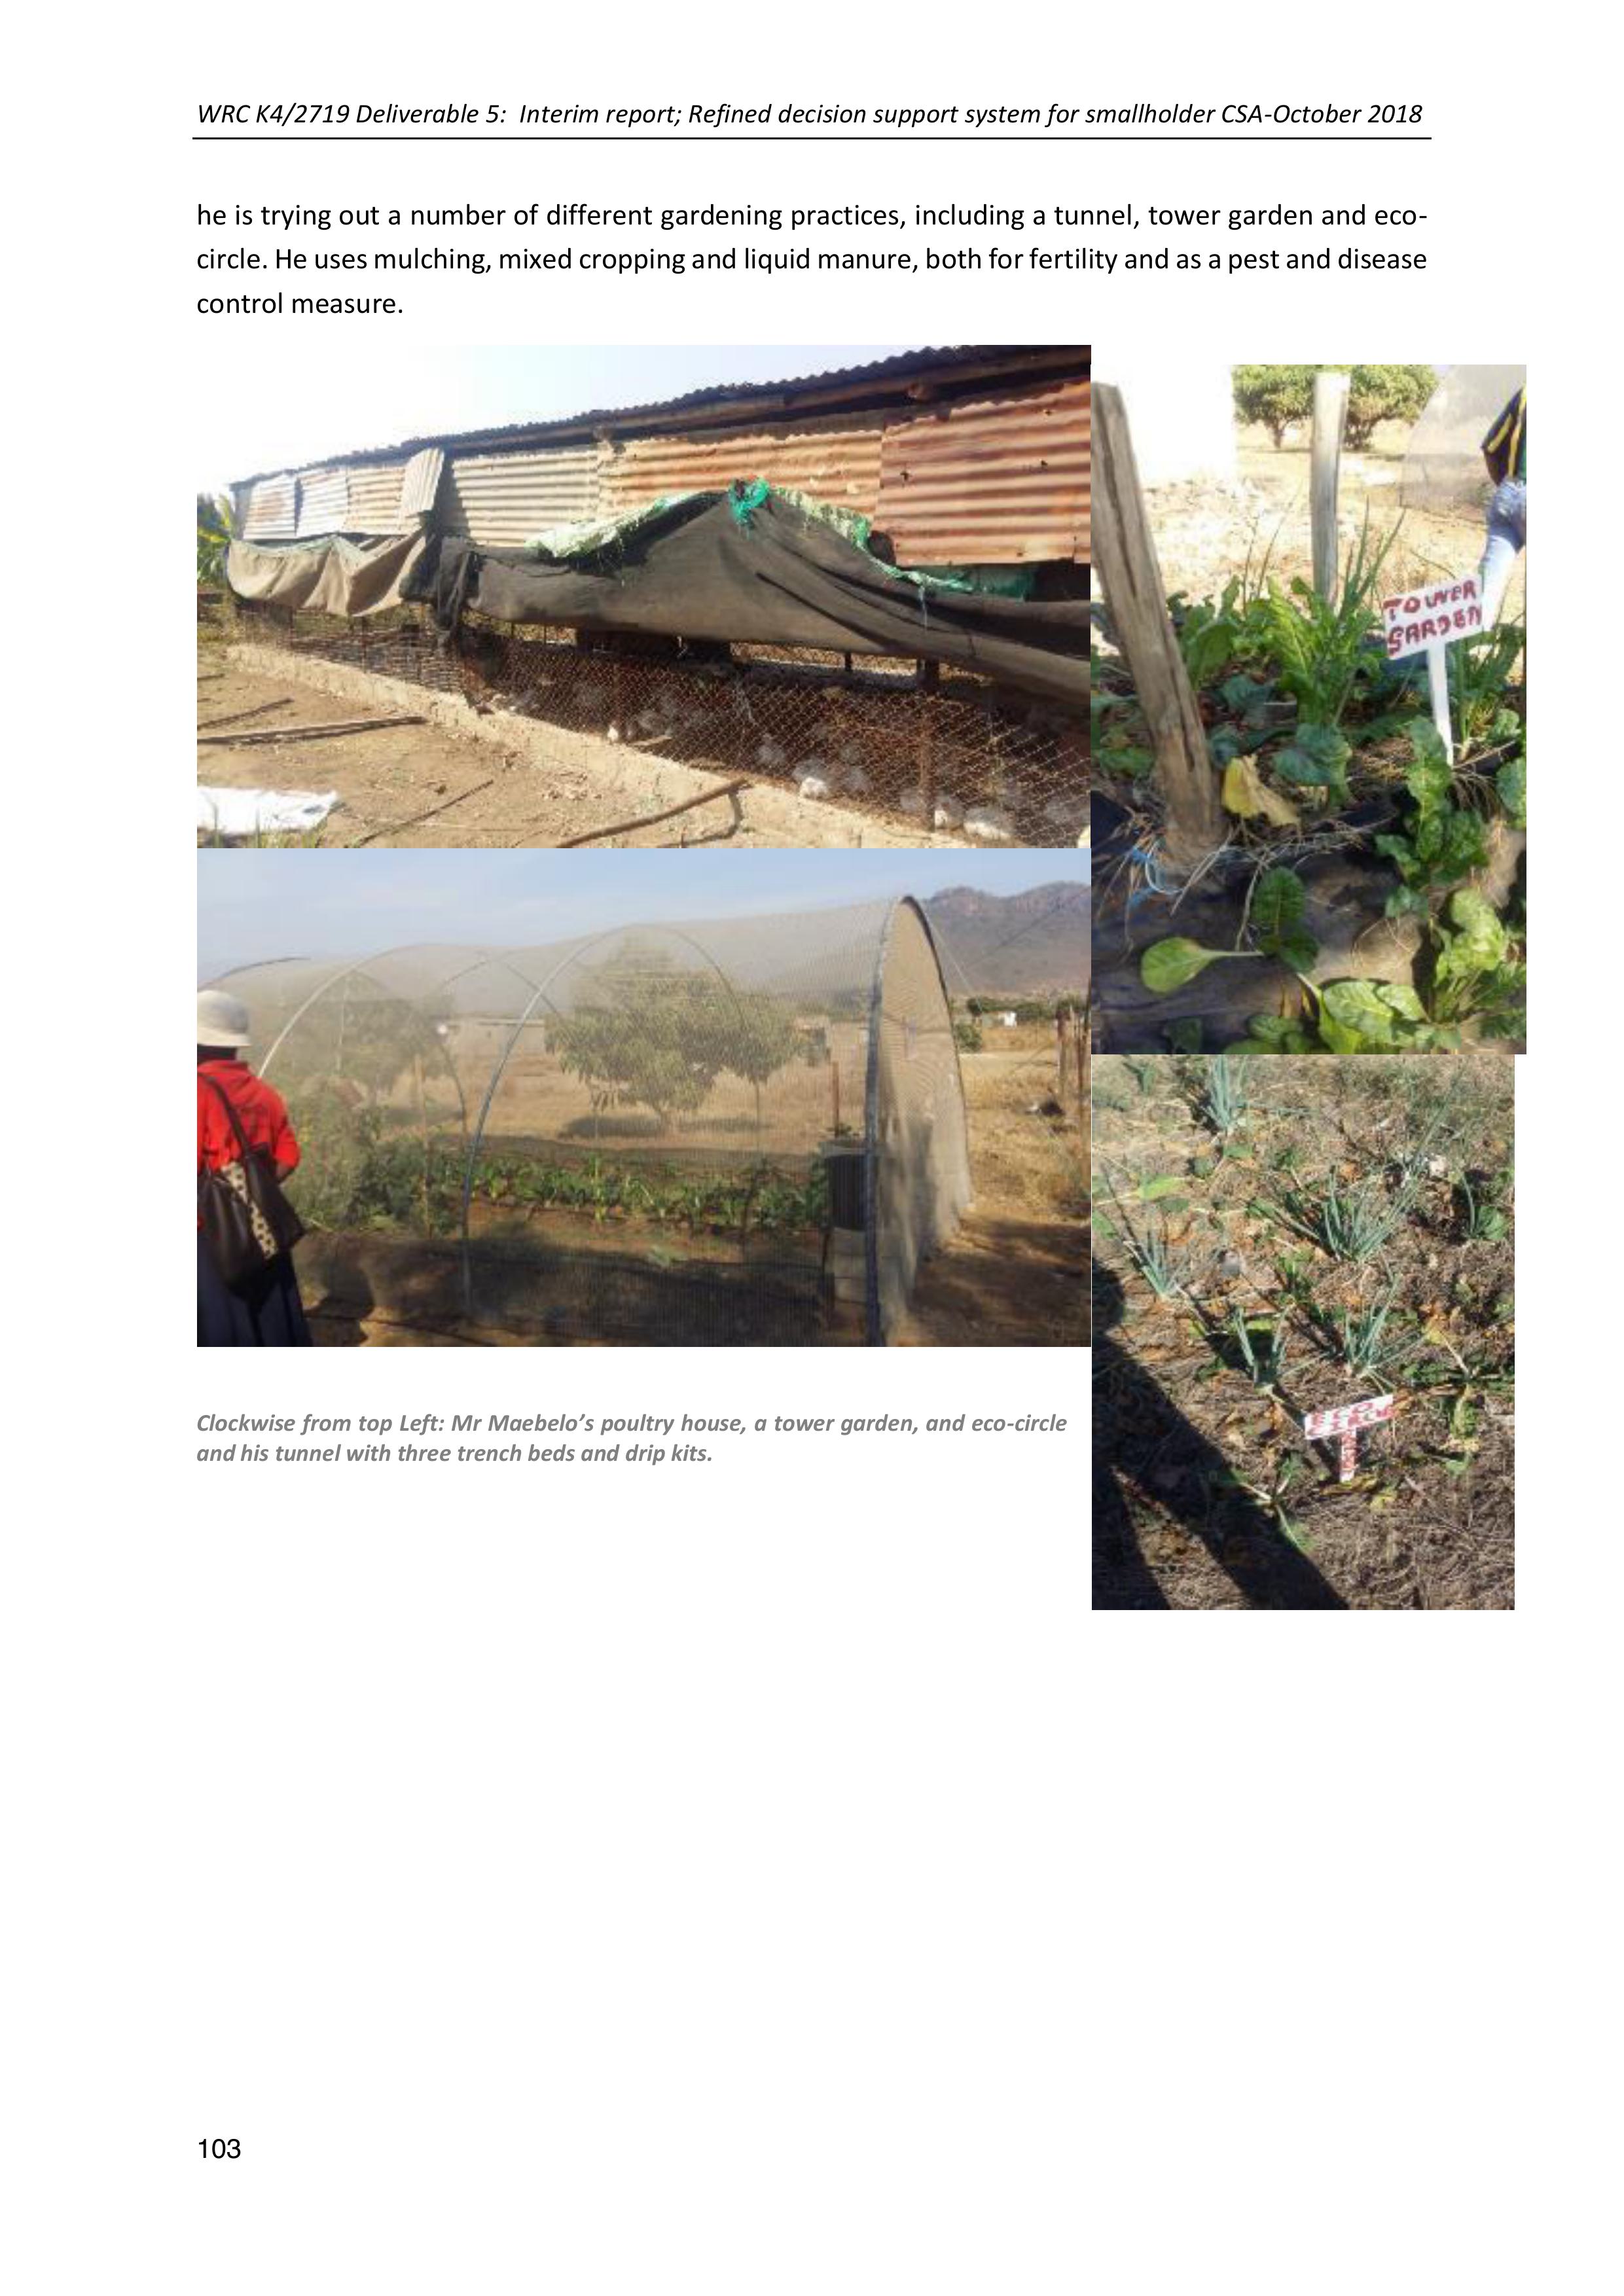
WRC K4/2719 Deliverable 5: Interim report; Refined decision support system for smallholder CSA-October 2018
103
he is trying out a number of different gardening practices, including a tunnel, tower garden and eco-
circle. He uses mulching, mixed cropping and liquid manure, both for fertility and as a pestand disease
control measure.
Clockwise from top Left: Mr Maebelo’s poultry house, a tower garden, and eco-circle
and his tunnel with three trench beds and drip kits.

WRC K4/2719 Deliverable 5: Interim report; Refined decision support system for smallholder CSA-October 2018
104
6QUANTITATIVE MEASUREMENTS FOR MONITORING IMPACT
For the individual experimentation cycle of November 2017- April 2018, a number of quantitative
measurements were undertaken. The table below provides a summary.
Table 23: Participants in quantitative measurements for trials; KZN, Limpopo and EC: September 2018
Province
Category
Name of participants
Name of village
Measurements
undertaken
Limpopo,
KZN
Field cropping and
gardening
Christina Tobejane
Phumelele Hlongwane
Sedawa
Ezibomvini
Weather station;
rainfall, air
temperature, solar
radiation, wind speed,
wind direction, relative
humidity)
Rain gauges; 4 in
Limpopo, 6 in KZN
Limpopo
Field cropping
(CA)
Koko Maphori
Sedawa
Run-off plots, bulk
density, gravimetric soil
samples,
Lerato Lewele
Mametja
Seemole Malepe
Botshabelo
Gardening
(Tunnels, dripkits
– trench
beds, mixed
cropping,
mulching)
Christina Tobejane
Sedawa
Chameleon sensors
Norah Malepe
Mametja
Mariam Malepe
Botshabelo
KwaZulu-
Natal
Field cropping
(CA)
Ntombake Zikode
Eqeleni
Run-off plots, bulk
density, gravimetric soil
samples,
Phumelele Hlongwane
Ezimbomzini
Phumzile Zimba
Mhlwazini
Gardening
(Tunnels, dripkits
– trench
beds, mixed
cropping,
mulching)
Ntombakhe Zikode
Eqeleni
Chameleon sensors
Phumelele Hlongwane,
Zodwa Zikode, Nombono
Dladla
Ezibomvini
EC
Gardening
Tunnels, drip kits
– trench
beds, mixed
cropping,
mulching)
Eddie Padichi
Berlin (Izingisi
Education Centre)
Chameleon sensors
WRC K4/2719 Deliverable 5: Interim report; Refined decision support system for smallholder CSA-October 2018
105
Limpopo measurements for individual experimentation
Written by Sylvester Selala (Note: Mr Selala is intending to register for a PhD in Bioresources, but
wanted to do this first round of implementation to gauge the overall potential of this topic)
Outline of the process
Most smallholder farmers are aware that current farming practices are no longer producing expected
yields. In the light of extreme temperatures and low and erratic rainfall (associated with climate
change), farmers are desperate to try anything which looks like it might have potential to improve
their productivity. It is part of national policy priority topromote sustainable farming practices in
smallholder farming communities, and such practices include climate smart agriculture practices
(CSA). Learning around new practices occurs through workshops, mentoring and farmer
experimentation. How farmers prioritize implementation of new technologieshas always been a
question, especially if they are introduced to several technologies at the same time. Some of the
criteria found in literature that famers use in prioritizing farming practices include, ease of
implementationand perceived benefits.We have learnt through our engagement with the farmers
that introduced practices and their experimentation have to give immediate positiveeffects (in the
first season of implementation) for them to be interested to continue with those practices. While this
makes sense, italso complicates the introduction of practices (such as Conservation Agriculture for
example) that could take longer to show positive results
Even though smallholder farmers are interestedin practices which will give them good yields, they
generally do not have a good understanding of their yields in relation to actual yield potential or the
size of the areas they have planted.
The purpose of introducing quantitative measurements in this setup is; firstly to develop benchmarks
around a range of indicators (including yield, soil fertility and soil health _microbial activity, organic
matter, carbon), run-off, infiltration, bulk density, water holdingcapacity and water productivity), and
secondly to works with farmers todevelop set of visual indicators for prioritizing CSA practices.The
latter would allow farmers to makedecisions about adjustments they can make to the practices to
best suit their situation or condition.
Some of the questions asked by farmers could be answered through these more intensive
measurement processes. These questions include for example;
➢How many trench beds are required to make a profit on vegetable sales,
➢Which crops/ varieties will give higher yields,
➢What is the return on investment if buying the tunnels (shade house structures);
➢How to reduce stress and wilting in crops;
➢ And the amount of water needed to run a garden throughout the season.
We as the researchers also included some indicators we thought would be useful for comparing
scientific derived indicators with locally derived indicators. This would assist in assessing the impact
of these practices in the particular localities they have been introduced in.
WRC K4/2719 Deliverable 5: Interim report; Refined decision support system for smallholder CSA-October 2018
106
Methodology
Farmers were introducedto a wide range of CSA practices, but they have chosen to carry on with
certain practices and never tried others. They have praised the practices they have carried on with as
producing good crops of good quality, saving water and working better than the traditional practices.
In trying to understand how farmers arrived at thedecision of prioritizing certainpracticesover others
we setup experiment to test their theories around the practices. Deep trench beds, conservation
agriculture and tunnels are the most favored practices.
For each of them we looked at,water productivity, evaluated whether the practices improve soil
fertility or soil health and evaluated how farmers have received working with measurements (use of
rain gauges, weather stations, runoff plots and chameleon sensors).
For water productivity (WP), the experiments were aimed at comparing water productivity of different
systems (e.g. comparing water productivity of conservation agriculture to that of conventional tillage).
With regards to gardening, the experiments were aimed at comparing the WP of trench beds that are
inside a tunnel, trench beds outside tunnel and the traditional way farmers use to grow vegetables.
Three sites were selected and were situated in Botshabelo, Sedawa and Mametja. The idea is to use
these three sites as parent sites and establish mini experiments with other farmers in the learning
groups.
Background on water productivity
With extreme temperatures reaching and average of 37oC in the summer season and average seasonal
rainfall of less than 200 mm (now concentrated in a fewmonths) growing anything without
supplementary irrigation is almost impossible in the area. Possible sources of water for irrigation
include, municipal water (water fromboreholes), streams, wells (natural springs) and rooftop
rainwater harvesting and more recently, yard or surface rainwater harvesting. Although some of these
sources are drying out, the most feasible option for farmers as far as water is concerned is managing
the limited water they have as best they can. In realizing that options for increasing water supply (e.g.
building dams, underground rainwater harvesting tanks and drilling boreholes) are limited we opted
to focus initially on management of available water, especially in the homesteads.
In field cropping systems, the focus has been on dryland cropping, given that sources of water such as
streams are situated far from thefields and cost of conveying water into the fieldsare very high. Those
with fields in proximity to a stream do not have water licenses or permits to abstract water from the
streams (river).
We set up and experiments to evaluate water productivity of both gardening and field cropping
systems. In field cropping systems we measured the following parameters; rainfall, runoff and weather
station information (air temperature, solar radiation, wind speed, wind direction, relative humidity).
Farmers are unfamiliar with some of the techniques used to gather information (e.g. rainfall data,
runoff and soil fertility). We introduced farmers to some to these techniques and explained what the
data can be used for and how taking measurement could contribute to the decisions making process
regarding what to plant and when and how much. Most importantly the techniques were introduced
for purposes of ensuring that farmers explore them and see if they can be of use to them. Building
capacity around scientific data collecting and how it fits into farming was central to this process.

WRC K4/2719 Deliverable 5: Interim report; Refined decision support system for smallholder CSA-October 2018
107
We workedwith the farmers in settingupthe instruments for measuring parameters. Local facilitators
were tasked with collecting rainfall, runoff and chameleon sensor data. Four standard rain gauges
were installed in 2 villages, Botshabelo, Mametja and 2 in Sedawa.
Right and far right:
Installation of rain
gauges and explaining
the process for reading
and recording rainfall
events.
Record keeping of
rainfall was done
reasonably well by all four participants selected and are presented in the table below.
Table 24: Rainfall records from 4 standard rain gauges in Sedawa, Mametja and Botshableo
Sedawa
Mametja
Botshabelo
Christina
Tobejane
Koko Maphori
Lerato Lewele
Mariam Malephe
Date
rainfall (mm)
rainfall (mm)
rainfall (mm)
rainfall (mm)
21/12/2017
5
10
8
7
24/12/2017
1
4
3
4
30/12/2017
22
32
30
28
25/01/2018
1.5
3.5
3.8
5
28/01/2018
1.6
2.1
2
3
30/01/2018
1
1.5
1.8
1.4
24/02/2018
2
2.6
2.8
2.4
16/03/2018
28
51
30.2
10.2
21/03/2018
9
20.8
10.2
20.5
24/03/2018
20
32
28
9
01/04/2018
9
8
15
30
02/04/208
1.4
2
2
1.8
Total
101.5
169.5
136.8
122.3
Ave for each
rainfall event
8.5
14.1
11.4
10.2
WRC K4/2719 Deliverable 5: Interim report; Refined decision support system for smallholder CSA-October 2018
108
It is interestingto note the variability in records between the 4 rain gaugesfrom the table above.
Readings from the two rain gauges in Sedawa are expected to bequite similar; which they are not.
This points towards some inaccuracies inrecord keeping on one of the participants. Theslightlyhigher
rainfall values for Mametja and Botshabelo are not significant and do not indicate an overall difference
in rainfall in these villages. It is clear that the amount of rainfall inthis area has been extremely low
for this season.
Although the intention has been to compare these results with the rainfall data from the weather
station, ongoing calibration and charging problems with the weather station meant that data wasonly
available from April onwards.
Rainfall records from the weather station (Based at Christina Tobejane’s homestead for early April of
8,9 mm between 01-03 April 2018, compare well with those taken from the rain gauge - 10,4 mm.
In determiningthe water productivity, parameters (temperature, relative humanity, solar radiation,
wind speed, wind direction to calculated ET0) are required and these parameters are gathered from
automatic weather stations. This information can be used to benchmark simpler methods used in the
field, that farmers can be involved in.
Scientist have made apoint that, not all water applied in an agricultural fields orplots whether through
rainfall or in the form of irrigation is used by the crop. To simplify this process two assumptions have
been made.
To calculate the ET0 equation 2 is used. The weather station calculates the reference evaporation ET0
using the Penman Monteith equation shown below
(1)
Where,
ET0 reference evapotranspiration (mm/day),
Rn net radiation at the crop surface (MJ m-2 day-1),
G soil heat flux density (MJ m-2 day-1),
T air temperature at 2 m height (°C),
u2 wind speed at 2 m height (m s-1),
es saturation vapour pressure (kPa),
D slope vapour pressure curve (kPa °C-1),
g psychrometric constant (kPa °C-1),
Water productivity in rainfed field cropping systems
Water productivity (WP) is a measure of the output of a given system in relation to the water it
consumes. It is expressed by the equation bellow:
(2)
WRC K4/2719 Deliverable 5: Interim report; Refined decision support system for smallholder CSA-October 2018
109
Agricultural benefit is the grain or crop yield.
In field cropping systems, to simplify the equation used, but include the necessary and monitored
indicators, parameters for measuring water use were chosen following the water balance equation
Where P is Precipitation, ET is evapotranspiration, R is runoff and, is change in soil water storage.
In this case P represents the water use in the above equation
Water productivity in gardening systems
In trying to determine water productivity for gardening systems, only the amount of water transpired
by the plant is considered. This is because run-off is considered negligible in garden level irrigation
practices, as is change in soil moisture content. For the latter Chameleon sensors have been installed
to assist the farmers to understand the available water in their soil and irrigate in a way that ensures
good water availability.
In the gardening system, using Equation (2) above, water use then refers to theevapotranspiration
only.
From ET0(Equation1), theactual evapotranspiration is calculated using theequation below, where
ETc is the Actual evapotranspiration (mm/day) and Kc is the crop coefficient. If one takes spinach to
be thereference crop, as this was planted in thefarmer experiments, it is possible to use existing crop
coefficients. For spinach this is taken to be 0,95 (According to the FAO, Kc for spinach at maximum
height is 0.95).
The actual evapotranspiration is then substituted into the WP equation (2)
(3)
Where ETc is the actualevapotranspiration, Kc is the crop coefficient and ET0 is the reference
evapotranspiration.
These “simpler” equations were used for calculation of the WP for the field cropping (CA) and
gardening (tunnels, trench beds) experiments. The results are discussed in the two small sections
below.
Conservation Agriculture vs conventional tillage
With regards to field cropping, traditionally, farmers used conventional tillage practices and planted
sorghum, millet, maize, cowpea, beans, watermelons, groundnuts, jugo beans and pumpkins. Over
the years they have since abandoned sorghum and millet (because of birds and low yields due to heat
and drought) and focused on maize and ground cover crops. They have observed a decline in maize
yields in the previousyears due to lack of rainfall. We introduced conservation agriculture, which is
defined in terms of its three pillars or principles which are minimum soil disturbance, permanent soil
over (at least 30% cover) and mix cropping. The aim of this experiment was to see whether CA
conserves soil moisture and increases water productivity compared to conventional tillage.
We worked with farmers for the installation of runoff plots in all three sites.
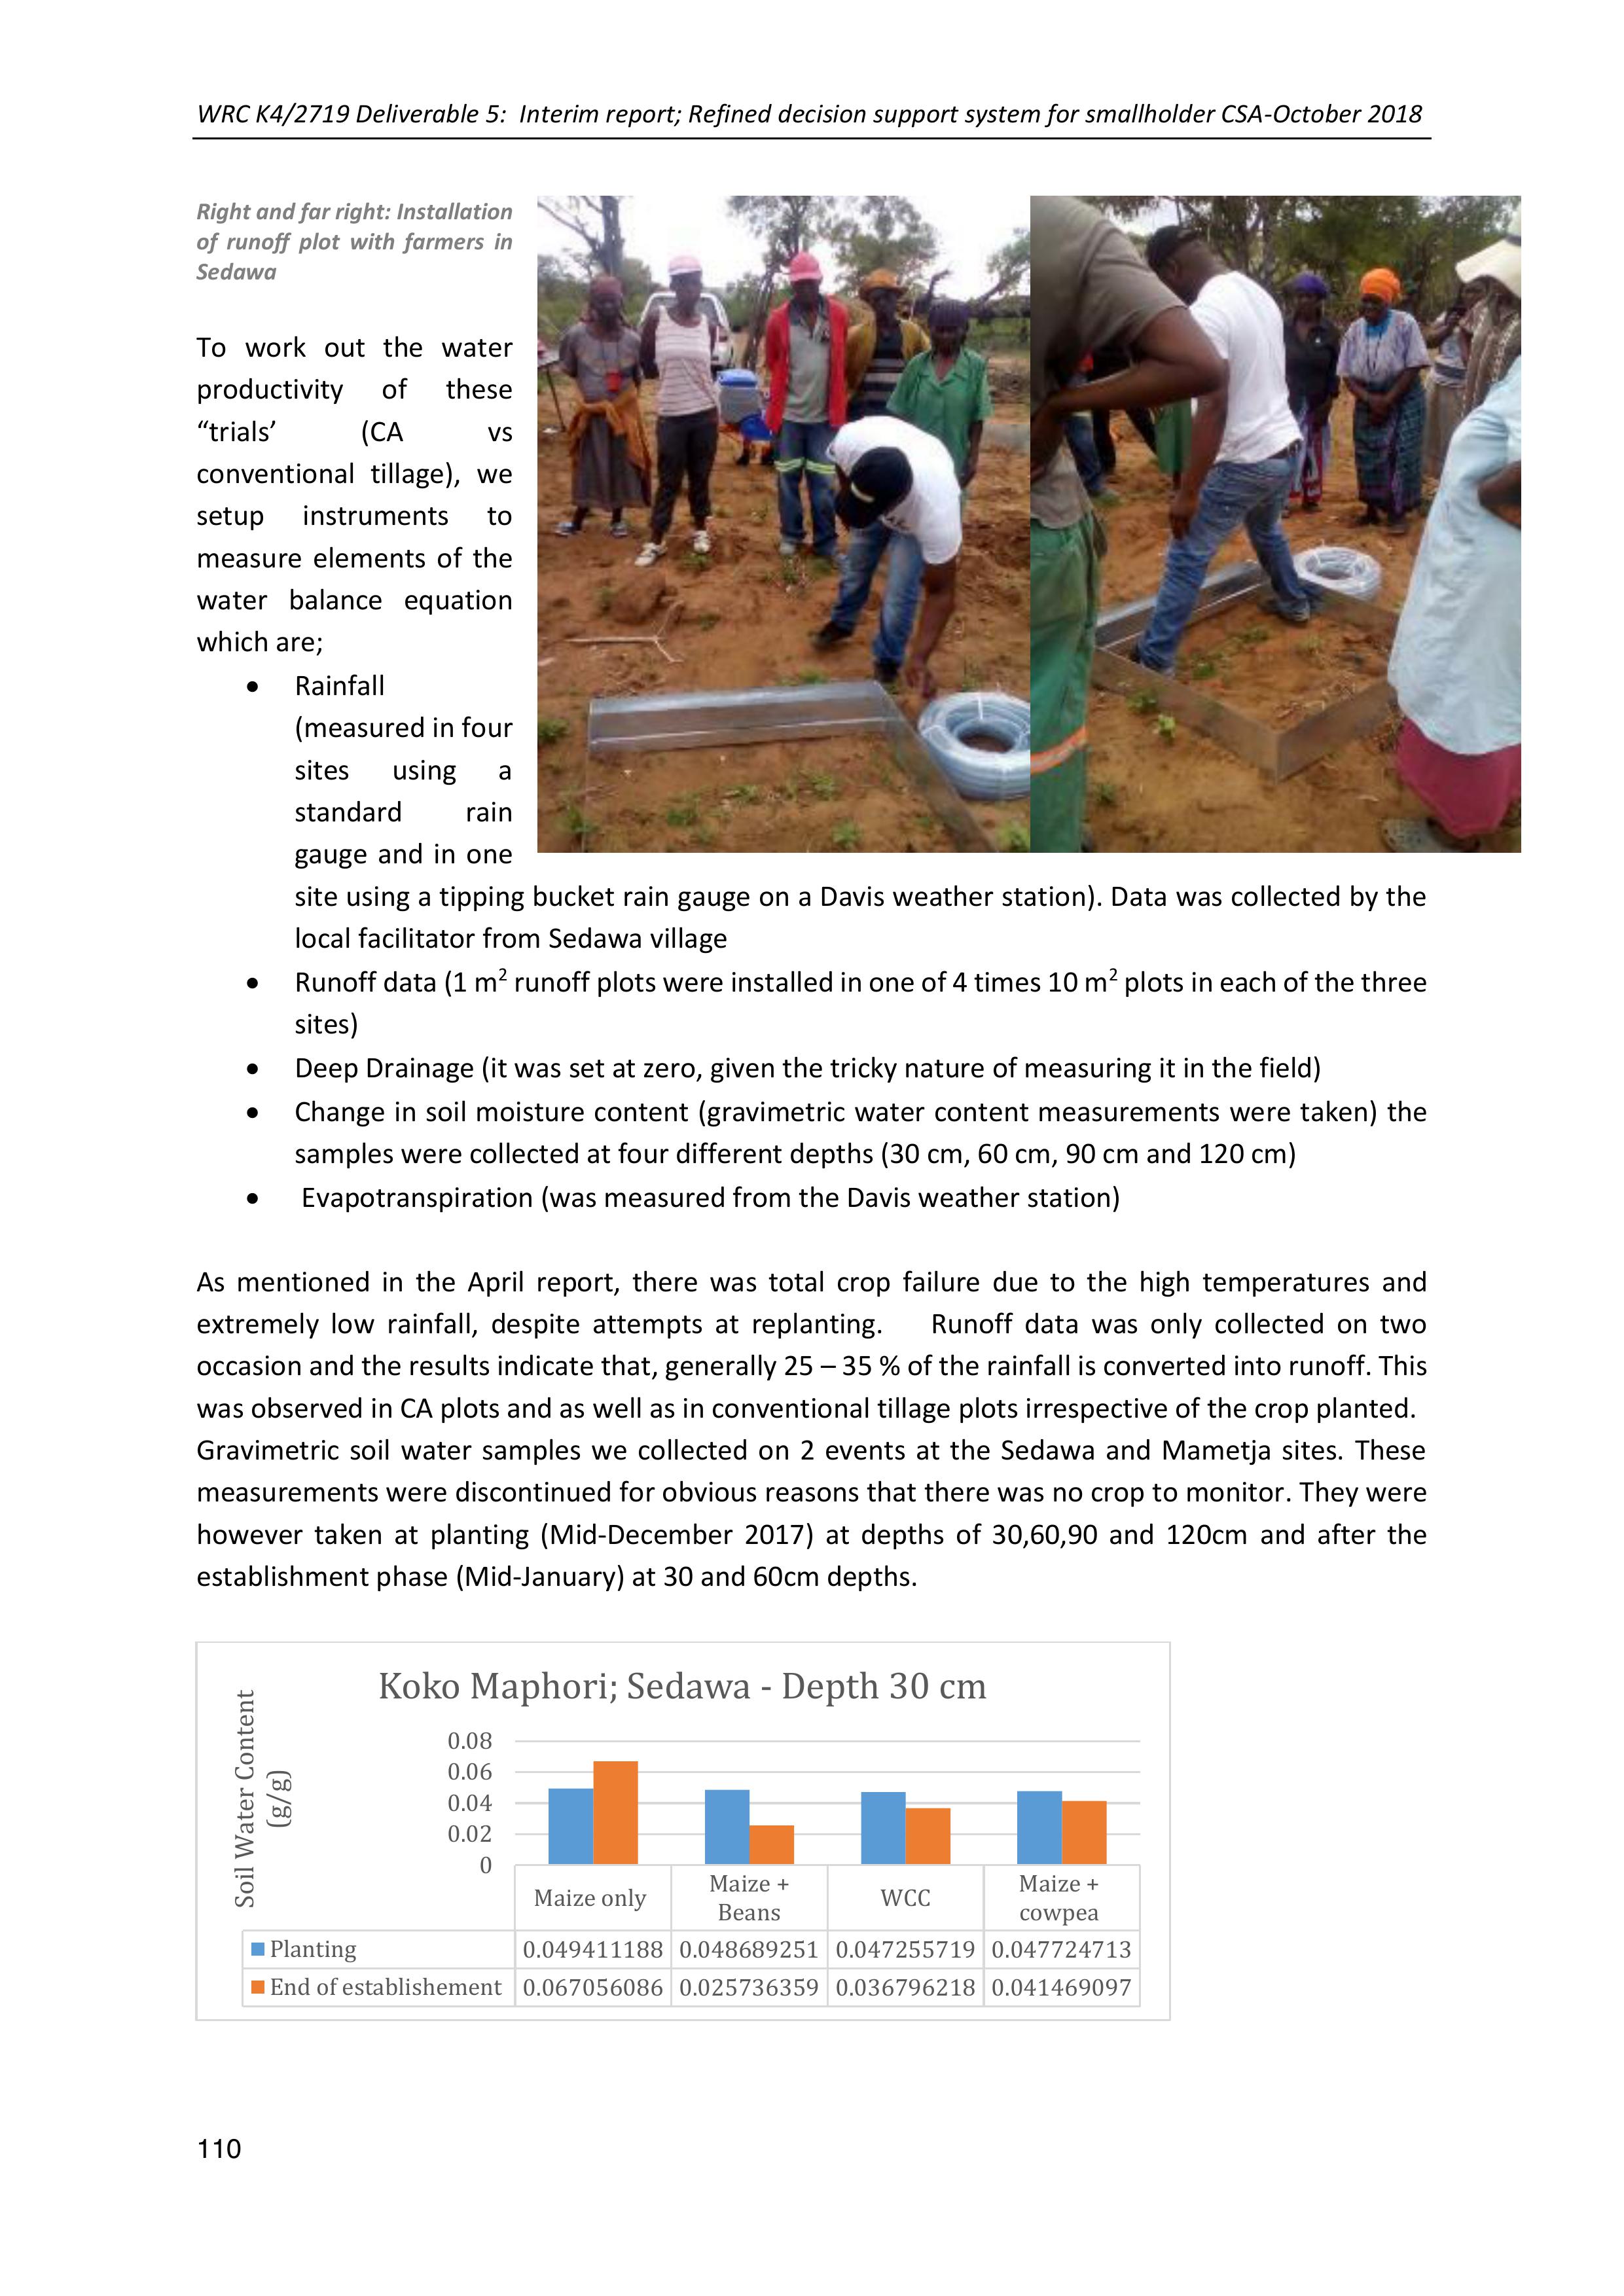
WRC K4/2719 Deliverable 5: Interim report; Refined decision support system for smallholder CSA-October 2018
110
Right and far right: Installation
of runoff plot with farmers in
Sedawa
To work out the water
productivity of these
“trials’ (CA vs
conventional tillage), we
setup instruments to
measure elements of the
water balance equation
which are;
•Rainfall
(measured in four
sites using a
standard rain
gauge and in one
site using a tipping bucket rain gauge on a Davis weather station). Data was collected by the
local facilitator from Sedawa village
•Runoff data (1 m2runoff plots were installed in one of 4 times 10 m2 plots in each of the three
sites)
•Deep Drainage (it was set at zero, given the tricky nature of measuring it in the field)
•Change in soil moisturecontent (gravimetric water content measurements were taken) the
samples were collected at four different depths (30 cm, 60 cm, 90 cm and 120 cm)
• Evapotranspiration (was measured from the Davis weather station)
As mentioned in the April report,there was total crop failure due to the high temperatures and
extremely low rainfall, despite attempts at replanting.Runoff data was only collected on two
occasion and the results indicate that, generally 25 –35 % of the rainfall is converted into runoff. This
was observed in CA plots and as well as in conventional tillage plots irrespective of the crop planted.
Gravimetric soil water samples we collected on 2 eventsat the Sedawa and Mametja sites. These
measurements were discontinued for obvious reasons that there was no crop to monitor. They were
however taken at planting (Mid-December 2017) at depths of 30,60,90 and 120cmand after the
establishment phase (Mid-January) at 30 and 60cm depths.
Maize onlyMaize +
Beans WCC Maize +
cowpea
Planting 0.049411188 0.048689251 0.047255719 0.047724713
End of establishement0.067056086 0.025736359 0.036796218 0.041469097
0
0.02
0.04
0.06
0.08
Soil Water Content
(g/g)
Koko Maphori; Sedawa -Depth 30 cm

WRC K4/2719 Deliverable 5: Interim report; Refined decision support system for smallholder CSA-October 2018
111
Figure 12: The gravimetric soil water content for Koko Maphori’s CA plot in Sedawa at 30,60,90 and 120cm depth
The figures above indicate a rather low soil watercontent at all depths at planting and some minor
variability between the plots in her field. They also indicate the reduction on soil water content
towards the end of the establishment phase. Overall, however it was not possible to measure the
impact of the crops and cropping system on soil water content, given the lack of growth of crops. The
water productivity could not be calculated.
In conclusion, some CSA practices cannot work or be tested under certain conditions; there are
thresholds in terms of rainfall amounts anddistribution. It was clear that with less than 200 mm of
rain throughout the season, CA plots would not have survived without supplementary irrigation.
Gardening systems
To recap, the farmer led experiment for gardening involves planting spinach;
In a trench bed inside a tunnel (shade house structure)
In a trench bed outside the tunnel
Maize onlyMaize +
Beans WCC Maize +
cowpea
Planting 0.045495803 0.0557771220.055395090.070811535
End of establishement0.053632090.037808596 0.047061665 0.057859268
0
0.02
0.04
0.06
0.08
Soil Wateer Content
(g/g)
Koko Maphori; Sedawa-Depth 60 cm
Maize onlyMaize + BeansWCCMaize +
cowpea
Planting 0.055970893 0.057474490.06246021 0.065230168
0.05
0.055
0.06
0.065
0.07
Soil Water Content
(g/g)
Koko Maphori; Sedawa-Depth 90 cm
Maize onlyMaize + BeansWCCMaize +
cowpea
Planting 0.0433948260.062314540.076109477 0.065230168
0
0.01
0.02
0.03
0.04
0.05
0.06
0.07
0.08
Soil Water Content (g/g)
Koko Maphori; Sedawa-Depth 120 cm

WRC K4/2719 Deliverable 5: Interim report; Refined decision support system for smallholder CSA-October 2018
112
In a traditional bed (ridges and furrows) outside the tunnel
There are a number of aims for this experiment:
1.To help farmers make informed decisions about which CSA practices are best suited to their
locality and conditions
2.To help farmer develop visual indicators for evaluation of CSA options
3.to assess if and to what extent CSA practices contribute to increased productivity and
household income generation and
4.To assess whether traditional practices are still fully functional under varying weather
conditions or in the light of climate change
Water productivity, changes in soil fertility (plant essential nutrients, N, P, K)and soil health are the
main indicators used for assessing CSA practices. Visual observation from the famers have indicated
that some CSA practices, different bed designs (deep trenches, tower garden,eco-circle) increase
productivity compared to traditional practices (gardening on ridges). Use of other technologies, for
example drip irrigation, and tunnels have also been reported to do better than the traditional system
and these observations have been used as the basis for this experimentation process.
We have taken input costs into account andhavealso analysed the CSApractices adopted froma cost-
benefit point of view.
Comparing the farmer method of calculating WP with the “simple” method outlined above
According to the farmers all the water applied inthe garden goes into producing the yield. They
argued that because water applied in garden or field cannot be reused for something else, they
consider all that water as going to production of yield. Therefore, in determiningWP weconsidered
runoff, deep percolation and soil evaporation to be negligible and assumed that water applied
becomes transpired by the crop. Therefore, from Equation 2 above, the water use becomes the water
applied instead water transpired by the crop.
Farmers kept records of various indicators throughout the growing season. The following information
is recorded on the data sheet:
•Amount of water applied (normally farmers use 10 l watering cans to irrigate, therefore the
number watering cans applied are recorded)
•Size of irrigation bay or size of bed (in which the spinach was planted)
•Yield produced from the bed (the average weight of the spinach bundles harvested from the
same bed is recorded, a kitchen scale is used to weight the spinach) and the number of
bundles harvested are also recorded
•Cost of the produce (These bundles of spinach are usually sold for R 10)
Results
The WP calculations were done for the simple scientific and farmer versions of the equation; using
actual evapotranspiration and water applied respectively as the water use value.
The small table below outlines the results for those few farmer- led experiments where enough data
could be collected.
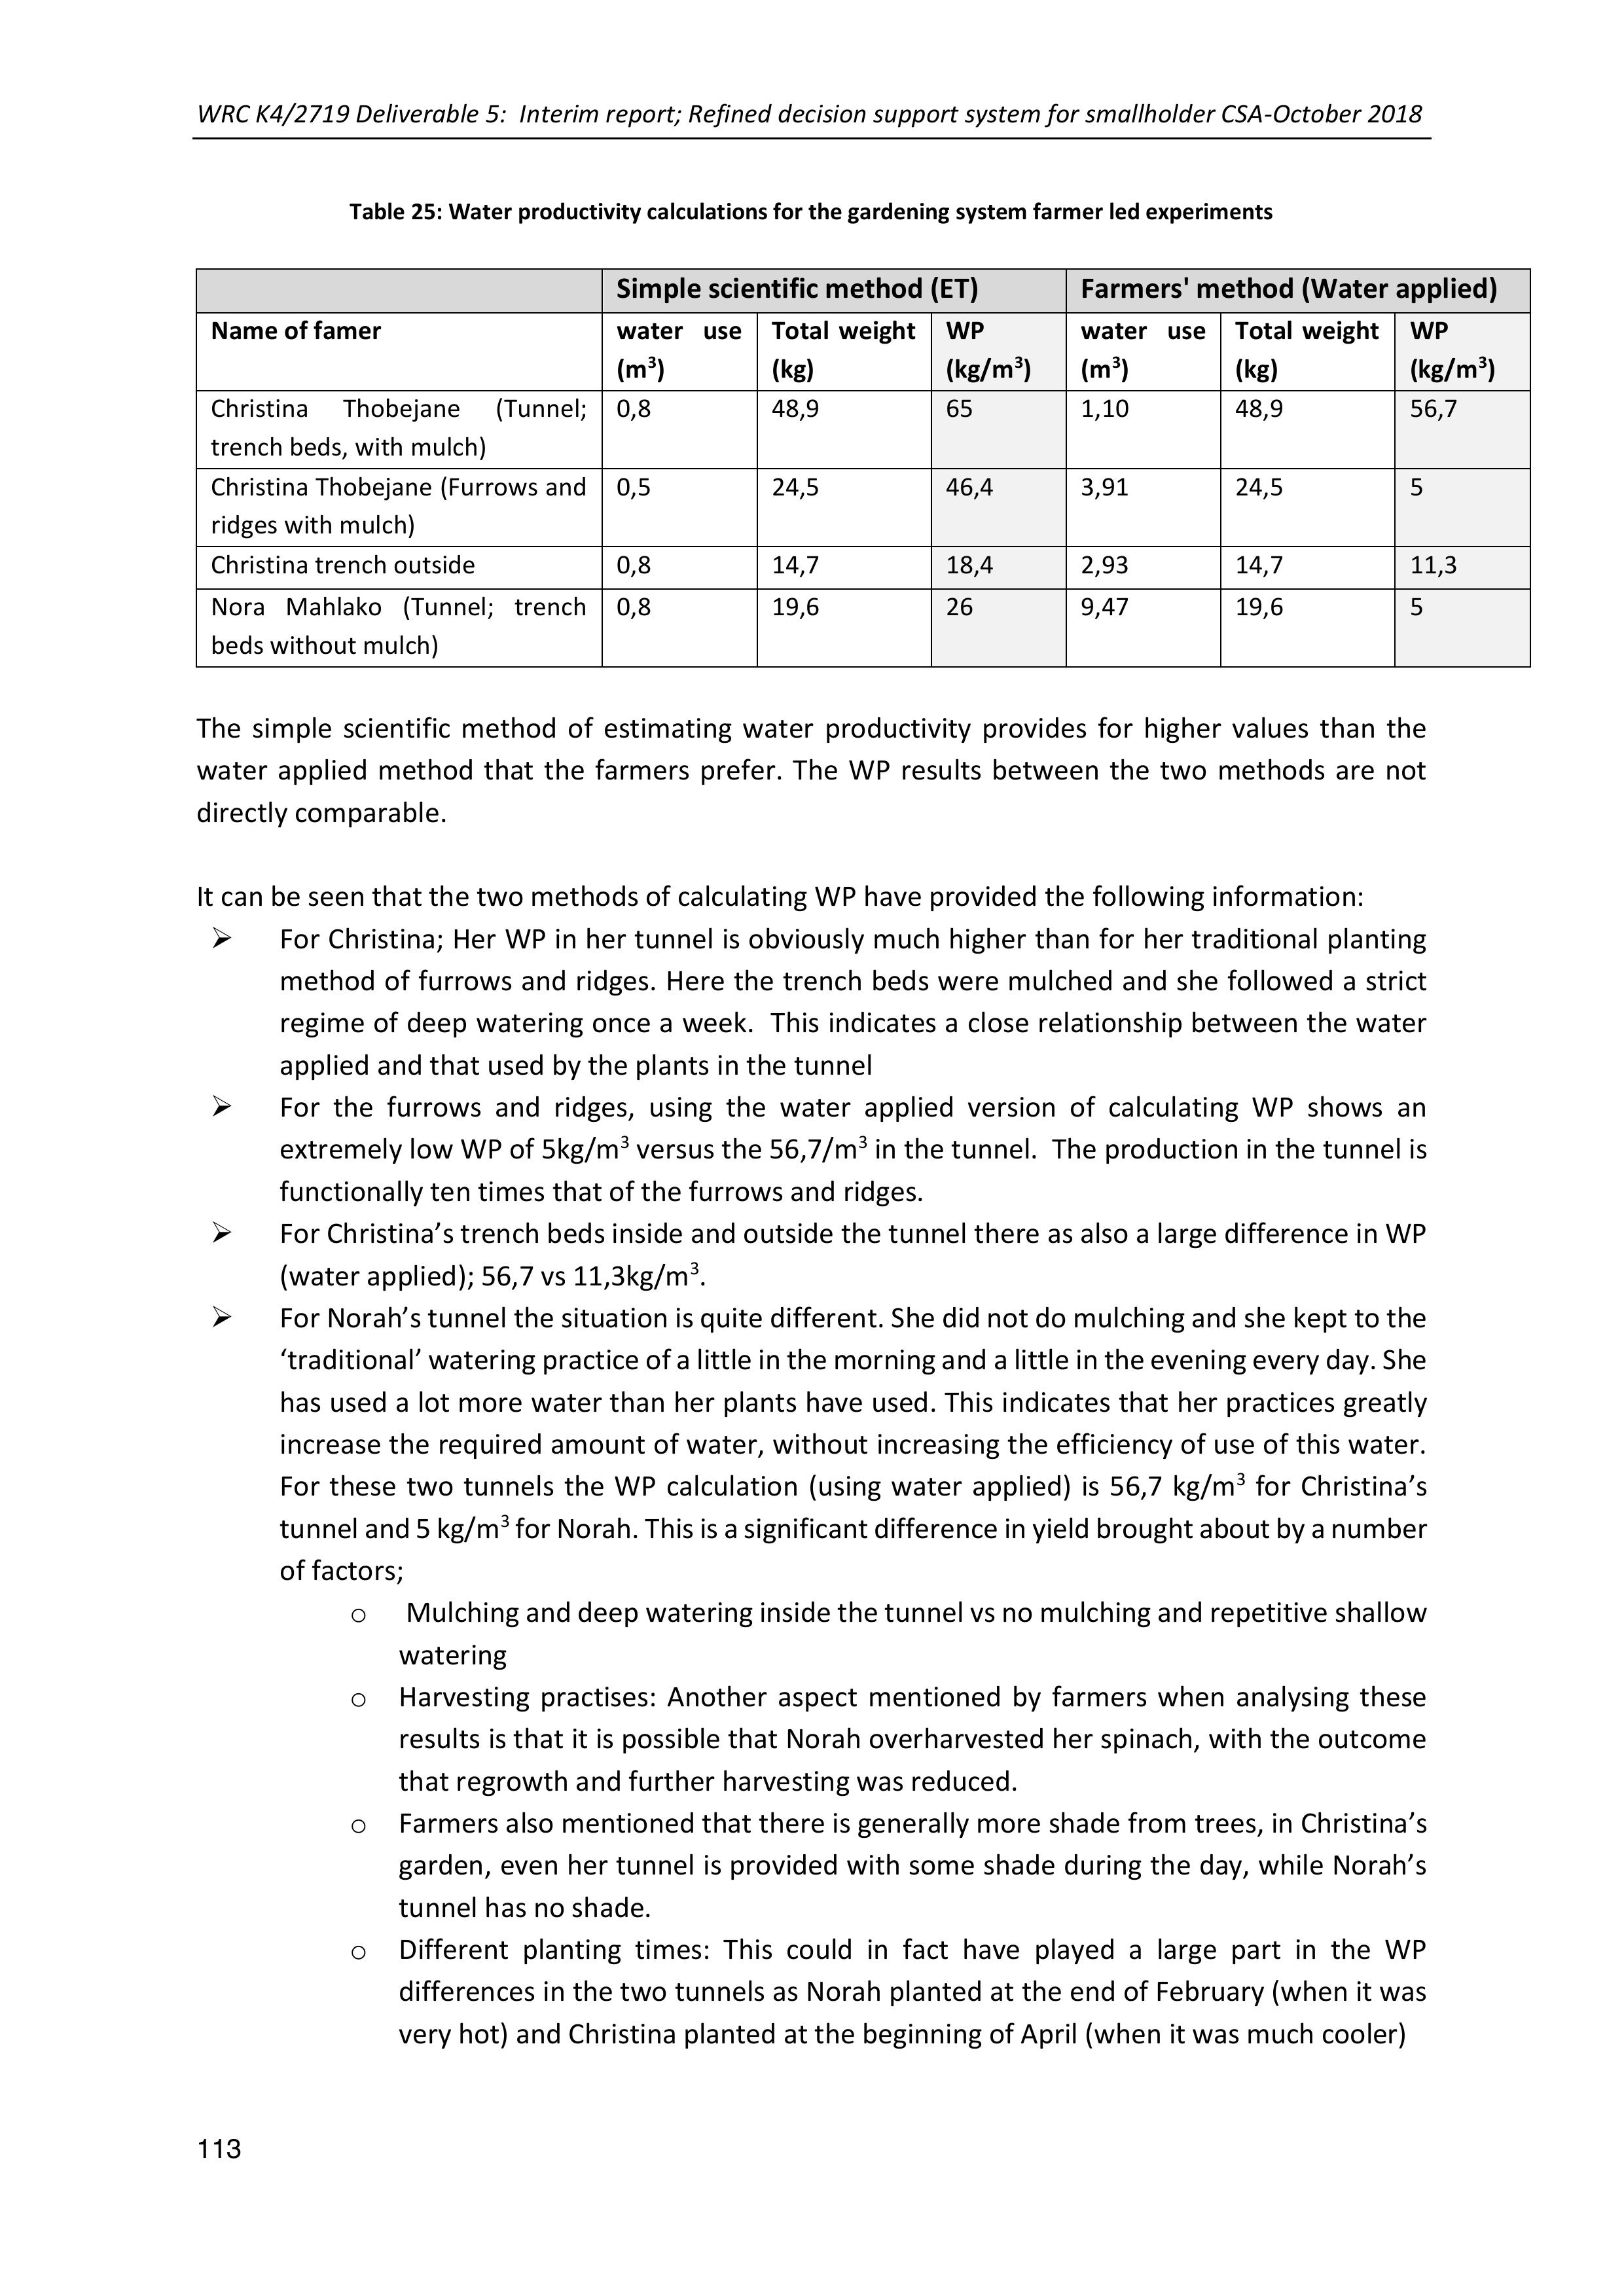
WRC K4/2719 Deliverable 5: Interim report; Refined decision support system for smallholder CSA-October 2018
113
Table 25: Water productivity calculations for the gardening system farmer led experiments
Simple scientific method (ET)
Farmers' method (Water applied)
Name of famer
water use
(m3)
Total weight
(kg)
WP
(kg/m3)
water use
(m3)
Total weight
(kg)
WP
(kg/m3)
Christina Thobejane (Tunnel;
trench beds, with mulch)
0,8
48,9
65
1,10
48,9
56,7
Christina Thobejane (Furrows and
ridges with mulch)
0,5
24,5
46,4
3,91
24,5
5
Christina trench outside
0,8
14,7
18,4
2,93
14,7
11,3
Nora Mahlako (Tunnel; trench
beds without mulch)
0,8
19,6
26
9,47
19,6
5
The simple scientific method of estimating water productivity provides for higher values than the
water applied methodthat the farmers prefer. The WP results between the two methods are not
directly comparable.
It can be seen that the two methods of calculating WP have provided the following information:
➢For Christina; Her WP in her tunnel is obviously much higher than for her traditional planting
method of furrows and ridges. Here the trench beds were mulched and she followed a strict
regime of deep watering once a week. This indicates a close relationship between the water
applied and that used by the plants in the tunnel
➢For the furrows and ridges, using the water applied version of calculating WP shows an
extremely low WP of 5kg/m3 versus the 56,7/m3 in the tunnel. The production in the tunnel is
functionally ten times that of the furrows and ridges.
➢For Christina’s trench beds inside and outside the tunnel there as also a large difference in WP
(water applied); 56,7 vs 11,3kg/m3.
➢For Norah’s tunnel the situation is quite different. She did not do mulching and she kept to the
‘traditional’ watering practice of a little in the morning and a little in the evening every day. She
has used a lot more water than her plants have used. Thisindicates that her practices greatly
increase the required amount of water, without increasingthe efficiency of use of thiswater.
For these two tunnels the WP calculation (using water applied) is 56,7 kg/m3for Christina’s
tunnel and 5 kg/m3for Norah. This is a significant difference inyield brought about by a number
of factors;
o Mulching and deep watering inside the tunnel vs no mulching and repetitive shallow
watering
oHarvesting practises: Another aspect mentioned by farmers when analysing these
results is that it is possible that Norah overharvested her spinach, with the outcome
that regrowth and further harvesting was reduced.
oFarmers also mentioned that there is generally more shade from trees, in Christina’s
garden, even her tunnel isprovided with some shade during the day, while Norah’s
tunnel has no shade.
oDifferent planting times: This could in fact have played a large part in the WP
differences in the two tunnels as Norah planted at the end of February (when it was
very hot) and Christina planted at the beginning of April (when it was much cooler)

WRC K4/2719 Deliverable 5: Interim report; Refined decision support system for smallholder CSA-October 2018
114
These results clearly indicate the productive advantage of using tunnels in these hot, dry conditions
and further show the added yield and water productivity advantages of mulching and deep watering
as crop management practices. Attention will also need to be given to harvesting practices to ensure
maximum growth of the spinach.
It is interesting to compare the farmers version of WP tothat using evapotranspiration. When one
looks at WP in relation to water added, it gives a much clearer picture of how much production is
possible with how much water and how the different practices affect this. In this context it can thus
be considered a good proxy or visual indicator for water productivity. More farmer led experiments
will be conducted comparing these WP indicators.
Generally, it is expected that the WP from the same practices (e,g trench beds in tunnels) should have
less variability, but the results have shown otherwise. In a farmers’ experimentationsetup, some
extra variables are often introduced during the process and are sometimes unavoidable. For results
to be comparable attention needs to be given to those variables.It is a scientifically frustrating
process, but one that provides for ample learning opportunities in such an adaptive research process
such as this.
A cost benefit analysis of WP
In these villages farmers pay fortheir water; either for transport of 210ldrums to theirhomes
(“bought from local people with borehoels0 or for pumping the water from their own boreholes.
Presently municipal supply of water is too little to use for gardening and all surface sources have dried
up in the last few drought years.
Farmer pay R35/201l drum of water
Christina Thobejane planted a 5 m2deep trench in a tunnel to spinach and we recorded the amount
of water applied andweighed each bundle of spinach she sold. She solda totalof 30 bundles of spinach
at R10-00 each and made R300 from this in one season. She applied a total of 1100l of water as
irrigation (100 litres per week for 11 weeks). In a deep trench bed of 3.5 m2 in size outside the tunnel
she planted spinach she applied 266 l/ week of water for 11 weeks which makes a total of 2926 litres
(13.9 * 210 l) at a cost of R35-00 per litre she would have paid R487.7 for water applied. She was able
sell 9 bunches of spinach at R10-00 each making R90-00 for this bed in a season.
Water
Cost (R/m2)
Yield
Sales
(Rands/ m2)
Profit
(R/m2)
Trench inside tunnel
1100
R18,70
6 bundles/m2
R60
R41,30
Trench outside tunnel
2926
R48,80
4,2 bundles/m2
R42
-R6,80
Furrows and ridges
3913
R130,40
2,4 bundles/m2
R24
-R106,40
From a water use efficiency point of view, planting in a trench bed without shading (microclimate
management) requires 2.9 times the amount of water required in a deep trench under shade cloth.
The quantities of spinach produced in the tunnel are much higher than those produced outside the
WRC K4/2719 Deliverable 5: Interim report; Refined decision support system for smallholder CSA-October 2018
115
tunnel. The cost-benefit analysis above indicates, that if waterneeds to be bought, it would only be
profitable to plant inside the tunnel. The profit is however not very high in this context (~R620/tunnel
fully planted (15m2)), for a season. Obviously, if cheaper water can be accessed, this would be a lot
more.
Working with Chameleons
Chameleons measure soil water content, work similarly to tensiometers and provide readings using
colour codes (red, green and blue) for available soil water at three depths in the soil; 20,40 and 60cm.
These sensors have been installed at Christina Thobejane (Sedawa), Mariam Malephe (Botshabelo and
Norah Mahlaku (Mametja), for their gardening experiments. The intention is to provide the farmers
with an irrigation management tool to help them decide when and how much to irrigate. As the
readings are uploaded onto the Virtual Irrigation Academy website, they also providean analytical
tool for the research team, as well as real time data on the status to the farmer level experiments.
Irrigation case study: Christina Thobejane
Christina has a small petrol water pump and used to pump water up from the Maphere River
(approximately50m downhill from her homestead) for her gardeningactivities. That streambed
however dried up completely about a year ago. She also has a 5 000l Jo-Jo tank for roof rainwater
harvesting and last year was the recipient of a 24000l underground RWH tank. In addition, she used
money from her stipend as an LF to have a borehole installed in her yard and she has a pipe linked
into the municipal supply system, for the unlikely moments that there is some municipal water supply.
She now pumps water from her borehole into her underground RWH tank for use in the garden. She
is the only person in her village who is this well organised.
Chameleon sensors were installed in three different beds (trench bed in a tunnel, furrows and ridges
outside the tunnel and a trench bed outside the tunnel) to monitor the changes in soil water content.
The chameleons were introduced as an irrigation scheduling tool, to her save water.
Christina has made the following comments about the chameleons:
➢Applying water until the chameleon changes colour (goes blue) seems to be a good idea as this
saves her some water and means that she only has to irrigate once a week (every 7 days).
➢She has thus now changed her irrigation practice of watering a little every morning and
afternoon, to a deep watering every 5-7 days. Even though this was discussed in the learning
workshops, she was not convinced until she managed to work it out for herself.
➢The chameleon in the tunnel stays blue (indicating enough water in the soil) for longer than in
the other beds.
➢She appreciates the ease of using the chameleons – by just checking the colour.
Right: A chameleon reader showing red for all three soil depths (20,40 and 60cm)
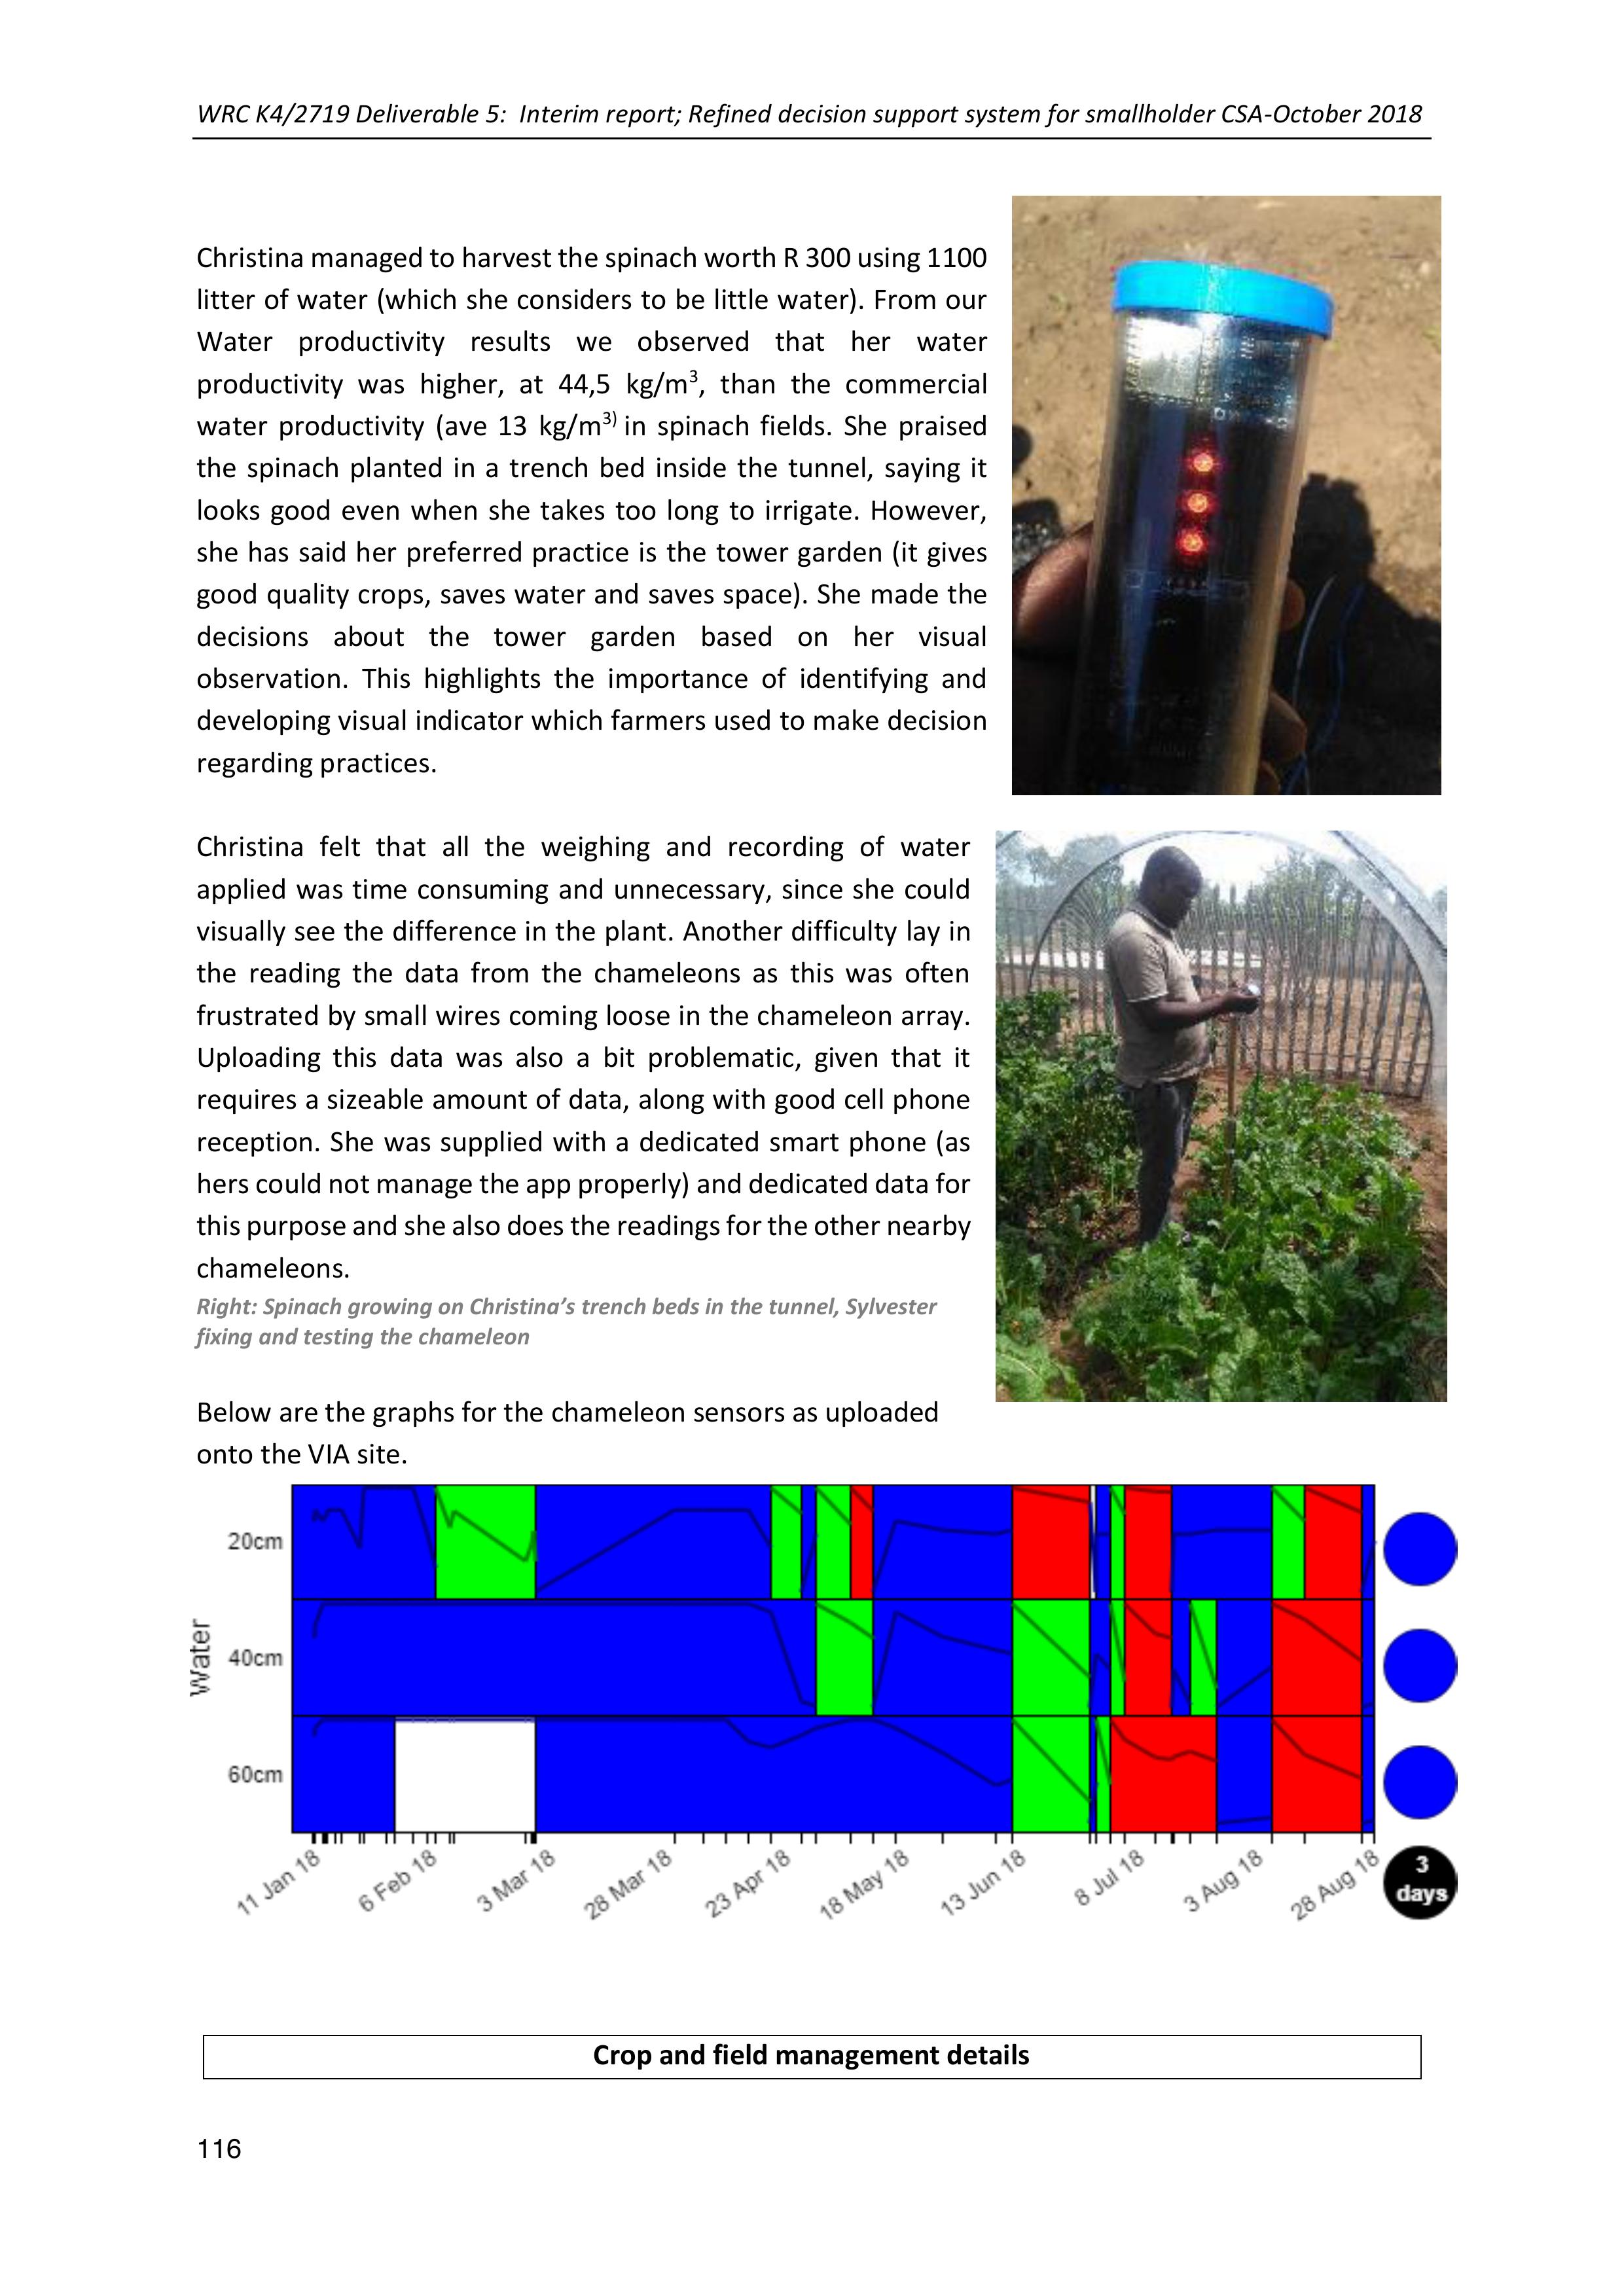
WRC K4/2719 Deliverable 5: Interim report; Refined decision support system for smallholder CSA-October 2018
116
Christina managed to harvest the spinach worth R 300 using 1100
litter of water (which she considers to be little water). From our
Water productivity results we observed that her water
productivity was higher, at 44,5 kg/m3, than the commercial
water productivity (ave 13 kg/m3) in spinach fields.She praised
the spinach planted in a trench bed inside the tunnel, saying it
looks good even when she takes too long to irrigate. However,
she has said her preferredpractice is the tower garden (it gives
good quality crops, saves water and saves space). She made the
decisions about the tower garden based on her visual
observation. This highlights the importance of identifying and
developing visual indicator which farmers used to make decision
regarding practices.
Christina felt that all the weighing and recording of water
applied was time consuming and unnecessary, since she could
visually see the difference in the plant. Another difficulty lay in
the readingthe data from the chameleons as this was often
frustrated by small wires coming loose in thechameleon array.
Uploading this datawas also a bit problematic, given that it
requires a sizeable amount of data, along with good cell phone
reception. She was supplied with a dedicated smart phone (as
hers could not manage the app properly) and dedicated data for
this purpose and she also does the readings for the other nearby
chameleons.
Right: Spinach growing on Christina’s trench beds in the tunnel, Sylvester
fixing and testing the chameleon
Below are the graphs for the chameleon sensors as uploaded
onto the VIA site.
Crop and field management details
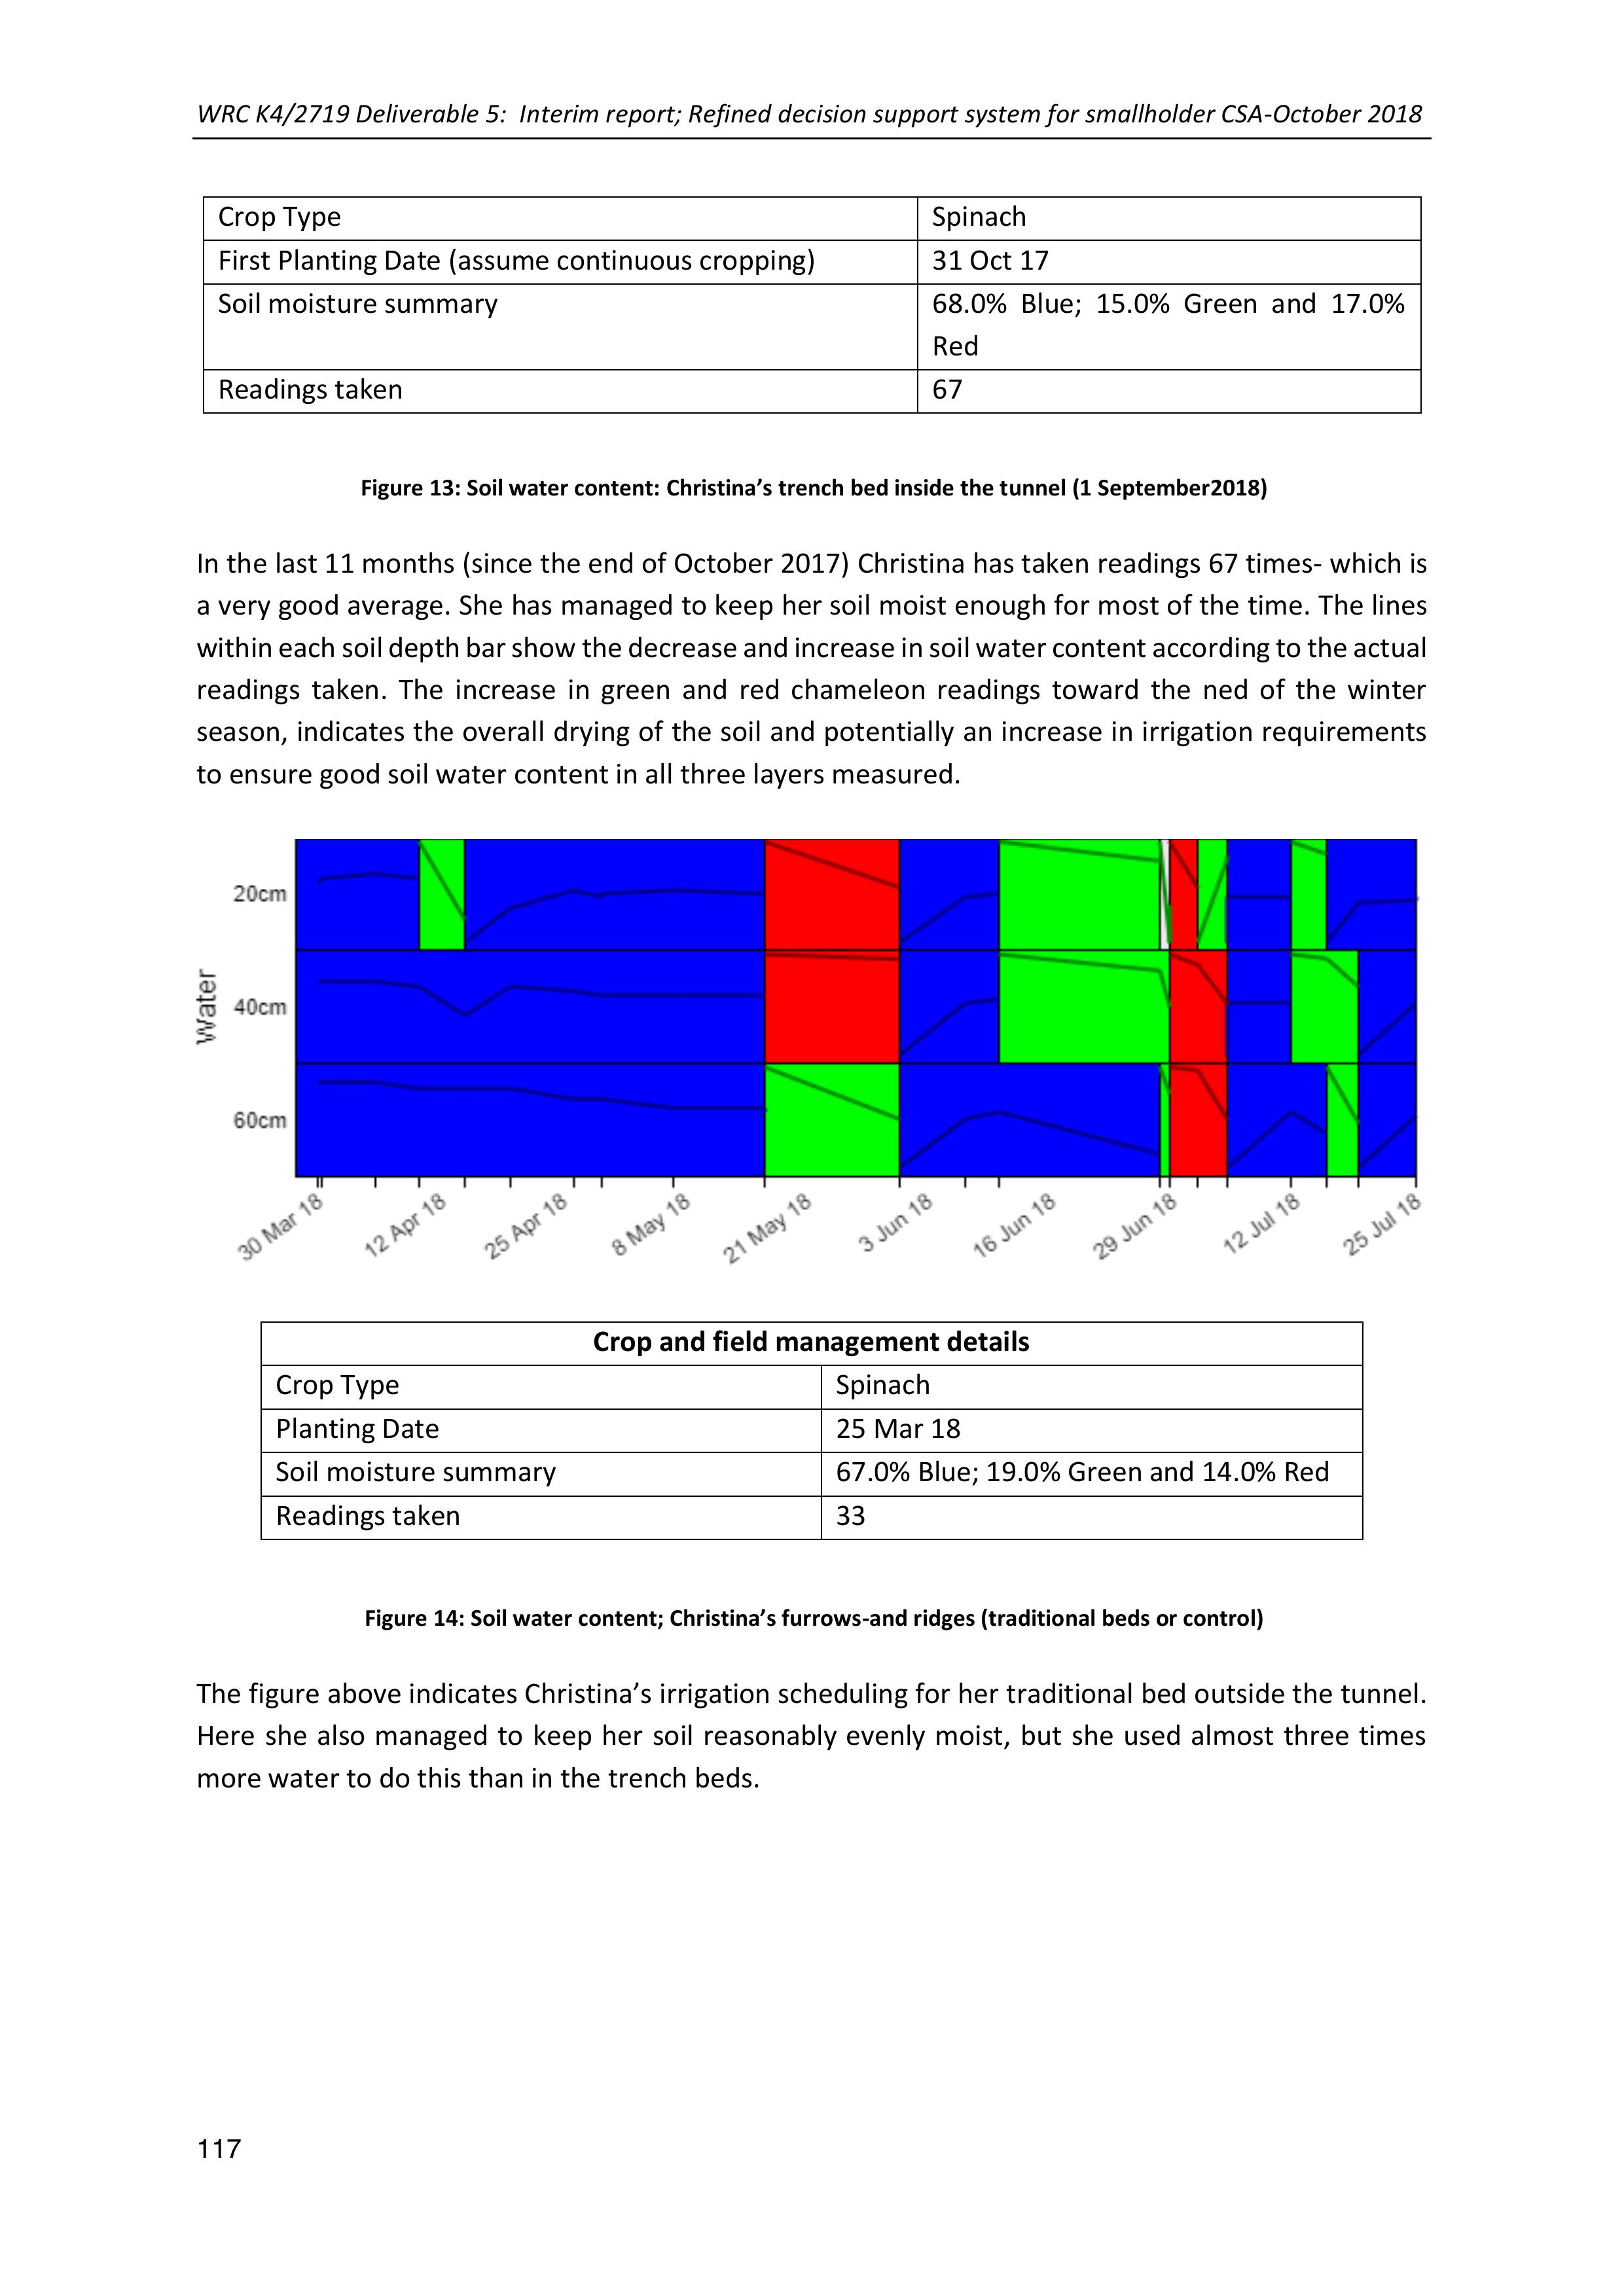
WRC K4/2719 Deliverable 5: Interim report; Refined decision support system for smallholder CSA-October 2018
117
Figure 13: Soil water content: Christina’s trench bed inside the tunnel (1 September2018)
In the last 11 months (since the end of October 2017) Christina has taken readings 67 times- which is
a very good average. She has managed to keep her soil moist enough for most of the time. The lines
within each soil depth bar show the decrease and increase in soil water content according tothe actual
readings taken. The increase in green and redchameleon readingstoward thened of thewinter
season, indicates the overall drying of the soil and potentially an increase in irrigation requirements
to ensure good soil water content in all three layers measured.
Figure 14: Soil water content; Christina’s furrows-and ridges (traditional beds or control)
The figure above indicates Christina’s irrigation scheduling for her traditional bed outside the tunnel.
Here she also managed tokeep her soil reasonably evenly moist, but she usedalmost three times
more water to do this than in the trench beds.
Crop Type
Spinach
First Planting Date (assume continuous cropping)
31 Oct 17
Soil moisture summary
68.0% Blue; 15.0% Green and 17.0%
Red
Readings taken
67
Crop and field management details
Crop Type
Spinach
Planting Date
25 Mar 18
Soil moisture summary
67.0% Blue; 19.0% Green and 14.0% Red
Readings taken
33

WRC K4/2719 Deliverable 5: Interim report; Refined decision support system for smallholder CSA-October 2018
118
Figure 15: Soil water content: Christina’s trench bed outside the tunnel
If one compares Figure 11 and Figure 12, it can be seen that the trench bed outside the tunnel dried
out faster than the trench bed inside the tunnel, needing more and more frequent irrigation.
Irrigation Case study: Nora Mahlako
Even though these farmerslive in the same area, their water situations are different. Nora Mahlako
relies on municipal water supply for household uses as well asgardening. This water supplyscheme
serves a lot of people and is overloaded to make provisions for other activities (e.g. farming) on top of
water for household consumption. In the time that Nora had planted the municipal water was cut for
several weeks and she did not have water for irrigation. She then prioritized the spinachin the tunnel
and abandoned the crops growing in the other beds.From the chameleon records below, we observed
that the soil water content in trench beds and ridges and furrows outside the tunnel was very low.
Nora sees the chameleons as acomplicatedtool which requires a lot of technical skills from an expert.
This was partly because her soil was toodry for the chameleons to detected anything most of the
time. Often, we had to go and troubleshoot theproblem with her, andthisin some ways has made
her lose confidence in the tool.
Regarding irrigation, she continued with business as usual (watering small amounts in the mornings
and afternoons). We observed for the graphs obtained from the Virtual Irrigation Academy (VIA)
website that chameleons did not change colour even when she was irrigating.
Crop and field management details
Crop Type
Spinach
Planting Date
31 Oct 2017
Soil moisture summary
54.0% Blue; 15.0% Green and 31.0% Red
Readings taken
63
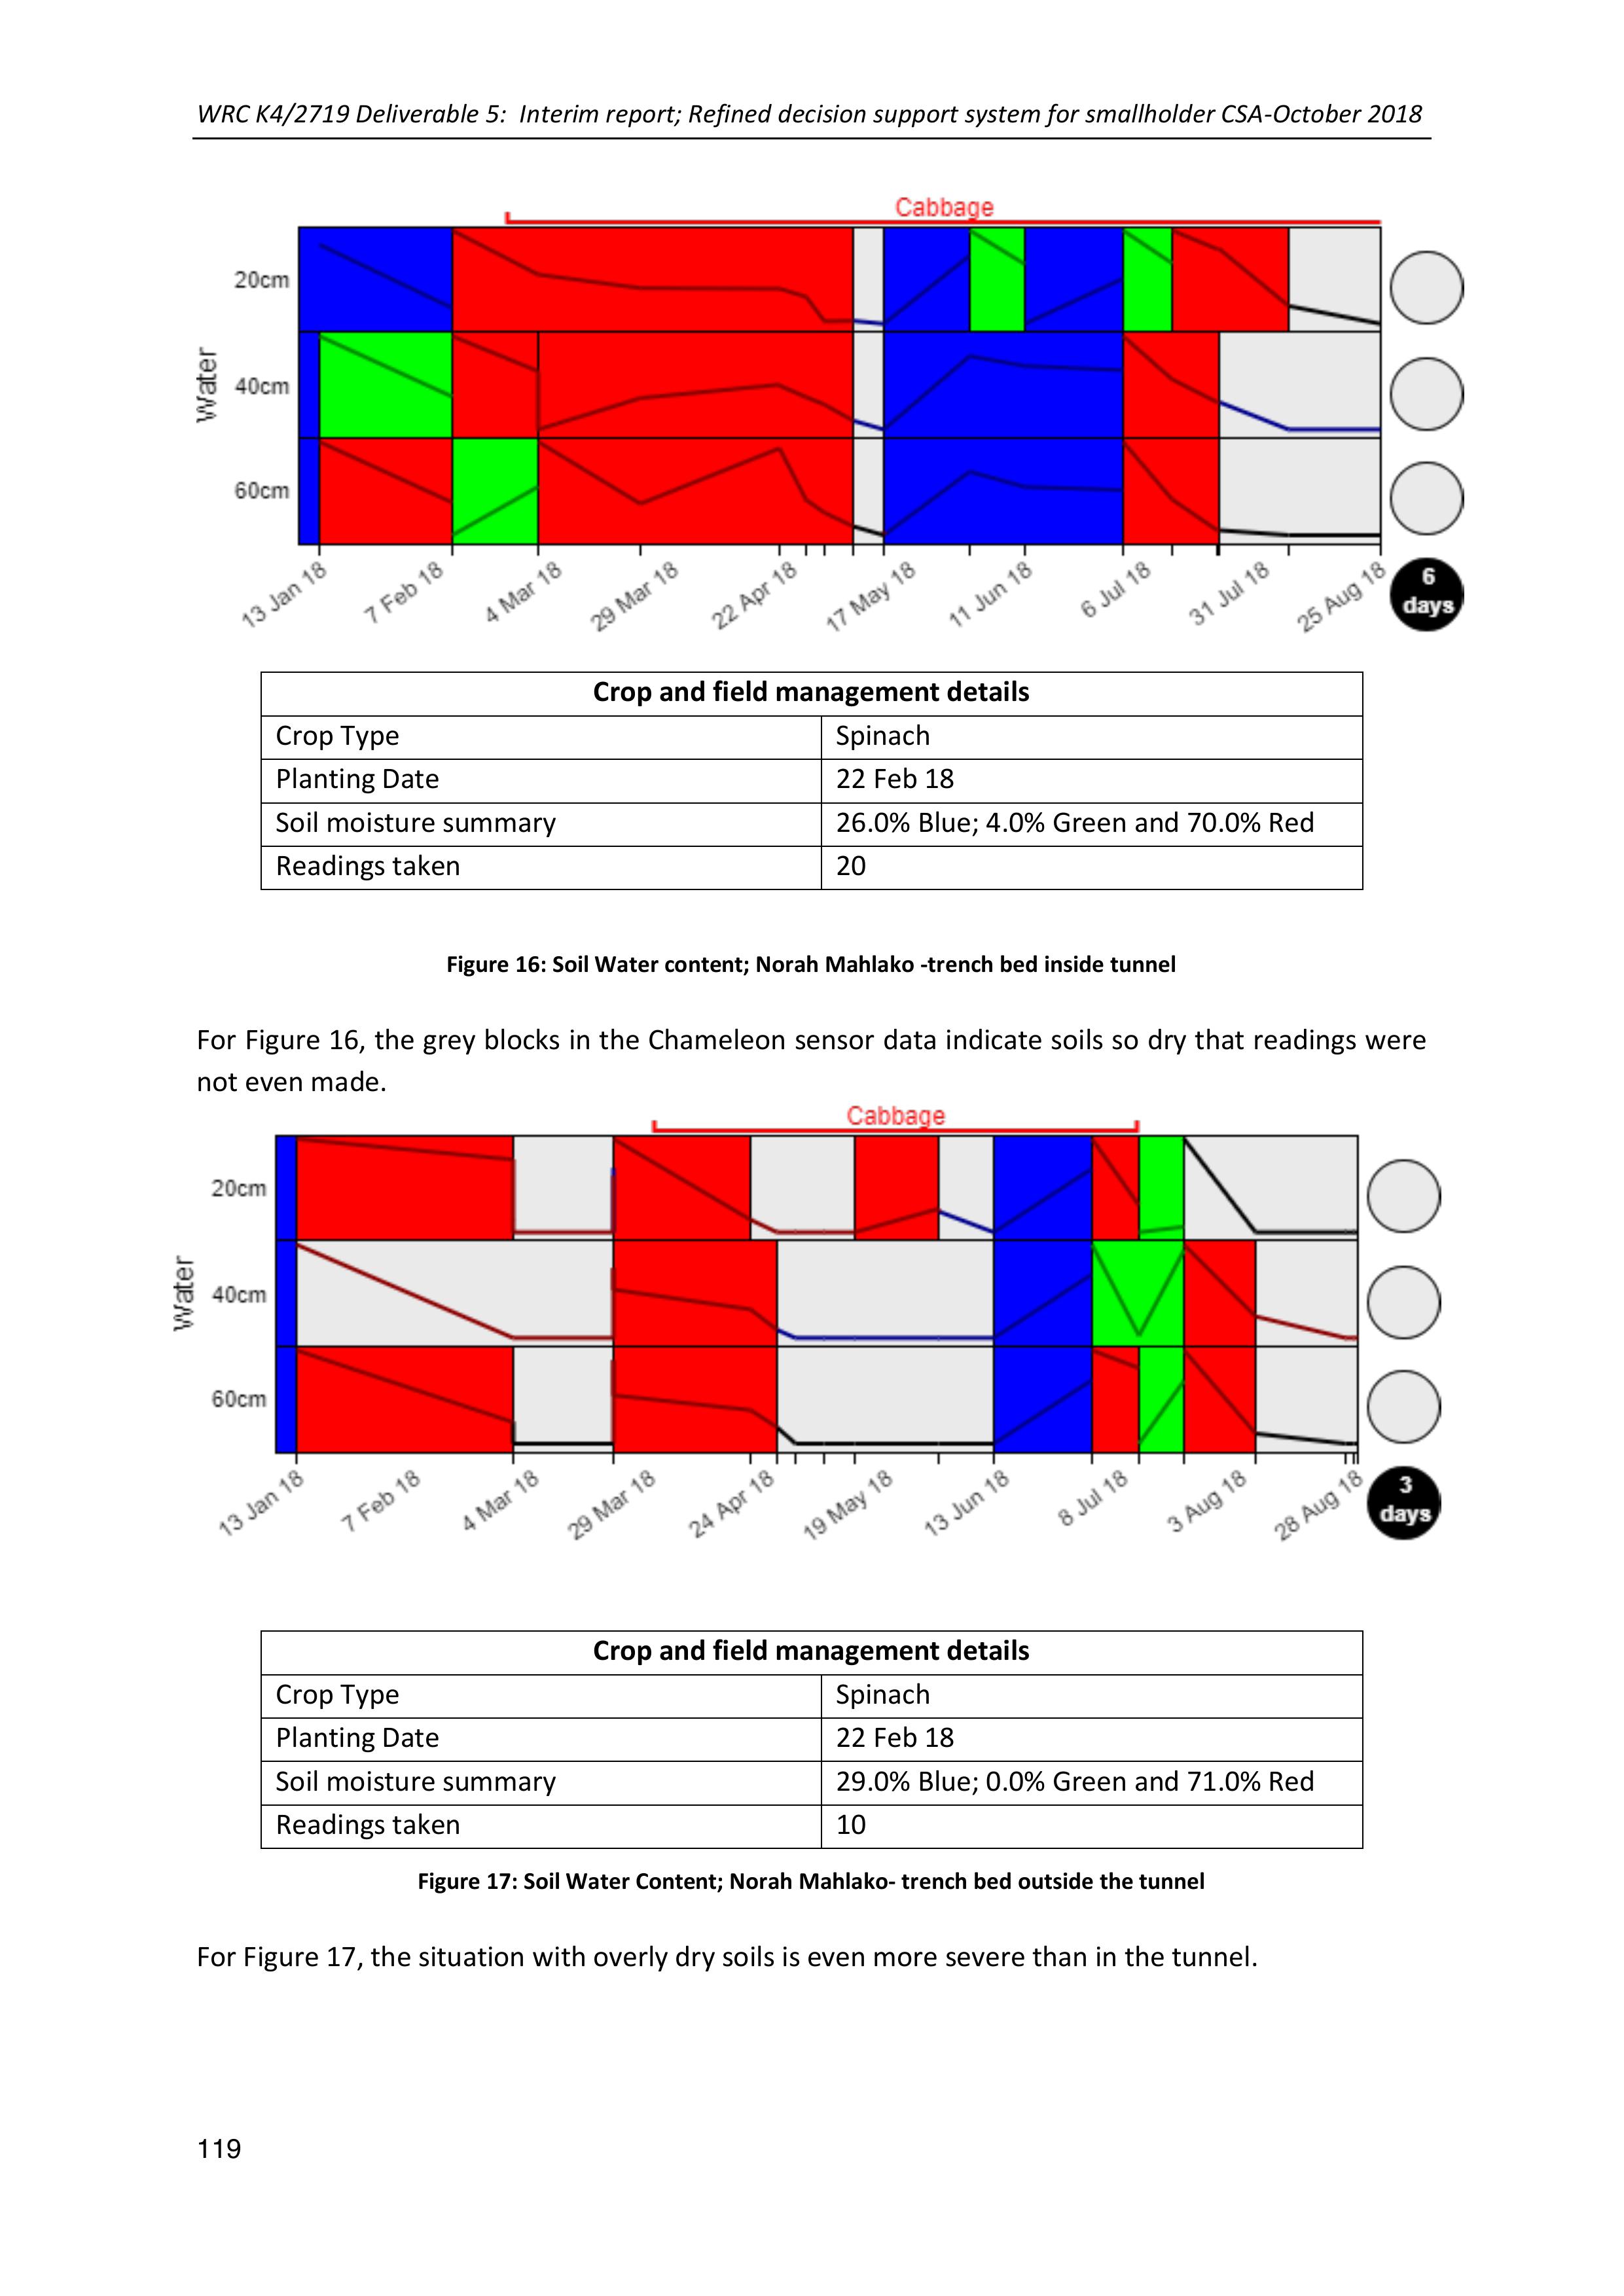
WRC K4/2719 Deliverable 5: Interim report; Refined decision support system for smallholder CSA-October 2018
119
Figure 16: Soil Water content; Norah Mahlako -trench bed inside tunnel
For Figure 16, the grey blocks inthe Chameleon sensor data indicate soils so dry that readings were
not even made.
Figure 17: Soil Water Content; Norah Mahlako- trench bed outside the tunnel
For Figure 17, the situation with overly dry soils is even more severe than in the tunnel.
Crop and field management details
Crop Type
Spinach
Planting Date
22 Feb 18
Soil moisture summary
26.0% Blue; 4.0% Green and 70.0% Red
Readings taken
20
Crop and field management details
Crop Type
Spinach
Planting Date
22 Feb 18
Soil moisture summary
29.0% Blue; 0.0% Green and 71.0% Red
Readings taken
10

WRC K4/2719 Deliverable 5: Interim report; Refined decision support system for smallholder CSA-October 2018
120
Irrigation case study: Mariam Malepe of Botshabelo village
Mariam has a Jo-Jo tank in her homestead for roof rainwater harvesting and was also a recipient of an
underground RWH tanks. She used to have a pipe trailing down from the hillside (around 3-4km away)
from a spring, but this dried up more than a year ago. She also has municipal water supply when that
is available. At the moment they fetch water in containers from the Olifant’s river, which is about 500
m along the road.
Mariam Malepe tried plantingspinach in late February in her experimental beds, but due to lack of
water the spinach died. She then planted beans (lazy house wife) in late March, from which she has
also not managed to glean any harvests. We thus could not do the WP calculations for this participant.
At the in late June she the planted spinach again in the experimental beds which is growing well and
she is hoping to get some yield.
Her decision about when to irrigate is based on crops showing signs of wilting, as she feels it takes too
much water to change the chameleon readings from red to green (not even blue). She prefers to give
a little bit of water to all her crops. It means that she has not managed tobenefit much from having
the chameleons in her plots, as she would not follow the suggested irrigation practices. It canhowever
be understood, as all the water required at the time had to be carried in buckets.
The effect of growing in the tunnel is clearlydemonstrated in her garden where the growth rate for
the beans in the tunnel was higher than in other beds, given though she applied roughly the same
amount of water to each bed.
Mariam’s situation demonstrates that even though observation, monitoring and experimentation
tools might have the potential ofimproving the situation, conditions can be too extremeto abide by
recommendations.
Above Left to right: Mariam’s beans planted in a trench bed inside the tunnel, a mulched trench bed outside the tunnel
and in furrows and ridges outside the tunnel. Photos were taken on the same day and the difference in growth is visible
and obvious

WRC K4/2719 Deliverable 5: Interim report; Refined decision support system for smallholder CSA-October 2018
121
.
Figure 18: Soil water content; Mariam Malephe-trench bed inside the tunnel
From Figure 18, Mariam’s decision toirrigate only until the chameleon turns green is quite obvious.
One can also see that she was not as fastidious about taking readings as Christina for example, as she
only took 11 readings during a 9- month period.
Figure 19: Soil Water Content: Mariam Malephe- trench bed outside the tunnel
Crop and field management details
Crop Type
Beans and later spinach
Planting Date
8 Mar 18
Soil moisture summary
2.0% Blue; 50.0% Green and 48.0% Red
Readings taken
11
Crop and field management details
Crop Type
Beans and later spinach
Planting Date
8 Mar 18
Soil moisture summary
20.0% Blue; 16.0% Green and 64.0% Red
Readings taken
11

WRC K4/2719 Deliverable 5: Interim report; Refined decision support system for smallholder CSA-October 2018
122
For her trench bed outside the tunnel, shown in Figure 19, her soil was mostly too dry toeven take
readings. Since July, when her latest batch of spinach was planted,she has triedharder to ensure a
blue reading when she irrigates.
Soil fertility
Soil samples were taken in a few of the villages where the farmer led experimentation is taking place,
to give a baseline for soil fertility status in these areas, against which later samples from the different
CSA practices can be compared.
The results are shown in the table below.
Figure 20: Soil fertility analysis results for four villages in Limpopo.
From the brief summary above it can be seen that the soils have extremely low percentages of organic
carbon and are generally sandy-clay soils. This information will need to be augmented with soil health
information as well (in particular soil aggregates, microbial respiration and organic Nitrogen) to
improve on the potential of soil fertility and soil health to be used as indicators for impact of CSA
practices.
Learning and conclusions
Learnings have included the following observations:
•Each farmer makes his/her own decisions which is different from those of other farmers (e.g.
when to irrigate, how much water to apply and how often). This ten provides for large
variability in the results from the same experiment precludes rigorous scientific analysis in
some cases. Because of this also, a lot more descriptive information is required around the
experiments to understand what the data means as some of the farmers change what they
are doing along the way
•The monitoring for the farmer led experiments is intensive, as one cannot leave them to do
the recording for extended periods of time without going back to check.
•The monitoring process has been changed over this last season from leaving the farmers to
record how they will, todesigning forms for them, to getting the LFs and interns to collect
forms on a more regularbasis and more recently to have the internsand field workers
“interrogate” the forms with the farmers before submitting them; all to ensure more rigour
in the data collection process.
•Just working with three farmers per site has not worked well. In future 5 farmers per site will
be needed to ensure that some comparative data at least is available
•Specific time will need tobe allocated on a monthly basis to ensure the data has been
submitted (1 week/ month for the 25 odd farmer led experiments presently being conducted)
Required
Village name
Clay %
Org. C %
N (kg/ha)
P (kg/ha)
K (kg/ha)
Lime (t/ha)
Willows
22
1.7
80
60
0
0
Sedawa
14
<0.5
80
20
0
0
Oaks
24
0.7
80
20
0
0
Botshabelo
25
<0.5
80
20
0
0
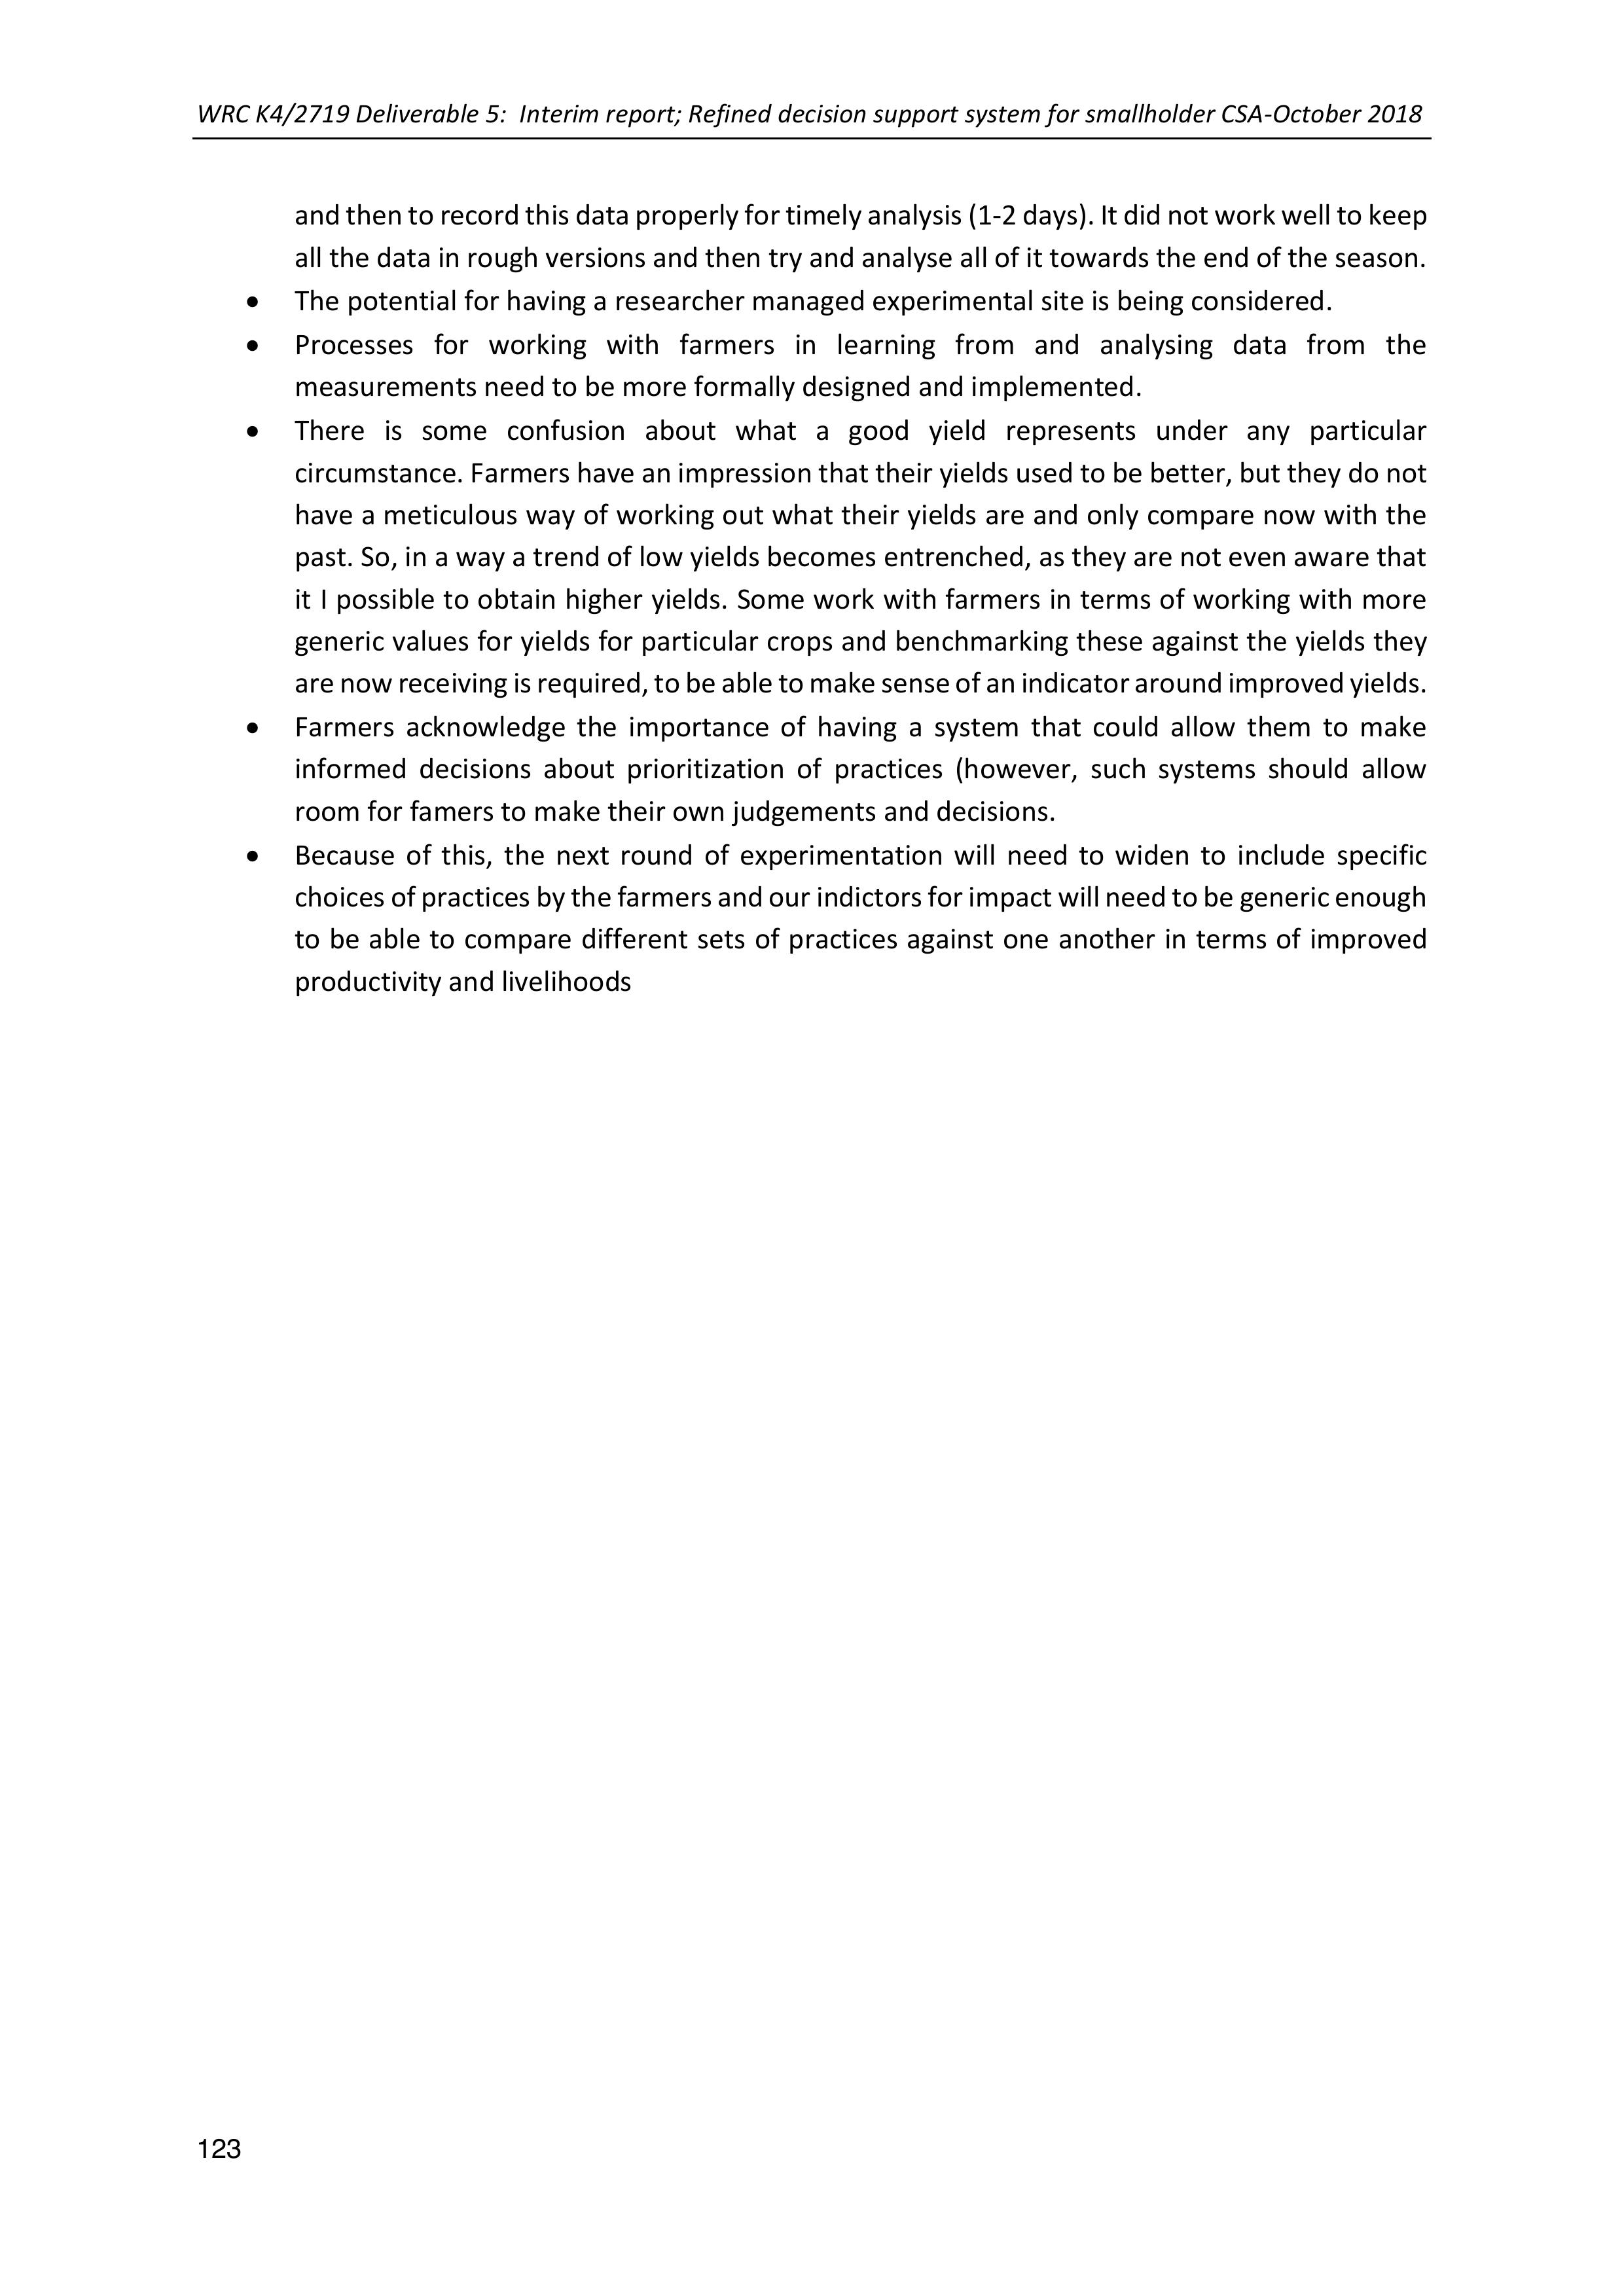
WRC K4/2719 Deliverable 5: Interim report; Refined decision support system for smallholder CSA-October 2018
123
and then to record this data properly for timely analysis (1-2 days). It did not work well to keep
all the data in rough versions and then try and analyse all of it towards the end of the season.
•The potential for having a researcher managed experimental site is being considered.
•Processes for working with farmers in learningfrom and analysingdata from the
measurements need to be more formally designed and implemented.
•There is some confusion about what a good yield represents under any particular
circumstance. Farmers have an impression that their yields used to be better, but they do not
have a meticulous way of working out what their yields areand only comparenow with the
past. So, in a way a trend of low yields becomes entrenched, as they are not even aware that
it I possible to obtain higher yields. Some work with farmers in terms of working with more
generic values for yields for particular crops and benchmarking these against the yields they
are now receiving is required, to be ableto make sense of anindicator around improved yields.
•Farmers acknowledge the importance of having a system that could allow them to make
informed decisionsabout prioritization of practices (however, such systems should allow
room for famers to make their own judgements and decisions.
•Because of this, thenext round of experimentation will need to widen to include specific
choices of practices by thefarmers and our indictors for impact will need to be generic enough
to be able to compare different sets of practices against one another in terms of improved
productivity and livelihoods
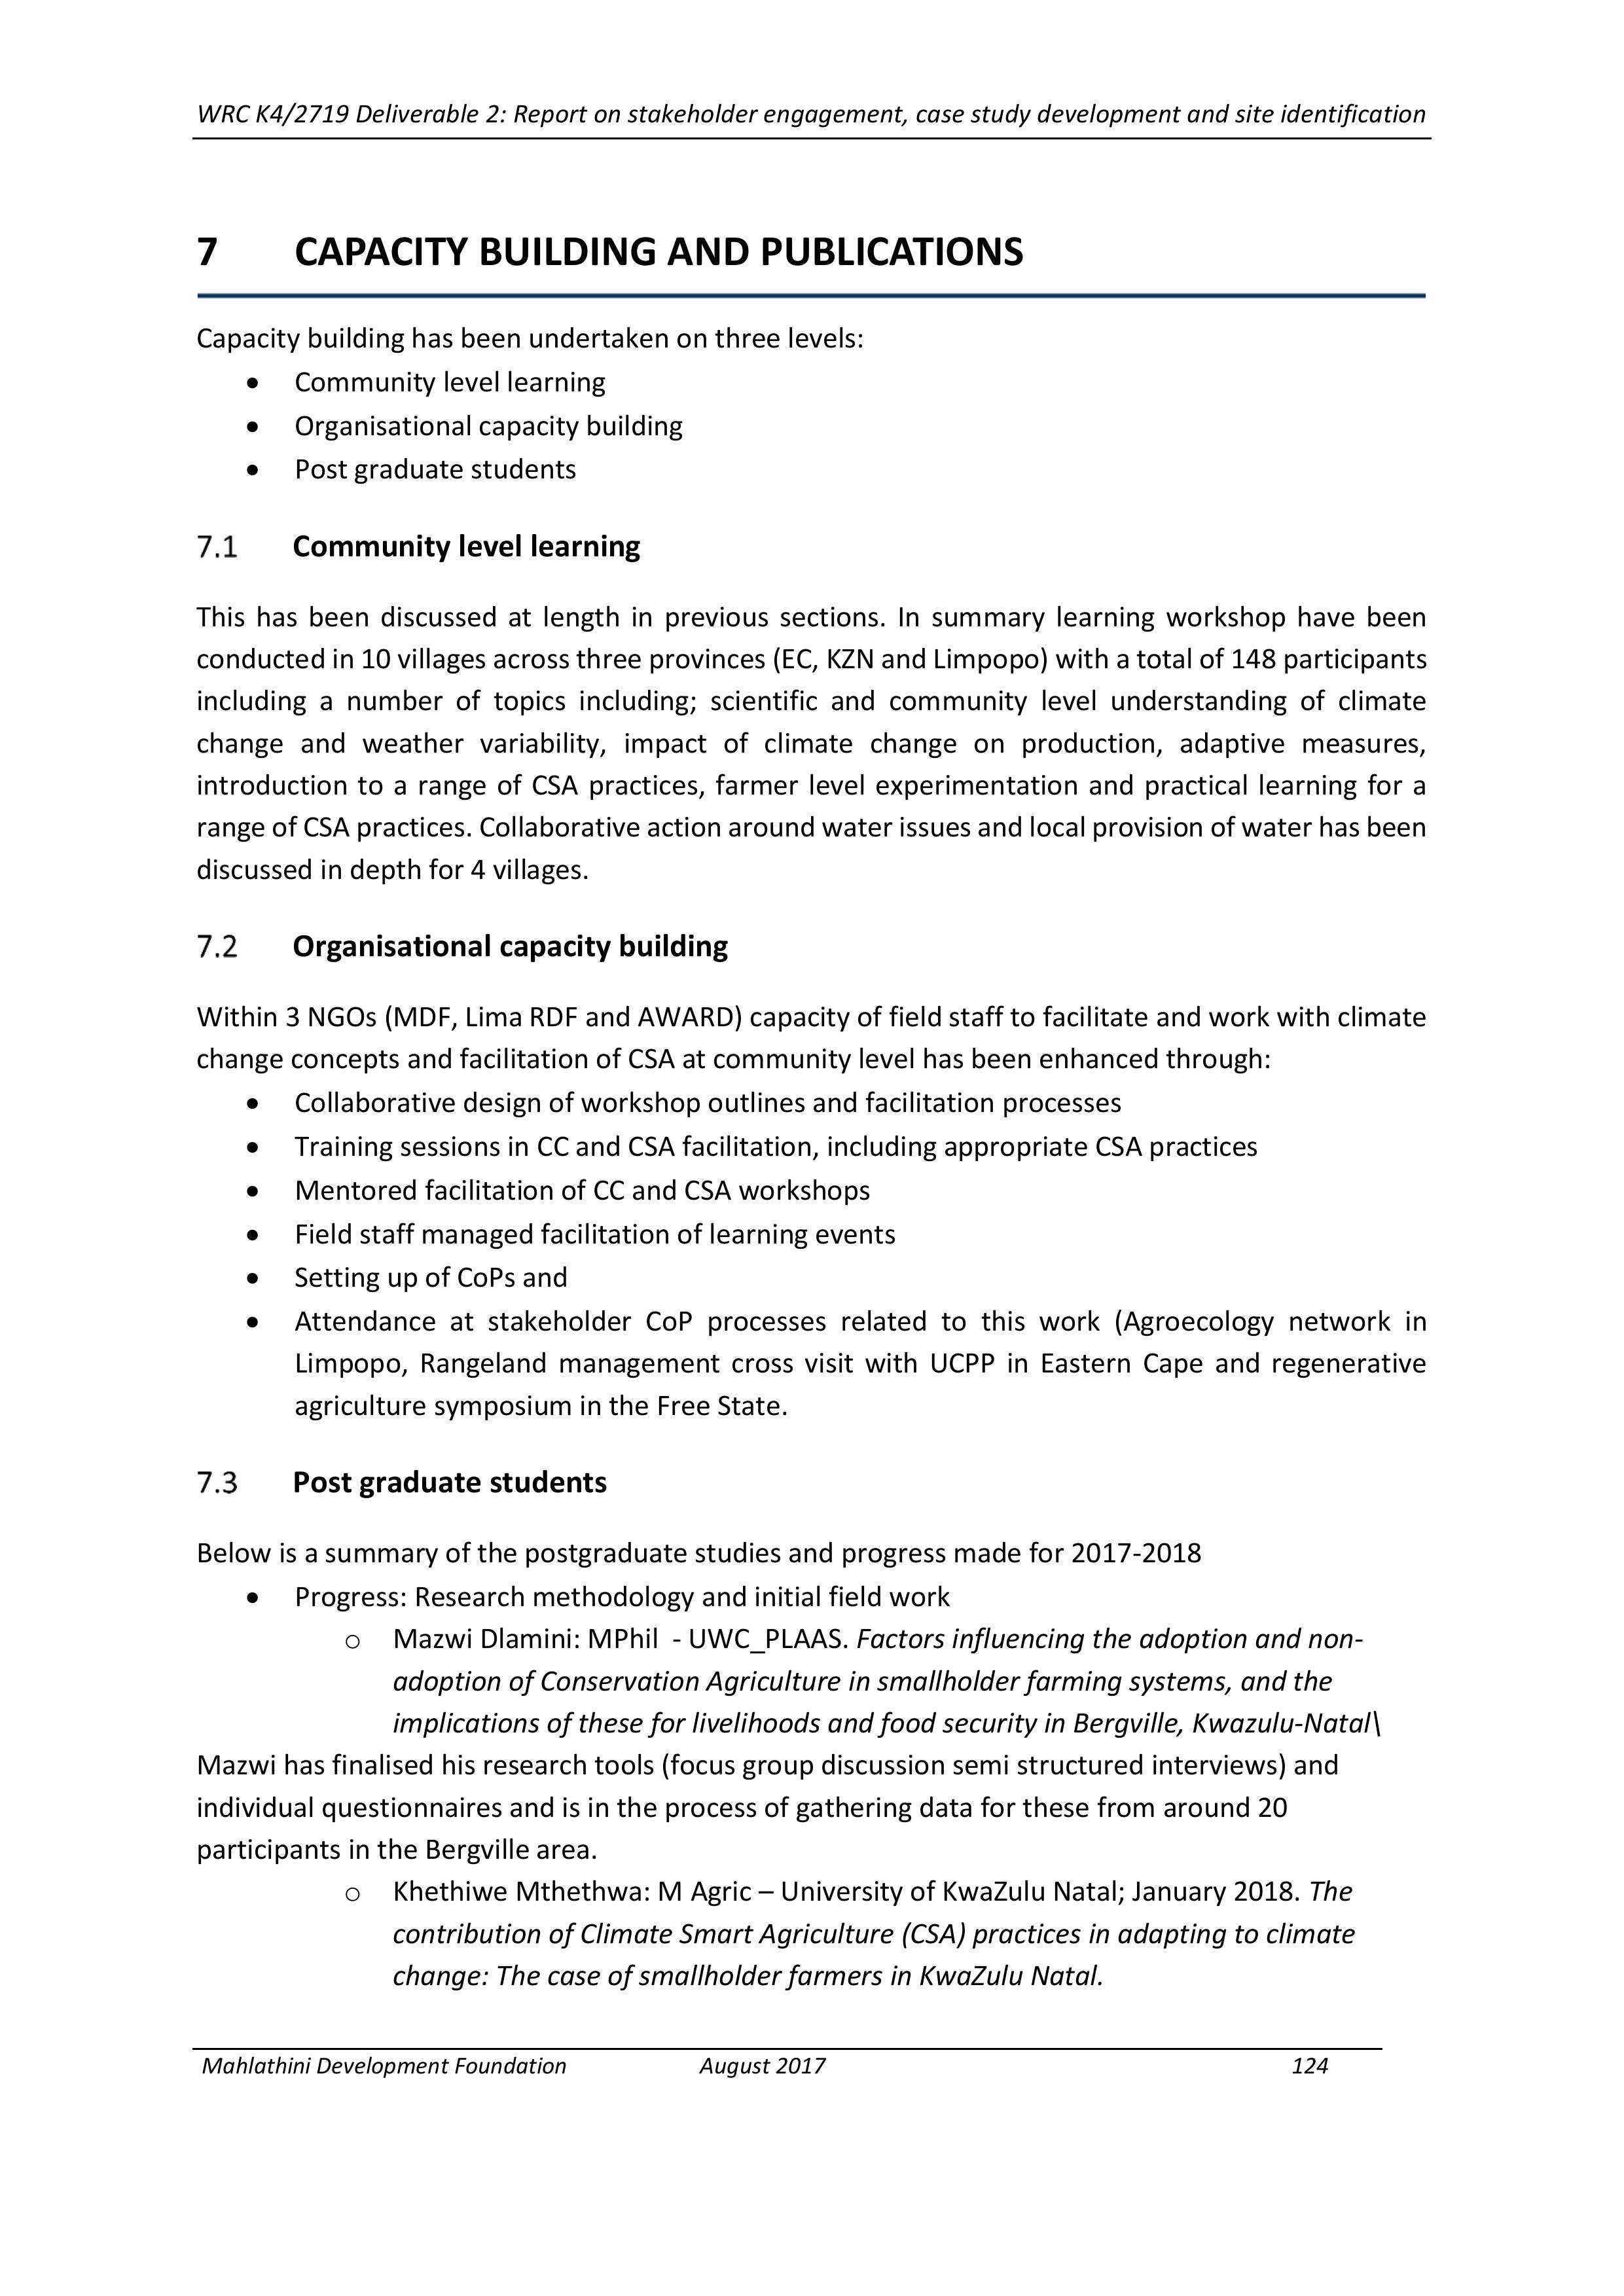
WRC K4/2719 Deliverable 2: Report on stakeholder engagement, case study development and site identification
Mahlathini Development Foundation August 2017124
7CAPACITY BUILDING AND PUBLICATIONS
Capacity building has been undertaken on three levels:
•Community level learning
•Organisational capacity building
•Post graduate students
Community level learning
This hasbeendiscussedat lengthin previous sections. In summary learning workshophave been
conducted in 10 villages across three provinces (EC, KZN and Limpopo) with a total of 148 participants
including a number of topics including; scientific and community level understanding of climate
change andweathervariability, impact of climate changeon production, adaptive measures,
introduction to a range of CSA practices, farmer level experimentation and practical learning for a
range of CSA practices. Collaborative action around water issues and local provision of water has been
discussed in depth for 4 villages.
Organisational capacity building
Within 3 NGOs (MDF, Lima RDF and AWARD) capacity of field staff to facilitate and work with climate
change concepts and facilitation of CSA at community level has been enhanced through:
•Collaborative design of workshop outlines and facilitation processes
•Training sessions in CC and CSA facilitation, including appropriate CSA practices
•Mentored facilitation of CC and CSA workshops
•Field staff managed facilitation of learning events
•Setting up of CoPs and
•Attendance at stakeholder CoP processes related to this work (Agroecology network in
Limpopo, Rangeland management cross visit with UCPP in Eastern Cape and regenerative
agriculture symposium in the Free State.
Post graduate students
Below is a summary of the postgraduate studies and progress made for 2017-2018
•Progress: Research methodology and initial field work
oMazwi Dlamini: MPhil - UWC_PLAAS.Factors influencing the adoption and non-
adoption of Conservation Agriculture in smallholder farming systems, and the
implications of these for livelihoods and food security in Bergville, Kwazulu-Natal\
Mazwi has finalised his research tools (focus group discussion semi structured interviews) and
individual questionnaires and is in the process of gathering data for these from around 20
participants in the Bergville area.
oKhethiwe Mthethwa: M Agric – University of KwaZulu Natal; January 2018. The
contribution of Climate Smart Agriculture (CSA) practices in adapting to climate
change: The case of smallholder farmers in KwaZulu Natal.
WRC K4/2719 Deliverable 2: Report on stakeholder engagement, case study development and site identification
Mahlathini Development Foundation August 2017125
Khethiwe has finalised her proposal and research methodology and has completed her initial
literature review. She is in the process of designing her first individual questionnaire related to
implementation and uptake of CSA practices.
Publications and networking
•Publications:
oSA Grain Newsletter; CA SFIP, 1 smallholder case study (Swayimane)
•Cross visits:
oPACSA – small livestock production interventions in the Umgungundlovu DM
•Attendance:
oNo-Till Club Annual Conference- 4-6 September 2018
oKZN CA Forum
oIntroduction of Agricloud app (www.rain4africa.org) for smallholder farmers –ARC –
6 September
•Conference papers:
oLand Rehabilitation Society of South Africa: Annual Conference 13-15 August 2018.
Presentation of a paper “Learning CA the Innovation Systems Way” – E Kruger
o8thBiennial LandCare Conference; 25-27September “CA Innovation Systems; progress
and successes” – T Mathebula