Annex 5
Narrative Interim Report
The report must describe in detail how the project has progressed and the results achieved so far, and must
describe how the project funds have been used for the planned activities. The total length should not exceed
15 pages.
BMZ Project number: 6815
Project country: South Africa
Project title: Community-Based Adaptation to Climate Change (CBCCA) to build resilience
Organisation: Mahlathini Development Foundation (MDF)
Project duration: 01.10.2022 bis 31.08.2025
Period: October 2023- March 2024
1.General Information
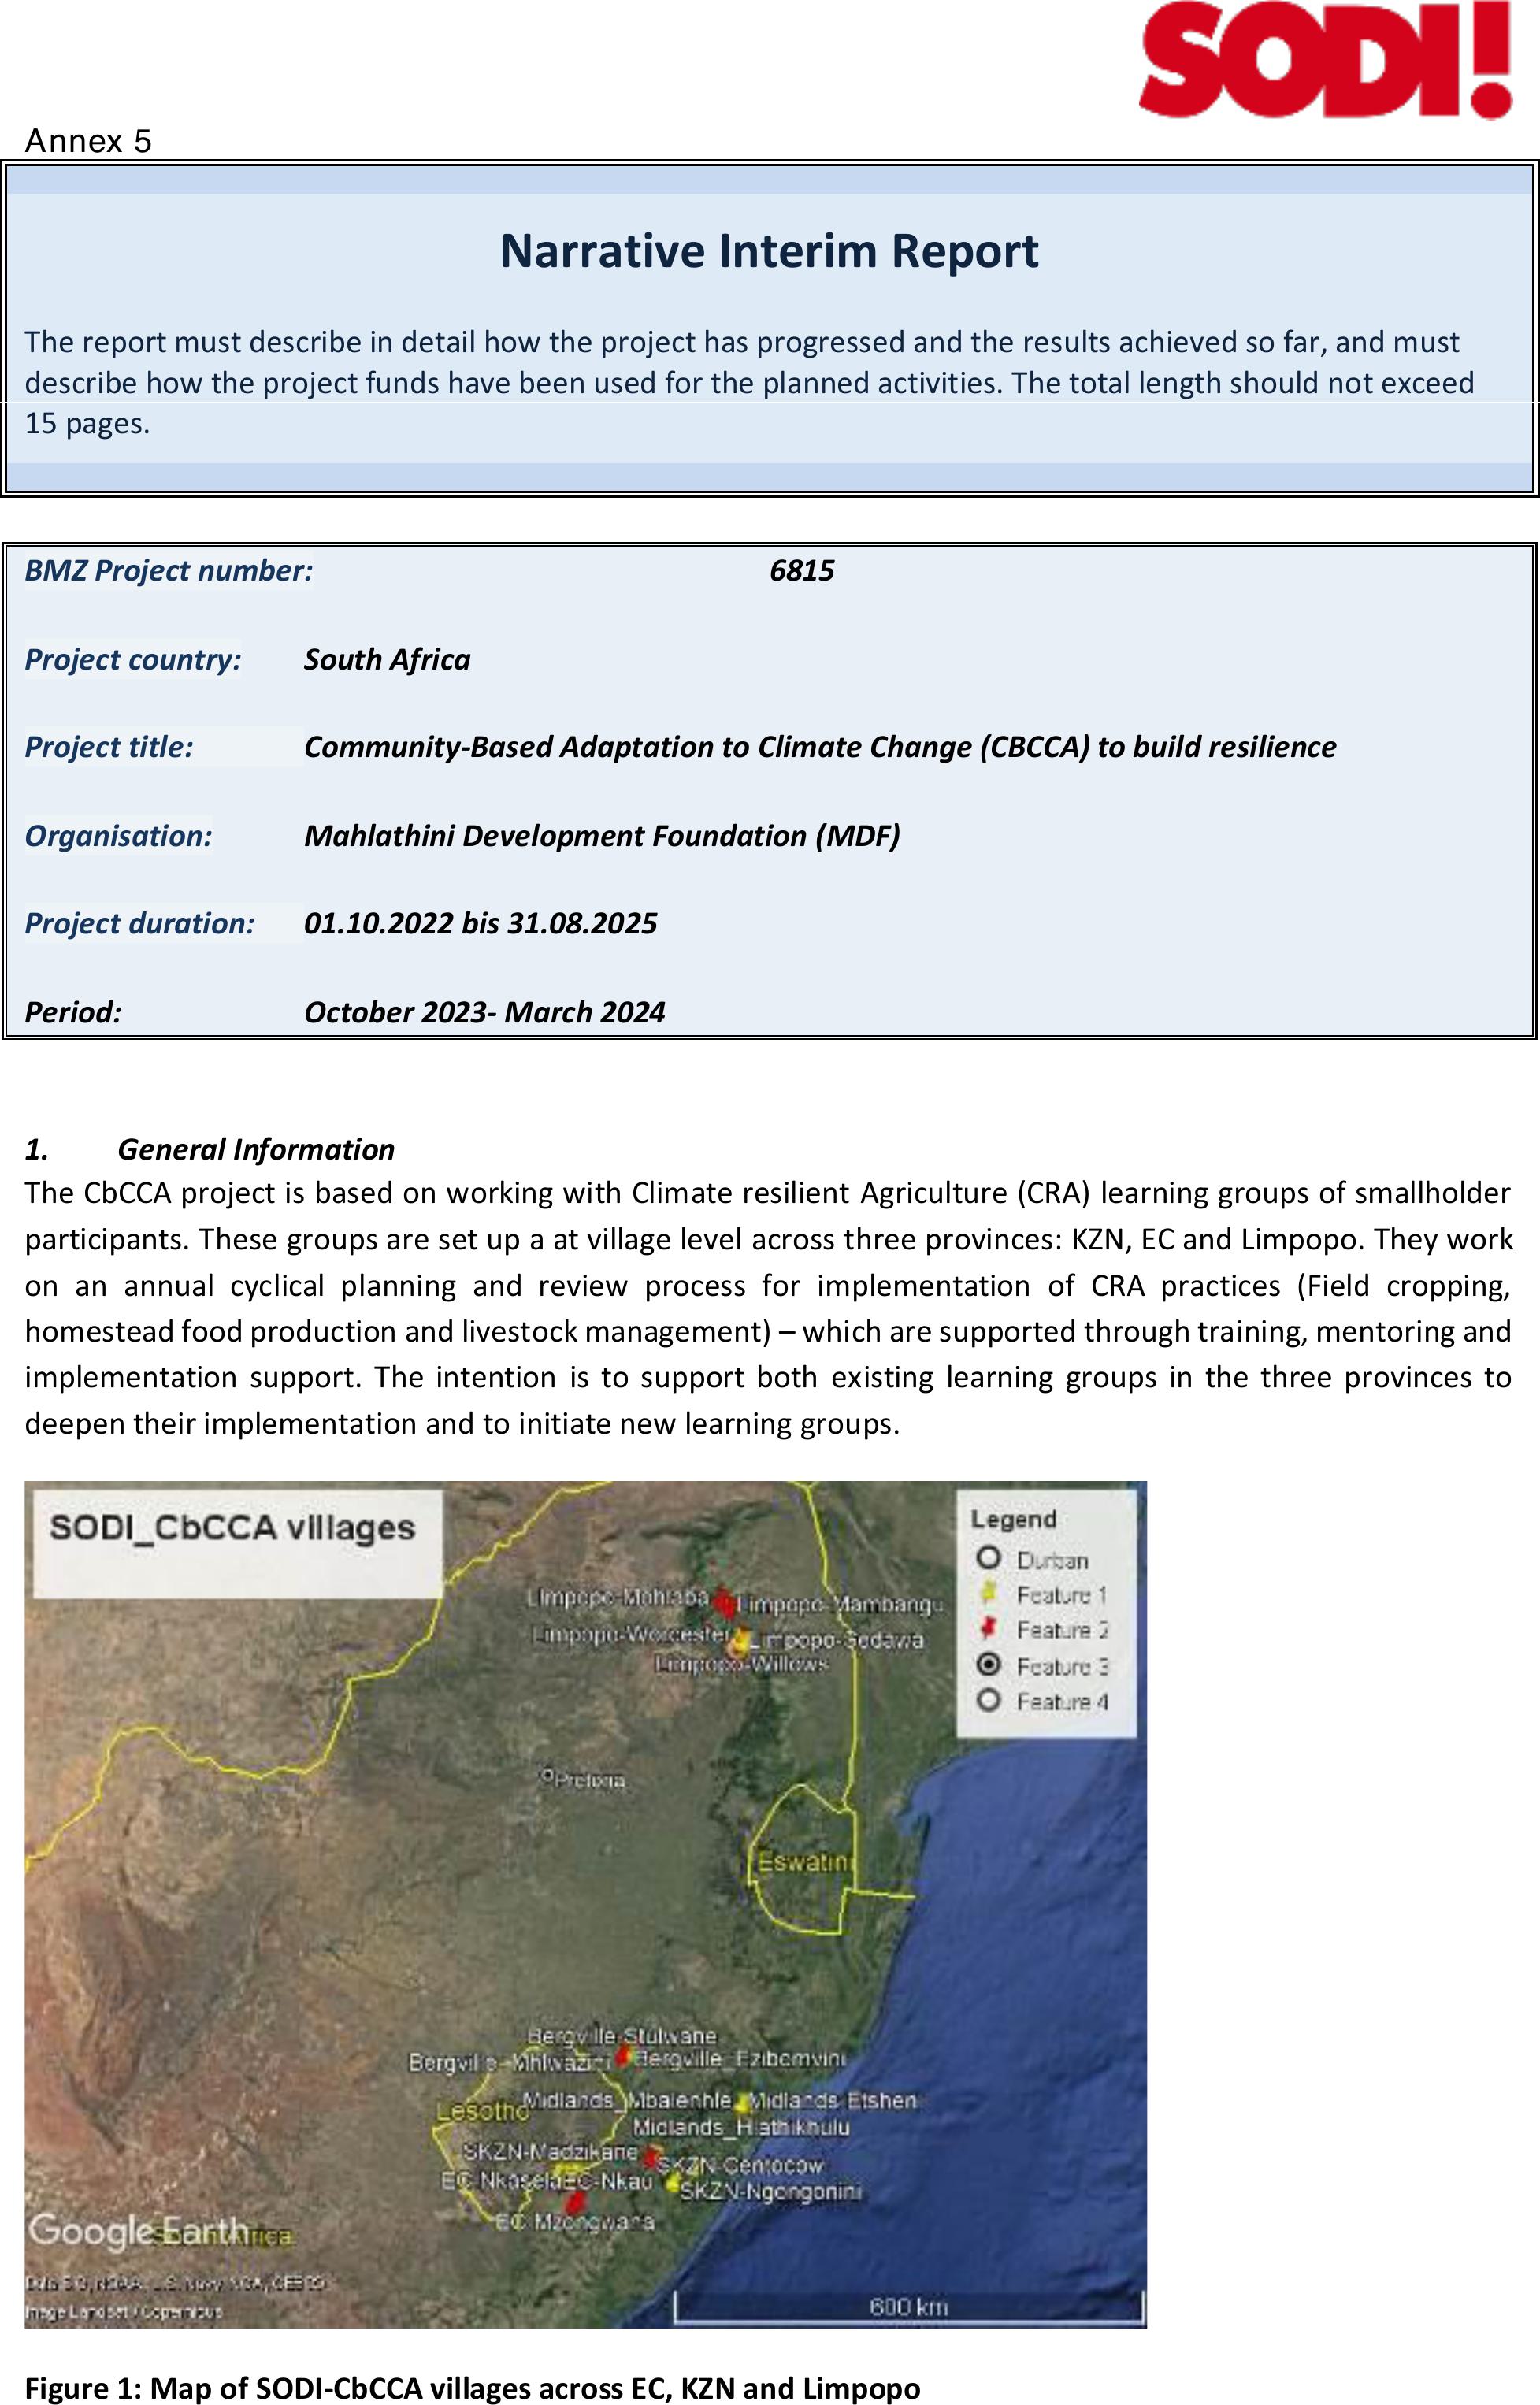
The CbCCA project is based on working with Climate resilient Agriculture (CRA) learning groups of smallholder
participants. These groups are set up a at village level across three provinces: KZN, EC and Limpopo. They work
on an annual cyclical planning and review process for implementation of CRA practices (Field cropping,
homestead food production and livestock management) –which are supported through training, mentoring and
implementation support. The intention is to support both existing learning groups in the three provinces to
deepen their implementation and to initiate new learning groups.
Figure 1: Map of SODI-CbCCA villages across EC, KZN and Limpopo
Project no 2116ZA311
2
CRA learning group members alsoundertake a range of other associated activities according to their need,
meaning that not all groups undertake the same activities:
➢Setting up and running village savings and loan associations (VSLAs), with membership from the CRA
learning groups and beyond, for savings and small loans for consumption smoothing and productive
activities.
➢Enterprise development and local marketing committees and groups, mostly to run the joint monthly
produce markets in nearby towns, but also includes egg andbroiler production and sales, livestock
auctions and more formal market contracts.
➢Water access and management through watercommittees linked to local governance structures, for
planning and implementing integrated water management activities and
➢Livestock committees, for development of conservation agreements for rangeland management and
local livestock auctions.
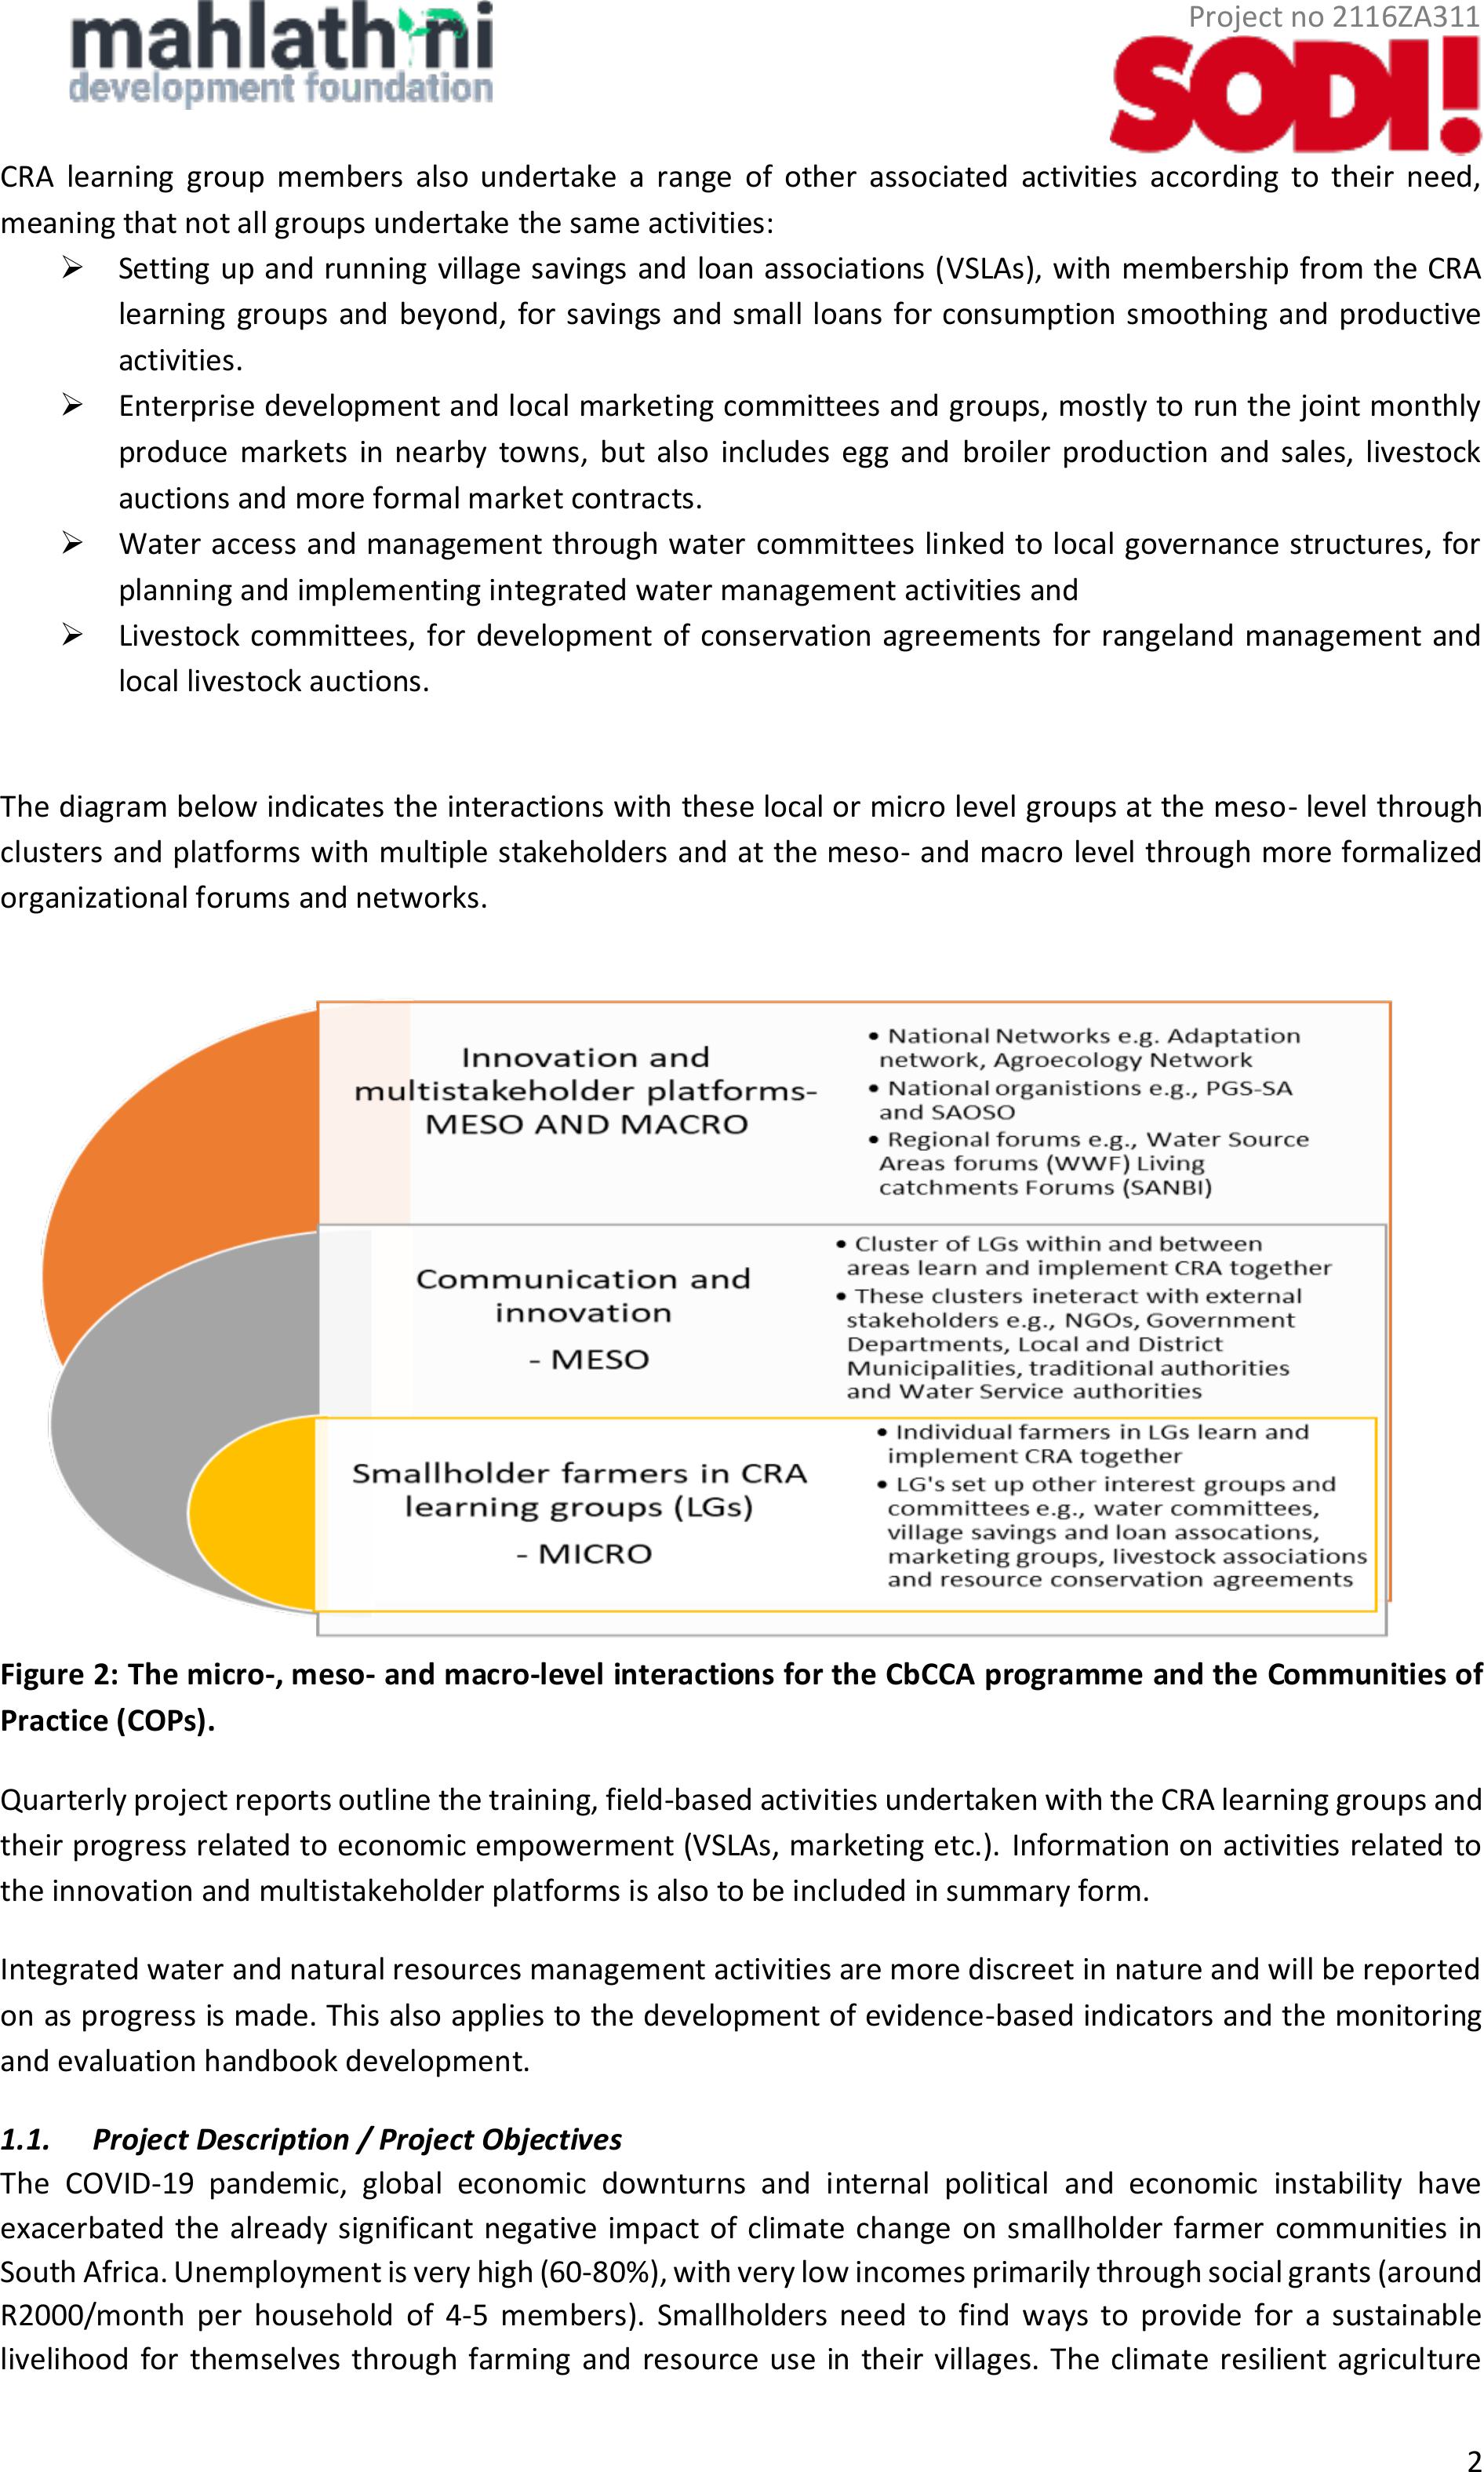
The diagram below indicates the interactions with these local or micro level groups at the meso- level through
clusters and platforms with multiple stakeholders and at the meso- and macro level through more formalized
organizational forums and networks.
Figure 2: The micro-, meso- and macro-level interactions for the CbCCA programme and the Communities of
Practice (COPs).
Quarterly project reports outline the training, field-based activities undertaken with the CRA learning groups and
their progress related to economic empowerment (VSLAs, marketing etc.). Information on activities related to
the innovation and multistakeholder platforms is also to be included in summary form.
Integrated water and natural resources management activities are more discreet in nature and will be reported
on as progress is made. This also applies to the development of evidence-based indicators and the monitoring
and evaluation handbook development.
1.1.Project Description / Project Objectives
The COVID-19 pandemic, global economic downturns and internal political and economic instability have
exacerbated the already significant negative impact ofclimate change on smallholder farmer communities in
South Africa. Unemployment is very high (60-80%), with very lowincomes primarily through social grants (around
R2000/month per household of 4-5 members). Smallholders need to find ways to provide for a sustainable
livelihood for themselves through farming and resource use in their villages. The climate resilient agriculture

Project no 2116ZA311
3
practices have been piloted and have been shown to significantly improve both livelihoods and social agency and
now needs to be deepened and expanded.
The project objectives and outputs are summarized in the small table below.
Overall objective
(impact)
Communities have improved their livelihoods and their capacity to adapt to climate change and
have strengthened their resilience climate change risks and shocks
Project
outputs/objectives
O1
Capacity is developed for creation of and strengthening institutional frameworks and
mechanisms for including proven multi-benefit approaches that promote collective action
and coherent Community based Climate Change Adaptation (CbCCA) implementation.
O2
The farmer level decision support system for implementation of CRA is upscaled in eastern
SA.
O3
Appropriate frameworks for monitoring and evaluation of environmental benefits and agro-
ecosystem resilience are developed at multiple scales
O4
Improvement of water and natural resources management and governance through
community ownership
1.2.Source of Information
Each activity set within the project has a focused monitoring and evaluation process, to encompass the range of
environmental, agricultural, economic and social indicators used for reporting. Monitoring forms include for
example the CCA baselines, crop and garden monitoring, poultry production monitoring and fodder
supplementation monitoring. Databases are collated for the monthly VSLA (village savings and loan associations)
records and monthly market stall sales and incomes. Seasonal reviews for each learning groups consist of focus
group discussions and individual interviews. Resilience snapshots and participatory impact assessments provide
more summative evaluative content.
In addition, the provincial field team leaders (Betty Maimela and Mazwi Dlamini) providemonthlyreports on
training and implementation undertaken with the CRA learning groups. Photographs are included in these
summaries and attendance registers are available. All interns are expected to provide monthly field work reports
(for SODI – Sphumelelo Mbhele) and reports for events, workshops and meetings are submitted.
Erna Kruger usesthese reports and databases to compile the SODI quarterly reports for theorganization.
Financial reports re compiled jointly by Erna Kruger and Sarika Ramsewak.
2.Project Status
Overall Objective (Impact): Communities are empowered to adapt to climate change and their resilience is
strengthened.
Project Objective
(Outcome):
Indicator
Base value
(quantitative & qualitative)
Equivalent to proposal
Target value
(Quantitative & qualitative)
Equivalent to proposal
Achievements
(quantitative & qualitative)
Smallholder families in 3
provinces in South Africa
apply climate-adapted
agricultural practices and
diversify their income
opportunities in order to
As part of an MDF pilot
project, 345 smallholder
farmers have gained
initial experience with
localagricultural
practices for climate
change adaptation. There
2,625beneficiaries of
smallholder farming
families and 75
stakeholders in 3 provinces
are organized in
Communities of Practice
(CoP) and implement at
249 participants, of whom 107
are in new learning groups.
(1 424 beneficiaries)
3 practices

Project no 2116ZA311
4
Project Goals
(Output)
Indicators
Base value
(quantitative &
qualitative)
Equivalent to
proposal
Target value
(Quantitative &
qualitative)
Equivalent to proposal
Achievements
(quantitative & qualitative)
1. Communities of Practice
(CoP)are established at
different levels and practices
for climate-resilient
agriculture are applied
sustainably.
1.1 Learning groups
(18) at localvillage
levelhave gained
initial experience with
approaches to
sustainable and
climate-resilient
agriculture.
1.2 Currently,
smallholders are
supported by 2
government
organisations (ROs)
and 2 non-
governmental
organisations (NGOs)
1.1 CoPat localand regional
levelare implemented and
operational:
- 27 CoP / Learning groups for
climate-resilient agriculture
are established at village level
for community-based climate
change adaptation (CbCCA)
- 3 regional CoP with
representatives fromthe
local CoP are established in
clustersas innovation
platforms for exchange,
planning and development
- 3 regional multi-stakeholder
platforms (ROs and NGOs) for
strategy development, policy
interactions, coherent
planning and awareness
raising are established
1.2 In the project regions, 6
ROs and 6 NGOs support
smallholder farmers through
learning and financing
opportunities. From planning
to implementation, they are
involved in community-based
adaptation to climate change
activities.
26 CoPs of which 8 are new.
-Mahhehle and Mariathal(SKZN) and
Sophaya and Madeira (Limpopo),
eMadakaneni and eMahlathini(Bergville),
Nchodu and Ned (Eastern Cape)
4 regional CoPs
-Conservation Agriculture: Farmers’ Open
day Bgvl(5 villages Bgvl, 3 villages Midlands)-
existing (in association with ASSET Research)
-Mametja-SekororoParticipatory guarantee
system (3 villages) – existing with SAOSO
- Bgvl marketing cluster (5 villages)- newly
established
-Ozwathini: Calf rearing group (5 villages)-
newly established
4 multistakeholder platforms
- uThukela catchment partnership (Northern
Drakensberg Collaborative) -newly
established catchment stewardship with
WWF (quarterly meetings)
- Adaptation network –national network-
member –in capacity development working
group with Flanders Government (3-4
meetings/year)
-PGS SA –Organic participatory guarantee
system South Africa – South African Organic
Sector Organisation (2 meetings)
-Conservation Agriculture forum –national
(1 per annum)
6 NGOs: Institute of Natural Resources
(KZN), Association for Water andRural
Development (Limpopo), Environmental and
Social Solutions (Eastern Cape),Lima Rural
Development Foundation (KZN), Sociotech
(Gauteng), Wildlands Conservation Trust
(KZN)
3 ROs:
University of KwaZulu Natal (learning and
funding in socio ecological mapping and
adaptive planning),
World Wildlife Fund -WWF(learning and
funding support in water stewardship in
Bergville KZN),
stabilize food security in
the long term.
is currently no coherent
regional or local system
for climate-adapted
agriculture by
smallholder farmers.
So far, 9 community-
based village savings and
loan associations have
been established by MDF
least 3 practices for
climate-adapted
agriculture according to
developed standards.
18 villages are organized by
the project in their own
village savings groups
20 stakeholders: across meso
and macro level CoPs
18 VSLAs of which 5 are new

Project no 2116ZA311
5
Water Research Commission- WRC (learning
and funding support in all sites and including
also Giyani in Limpopo –through
dissemination of farmer decision support
project
2. A decision support tool
that takes into account
climate-resilient
agricultural practices will
be furtherdeveloped and
applied by smallholder
farmers.
2.1 There are no
specific criteria for
the local
assessment of
climate-resilient
production
systems.
2.2 So far, there are
no standardized
and target group-
oriented
approaches for
climate-resilient
agriculture for the
project regions.
2.3 120 smallholder
farmers have
developed an
understanding of
how to use a
decision support
tool for climate-
resilient farming
practices
2.1 Indicators for
monitoring and evaluating
the impact of specific
agricultural practices for
adaptation to climate
change have been
identified together with
smallholder farmers.
2.2. A handbook has been
developed and made
available as a standard
framework for use as
"open source" for users at
various levels (in digital
and printed form).
2.3 Atotalof 300
smallholder farmers
independently use the
decision support tool for
climate-resilient
agricultural practices to
implement community-
based adaptation to
climate change
-MoU development with PMERL specialist
Karen Kotschy. Review of indicators and
resilience snapshots initiated.
- Livelihoods surveys designed and
administered. (Nqe Dlamini) –research into
VSLA contribution to livelihoods –to feed
into the overall M&E framework–to develop
best bet indicator set
-Not done yet – to be initiated in 2024
524 smallholder farmersofwhom 173 are
in new learning groups have used the DSS to
implement practices and review and plan
their activities –facilitated but not
independent
3. Community-based
water management will be
institutionalised and
sustainably improved.
3.1 At municipal
level, there are
insufficiently
functioning
structures for
sustainable water
management.
3.2 Communities
have only limited
access to water
3.1. Six communities have
been institutionalized and
have a sustainable
structure (e.g. Committee
on Water Management)
3.2 Three community-
based approaches to
sustainable water
management have been
developed.
5 communities:Ezibomvini (9), Vimbukhalo
(35), Stulwane(87) (Bergville), Nkau (18),
Ned (50) (Eastern Cape) have been
institutionalized, sustainable structures in 2
villages only (Constitutions, committee, do
have meetings, problem solving, or dealwith
maintenance issues)
3 Community-based approaches: Limpopo
(Turkey, Sedawa), Limpopo (Giyani) and
Bergville (Stulwane, Vimbukhalo)… in
association with WRC –approaches have
been outlined and proposed- working with
water institutions to get some recognition. –
policy and strategy development at regional
and national level.
2.1.Explanations in the event of deviations from planning
Regarding small poultry production units for our smallholder farmers, the continued lack of easy access to point
of lay hens for layers as well as difficultyin accessing day old chicks for broilers, is necessitating a change in
strategy. Linkedto the sharprise in feed prices, it has meant that mostof the smallholders who have small
numbers of chickens (10-20) can not break even in terms of expenses and incomes. There has been a sharp
reduction in the number of farmers undertaking poultry production because of this.
Our strategy now is to move to a hardy, easy to breed multipurpose chicken, in this case “Boschvelders” where
this is a good supply of different aged pullets for sale at a reasonable cost. In addition, experimentation with
mixing and supplying local feed rations will be undertaken. For those with an interest, small hybrid
Project no 2116ZA311
6
(electricity/battery-solar) incubators willbe tested outfor breeding of chicks to bulk up flocks and for saleof
chicks locally.
Micro-tunnel prices have again increased sharply- due to a hike in steel prices, necessitating a reduction in the
number of tunnels that can be supplied this year. 30 tunnels have been planned – only 27 can be supplied.
Regarding development of scenarios for localized self-supply water access- proposals have been developed and
submitted forboth theKZN(Bergville) and EC (Matatiele) schemes, to theCzech Republic small scale project
fund, the Japanese Embassy and the German Diplomatic Missions micro-projects fund in the last 6 months. No
positive responses have been received. As a result, work in this particular aspect has been reduced, to avoid
further building of expectations within communities. The initial water resource surveys and discussions started
in Gobizembe (KZN_Midlands), will not be continued until more viable prospective funding options can be
secured.
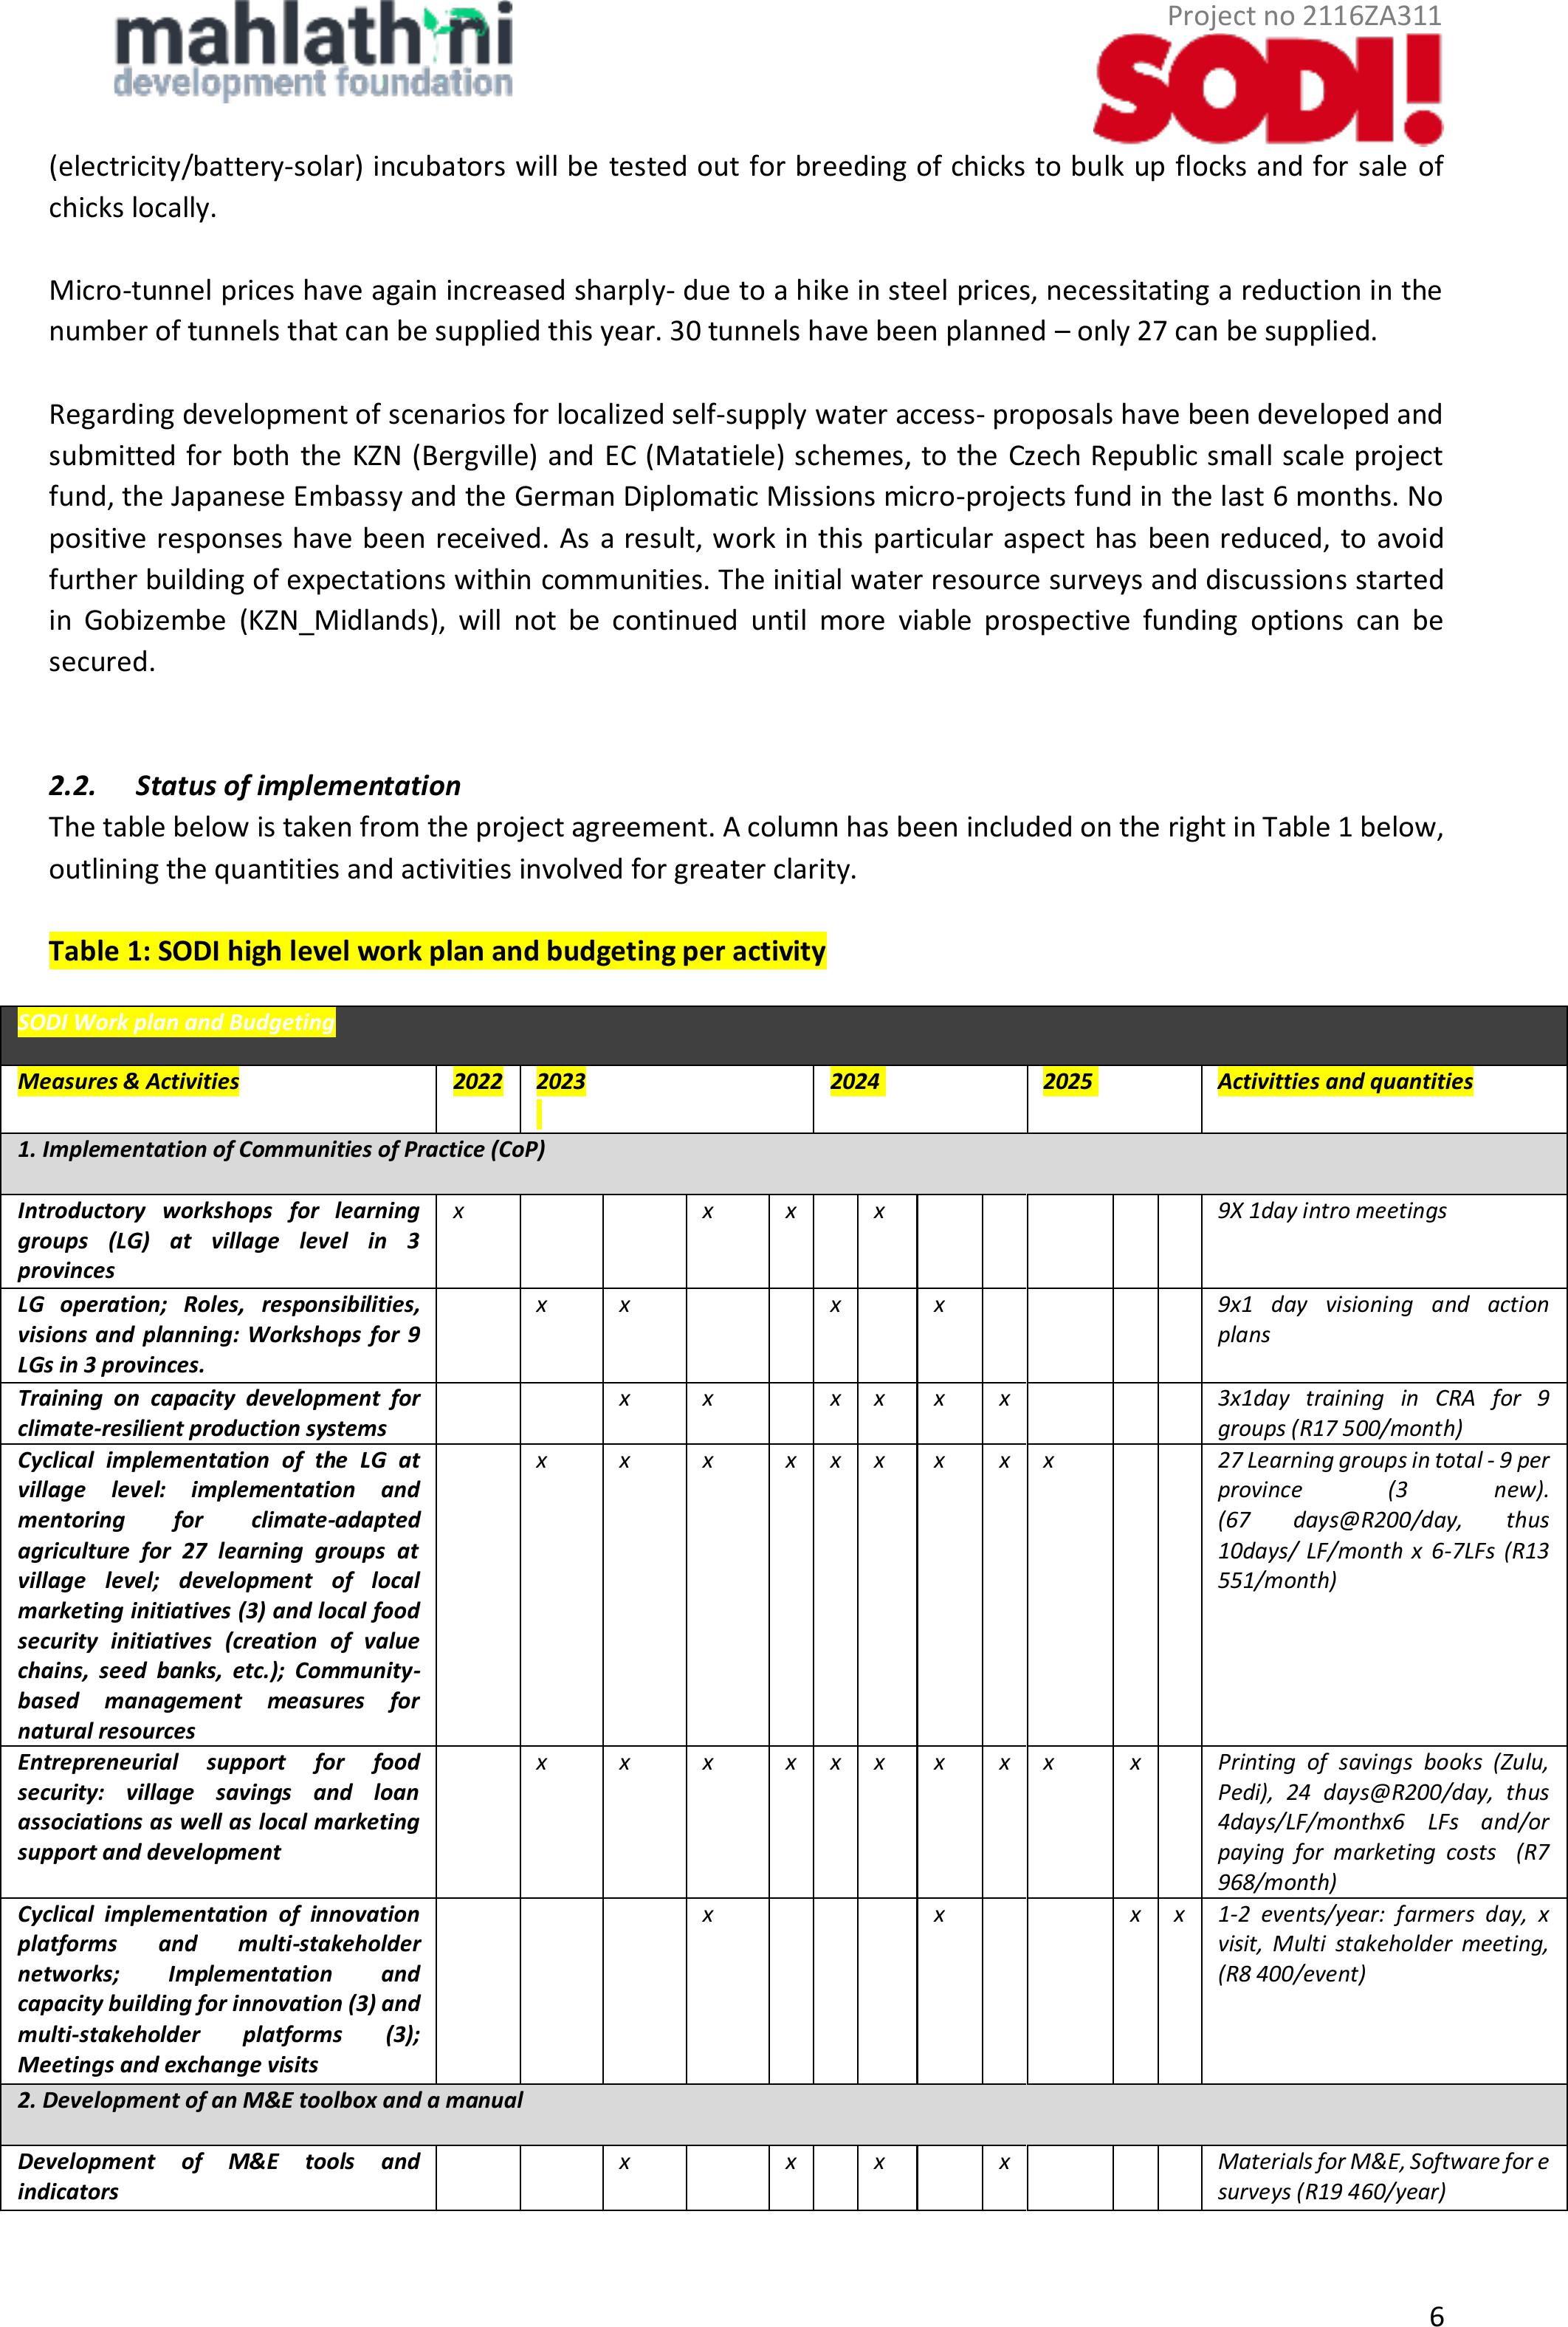
2.2.Status of implementation
The table below is taken from the project agreement. A column has been included on the right in Table 1 below,
outlining the quantities and activities involved for greater clarity.
Table 1: SODI high level work plan and budgeting per activity
SODI Work plan and Budgeting
Measures& Activities
2022
2023
2024
2025
Activitties and quantities
1. Implementation of Communities of Practice (CoP)
Introductory workshops for learning
groups (LG) at villagelevel in 3
provinces
x
x
x
x
9X 1day intro meetings
LG operation; Roles, responsibilities,
visions and planning: Workshops for 9
LGs in 3 provinces.
x
x
x
x
9x1 day visioning and action
plans
Training on capacity development for
climate-resilient production systems
x
x
x
x
x
x
3x1day training in CRA for 9
groups (R17 500/month)
Cyclical implementation of the LG at
village level: implementation and
mentoring for climate-adapted
agriculture for 27 learning groups at
village level; development of local
marketing initiatives (3) and local food
security initiatives (creation of value
chains, seed banks, etc.); Community-
based management measures for
natural resources
x
x
x
x
x
x
x
x
x
27 Learning groups in total - 9 per
province (3 new).
(67 days@R200/day, thus
10days/ LF/monthx6-7LFs (R13
551/month)
Entrepreneurial support for food
security: villagesavings and loan
associations aswell as local marketing
support and development
x
x
x
x
x
x
x
x
x
x
Printing of savings books (Zulu,
Pedi), 24 days@R200/day, thus
4days/LF/monthx6 LFs and/or
paying for marketing costs (R7
968/month)
Cyclical implementation of innovation
platforms and multi-stakeholder
networks; Implementation and
capacity building for innovation (3) and
multi-stakeholder platforms (3);
Meetings and exchange visits
x
x
x
x
1-2 events/year: farmers day, x
visit, Multi stakeholder meeting,
(R8 400/event)
2. Development of an M&E toolbox and a manual
Development of M&E tools and
indicators
x
x
x
x
Materials for M&E, Software fore
surveys (R19 460/year)
Project no 2116ZA311
7
Development of the Handbook on
Community-Based Adaptation to
Climate Change
x
x
x
Regular M&E of MDF together with
smallholders
x
x
x
x
x
x
x
Seasonal evaluation by learning groups
at village level
x
x
x
x
x
x
36 Resilience snapshots per year
(min)
Participatory assessments improved
climate resilience for a selection of
village-level learning groups
x
x
x
x
x
x
3 PIA's per year (Min)
3. Sustainable water management
Establishment and implementation of
institutional structures such as water
management committees
x
x
x
x
x
x
x
x
x
x
Development of three concepts for
sustainable access to water
x
x
x
x
x
Investment
2022
2023
2024
Amount per person
Tunnels
R5 463,00
5
35
30
Poultry
R2 021,00
10
45
45
Seed (CA, veg) and poultry feed
R1 815,00
10
45
45
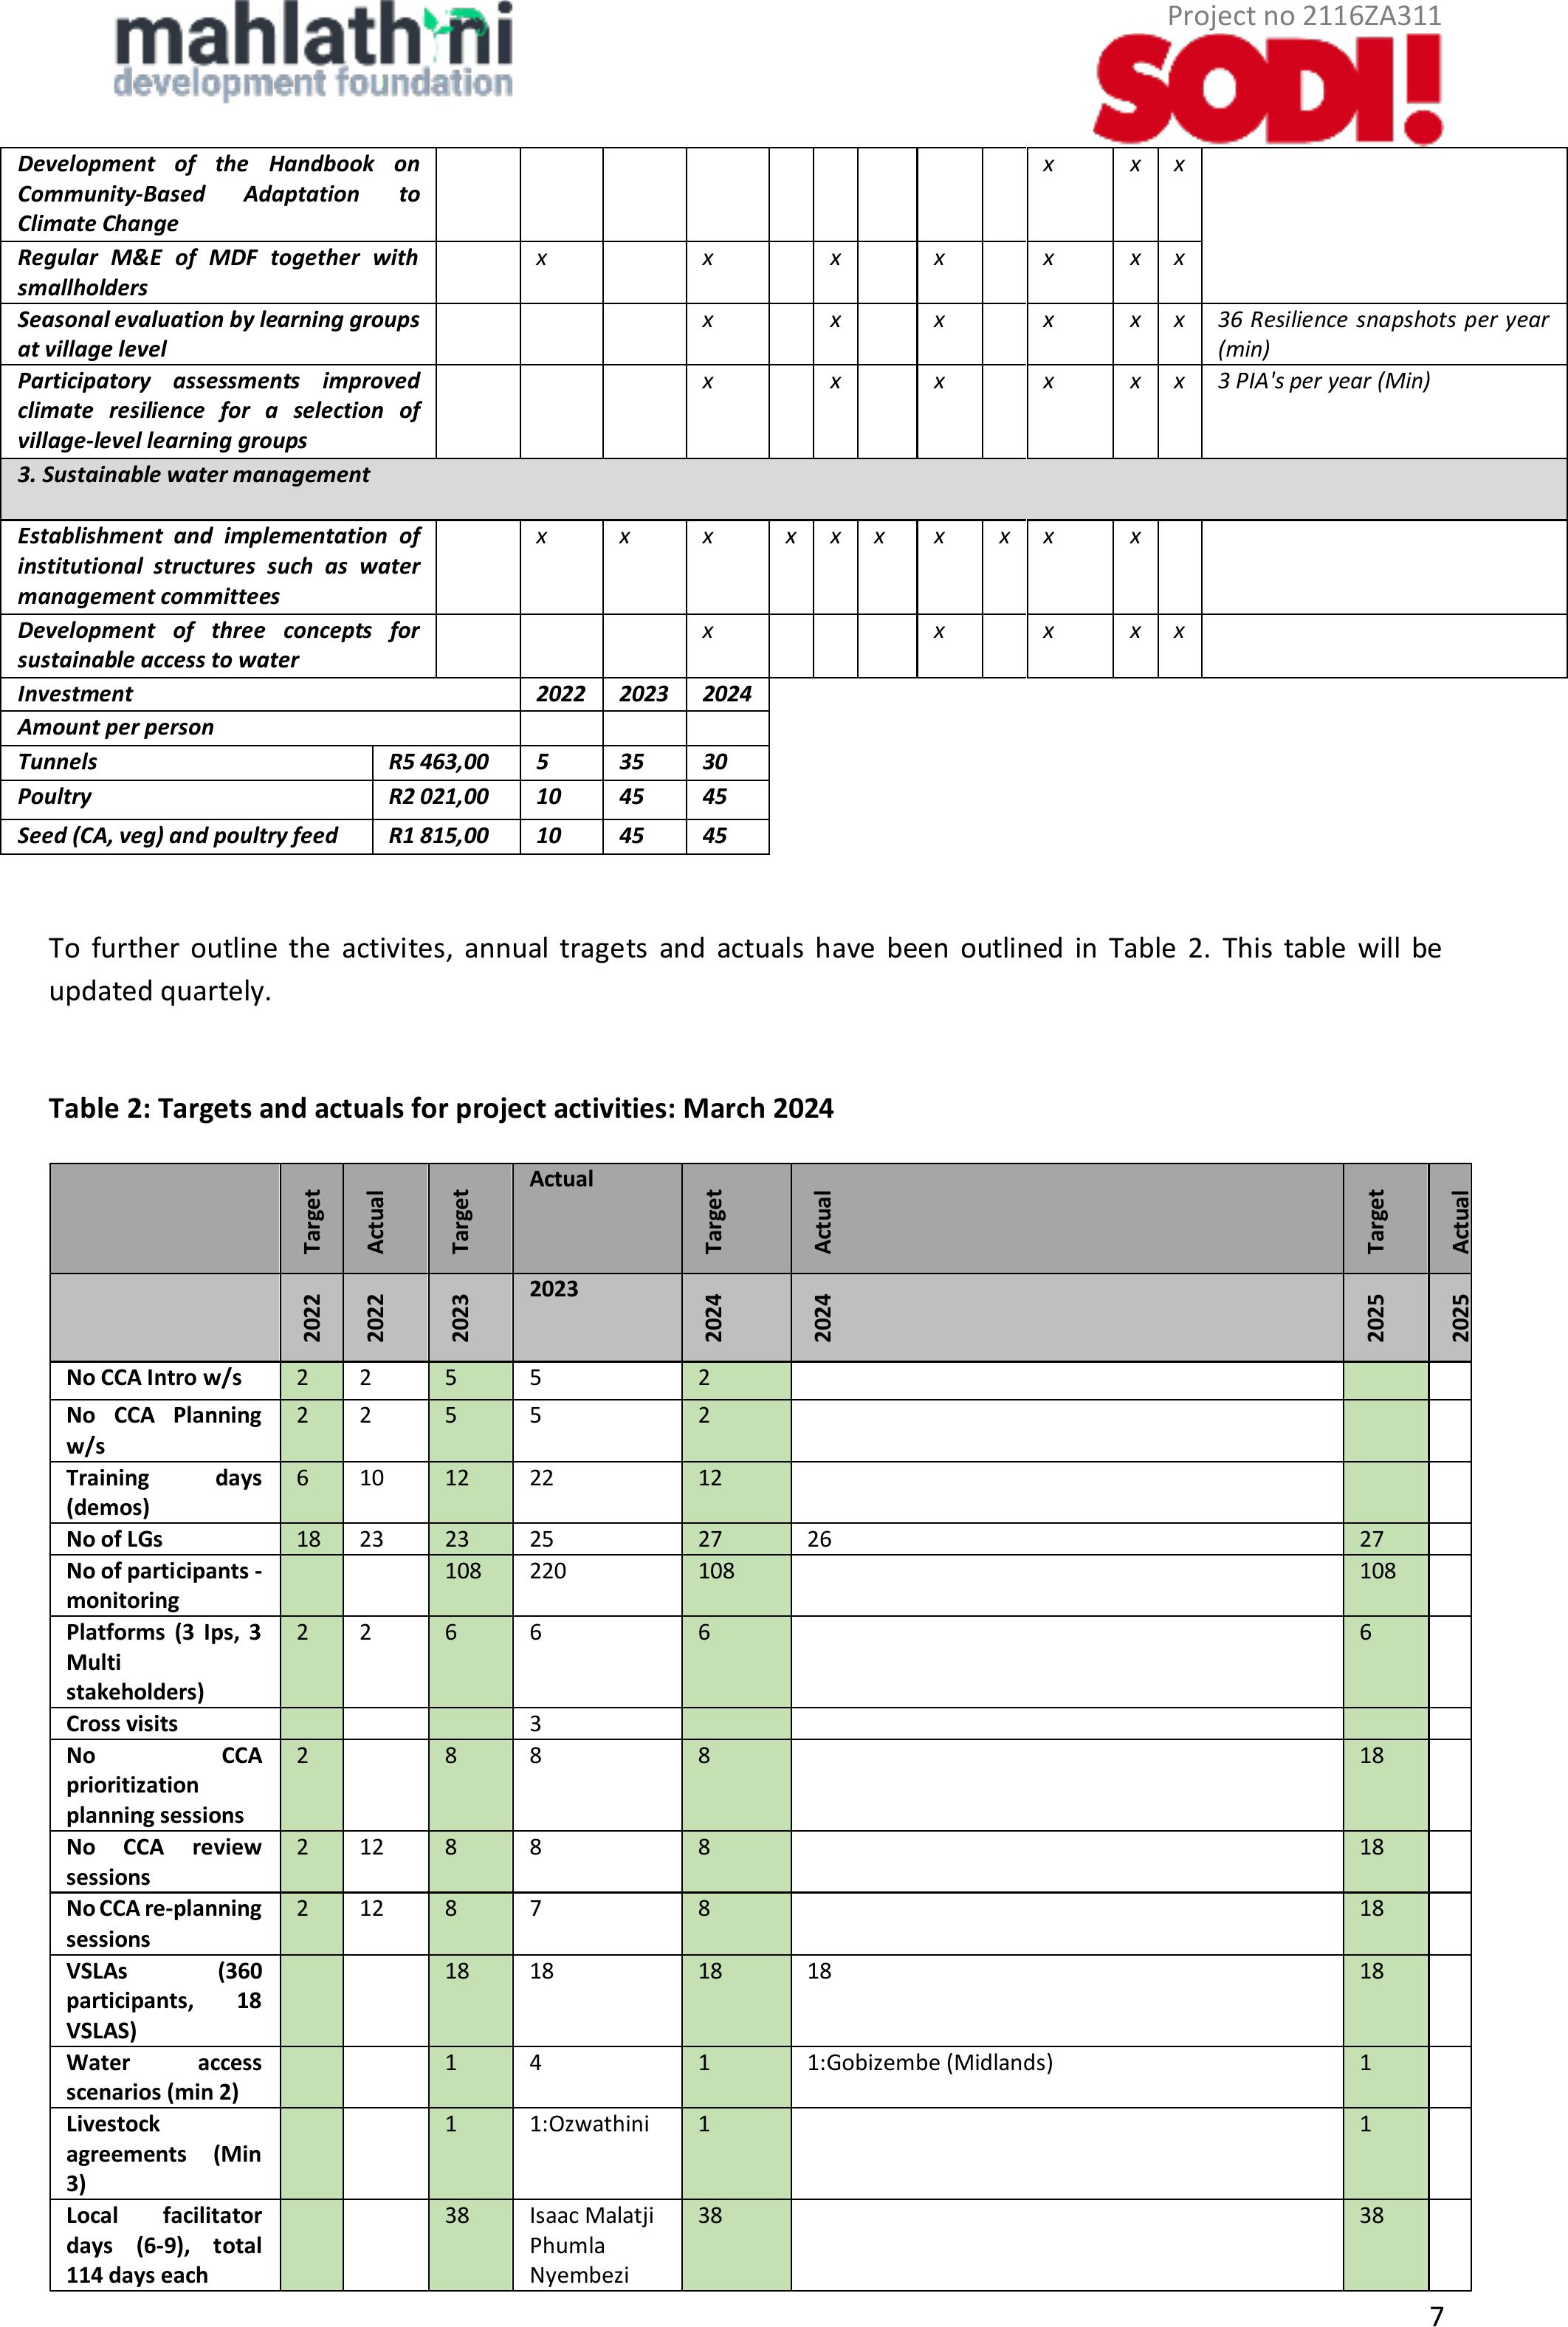
To further outline the activites, annual tragets and actuals have been outlined in Table 2. This table will be
updated quartely.
Table 2: Targets and actuals for project activities: March 2024
Target
Actual
Target
Actual
Target
Actual
Target
Actual
2022
2022
2023
2023
2024
2024
2025
2025
No CCA Intro w/s
2
2
5
5
2
No CCA Planning
w/s
2
2
5
5
2
Training days
(demos)
6
10
12
22
12
No of LGs
18
23
23
25
27
26
27
No of participants -
monitoring
108
220
108
108
Platforms (3 Ips, 3
Multi
stakeholders)
2
2
6
6
6
6
Cross visits
3
No CCA
prioritization
planning sessions
2
8
8
8
18
No CCA review
sessions
2
12
8
8
8
18
No CCAre-planning
sessions
2
12
8
7
8
18
VSLAs (360
participants,18
VSLAS)
18
18
18
18
18
Water access
scenarios (min 2)
1
4
1
1:Gobizembe (Midlands)
1
Livestock
agreements (Min
3)
1
1:Ozwathini
1
1
Local facilitator
days (6-9), total
114 days each
38
Isaac Malatji
Phumla
Nyembezi
38
38

Project no 2116ZA311
8
Jerida Popela
Tunnels
5
35
40
30
27
Poultry
10
45
28 broilers,
17 layers
45
Boschvelders- EC (26), Bgvl (11), Limpopo (22),
Seed (CA, veg),
poultry feed
10
45
Seed –502
(seed/seedlin
gs vegetable
production)
Poultry feed -
45
45
Vegetable Seed –160 – Limpopo , Matatiele
Poultry feed _
This information is further outlined according to the measures and activities, with dates and descriptions of
activities provided in Table 3. Again, this table is to be updated quarterly.
Table 3: Description of measures and activites with dates and areas outlined: Oct-June 2023
Activity No
description
Date
Activity
1.2.1.
Establishing learning groupsat
village level
2022/11/25, 12/09
2022/11/15, 11/29,
2023/03/03
2023/02/09,02/16
2023/01/18
2023/03/27
2023/05/25, 06/08
Limpopo: Sophaya
SKZN:Mahhehle -CCAworkshop x 2 days, VSLA
introduction workshop
Bergville: Eqeleni
EC: Ned, Nkau
Limpopo: Madeira
KZN Midlands: Ndlaveleni
1.2.2.
Training and mentoring for
climate resilient agriculture
2022/12/02
2022/10/26
2022/10/08-14
2022/11/23,24,29
2022/02/10
2022/02/27, 03/28
2022/03/08, 03/17,
03/28
2022/03/15
2023/03/07,08
2023/03/29,30
2023/03/24,27,30
2023/04/, 2023/05,
2023/06
2023/04/21,25
2023/04/19,20
2023/09/30
2023 Oct-Nov
2023/11/13
2023/11/17
2023/12/04
2023/12/14
2024/02/23
2024/03/22
Midlands: Ozwathini contouring workshop SKZN: Mahhehle
– tower gardens
EC-Matatiele: Drip irrigation workshops in 5 villages
SKZN: CA demonstration workshops in 3 villages
SKZN:Plainhill Drip irrigation training
Limpopo: Sofaya trench beds
SKZN:Mahhehle tower gardens, poultry production, trench
beds
SKZN: Mariathal gardens and experimentation
Bgvl: Madakaneni, Mahlathini – gardening training
EC: Ned, Nchodu poultry production
EC: Nec, Nchodu, Mzongwana- Pest and disease control
Limpopo and KZN: trenchbed training with assembling of
tunnels for 45 households across8 villages, including
distribution of seedlings, mixed cropping and mulching
learning inputs and drip irrigation
Limpopo: Willows, Sedawa, Mametja –Natural Pest and
Disease control
Bergville, SKZN: Poultry production: eMadakaeneni,
Mjwetha, Mariathal, Mahhehle, centocow
-Matatieele-Nkau,Nchodu- value adding training
-Boschveldermultipurpose chickens intro training in all
areas
-Midlands (KZN) goat production training with KZNDARD
(3 sessions)
-Matatiele-CA demonstrations and planting Ned (15),
Nchodu (26)
-Midlands: Gobizembe Youth group- seedling production
training
-Limpopo: Sofaya(10) ,Madeira and Willows (16) CA
training and demos
-Limpopo: advanced nutrition workshop x 5 villages
-SKZN: gardening refresher workshops (Centocow,
Mahhehle, Mariathal, Ngongonini)
1.2.3.
Cyclical implementation
through mentoring for capacity
development for LG atlocal
level
2022/08/16,17,18,19,30
2022/10/16
2022/11/21-24
2023/01/24-30
2023/04/24-26
CCA review and planning workshops
-Bergville: CA review and planning (5)
-Midlands: CA review and planning (3)
-Limpopo: CCA review and planning (4)
CCA prioritization of practices
-Matatiele: 5 villages (Ned, Nchodu, Rahsule, Nkau,
Mzongwana
-Limpopo: Worcester, Willows, Mametja five finger reviews
and planning

Project no 2116ZA311
9
1.2.4.
Income diversification and
economic empowerment of
local farmers (LG at local level)
2022/10/02,11/03,
12/04, 2023/02/02,
03/02, 04/02, 05/08,
06/05
2022/10/08,11/07,
12/02, 02/03, 03/03,
04/03, 05/02, 06/02
2022/11/05,06,07,
12/13, 2023/01/27,
02/07
2023/06/02
2023/06/03
2023/01/26
2023/02/14
April-June 2023
Oct23-March24
2023/03/15,16
2024/03/05 and
04/02,04,16,23 and
05/04
Market days: monthly farmers markets
-Midlands: Bamshela (Ozwathini)
-SKZN: Creighton (Centocow)
- Bergville: Bergville town
-Wartburg farmers Market (Gobizembe
-Hoedspruit farmers’ Market (Sedawa/Maetja, Turkey)
Market exploration workshops
-Midlands: Mayizekanye, Gobizembe
-PGS follow-up w/s Limpopo
-EC_Ned-Nchodu market day in Matatiele
-SKZN: Mariathal
VSLAs
VSLA introduction
-SKZN: Mahhehle
-SKZN: Centocow- Sizakahle
VSLA meetings and share outs
-Bergvile: 9
-SKZN: Ngongonini (3), Centocow (2)
-Midlands: Ozwathini (2)
Limpopo: (7)
Youth tala table value adding training
-Limpopo: Youth entrepreneurship dialogues with
AWARD: Sedawa, Turkey, Willows, Sofaya ~100 youth
1.2.5.
Implementation and capacity
development for innovation (3)
and multi-stakeholder
platforms (3)
2022/11/18
2022/11/10
2022/12/01
2023/02/23
2023/02/28
2023/03/08,09
2023/03/28,29
2023/03/30, 06/02
2023/04/26
2023/05/09
2023/08/29
2023/09/19
2023/09/12
2023/09/29
2024/03/12,20
-SKZN: Centocow P&D control cross visit and learning
workshop
-uThukela water source forum: Visioning and action
planning – Bergville
-Adaptation Network AGM
-Regenerative Agric farmers’ day in Bergville incl Asset
research, uThukelaWater Source Forum, uThukela
Development Agency
-Adaptation Network: CCA financing dialogue
-SANBI_gender mainstreaming dialogue
-WRC-ESS: Bglv Ezibomvini, Stulwane –resource
management mapping and planning
-Okahlamba LED forum
-Farmers X visit between Bulwer (supported by the INR0
and Bergville around CRA, fodder and restoration
-PGS-SA: market training input: Online training Session5
-Bergville: KZNDARD Okahlamba Agricultural show
participation of MDF farmers (stall and presentation
- Bergville: marketing workshop and training -5 villages
-INR-Gcumisa_Midlands groups Multistakeholder
innovation platform meeting
-Ubuhlebezwe LM flea market- participation by farmers
from Centocow and Mahhehle
-Northern Drakensberg collaborative multistakeholder
meeting in Bergville (55 participants)
1.2.6.
Indicator development for
evidence-basedindicators,
M&E and handbook
development
2023/01/30- 02/03
2023/02/02
2023/01/18
2023/02/06-10
2023/01/18
2023/02/20
2023/10/30
2024/Feb-March
Limpopo: Focus Groupdiscussions for VSLA and
microfinance for the rural poor x 3 (Turkey, Worcester,
Santeng)
Garden monitoring:
-SKZN: Plainhill, Spring Valley, Mariathal, Centocow
-EC: 5 villages
Bgvl:5 villages
CA monitoring
-EC:5 villages
-KZN: Bergville -30, Midlands 15, SKZN 15
-Livelihoods survey ~70 participants (EC, Limpopo, KZN)
-Poultry production in depth monitoring 119 participants
(EC,Limpopo,KZN)
Project no 2116ZA311
10
1.2.7.
Implementation of sustainable
water management
2023/01/03-02/03
2023/03/07
2023/03/25, 06/15
2023/04/25, 06/01,02,
06/14. 2023/Nov-Dec.
2024/01/18, 30,
2024/04/26
2024/01/24
KZN:Bergville: Stulwane –Conflict man and upgrading
sprint protection
KZN BGVl: Vimbukhalo system repair, committee meetings
EC: Nkau: Water walk and meetings for spring protection
and reticulation
KZN:Bgvl Stulwane_ Engineer visits (Alain Marechal) for
scenario developmentand follow up planning meetings
with community. Set up committee, work parties and start
on quotes and budget outline. Finalise construction.
Handover of water scheme
-Midlands:Gobizembe –water resource survey and
discussion
1.2.10.
Organisational & capacity
development
2022/11/17
2022/12/05
2023/02/13
2023/02/09, 02/16
2023/03/06
2023/03/13
2023/04/17
2023/05/26
2023/06/12
2023/07/04
2023/10/09
2023/10/16
2023/10/17
2024/02/26
-MDF AGM and organisational capacity development
workshop
-Mentoring and planning with newfinance officer to
implement SODI financial reporting system
-Internal short learning event for rainfall and runoff results,
as well as soil fertility and Organic carbon
-Mentoring in CCA workshop implementation. Temakholo
from Midlands assisted Bergville team
-Team session on gender mainstreaming
- UKZN- Ecological mapping and use of resource planning –
Bgvl team
-VSLAs review and discussion re group based rules, BLF
updates
- Nutrient analysis for livestock fodder options: facilitated
by Brigid Letty from the INR
-Small business developmentsupport planningand
Livelihoods survey
-AGM and Org capacity dev workshop
-Conservation agriculture participatory research
outcomesand presentation for CA forum with interns and
staff
-Training plan development with interns
-M&E frameworks discussion with Karen Kotschy and
team members
-Financial team: Introduction to online Sage platform
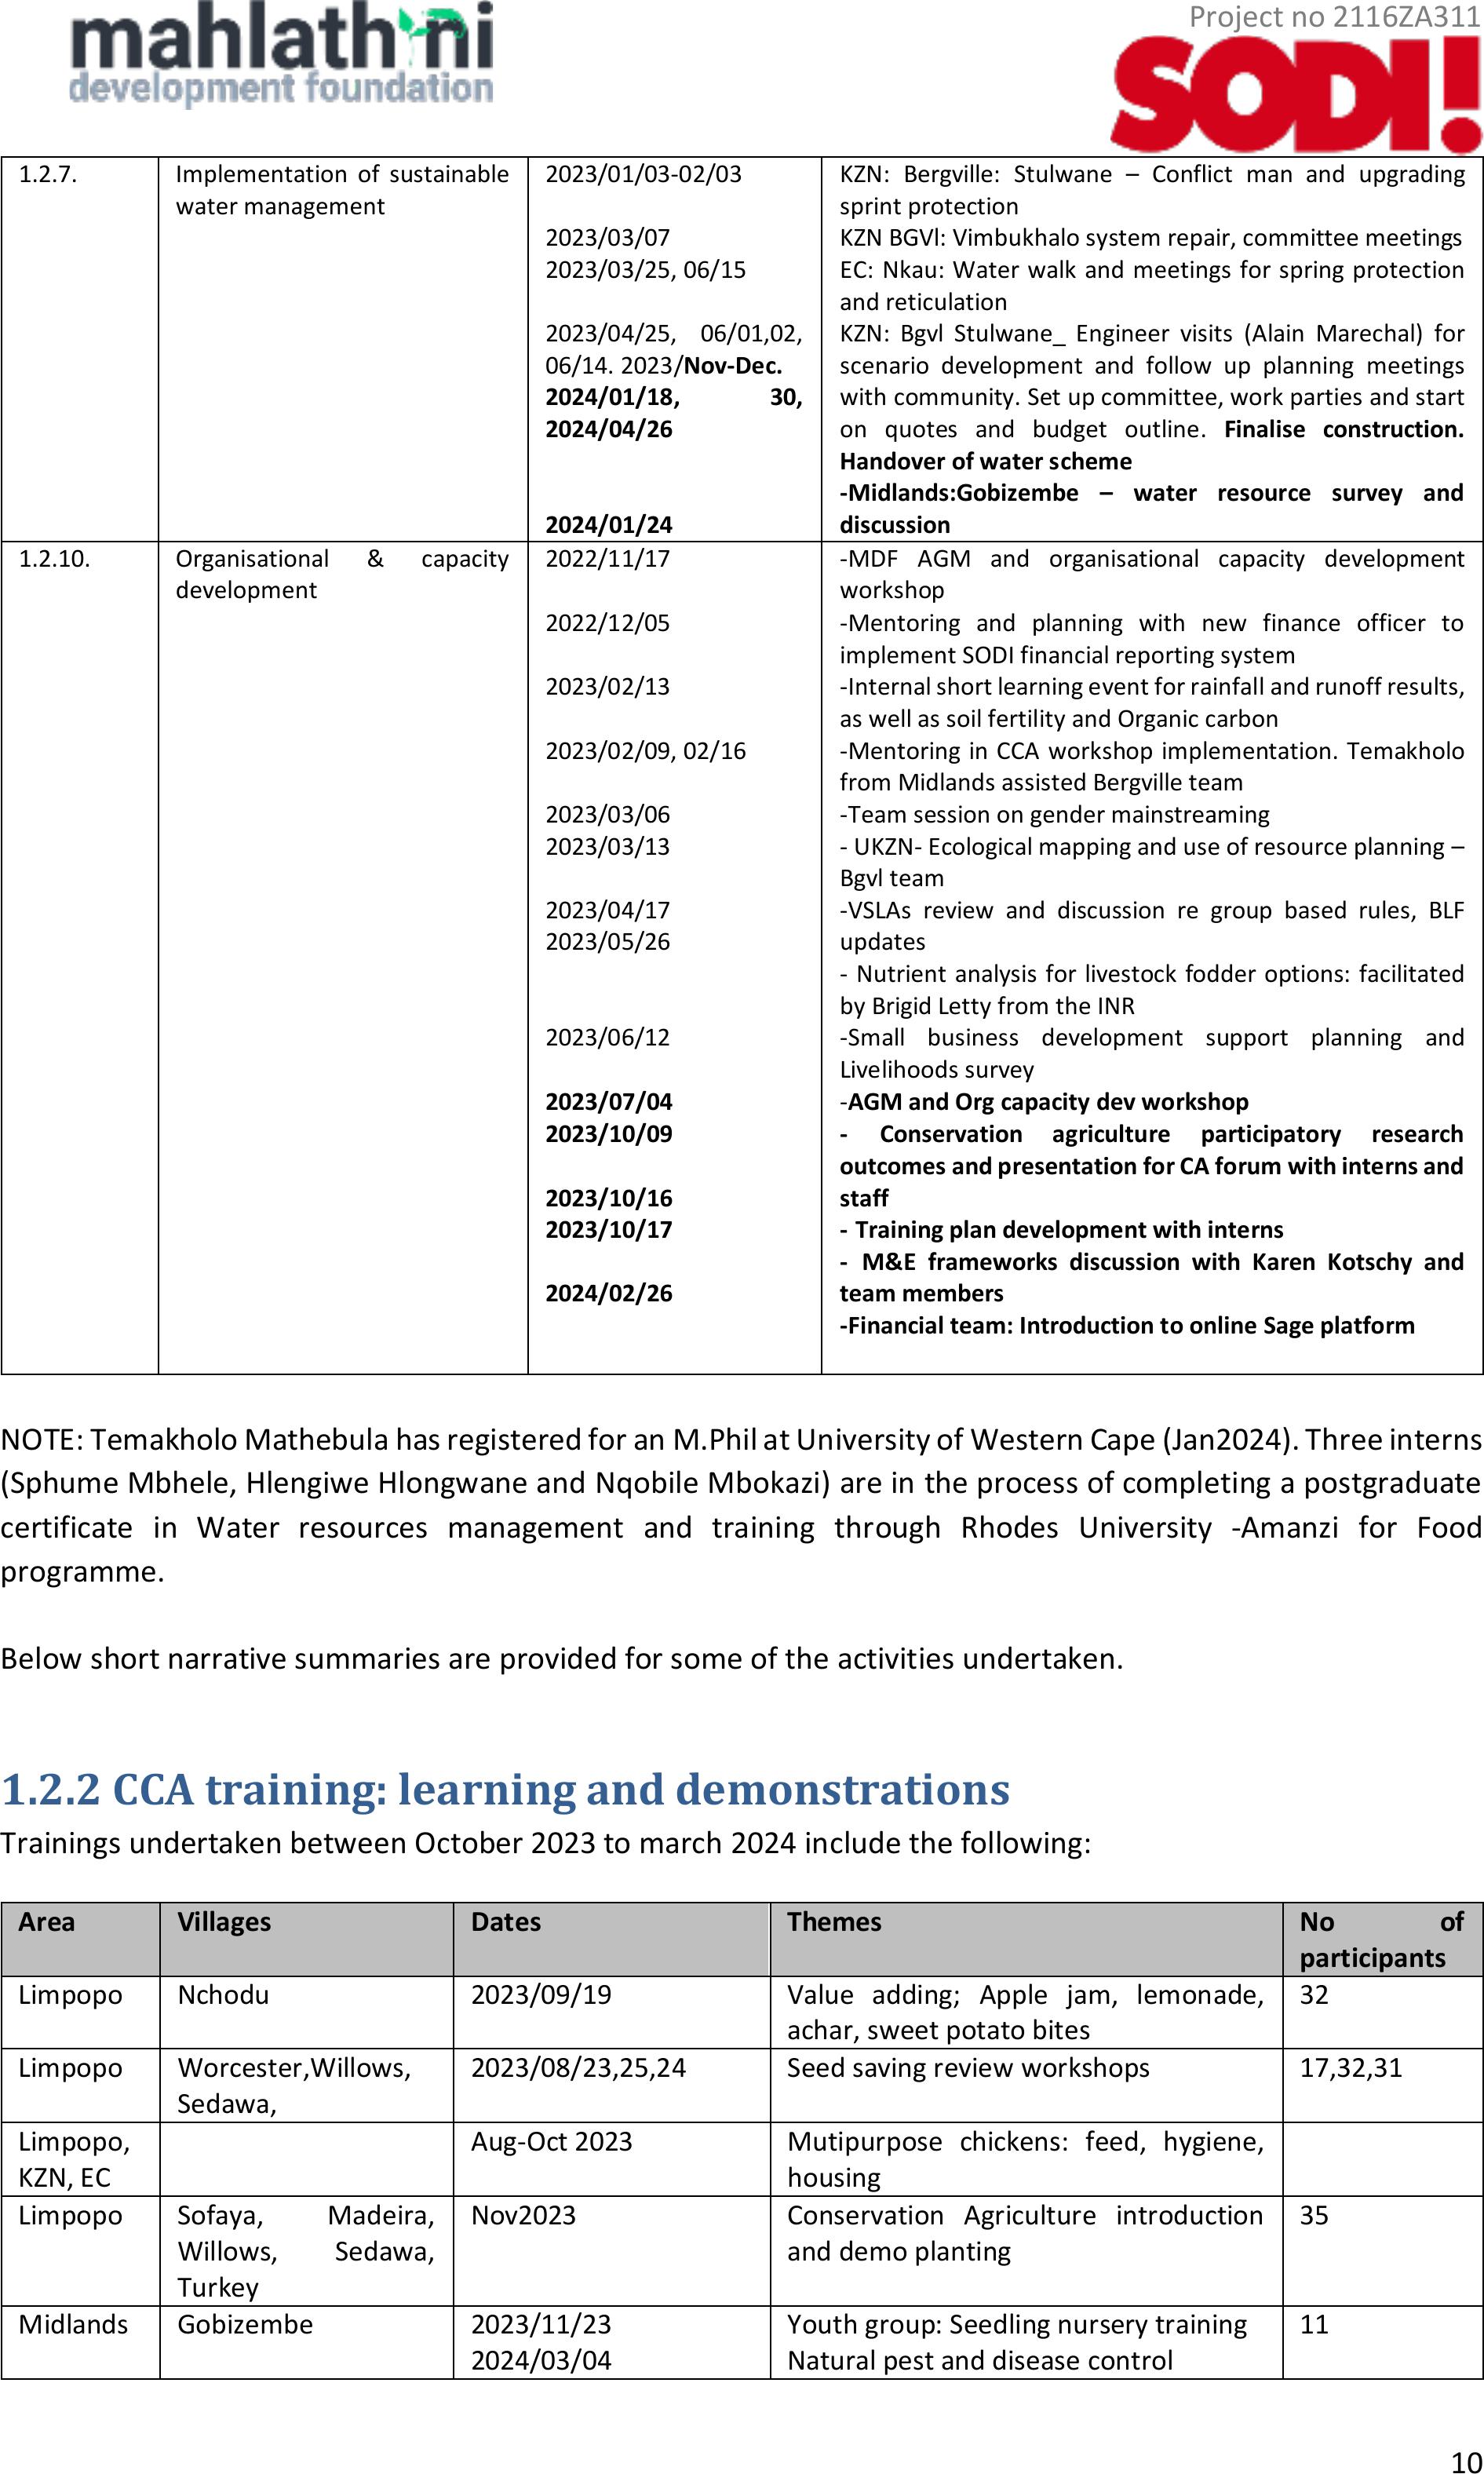
NOTE: Temakholo Mathebula has registered for an M.Phil at University of Western Cape (Jan2024). Three interns
(Sphume Mbhele, Hlengiwe Hlongwane and Nqobile Mbokazi) are in the process of completing a postgraduate
certificate in Water resources management and training through RhodesUniversity -Amanzifor Food
programme.
Below short narrative summaries are provided for some of the activities undertaken.
1.2.2 CCA training: learning and demonstrations
Trainings undertaken between October 2023 to march 2024 include the following:
Area
Villages
Dates
Themes
No of
participants
Limpopo
Nchodu
2023/09/19
Value adding; Apple jam, lemonade,
achar, sweet potato bites
32
Limpopo
Worcester,Willows,
Sedawa,
2023/08/23,25,24
Seed saving review workshops
17,32,31
Limpopo,
KZN, EC
Aug-Oct 2023
Mutipurpose chickens: feed, hygiene,
housing
Limpopo
Sofaya, Madeira,
Willows, Sedawa,
Turkey
Nov2023
Conservation Agriculture introduction
and demo planting
35
Midlands
Gobizembe
2023/11/23
2024/03/04
Youth group: Seedling nursery training
Natural pest and disease control
11

Project no 2116ZA311
11
Limpopo
Willows, Turkey,
Soaya,Sedawa
Feb 2024
2024/03/18
2024/03/26
Nutrition: vitamins and minerals, garden
and crop diversification, medicinal
herbs
18,16,24,15
Bergville
Stulwane, Eqeleni,
Eibomvini
2024/03/13-15
Local marketing for winter season
13,14,11
Limpopo
Sedawa ,Mametja,
Turkey
2024/04/04,
2024/04/16,ongoing)
Youth income and livelihoods dialogue
23,18
1.2.3 Cyclical implementation
The focus for this period has been introduction of multipurpose chickens (Boschvleders) and Conservaiton
Agircutlure for all three areas: Limpopo, KZN and EC.
Poultry production
In addition to supporting existing participants with their broiler and layer production, MDF introduced a focus
on multipurpose chickens.
Specifically for layer production, supply of point of lay hens has been very sporadic in 2022-2023. In addtion,
feed and transport prices have escalated dramatically. This has meant a substinatial reduction in participants
keeping layers. In Limpopo specifically, the rolling heatwaves has increased the mortality of layers substantially.
In addtion, there has been a number of large scale outbreaks of avian influenza/bird flue across South Africa,
which has negatively affected the industry. The trend for broilers has been similar, but not quite as severe.
A decision was thus taken to experiment with multipurose chickens as well as local production of feed rations
and cultation of crops for feeding poutlry. The intention is to assist farmers to also breed their own flocks.
The Boschvelder chickenswere bred in Limpopo in the late 1990s‘ from a combination of three indigenous
Aafrican breeds (Venda, Ovambo and Matebele). They are suitable for both meat and egg production and can
withstand extreme temperatures. The breed has inbred diseases resistance and is alert and active. It is best
suited to fee-range conditions and doesn’t do well in close confinement.
In terms of egg production they compare well with layer breeds and their production potential is on average
around 70% of that of layers. They start laying at around 18weeks of age (4eggs/hen/week) and continue to lay
for on average 2,5years. Laying declines in winter and declines sharply during molting. Hens go broody and
make excellent mothers.Roosters mature at around 12 weeks.
Boschveld Chickens in Bela-Bela, supplies Boschvelderes at various ages. Givne thier longer maturing times,
MDF has been procuring 4 week old chicks for the farmers. However they aren’t sexed yet at that age, meaning
a batch can contain many roosters. POL hens are also sold.
The small table below outlines the number of farmers who started with Boschvelders. Initially they were
provided with 10x4wk old chicks, one bag of 10kg pullet grower and 10 kg of layers mash. From there any
further orders of chickens and feed are to be managed by the farmers themselves. This is in keeping with the
strategy of supporting farmers to try out new things, to reduce the opportunity risk for them, but not to create
dependency in the longer term.
Area
No of villages
No of participants
No of 4wk old chickens (Oct 2023)
Bergville
5
39
390
Southern KZN
1
15
150
Midlands
2
30
300
Matatiele
5
40
400
Project no 2116ZA311
12
Sekororo
5
50
500
18
174
1740
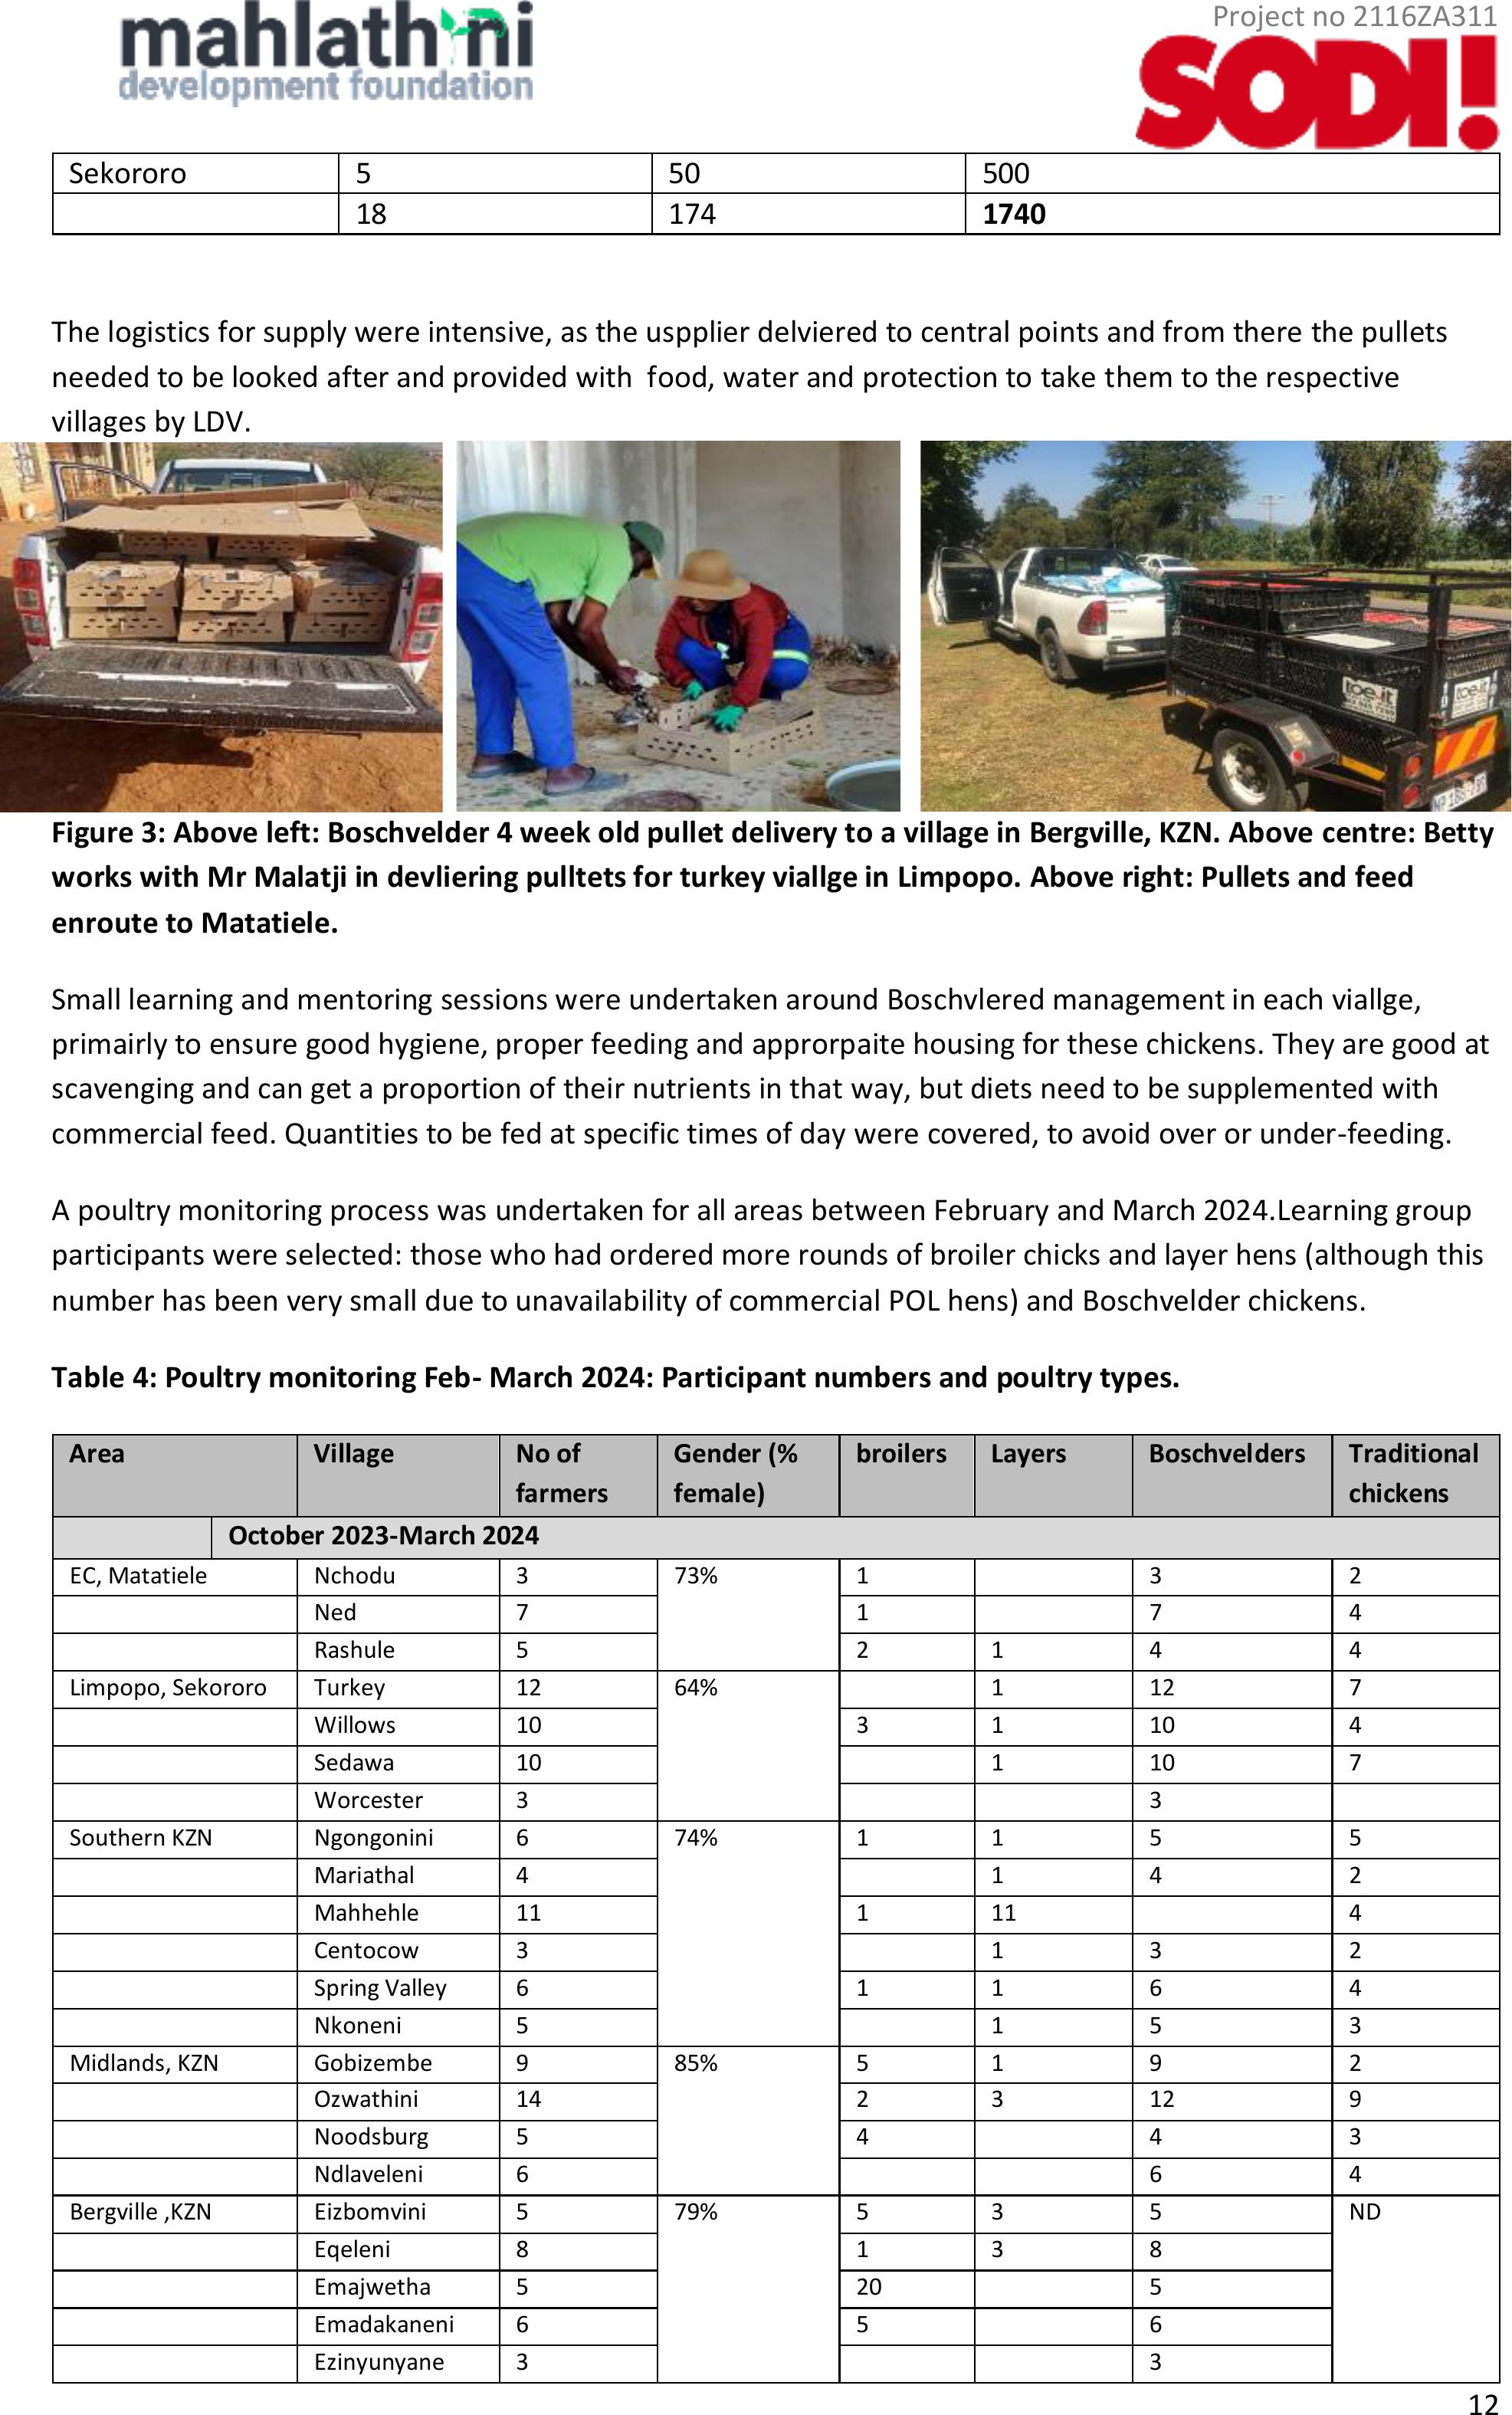
The logistics for supply were intensive, as the uspplier delviered to central points and from there the pullets
needed to be looked after and provided with food, water and protection to take them to the respective
villages by LDV.
Figure 3: Above left: Boschvelder 4 week old pullet delivery to a village in Bergville, KZN. Above centre: Betty
works with Mr Malatji in devliering pulltets for turkey viallge in Limpopo. Above right: Pullets and feed
enroute to Matatiele.
Small learning and mentoring sessions were undertaken around Boschvlered management in each viallge,
primairly to ensure good hygiene, proper feeding and approrpaite housing for these chickens. They are good at
scavenging and can get a proportion of their nutrients in that way, but diets need to be supplemented with
commercial feed. Quantities to be fed at specific times of day were covered, to avoid over or under-feeding.
A poultry monitoring process was undertaken for all areas between February and March 2024.Learning group
participants were selected: those who had ordered more rounds of broiler chicks and layer hens (although this
number has been very small due to unavailability of commercial POL hens) and Boschvelder chickens.
Table 4: Poultry monitoring Feb- March 2024: Participant numbers and poultry types.
Area
Village
No of
farmers
Gender (%
female)
broilers
Layers
Boschvelders
Traditional
chickens
October 2023-March 2024
EC, Matatiele
Nchodu
3
73%
1
3
2
Ned
7
1
7
4
Rashule
5
2
1
4
4
Limpopo, Sekororo
Turkey
12
64%
1
12
7
Willows
10
3
1
10
4
Sedawa
10
1
10
7
Worcester
3
3
Southern KZN
Ngongonini
6
74%
1
1
5
5
Mariathal
4
1
4
2
Mahhehle
11
1
11
4
Centocow
3
1
3
2
Spring Valley
6
1
1
6
4
Nkoneni
5
1
5
3
Midlands, KZN
Gobizembe
9
85%
5
1
9
2
Ozwathini
14
2
3
12
9
Noodsburg
5
4
4
3
Ndlaveleni
6
6
4
Bergville ,KZN
Eizbomvini
5
79%
5
3
5
ND
Eqeleni
8
1
3
8
Emajwetha
5
20
5
Emadakaneni
6
5
6
Ezinyunyane
3
3

Project no 2116ZA311
13
Stulwane
6
6
4
5
Vimbukhalo
5
5
Totals
157
75%
58
34
140
66
Overall, the number of participants still invovled in layer production has dwindled from 70 participants in 2022-
2023, to 34 participants in early 2024. The number of participants involved in broiler production has also
decreased substantially from 249 participants in 2022-2023 to 92 participants in early 2024. These trends are a
combination of reudced availability of chickens commercially, drastically increased prices of feed and fuel and
less expendalbe cash at household level. This was compounded by MDF’s decision to only supply bulk orders
where farmers have come together to collect their monies and ordered 1 large consignment, rather than
assisting a few individauls at a time, as was done before. The latter was a conscious decision as it became clear
that most participants were working with numbers of broilers and layers which are too small to be profitable
(<50 broilers per round and fewer than 10 layers) and that for these farmers this production was only possible
through the‘ subsidisation‘ by MDF (ordering, transport nad delviery). The plan is to move as much as possible
to multipurpose chickens, production of fodder and feed rations and home breeding to develop a local value
chain for poultry production which is more independent of commercial fluctuations and more sustainable.
Below is a suammrized anlaysis for the in-depth moniotring of the management of hte boschvlder chickens for
119 participants across Limpopo, KZN and EC.
Table 5: In-depth monitoring for Boschvelder chicken management across 4 sites.
Record keeping for Boschvelders.
Matatiele
Limpopo
SKZN
Midlands
No of farmers
14
35
23
31
Number of birds in flock
99
350
124
225
New chicks born
62
4
Mortality
7
16
80
Number of hens/rooster (Ratio)
0,9
2
1,5
0,3
No of participants selling birds
2
9
4
7
Price per bird?
R110,00
R120,00
R150,00
R130,00
No of birds sold
4
57
24
30
No slaughtered for home consumption
29
59
28
51
No of hens laying eggs
28
109
64
36
No of farmers selling eggs
2
8
8
5
Ave eggs sold/week/farmer
30
65
31,5
38
Price /egg
R3
R2
R2
R2
Ave eggs consumed/week/farmer
6
27
36
12
Ave monthly income/farmer
R580,00
R715,00
R402,00
R354,00
Ave monthly cost of consumption
R128,00
R326,00
R235,00
R226,00
Ave total income (incl consumption)
R708,00
R1 041,00
R637,00
R580,00
Ave monthly costs
R642
R456,00
R649,00
R649,00
Ave monthly'profit'
R56,00
R585,00
-R12,00
-R69,00
Feed bought no of farmers:
Maize crush only
7
1
14
10
Mix of maize crush +layers mash
5
3
1
8
Layers mash only
2
22
5
15
None
7
3
Project no 2116ZA311
14
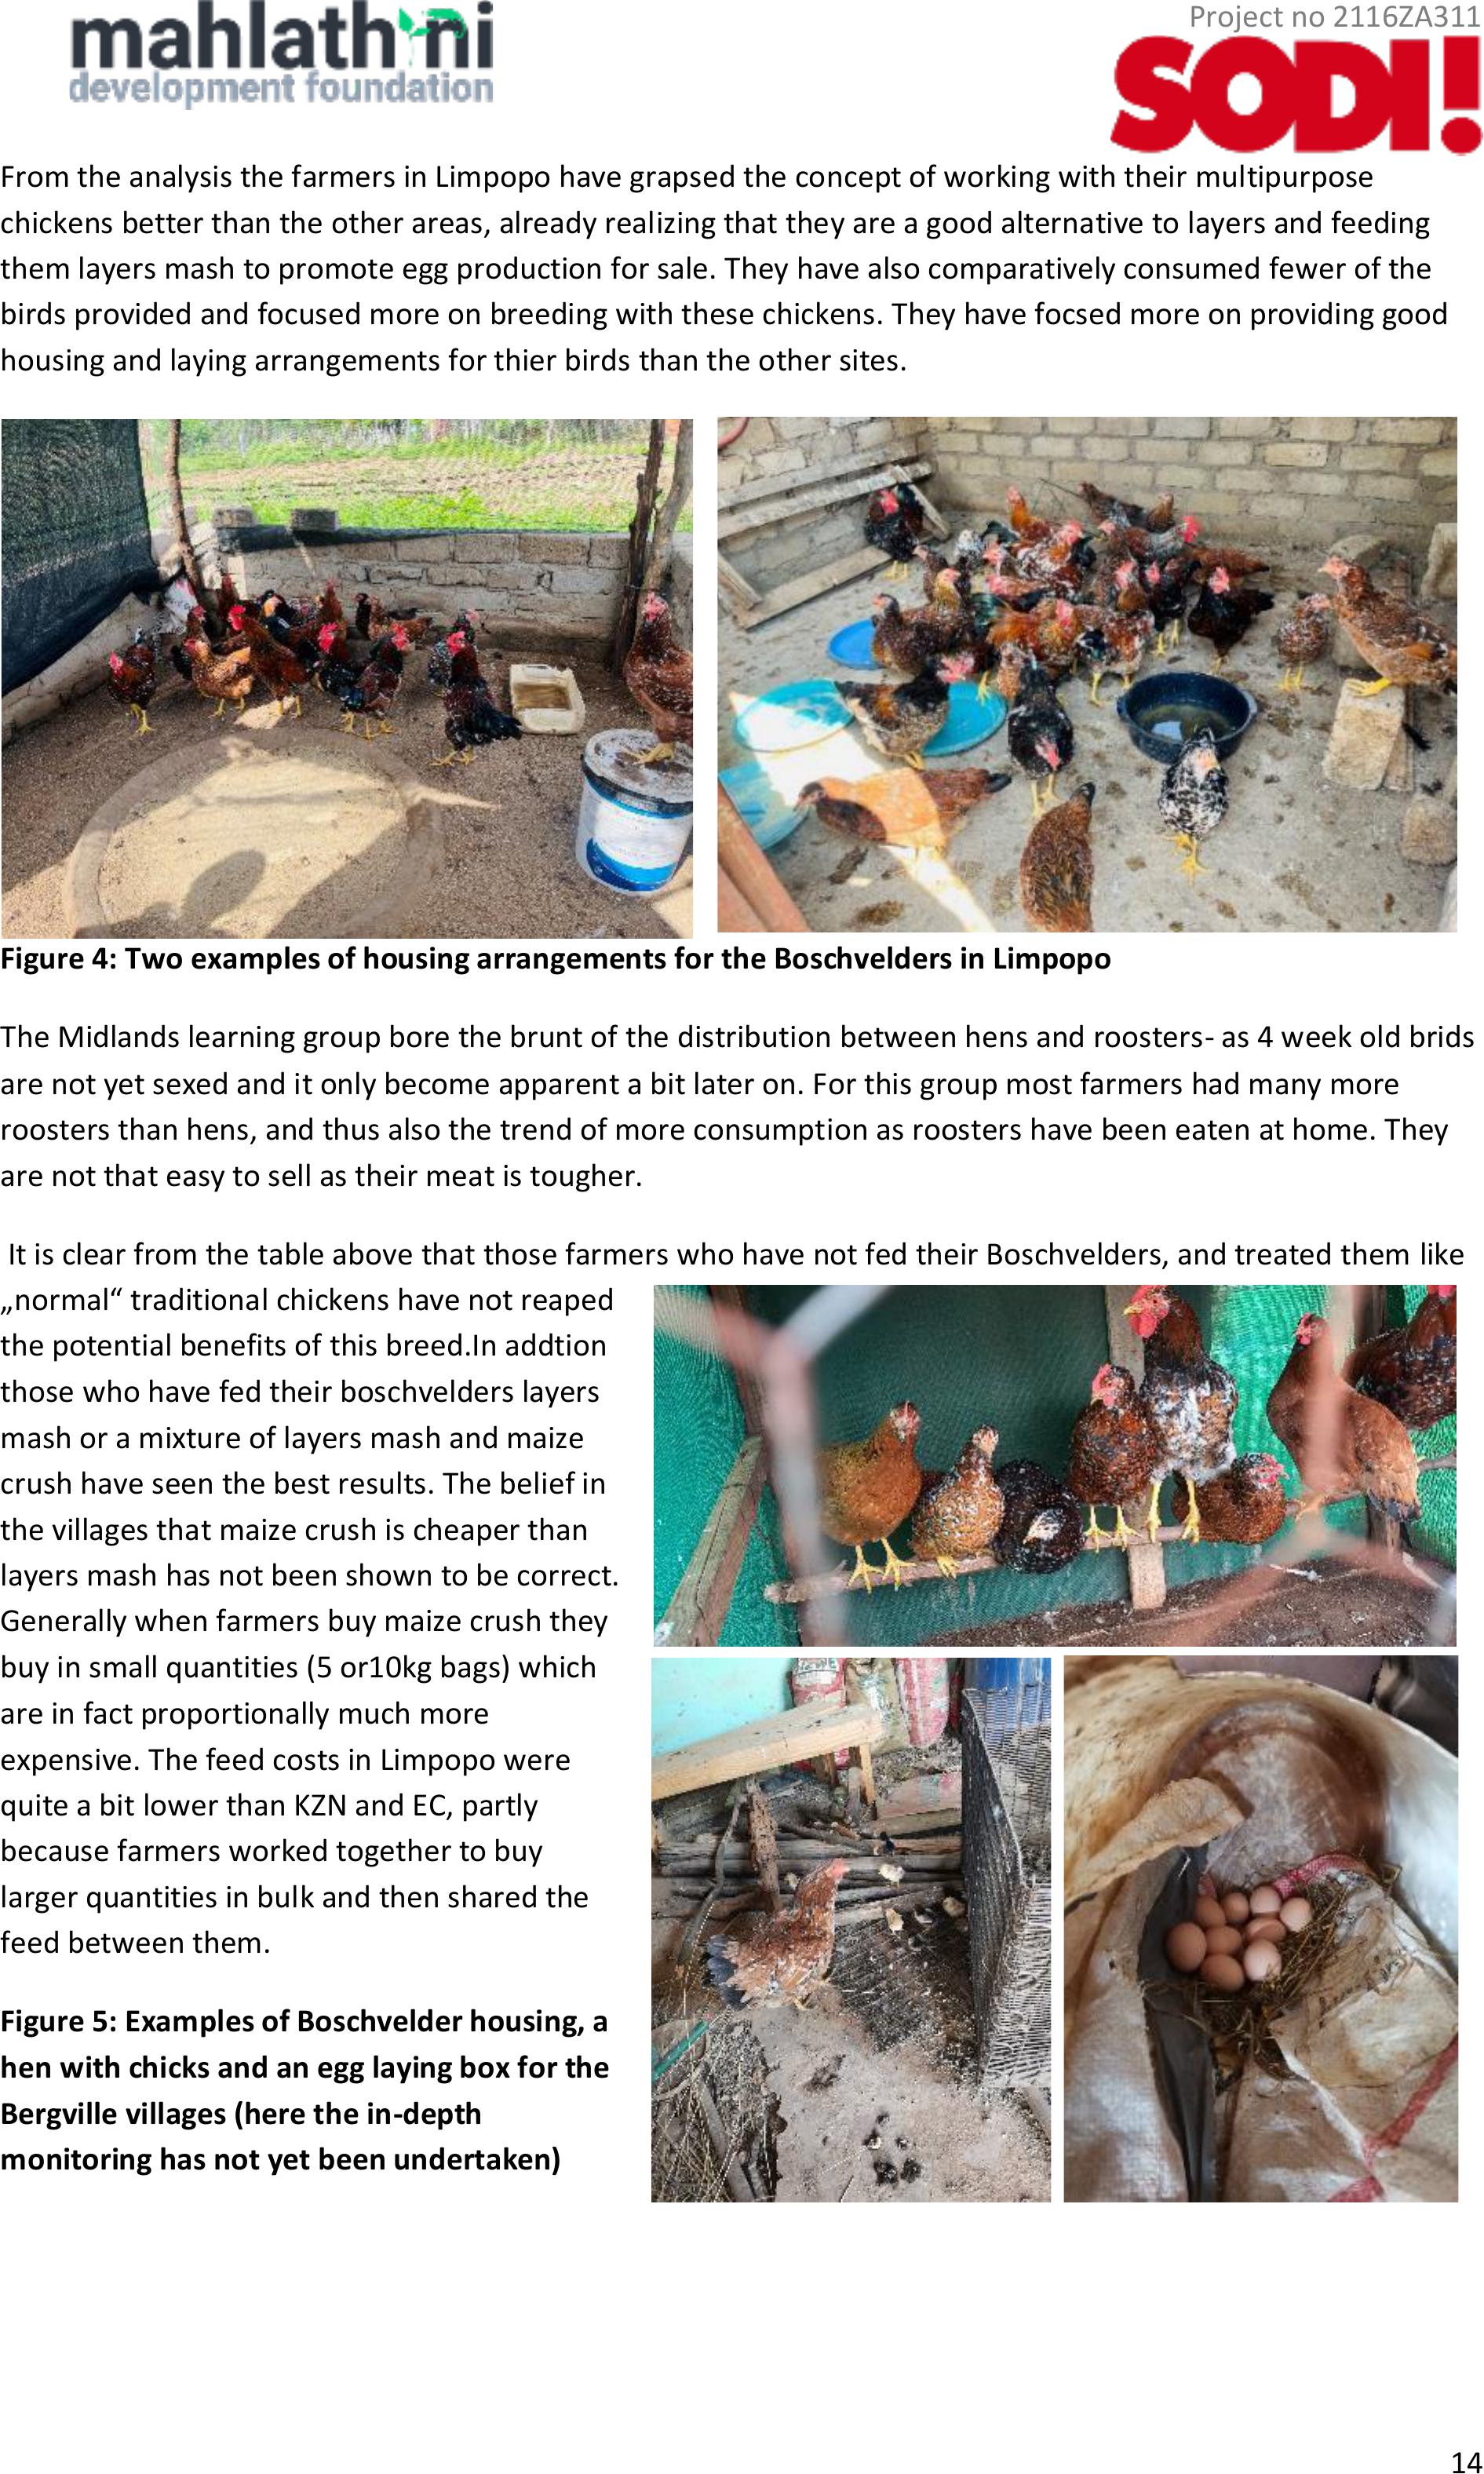
From the analysis the farmers in Limpopo have grapsed the concept of working with their multipurpose
chickens better than the other areas, already realizing that they are a good alternative to layers and feeding
them layers mash to promote egg production for sale. They have also comparatively consumed fewer of the
birds provided and focused more on breeding with these chickens. They have focsed more on providing good
housing and laying arrangements for thier birds than the other sites.
Figure 4: Two examples of housing arrangements for the Boschvelders in Limpopo
The Midlands learning group bore the brunt of the distribution between hens and roosters- as 4 week old brids
are not yet sexed and it only become apparent a bit later on. For this group most farmers had many more
roosters than hens, and thus also the trend of more consumption as roosters have been eaten at home. They
are not that easy to sell as their meat is tougher.
It is clear from the table above that those farmers who have not fed their Boschvelders, and treated them like
„normal“ traditional chickens have not reaped
the potential benefits of this breed.In addtion
those who have fed their boschvelders layers
mash or a mixture of layers mash and maize
crush have seen the best results. The belief in
the villages that maize crush is cheaper than
layers mash has not been shown to be correct.
Generally when farmers buy maize crush they
buy in small quantities (5 or10kg bags) which
are in fact proportionally much more
expensive. The feed costs in Limpopo were
quite a bit lower than KZN and EC, partly
because farmers worked together to buy
larger quantities in bulk and then shared the
feed between them.
Figure 5: Examples of Boschvelder housing, a
hen with chicks and an egg laying box for the
Bergville villages (here the in-depth
monitoring has not yet been undertaken)

Project no 2116ZA311
15
Conservation Agriculture
For this season Conservaiton Agircuture interventions focused in Matatiele Limpopo and Bergville. It was
decided not to pursue this activity in Southern KZN or Midlands that actively as farmers‘ uptake of the practise
in these areas has been very patchy. It is in the regions where climate change has had the greatest impacts,
where uptake of CA has also been alot more consisten. Farmers have realized that thier potential procution
and yeidls without a different farming practise has become very low and danger of complete crop failure has
been high.
In limpopo the emaphsis was on farmers who could supply supplementary irrigation for their CA tirals, given
that dryand cropping in this region has led to crop failures for 5 consecutive years. The focus was thus on
Willows (at homestead level), madiera and Soafya (both homestead and irrigated field level).
The CA experiments consisted of 3 plots/strips (Maize+cowpeas, maize+SCC mix , bird resistant sorghum)) with
1 control plot of maize. The Summer cover crop mix consisted of sunflower, sunnhemp and fodder sorghum).
Farmers were also provided with fodder seeds to plant. In Willwos most the farmers didn’t plant the fodder as
december and January were extremely hot, with very little rain, depsite having irrigation. Their arugment was
that germination under these conditions is very difficult.
Figure 6: Growthot the M+Cp, M+SCC and Brid resistant sorghum plots for Syllus Malepe in Willows
Figure 7: Above left: Bird resistn sorghum planted by Mrs Mogofane Shai in Willows, Above centre and right:
Sunhemp and lucrene planted by maria Mathipa.
In Sofaya, this was thei first season of CA epxerimentation for this new group. Unfrotunately the large plot
planted in thier irrigation shceme was not weeded and was evnetually lost ot the weeds. A few of the farmers
did very well with thier homestead plots. Most of the farmers did not follow the instructions well, but thier
efforts have shown promise for a more concerted effort in the upcoming season.
Project no 2116ZA311
16
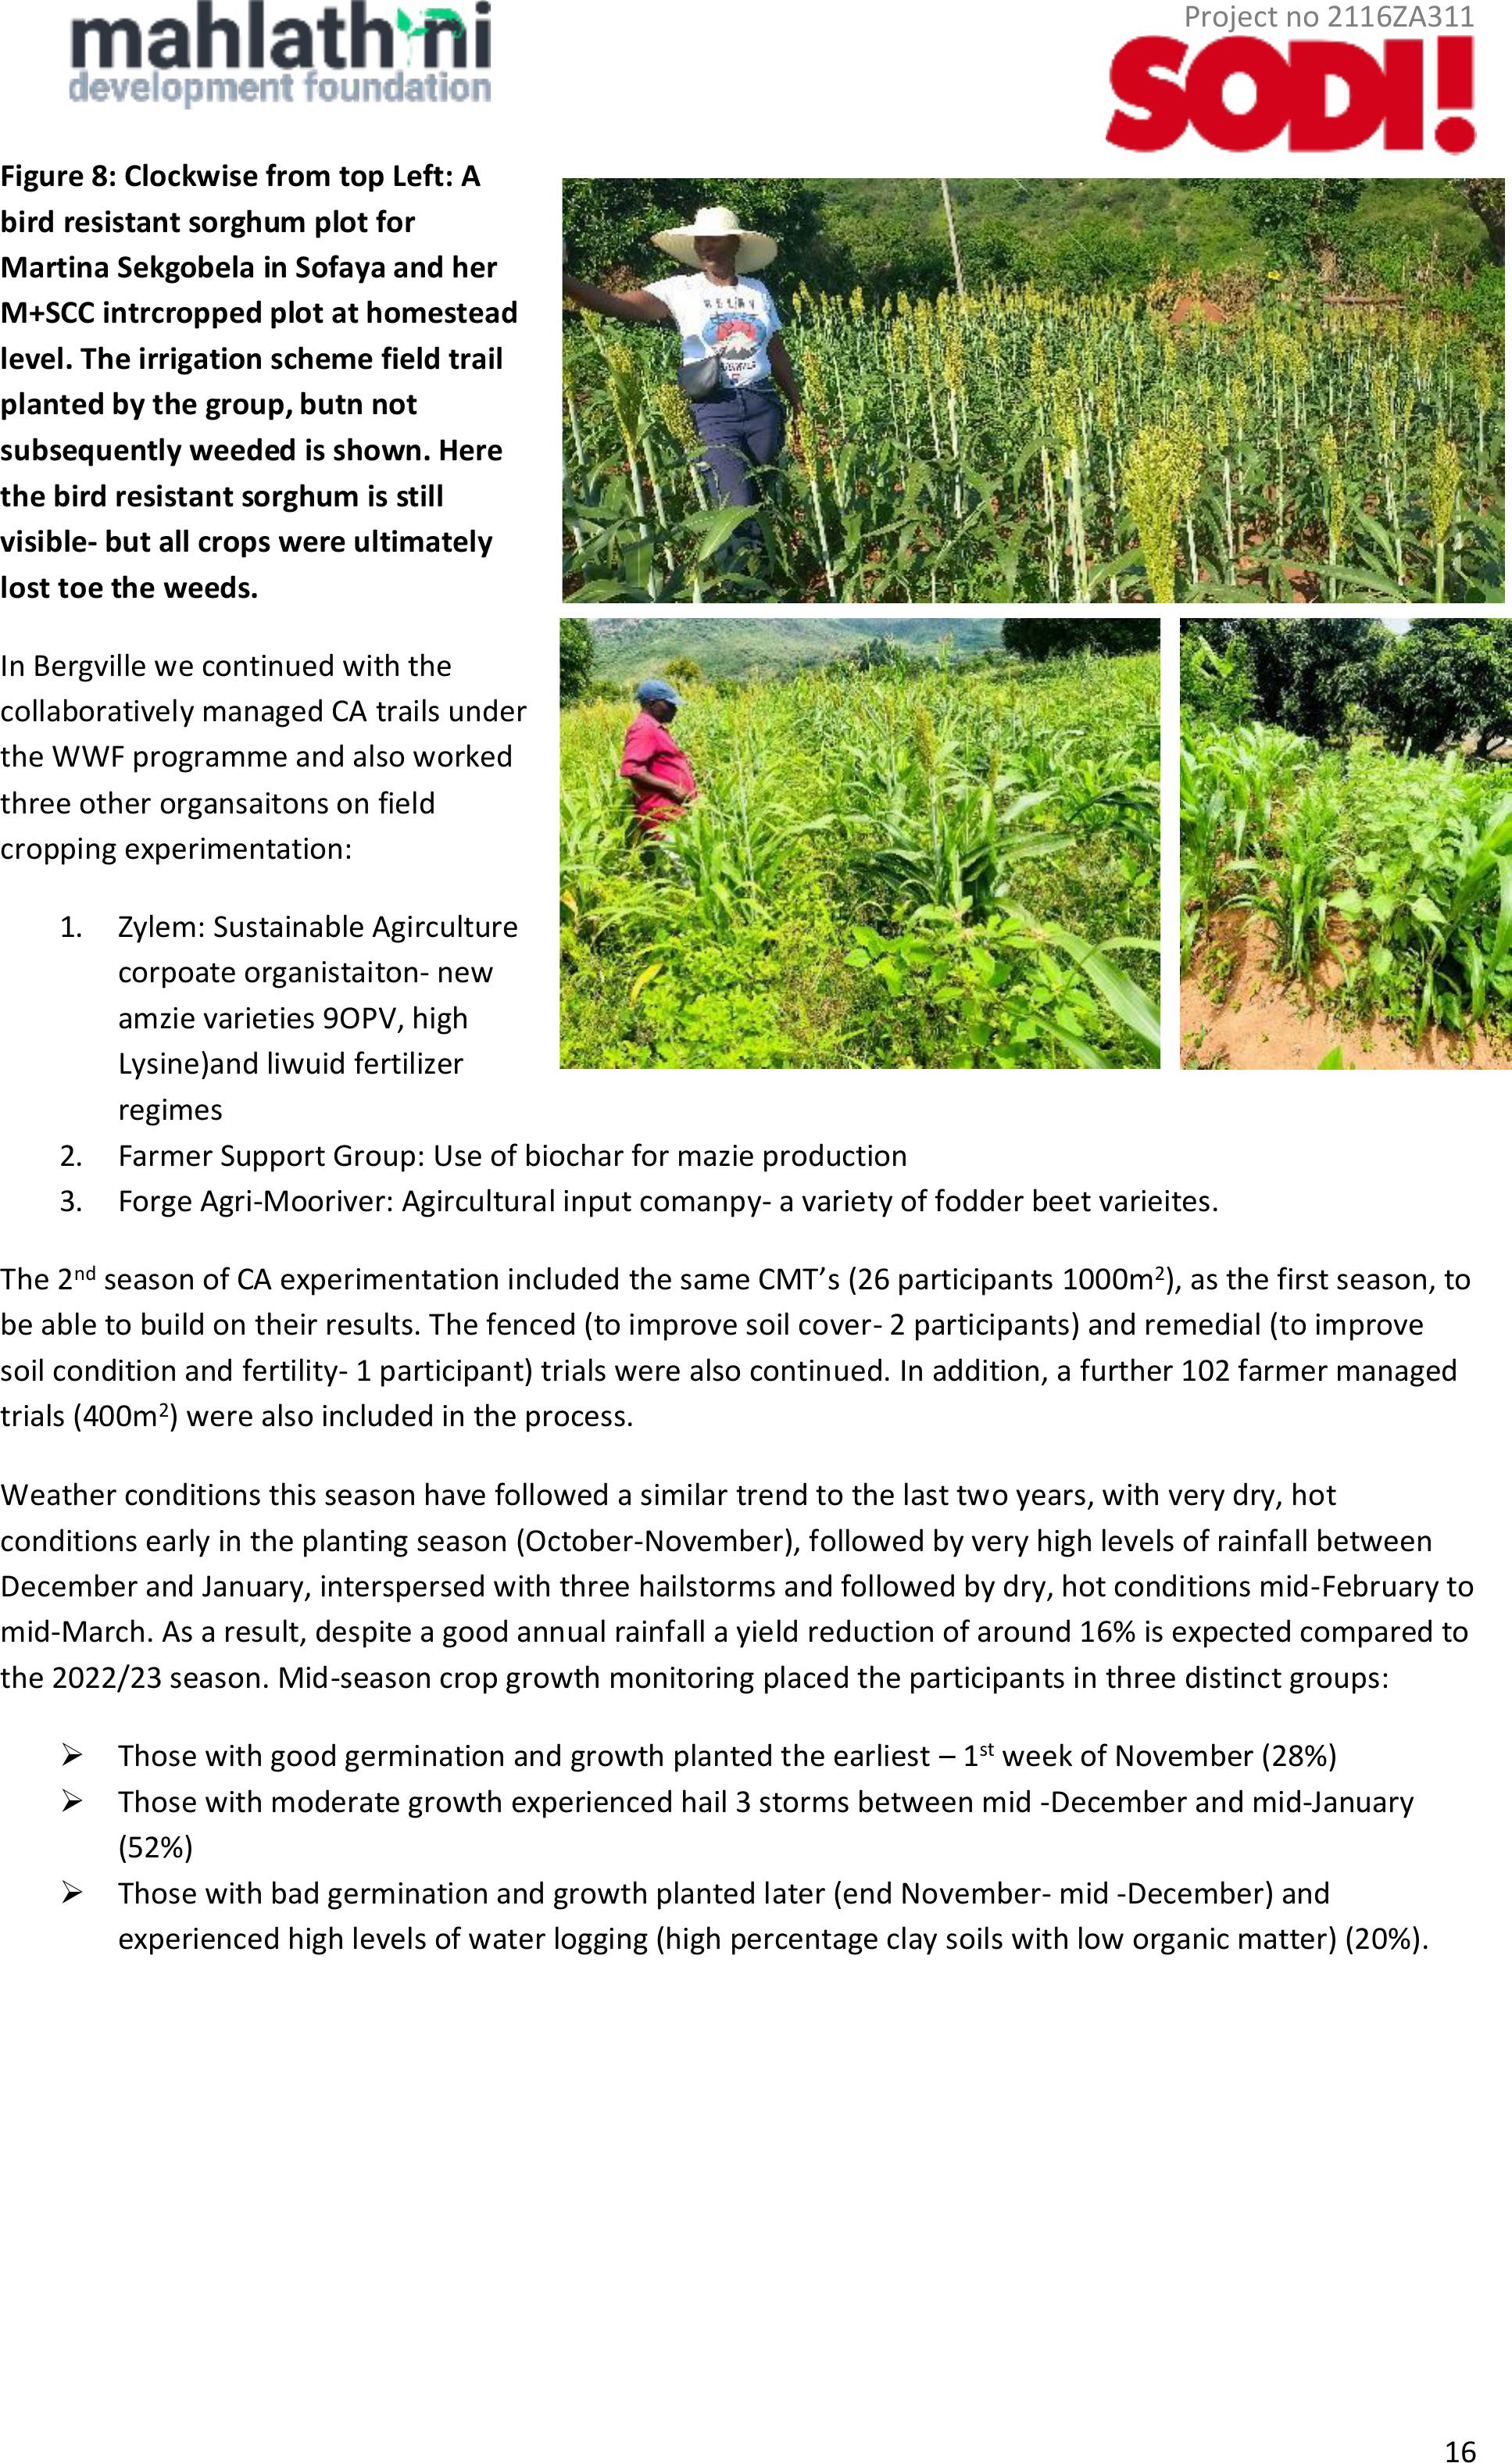
Figure 8: Clockwise from top Left: A
bird resistant sorghum plot for
Martina Sekgobela in Sofaya and her
M+SCC intrcroppedplot at homestead
level. The irrigation scheme field trail
planted by the group, butn not
subsequently weeded is shown. Here
the bird resistant sorghum is still
visible- but all crops were ultimately
lost toe the weeds.
In Bergville we continued with the
collaboratively managed CA trails under
the WWF programme and also worked
three other organsaitons on field
cropping experimentation:
1.Zylem: Sustainable Agirculture
corpoate organistaiton- new
amzie varieties 9OPV, high
Lysine)and liwuid fertilizer
regimes
2.Farmer Support Group: Use of biochar for mazie production
3.Forge Agri-Mooriver: Agircultural input comanpy- a variety of fodder beet varieites.
The 2ndseason of CA experimentation included the same CMT’s (26 participants 1000m2), as the first season, to
be able to build on their results. The fenced (to improve soil cover- 2 participants) and remedial (to improve
soil condition and fertility- 1 participant) trials were also continued. In addition, a further 102 farmer managed
trials (400m2) were also included in the process.
Weather conditions this season have followed a similar trend to the last two years, with very dry, hot
conditions early in the planting season (October-November), followed by very high levels of rainfall between
December and January, interspersed with three hailstorms and followed by dry, hot conditions mid-February to
mid-March. As a result, despite a good annual rainfall a yield reduction of around 16% is expected compared to
the 2022/23 season. Mid-season crop growth monitoring placed the participants in three distinct groups:
➢Those with good germination and growth planted the earliest – 1st week of November (28%)
➢Those with moderate growth experienced hail 3 storms between mid -December and mid-January
(52%)
➢Those with bad germination and growth planted later (end November- mid -December) and
experienced high levels of water logging (high percentage clay soils with low organic matter) (20%).
Project no 2116ZA311
17
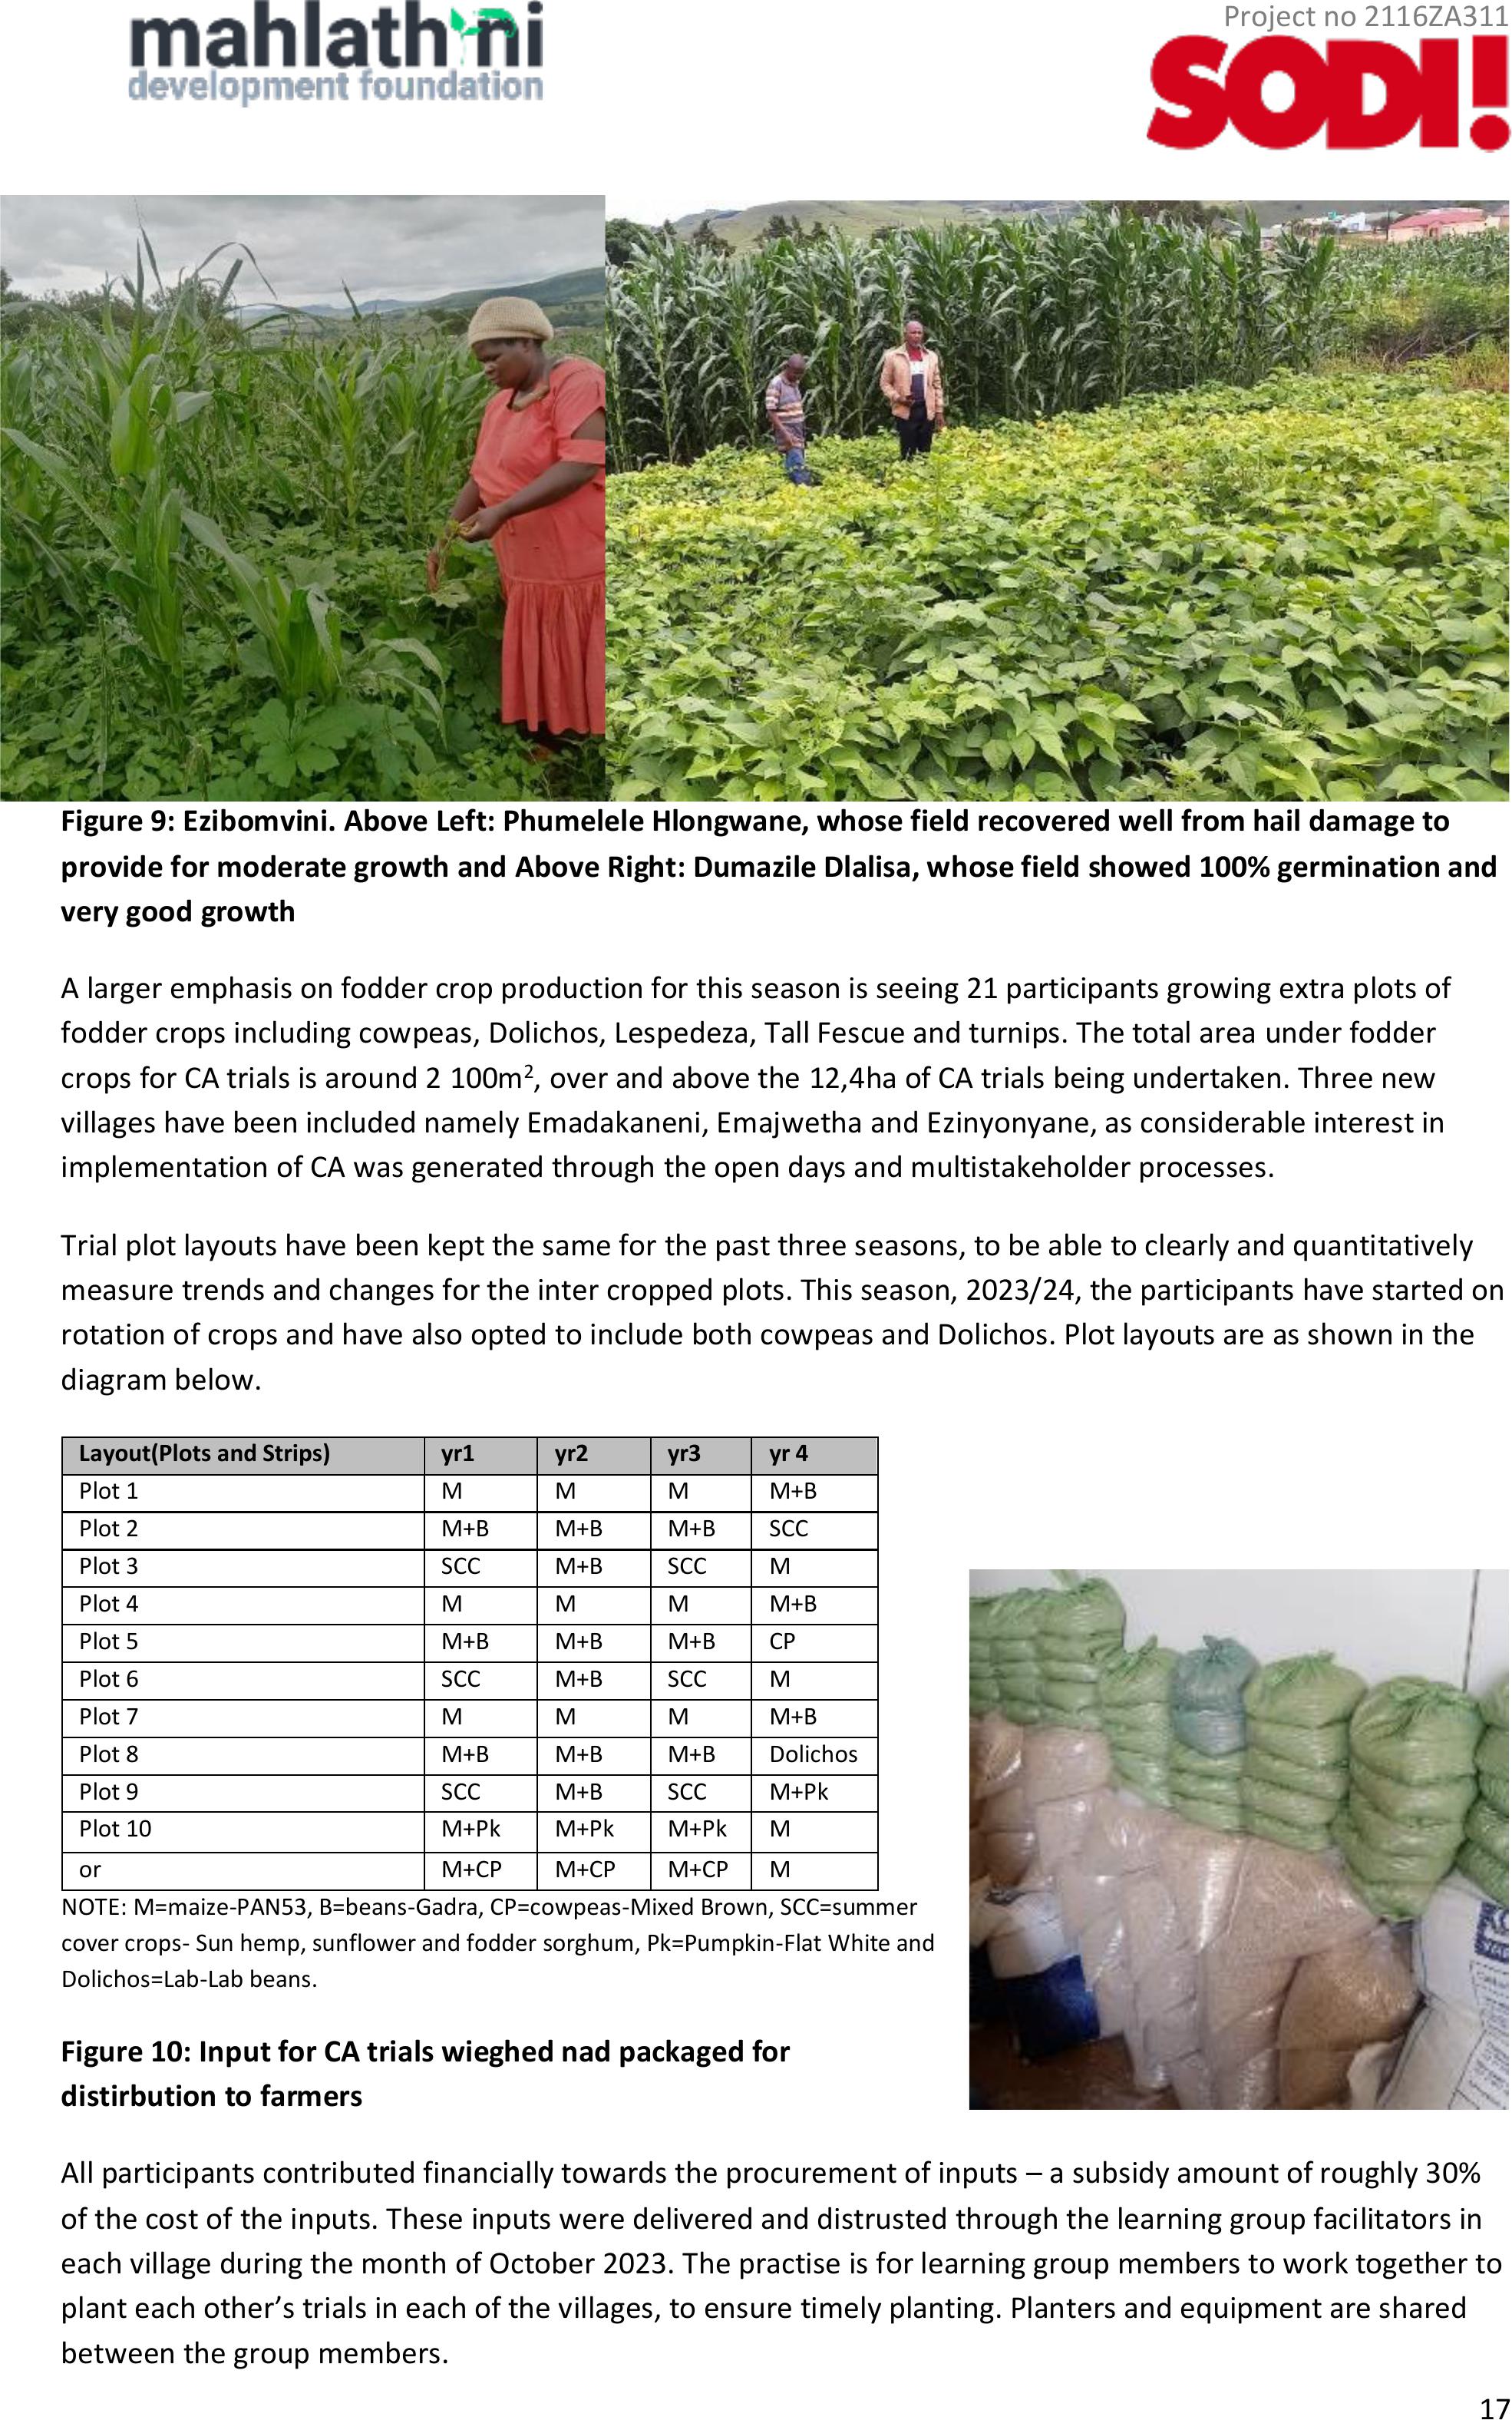
Figure 9: Ezibomvini. Above Left: Phumelele Hlongwane, whose field recoveredwell from hail damage to
provide for moderate growth and Above Right: Dumazile Dlalisa, whose field showed 100% germination and
very good growth
A larger emphasis on fodder crop production for this season is seeing 21 participants growing extra plots of
fodder crops including cowpeas, Dolichos, Lespedeza, Tall Fescue and turnips. The total area under fodder
crops for CA trials is around 2 100m2, over and above the 12,4ha of CA trials being undertaken. Three new
villages have been included namely Emadakaneni, Emajwetha and Ezinyonyane, as considerable interest in
implementation of CA was generated through the open days and multistakeholder processes.
Trial plot layouts have been kept the same for the past three seasons, to be able to clearly and quantitatively
measure trends and changes for the inter cropped plots. This season, 2023/24, the participants have started on
rotation of crops and have also opted to include both cowpeas and Dolichos. Plot layouts are as shown in the
diagram below.
Layout(Plots and Strips)
yr1
yr2
yr3
yr 4
Plot 1
M
M
M
M+B
Plot 2
M+B
M+B
M+B
SCC
Plot 3
SCC
M+B
SCC
M
Plot 4
M
M
M
M+B
Plot 5
M+B
M+B
M+B
CP
Plot 6
SCC
M+B
SCC
M
Plot 7
M
M
M
M+B
Plot 8
M+B
M+B
M+B
Dolichos
Plot 9
SCC
M+B
SCC
M+Pk
Plot 10
M+Pk
M+Pk
M+Pk
M
or
M+CP
M+CP
M+CP
M
NOTE: M=maize-PAN53, B=beans-Gadra, CP=cowpeas-Mixed Brown, SCC=summer
cover crops- Sun hemp, sunflower and fodder sorghum, Pk=Pumpkin-Flat White and
Dolichos=Lab-Lab beans.
Figure 10: Input for CA trials wieghed nad packaged for
distirbution to farmers
All participants contributed financially towards the procurement of inputs – a subsidy amount of roughly 30%
of the cost of the inputs. These inputs were delivered and distrusted through the learning group facilitators in
each village during the month of October 2023. The practise is for learning group members to work together to
plant each other’s trials in each of the villages, to ensure timely planting. Planters and equipment are shared
between the group members.

Project no 2116ZA311
18
Fodder production and supplementation.
This aspect introduces farmer level experimentation in the production of fodder crops for both cut and carry
options and in situ grazing as well as a fodder us0plementation process, linked to cutting and baling of veld
grass for the winter season. The number of participants for this aspect is reasonably small, with 11 participants
in 2023/23 and 15 participants in 2023/24.
Table 6: Fodder planting participants, crops planted and date of planting.
Villages
Name and surname
Size (m2)
Crops
Planting dates
Stulwane
Nelisiwe Msele
400
Scc and cow peas
15/12/2023
Nothile Zondi
800
Lespedeza, sorghum, turnip, cow peas, tall fescue
02/12/2023
Thulani Dlamini
800
Turnip, sorghum, lespedeza, tall fescue
04/12/2023
Khulekani Dladla
420
400
Pan 5A 190 (short season maize hybrid), tall fescue,
lespedeza, turnip, sorghum, cow peas
Old lespedeza, cow peas, Scc
05/12/2023
09/12/2023
Dumephi Hadebe
200
Cow peas, sorghum, turnip and tall fescue
12/12/2023
Emajwetha
Lungile Dladla
200
Tall fescue, cow peas, sorghum
28/11/2023
Bukiwe Mlambo
400
Sorghum, cow peas, turnip, tall fescue and lespedeza
28/12/2023
Simephi Hlatshwayo
140
Cow peas, sorghum
06/12/0023
Eqeleni
Tholwephi Mabaso
400
Cow peas, sorghum, cow peas
07/12/2023
Nomusa Hlongwane
400
Cow peas, sorghum and Scc
12/12/2023
Balungile Sishi
200
Cow peas, sorghum, Scc
12/12/2023
Ntombakhe Zikode
216
Lespedeza, tall fescue, turnip, sorghum, cow peas
08/12/2023
Sizeni Dlamini
Damaged by hail
Mthokosizi Shange
200
Lespedeza, turnip, cow peas
14/12/2023
Ezibomvini
Bongani Phakathi
720
Scc, cow peas and sorghum
12/12/2023
Note 1: The Sorghum planted was a specialised bird resistant variety.
Note 2: 10 of the 15 farmers planted the fodder and cover crops in strips intercropped with the Zylem regenZ maize varieties.
Monitoring of the fodder crop trials showed a range of germination and growth:
➢Good germination, weeding and growth (33%)
➢Good germination, but late weeding and average growth (45%)
➢Little to no growth- lack of weeding and water logging (20%)
➢
Figure 11: Clockwise from top left: Bird resistant
sorghum and old and new plantings of Lespedeza
at Khulekani Dladla (Stulwane) and a Zylem maize variety trials and summer cover crop strip cropping plot at
Sthabiso Manyathi (Eqeleni).

Project no 2116ZA311
19
1.2.4 Indicator development, Monitoring and evaluation.
To date, informal monitoring has taken place. An arrangement has been put in place with Karen Kotschy, an
M&E specialist, to assist in the process of indicator and handbook development. Below is her latest submsision
around strengthening of thetheorietical framework and development ofan indicator set for the resilience
snapshots
Revision of farmer-level resilience indicators for Mahlathini Development Foundation
By Karen Kotschy, 3 December 2023
1. Introduction
Mahlathini Development Foundation (MDF) has spent manyyearsdeveloping and refining various tools for
monitoring and evaluating their work of building resilience among smallholder farmers. These tools are varied
and are used for different purposes and on different time scales, for example:
•Baseline assessments are once-off assessments of farming practices used when working in an area for
the first time.
•Regular farmer monitoring forms are used for monitoring various aspects, atdifferent frequencies(e.g.
savings groups are monitored monthly but poultry only every 6 months).
•Seasonal reviews are done together with farmers to assess changes and benefits.
•Participatory impact assessments are done by farmers infocus groups on a less frequent basis(e.g.
every few years).
•Livelihood surveys are also carried out occasionally.
•Research projects sometimes provide opportunities for more in-depth monitoring orfocused case
studies.
•The “Resilience Snapshot” tool is used to provide a summary of resilience, either annually or at the end
of a project. It is based on a questionnaire for farmers as well as bringing together data from some of
the other sources mentioned above. Farmers are asked to compare their current situation and farming
practices to their situation and practices before they started working with MDF, to see whether
resilience has indeed increased as intended.
MDF requested assistance to strengthen and further develop the Resilience Snapshot so that it is more strongly
tied to resilience theory and more generalisable across agro-ecological zones and hierarchical levels.
MDF conceptualizes climate change adaptation for smallholder farmers through climate-resilient agriculture or
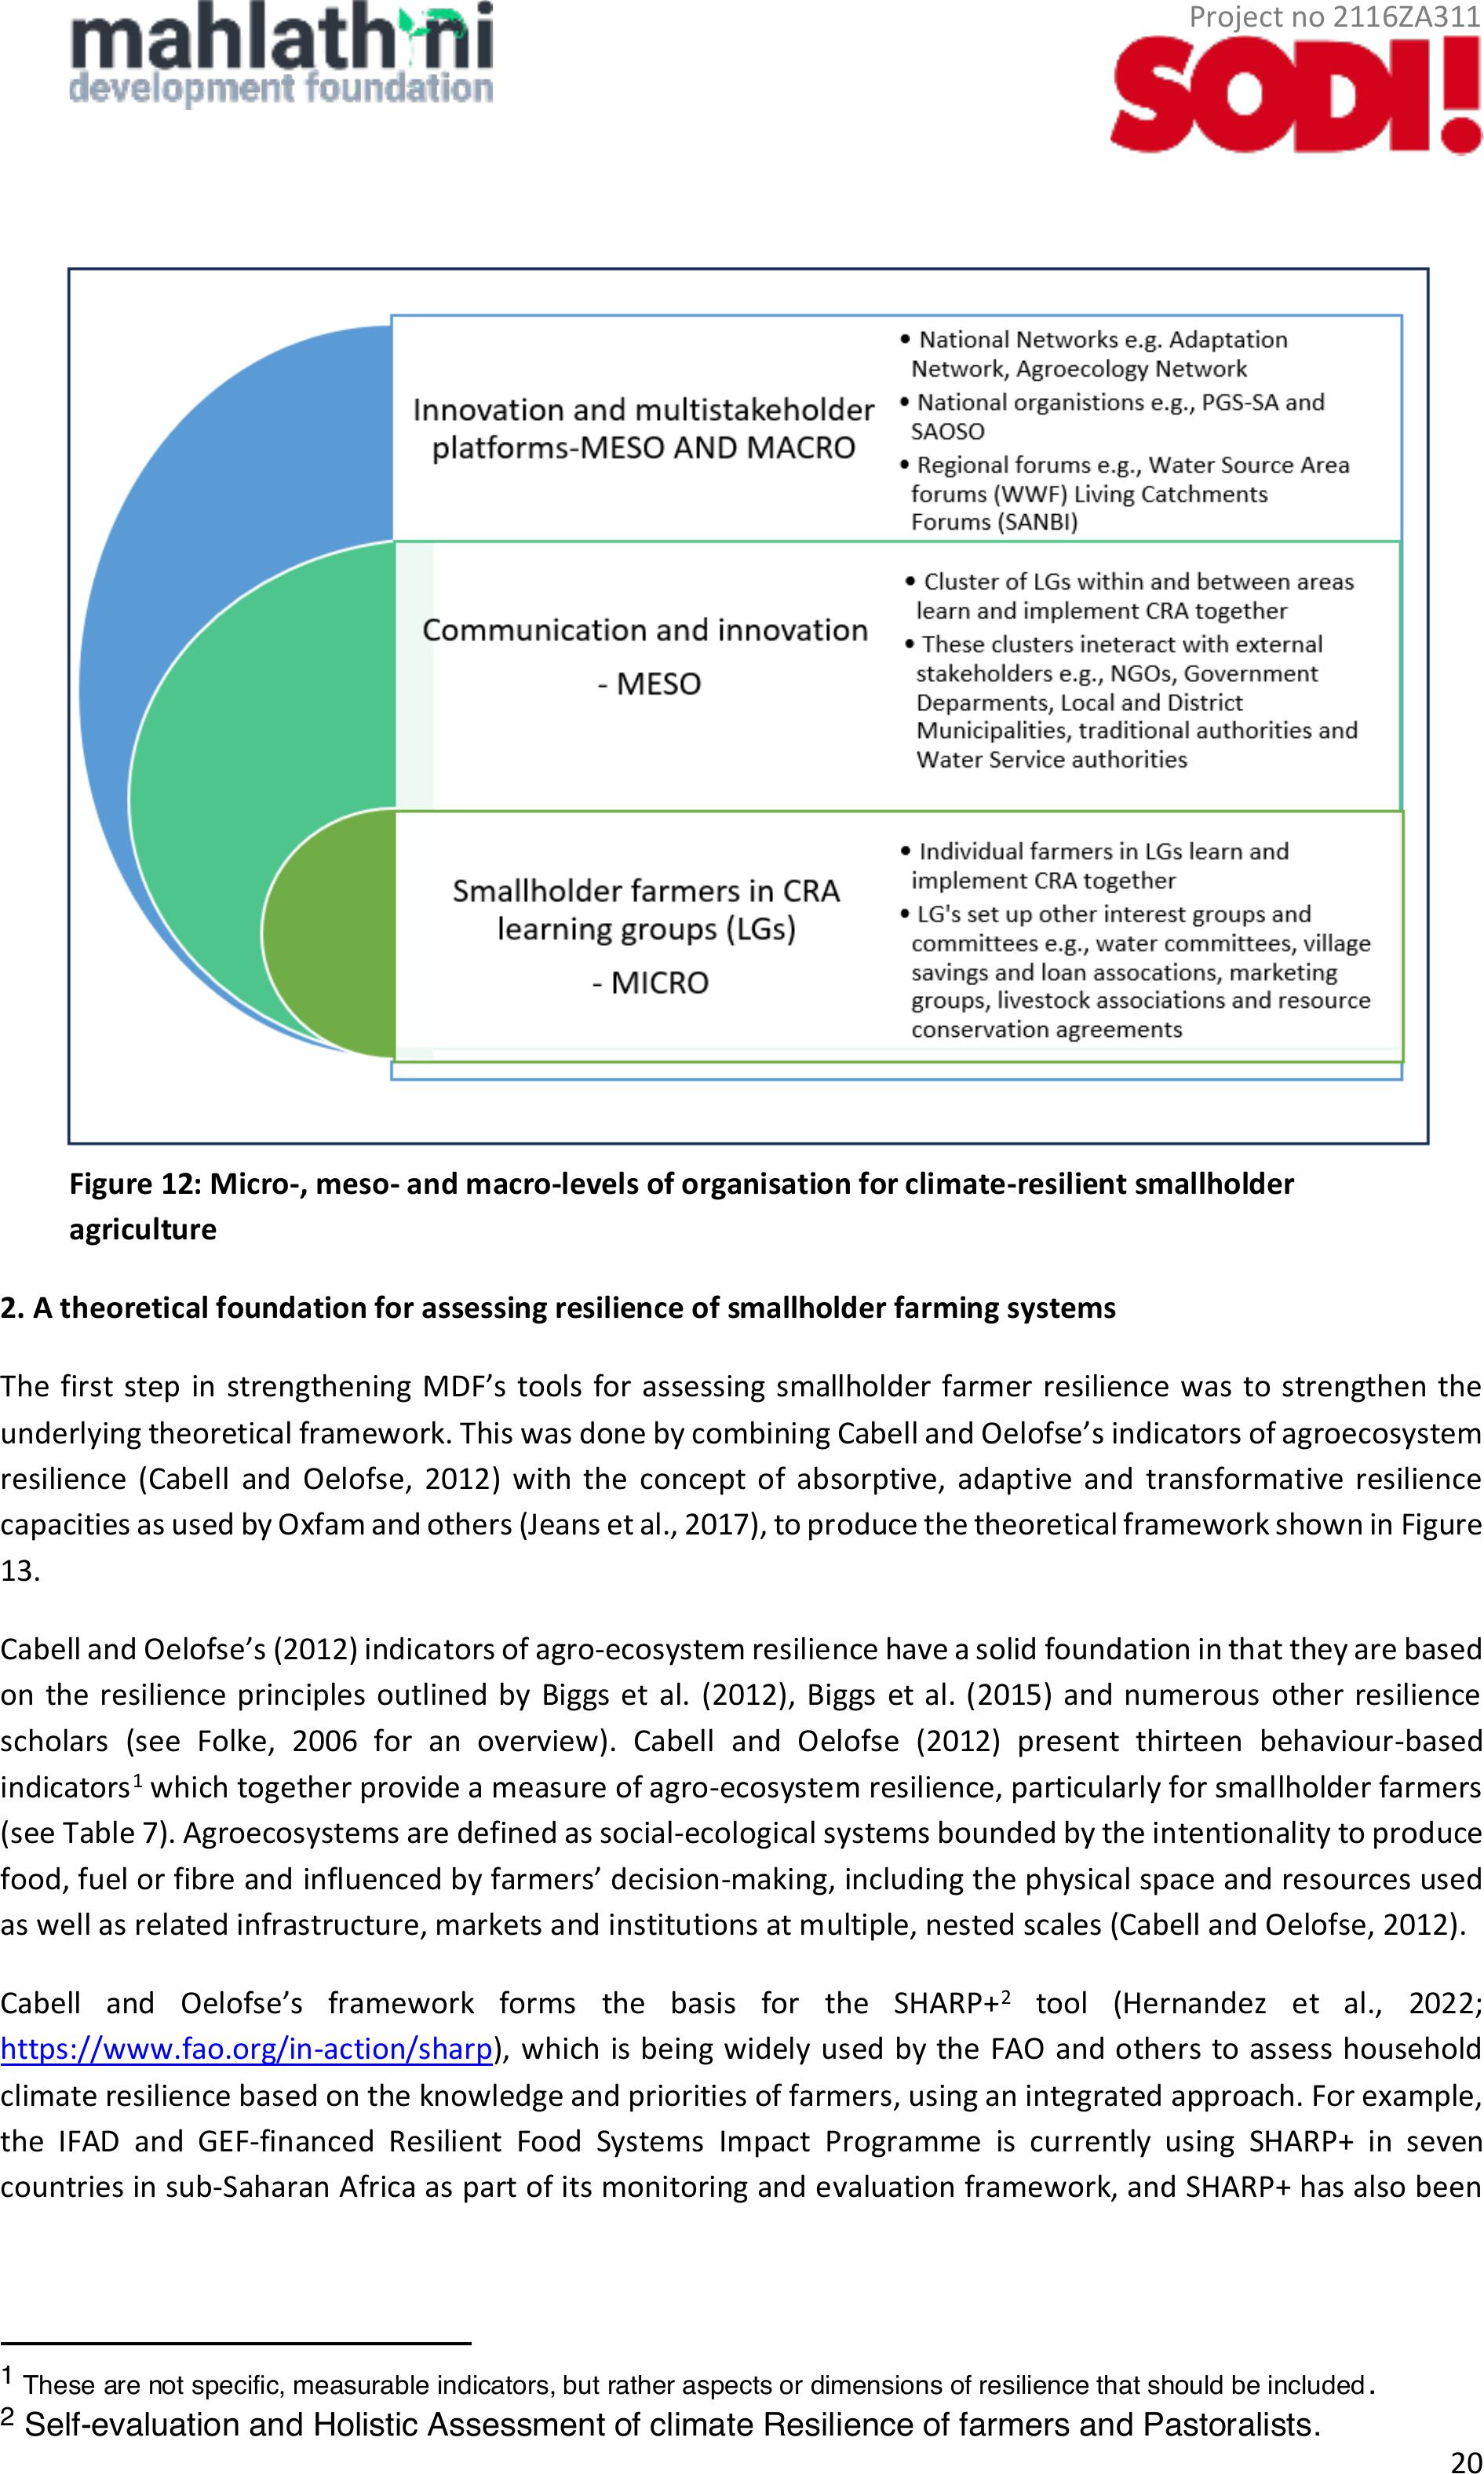
CRA on three nested levels: micro-, meso- and macro-levels (Error! Reference source not found.). At the micro-
level, participants are farmers interacting with each other - and possibly others in their community - in peer
learning groups, interest groupsand committees. As one moves to the meso- and macro-levels, the range and
diversity of people and organisations involved broadens out to include other players such as local and national
government, civil society organizations (CSOs), non-governmental organizations (NGOs), the private sector and
academic institutions. The connections across the three levels or scales are important for ensuring that farmers’
issues, concerns and preferencesare understood and taken up regionally and nationally (e.g. into policy, planning
and communications), and that farmers are able to benefit from the support of these diverse stakeholders (e.g.
through relationships, learning exchanges and training).
Project no 2116ZA311
20
2. A theoreticalfoundation for assessing resilience of smallholder farming systems
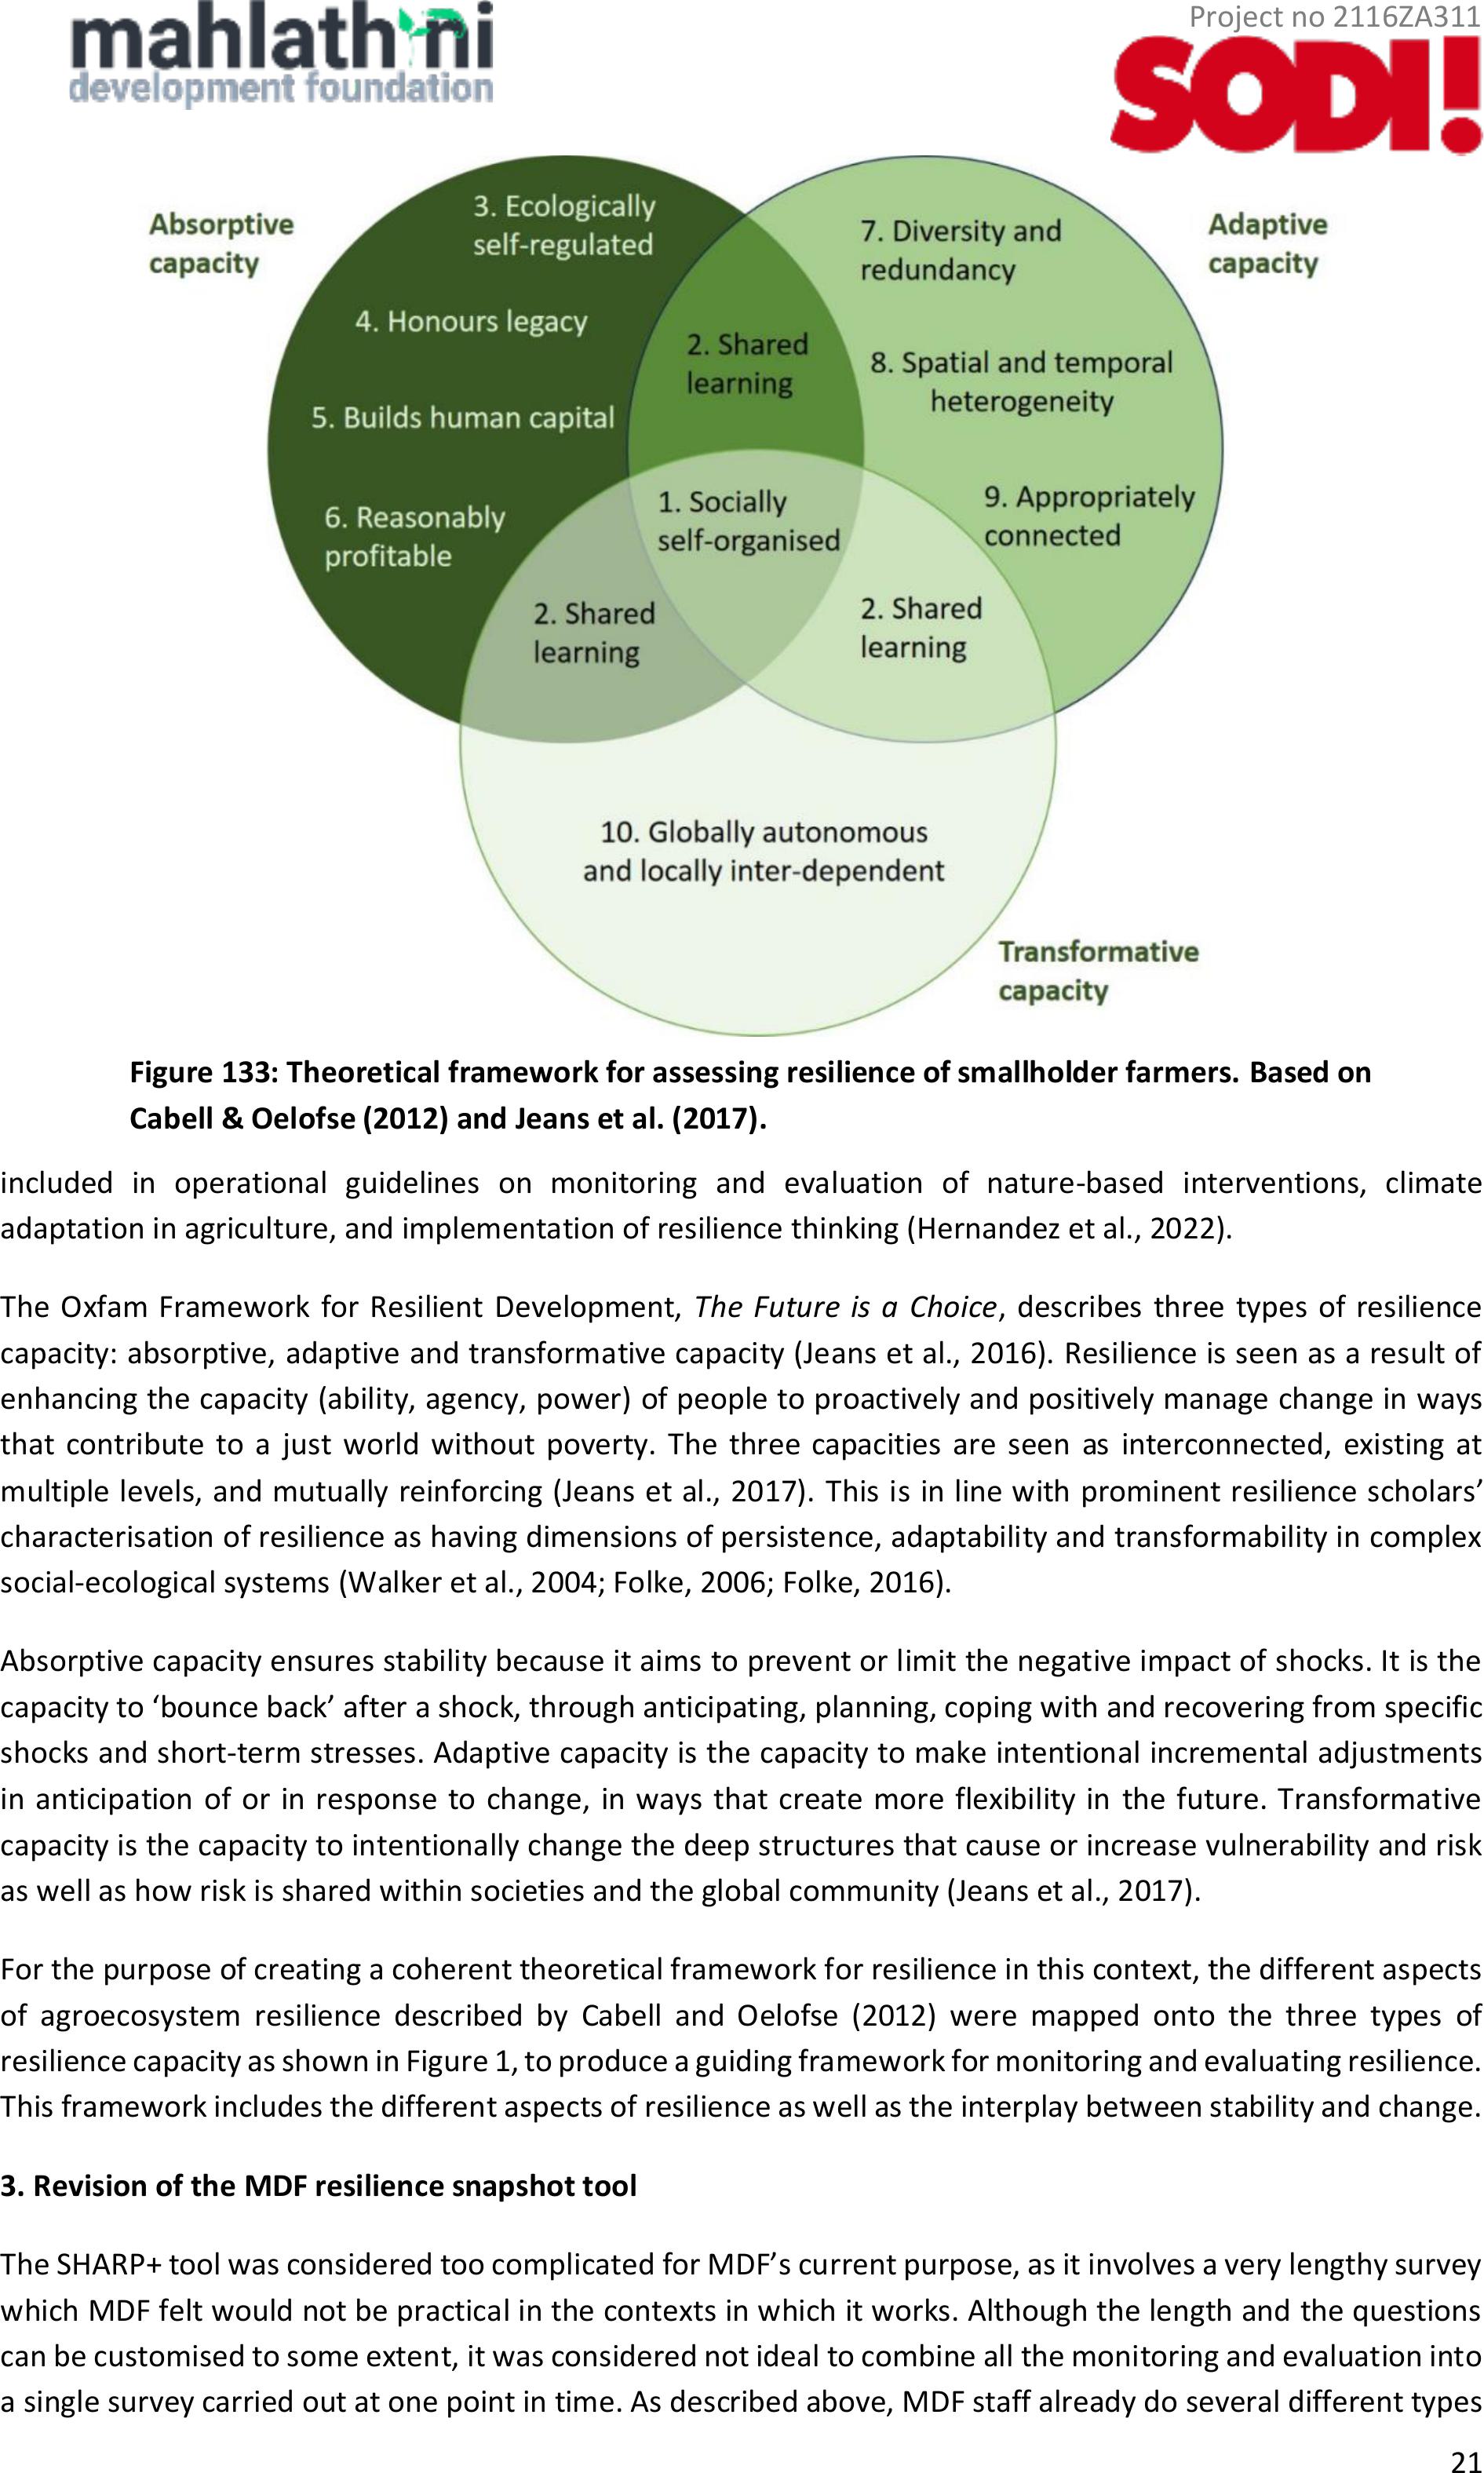
The first step in strengthening MDF’s tools for assessing smallholder farmer resilience was to strengthen the
underlying theoretical framework. This was done by combining Cabell and Oelofse’s indicators ofagroecosystem
resilience (Cabell and Oelofse, 2012) with the concept of absorptive, adaptive and transformative resilience
capacities as used by Oxfam and others (Jeans etal., 2017), to produce the theoretical framework shown in Figure
13.
Cabell and Oelofse’s (2012) indicators of agro-ecosystem resilience have a solidfoundation in that they arebased
on the resilience principles outlined by Biggs et al. (2012), Biggs et al. (2015) and numerous other resilience
scholars (see Folke, 2006 for an overview). Cabell and Oelofse (2012) present thirteen behaviour-based
indicators
1
which together provide a measure of agro-ecosystem resilience, particularly for smallholder farmers
(see Table 7). Agroecosystems are defined as social-ecological systems bounded by the intentionality to produce
food, fuel or fibre and influenced by farmers’ decision-making, including the physical space and resources used
as well as related infrastructure, markets and institutions at multiple, nested scales (Cabell and Oelofse, 2012).
Cabell and Oelofse’s framework forms the basisfor the SHARP+
2
tool (Hernandez et al., 2022;
https://www.fao.org/in-action/sharp),which isbeing widely used by the FAO and others to assesshousehold
climate resilience based on the knowledge and priorities of farmers, using an integrated approach. For example,
the IFAD and GEF-financed Resilient Food Systems Impact Programme is currently using SHARP+ in seven
countries in sub-Saharan Africa as part of its monitoring and evaluation framework, andSHARP+ has also been
1
These are not specific, measurable indicators, but rather aspects or dimensions of resilience that should be included.
2
Self-evaluation and Holistic Assessment of climate Resilience of farmers and Pastoralists.
Figure 12: Micro-, meso- and macro-levels of organisation for climate-resilient smallholder
agriculture
Project no 2116ZA311
21
included in operational guidelines on monitoring and evaluation of nature-based interventions, climate
adaptation in agriculture, and implementation of resilience thinking (Hernandez et al., 2022).
The Oxfam Framework for Resilient Development, The Future is a Choice, describes three types of resilience
capacity: absorptive, adaptive and transformative capacity (Jeans et al., 2016). Resilience is seen as a result of
enhancing the capacity(ability, agency, power)of peopleto proactively and positively manage change in ways
that contribute to a just world without poverty. The threecapacities are seen as interconnected, existing at
multiple levels, and mutually reinforcing (Jeans et al., 2017).This is in line with prominent resilience scholars’
characterisation of resilience as having dimensions of persistence, adaptability and transformability in complex
social-ecological systems (Walker et al., 2004; Folke, 2006; Folke, 2016).
Absorptive capacity ensures stability because it aims to prevent or limit the negative impact of shocks. It is the
capacity to ‘bounce back’ after a shock, through anticipating, planning, coping with and recovering from specific
shocks and short-term stresses. Adaptive capacity is the capacity to make intentional incremental adjustments
in anticipation of or in response to change, in ways that create more flexibility in the future. Transformative
capacity is the capacity to intentionally change the deep structures that cause or increase vulnerability and risk
as well as how risk is shared within societies and the global community (Jeans et al., 2017).
For the purpose of creating a coherent theoretical framework for resilience in this context, the different aspects
of agroecosystem resilience described by Cabell and Oelofse (2012) were mapped onto the three types of
resilience capacity as shown in Figure 1, to produce a guiding framework for monitoring and evaluating resilience.
This framework includes the different aspects of resilience as well as the interplay between stability and change.
3. Revision of the MDF resilience snapshot tool
The SHARP+ toolwas considered too complicated for MDF’s current purpose, as it involves a very lengthy survey
which MDF felt would not be practical in the contexts in which it works. Although the length and the questions
can be customised to some extent, it was considered not ideal to combine all the monitoring and evaluation into
a single survey carried out at one point in time. As described above, MDF staff already do several different types
Figure 133: Theoretical framework for assessing resilience of smallholder farmers. Based on
Cabell & Oelofse (2012) and Jeans et al. (2017).

Project no 2116ZA311
22
of monitoring and evaluation activities with farmers on different time scales, because different activities require
different monitoring frequencies. Furthermore, MDF’s Resilience Snapshot tool has been tested and refined for
the South African context over many years. It was therefore decided to align what MDF is already doing with the
Cabell and Oelofse framework, and to strengthen and modify the Resilience Snapshot where necessary.
Comparing the Resilience Snapshot indicators with the Cabell and Oelofse (2012) aspects of agroecosystem
resilience (Table 1) revealed that the Resilience Snapshot did cover most areas, although some more strongly
than others. By comparison, the Committee on Sustainable Assessment’s (COSA)
3
resilience indicators used by
the Adaptation Fund do not cover all the aspects of resilience (Table 77).
The thirteen aspects of agroecosystem resilience described byCabell and Oelofse (2012) were reduced to ten as
follows. One was removed because itwas felt not to be relevant to South African smallholder farmers (“carefully
exposed to disturbance” –South African smallholder farmers do not have the luxury of controlling the amount
of disturbance to which their activities are exposed). Another (“coupled with local natural capital”) was removed
because it was felt to be sufficiently covered by another (“globally autonomous and locally interdependent”).
Finally, “functional and response diversity” and “optimallyredundant” were combined because in practice having
more diversity usually also provides redundancy, or the ability of some entities (e.g. inputs, outputs or crops) to
functionally compensate for the loss of others (Kotschy, 2013).
Table 7: Alignment of the MDF Resilience Snapshot indicators and the COSA resilience indicators with the
dimensions of agroecosystem resilience described by Cabell and Oelofse (2012)
Cabell & Oelofse (2012)
Agroecosystem resilience
MDF Resilience Snapshot
COSA resilience indicators
used by Adaptation Fund
ABSORPTIVE CAPACITY (STABILITY)
Socially self-organised- socialcomponents able to form
their own configuration based on their needsand desires
(e.g. grassroots networks, coops, markets, associations,
advisory networks)
Collaborative actions/ social agency
Reflective and shared learning- collaborations, knowledge
sharing, record-keeping, ability to learn from past
experimentation
Informed decision-making (information
used)
Access to information
Early warning systems
Ecologically self-regulated - stabilising ecological feedback
mechanisms (e.g. maintain cover, soil health, regulate
predators & pests, use ecosystem engineers)
Embodied in soil and water conservation
practices of agro-ecology and
conservation agriculture
SWC practices, including
integrated pest management
Coupled with local natural capital - using local natural
resources and ES, reduced need for external inputs
Increased water use efficiency (including
rainwater harvesting, water holding,
water access, and water productivity)
Honours legacy- maintaining memory of pastconditions
and experiences (e.g. heirloom seeds, elders, traditional
practices)
Informed decision-making (information
used)
Access to information?
Builds human capital- constructed (economic activity,
technology, infrastructure), cultural (individual skills and
abilities), and socialcapital (social organizations, norms,
networks)
Savings
Collaborative actions/ social agency
No. of agricultural productive
assets (equipment, livestock,
land)
Reasonably profitable - farmers able to make a livelihood,
able to invest in the future (buffering capacity), not needing
to rely on distortionary subsidies
Increased livelihood security (income)
Increased livelihood security (household
provisioning & food security)
Increase in farming (size)
Increased productivity
Savings (safety, security, achievement)
Positive mindsets
Net household income
ADAPTIVE CAPACITY (FLEXIBILITY)
3
A non-profit independent global consortium which has developed an indicator library for resilience. COSA indicators are
aligned with global norms such as the SDGs, multilateral guidelines, international agreements, and normative references. The
indicators ensure comparability and benchmarking across regions or countries, making it easier for managers and policymakers.

Project no 2116ZA311
23
Socially self-organised- socialcomponents able to form
their own configuration based on their needsand desires
(e.g. grassroots networks, coops, markets, associations,
advisory networks)
Collaborative actions/ social agency
Reflective and shared learning- collaborations, knowledge
sharing, record-keeping, ability to learn from past
experimentation
Informed decision-making (information
used)
Adoption of new
practices/equipment
Access to information
Early warning systems
Appropriately connected- relationships between system
elements. High no. of weak connections imparts flexibility,
few strong connections impart dependency and rigidity
(e.g. no. of suppliers, outlets, farmers, crops)
Collaborative actions/ social agency?
Functional and response diversity - diversity of ES, inputs,
outputs, markets, income sources, pest control. Diversity of
response options to environmental & other changes.
Increased diversity in farming Increased
diversity of practices Increased water use
efficiency Increased livelihood diversity
options
Adoption of new
practices/equipment
Diversification of income
Optimally redundant-duplication (partial functional
overlap) of components and relationships in the system
(e.g. crop types, equipment, water sources, nutrient
sources, sales outlets), but not so that it istoo
costly/unwieldy
Increased diversity in farming Increased
diversity of practices Increased water use
efficiency Increased livelihood diversity
options
No. of income sources
Spatial and temporal heterogeneity- patchiness of land
use, rotations, practices, in space and over time
Increased growing season
Increased diversity in farming
(gardening/ fieldcropping/ livestock/
trees)
Carefully exposed to disturbance- disturbance not
excluded totally but managed where possible (e.g. pest and
disease exposure allowed to promote selection and
resistance)
TRANSFORMATIVE CAPACITY (STRUCTURAL CHANGE)
Reflective and shared learning- collaborations, knowledge
sharing, record-keeping, ability to learn from past
experimentation
Collaborative actions/ social agency
Adoption of new
practices/equipment
Access to information
Early warning systems
Socially self-organised- socialcomponents able to form
their own configuration based on their needsand desires
(e.g. grassroots networks, coops, markets, associations,
advisory networks)
Informed decision-making (information
used)
Globally autonomous and locally inter-dependent-
relative autonomy from exogenous control, but with a high
level of cooperation locally
Collaborative actions/ social agency
Specific, measurable indicators were then developed for all the aspects of resilience and resilience capacity as
shown in Figure 1, using the existing indicators in MDF’s Resilience Snapshot and the COSA indictors as astarting
point (Table 8). Further development is still required, for example to add the methodology, people responsible
for data collection and analysis, frequency of collection and data limitations for each indicator.
Future work willinvolve developing a visually engaging way of presenting and sharing the data. This could
include:
•A “traffic light” system (red, orange, green) for each indicator to provide a simple overview of status
and progress.
•Web-based dashboards which convert the data into engaging visual representations (e.g. graphs, charts,
tables, word clouds) and make it accessible to stakeholders.
•An interactive network mapping tool such asKumu (https://kumu.io/), which allows stakeholders to
map and visualise their connections interactively and can also be used to gather and analyse data such
as numbers and types of connections, strength of connections and social self-organisation.
Table 8: Expanded and modified set of resilience indicators for MDF’s Resilience Snapshot

Project no 2116ZA311
24
Indicator name and no.
Rationale
Definition
Unit of measure
Absorptive capacity
1. Socially self-organised (Focus on support networks)
1.1 Support networks/groups
Support networks build absorptive
capacity by helping farmers to absorb
and survive shocks.
Networks or groupswhich farmers
use for emergency and psycho-
social support.
Average no. of groups, % of
farmers belonging to
different types of groups.
1.2 Increased social agency
(collaborative actions)
Absorptive capacity is enhanced by
support networks that enable individual
and collective agency to make farming
activities more efficient and productive.
Extentofcollaboration e.g. Market
days, assistance with ploughing,
labour, seed sharing, saving groups
etc.
Average no. of collaborative
actions in which farmers are
involved.
2. Shared learning (Focus on learning for productivity)
2.1 Increased knowledge
sharing
Sharing of knowledge helpsfarmers to
farm more effectively and to mitigate
the impacts of shocks and disturbances.
Also, the act of sharing knowledge
promotes learning for the person doing
the sharing as well asthe recipient.
Sharing showsthat people have
internalised information.
How knowledge isshared (e.g.
informally with other farmers, in
meetings with local orgs, meetings
with external orgs such as DoA
interest groups, in coops).
What is shared: categories/ types of
knowledge or sharing.
List of who shared with, list of
types of knowledge shared.
3. Ecogically self-regulated
3.1 Increasedwater use
efficiency
Five fingers indicators
Pestand disease
management
Pollinators
The 5 fingers principles promote
ecological self-regulation through
improved nutrient cycling, water use
efficiency, soil health, maintenance of
indigenous vegetation and pollinator
populations. Important for resilience but
MDF has not had any success with
monitoring most of these. Most farmers
are not aware ofthings like pollinators,
pests and diseases, soil health.
Whether the soil's water-holding
capacity has improved (Y/N).
% Y vs N responses
4. Honours legacy
4.1 Traditional practices,
crops and livestock in use
Traditional practicesare away of
maintaining memory of pastconditions
and experiences.
Which traditional practices are in
use? (e.g. seed saving,
heirloom/indigenous seedsor
breeds, banana basins) - or changes
to these.
List of traditional practices
being used by farmers
5. Builds human capital
5.1 Increased savings
Savings provide a buffer, allowing
farmers to absorb and recover from
shocks, and to plan and managetheir
cash flow.
Average increase in savings
Average increase in savings
(Rands)
5.2 Use of savings for
livelihoods improvement
If farmers are using savings for livelihood
improvements, rather than just on
essentials such as food, it suggests that
human capital is being built.
How savings are being used
List of options
5.3 Increased knowledge and
agency as a result of CRA
Building skills, knowledge and agency
increases human capital, which enables
farmers to farm more effectively.
What farmers are able to do now
that they weren't able to do before
List of options
5.4 Increase in agricultural
productive assets
Agricultural assets enable farmers to
farm effectively and to absorb and
recover from shocks.
Change in agricultural productive
assets
List, maybe count and
categorise (equipment,
livestock, etc.)
6. Reasonably profitable
6.1 Increased income
If farmers are able to make alivelihood
through farming, they are able to remain
in their communities and provide for
their families, avoiding the social and
psychological disruption of migration or
circular migration.
Average monthly incomes, mostly
though marketing of produce locally
and through the organic marketing
system.
Average monthly income
(Rands)
6.2 Increased household food
provisioning
If farmers are able to produce sufficient
food locally, it reduces their dependency
on store-bought food.
Food produced and consumedin
the household.
Overall foodproduced (kg
per week)
6.3 Increased food security
Having a dependable supply of food and
a good variety of foods is beneficial for
health and wellbeing.
No. of food types and how often
eaten. A recognised food security
indicator.
No. of foodtypes/ no. of
times per week

Project no 2116ZA311
25
6.4 Increase in size of farming
activities
An expansion of farming indicates that
farmers have the resourcesand
commitment to make this possible.
Size of farming activities (cropping,
trees & livestock).
Cropping area(ha), no. of
fruit trees and no of livestock.
6.5 Increased productivity
Apart from food security, increases in
productivity create opportunities for
participation in markets or value-added
activities.
Increase in yields and/or livestock.
Overall kg producedin a
season, livestock
increase/decrease
6.6 Increased savings
An increase in savings reflects successful
livelihoods. Savings also allow farmers to
invest in the future.
Average increase in savings.
Average increase in savings
(Rands).
6.7 Positive mindsets
This is an integrative measure of
whether farmers feel they are "making
it".
How positive farmers feel about the
future.
SCALE: 0=less positive about
the future; 1=the same;
2=more positive; 3=much
more positive.
Adaptive capacity
1. Socially self-organised (Focus on learning networks)
1.4 Learning
networks/groups
Learning networksbuild adaptive
capacity bypromoting experimentation
and evaluation of results.
Networks or groups to which
farmers belong which enable
learning aboutCRA. (Will be mainly
justthe MDF learning group in most
cases).
Average no. of groups, % of
farmers belonging to
different types of groups.
2. Shared learning (Focus on learning for adaptation)
2.2 Use of information from
past experimentation in
decision-making
Successful adaptation is more likely
when experimentation and learning
inform farmers' decisions.
Whether information from past
experimentation is used
% of farmersusing info from
past experimentation
2.3 Prevalence of record-
keeping
Record-keeping facilitates recall of past
events/results and analysis of trends.
Whether farmers keep records of
anything
Question Y/N
2.4 Most significant change in
farming practices
Changed practices indicate learning (?)
Most significant change in farming
practices
List of practices
7. Diversity and redundancy
7.1 Increased livelihood
diversity options
Having a diversity of livelihood options
increases farmers' response diversity
(capacity to adapt to different shocks).
No. of livelihood options (sources of
income), e.g. Socialgrants,
remittances,farming incomes, small
business income, employment.
Average no. of options per
farmer
7.2 Increased diversity of
farming activities
Having a diversity of farming activities
also increases response diversity and
provides for spreading of risks.
No. of farming activities (gardens,
field cropping, livestock, trees etc.).
Average no. of activities per
farmer
7.3 Increased crop diversity
Increased crop diversity increases
functionaland response diversity
(different crops perform different roles,
provide differentnutritional benefits,
and respond differently to stress,
disease and disturbance).
No. of crops planted by farmers
which were not planted previously
("new" crops).
Average no. of "new" crops
added, overall and per farmer
7.4 Increased CRA practice
diversity
Different practices have different
functions within the agro-ecosystem
(functional diversity).
No. of CRA practices used by
farmers which were notused
previously (e.g. mulching, trench
beds, liquid manure, raised beds,
mixed cropping, inter-cropping,
crop rotation, tunnels, drip kits, eco-
circles, , greywater use and
management, Conservation
Agirculture, cover crops, inclusion of
legumes, pruning of fruit trees,
picking up dropped fruit, pest and
disease control,feeding livestockon
crops and stover, cutting and
baling, fodder supplementation,
health and sanitation for poultry,
brooding, JoJo tanks, RWH drums).
Average no. of"new"
practices added, overall and
per farmer
7.5 No. of water sources
Redundancyin water supply reduces the
impact of failure of one source.
List of water sources available to
farmer.
Average no. of water sources,
overall and per farmer
7.6 No. of nutrient sources
Redundancy in nutrient supply.
List of nutrient sourcesavailable to
farmer.
Average no. ofnutrient
sources, overall and per
farmer
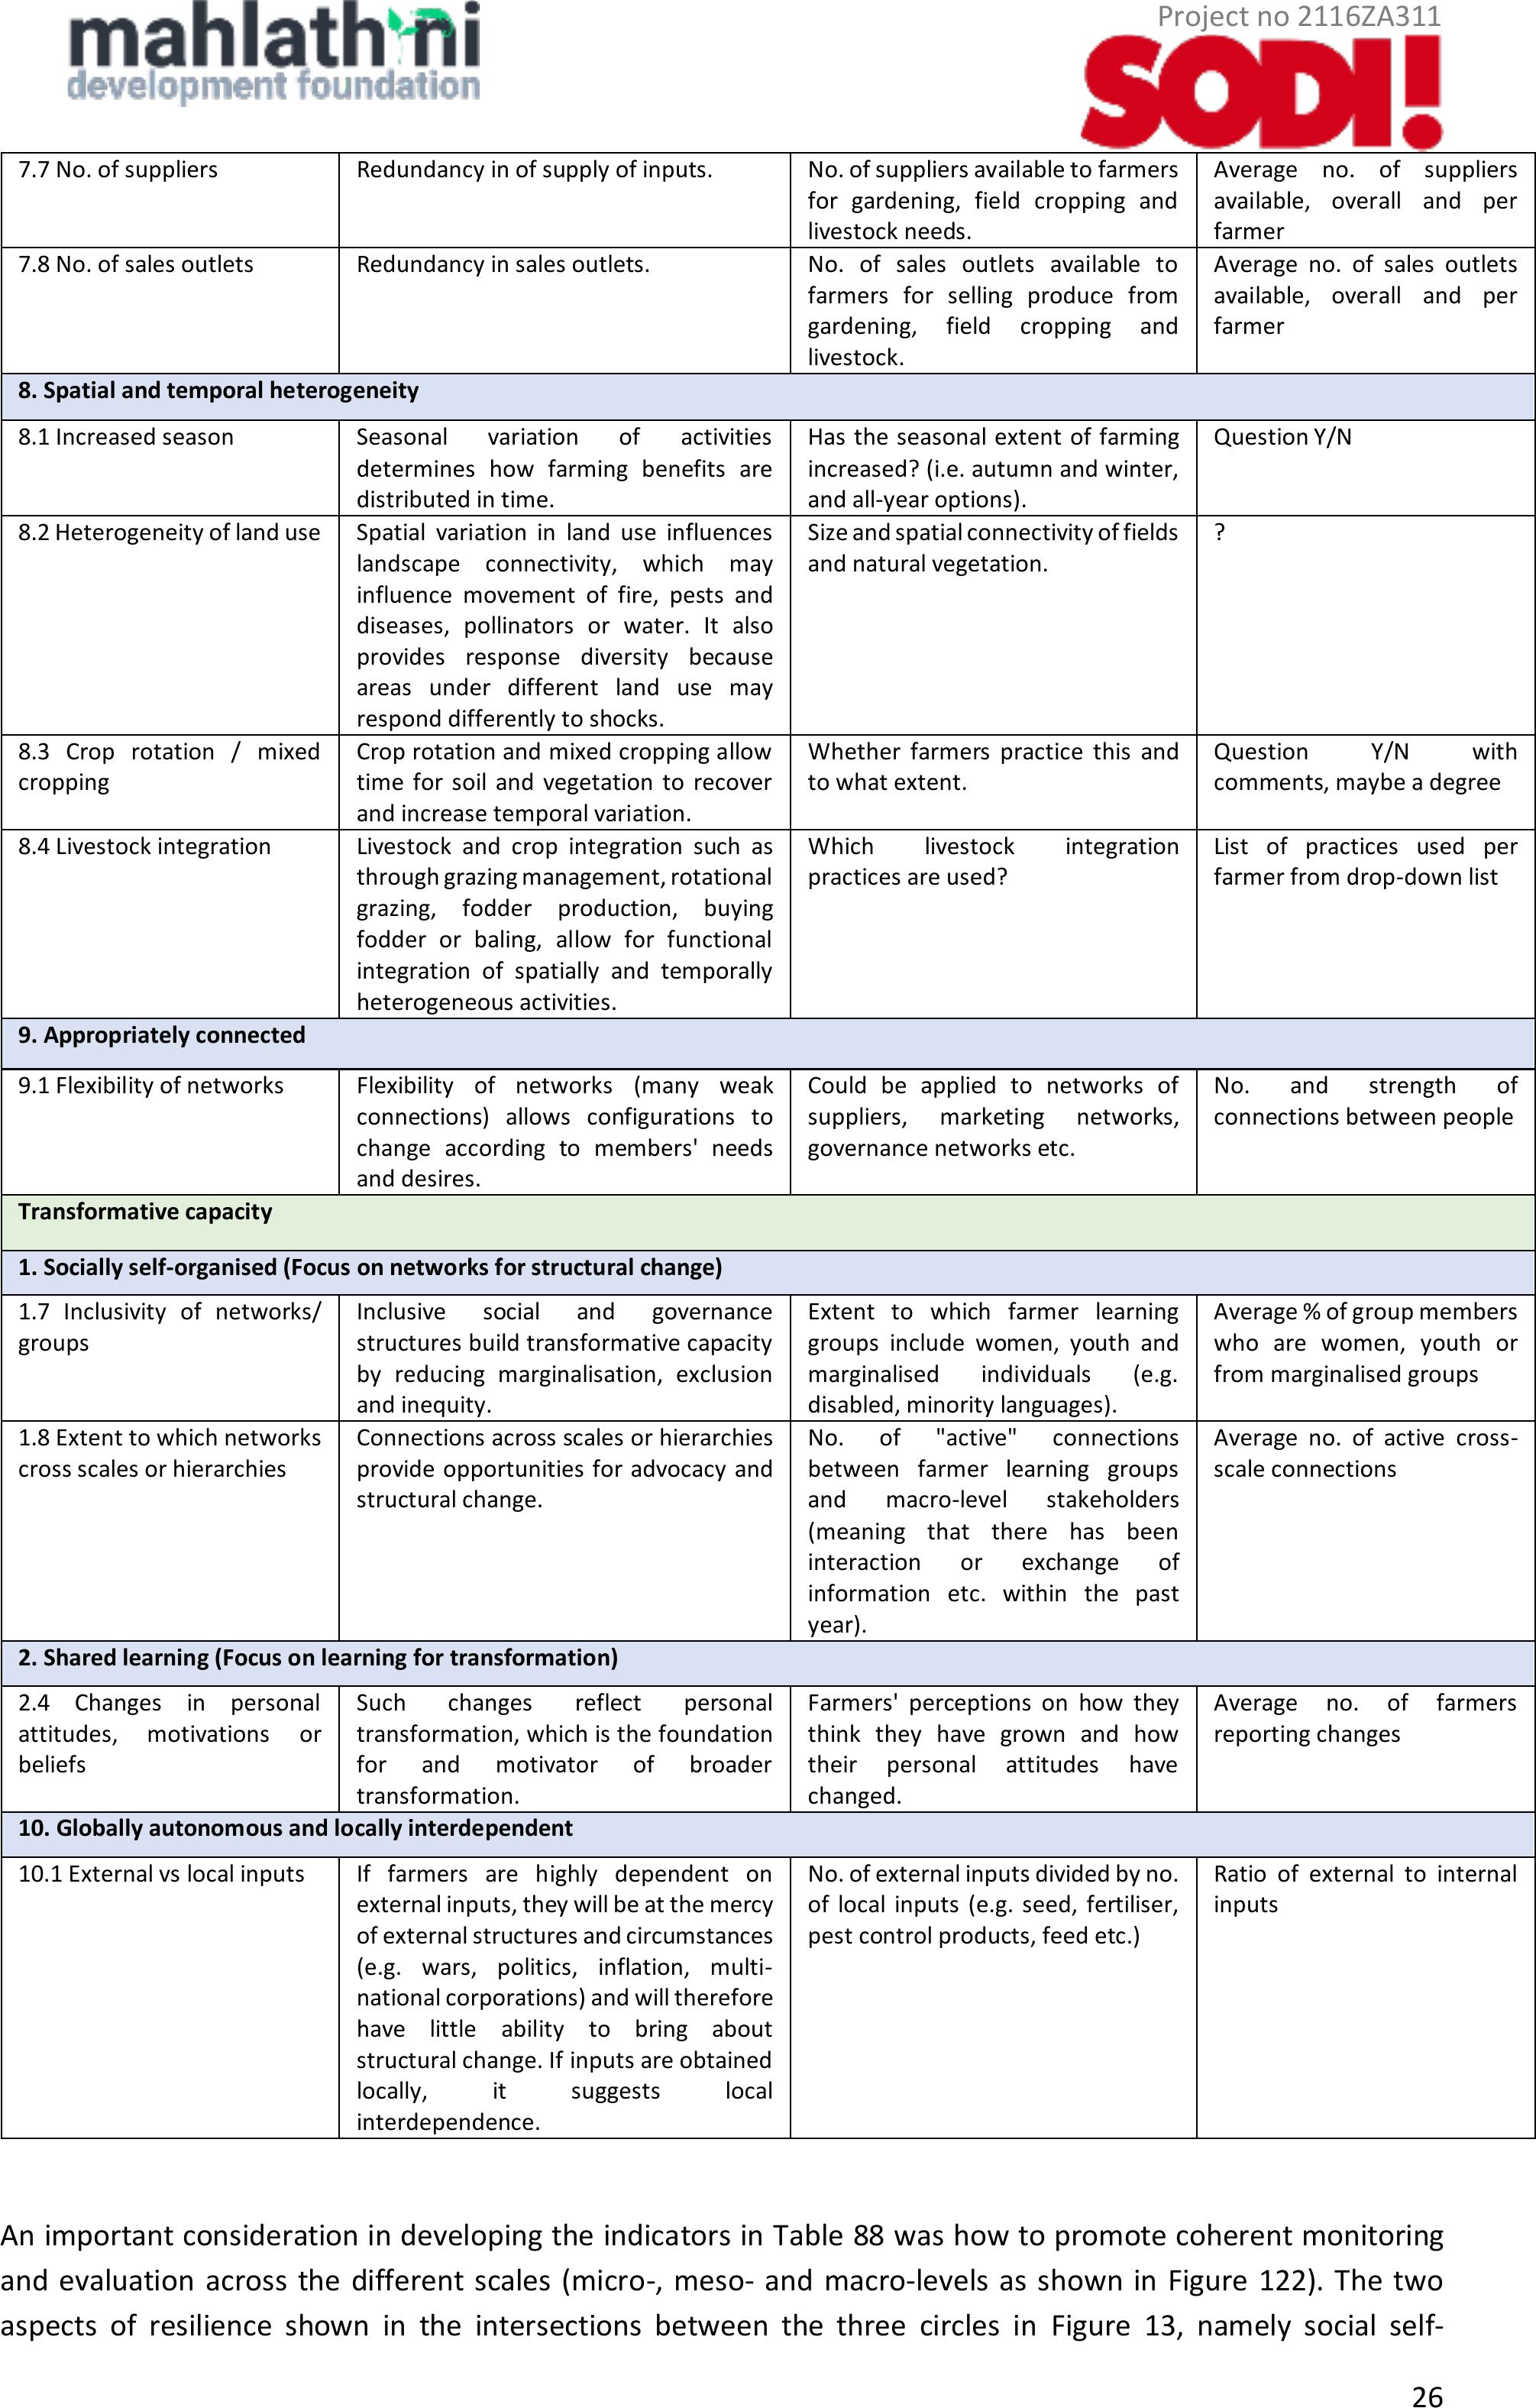
Project no 2116ZA311
26
7.7 No. of suppliers
Redundancy in of supply of inputs.
No. of suppliers available to farmers
for gardening, field cropping and
livestock needs.
Average no. of suppliers
available, overall and per
farmer
7.8 No. of sales outlets
Redundancy in sales outlets.
No. of sales outletsavailable to
farmers for selling produce from
gardening, field cropping and
livestock.
Average no. of sales outlets
available, overall and per
farmer
8. Spatial and temporal heterogeneity
8.1 Increased season
Seasonal variation ofactivities
determineshow farming benefits are
distributed in time.
Has the seasonal extent of farming
increased? (i.e. autumn and winter,
and all-year options).
Question Y/N
8.2 Heterogeneity of land use
Spatial variation inland use influences
landscape connectivity, whichmay
influence movement of fire, pests and
diseases, pollinators or water. It also
provides response diversity because
areas under differentland use may
respond differently to shocks.
Size and spatial connectivity of fields
and natural vegetation.
?
8.3 Crop rotation /mixed
cropping
Crop rotation and mixed cropping allow
time for soil and vegetation to recover
and increase temporal variation.
Whether farmers practice this and
to what extent.
Question Y/N with
comments, maybe a degree
8.4 Livestock integration
Livestock and crop integration such as
through grazing management, rotational
grazing, fodder production, buying
fodder or baling, allow for functional
integration of spatially and temporally
heterogeneous activities.
Which livestock integration
practices are used?
List of practicesused per
farmer from drop-down list
9. Appropriately connected
9.1 Flexibility of networks
Flexibility of networks (many weak
connections) allows configurations to
change according to members' needs
and desires.
Could be applied tonetworksof
suppliers, marketing networks,
governance networks etc.
No. and strength of
connections between people
Transformative capacity
1. Socially self-organised (Focus on networks for structural change)
1.7 Inclusivity of networks/
groups
Inclusive socialand governance
structures build transformative capacity
by reducing marginalisation, exclusion
and inequity.
Extenttowhich farmer learning
groups include women, youth and
marginalised individuals (e.g.
disabled, minority languages).
Average % of group members
who are women, youth or
from marginalised groups
1.8 Extent to which networks
crossscales or hierarchies
Connections across scales or hierarchies
provide opportunities for advocacy and
structural change.
No. of"active" connections
between farmer learning groups
and macro-level stakeholders
(meaning that there has been
interaction or exchange of
information etc. within the past
year).
Average no. of activecross-
scale connections
2. Shared learning (Focus on learning for transformation)
2.4 Changes in personal
attitudes, motivations or
beliefs
Suchchanges reflect personal
transformation, which is the foundation
for and motivator of broader
transformation.
Farmers' perceptions on how they
think they have grownand how
their personal attitudes have
changed.
Average no. offarmers
reporting changes
10. Globally autonomous and locally interdependent
10.1 External vs local inputs
If farmers are highly dependent on
external inputs, they will be at the mercy
of externalstructures and circumstances
(e.g. wars, politics, inflation, multi-
national corporations) and will therefore
have little abilityto bring about
structural change. If inputs are obtained
locally, it suggestslocal
interdependence.
No. of external inputs divided by no.
of localinputs(e.g. seed, fertiliser,
pest control products, feed etc.)
Ratio of external to internal
inputs
An important consideration in developing the indicators in Table 88 was howto promote coherent monitoring
and evaluation across the different scales (micro-, meso- and macro-levels asshown in Figure 122). The two
aspects of resilience shown in the intersections between the three circlesinFigure 13, namely social self-

Project no 2116ZA311
27
organisation and shared learning, are important for all three types of resilience capacity and at all three levels,
although they are expressed inslightly different ways in each. For example, at the micro-level, farmer self-
organisation is measured by the number of local groups that provide support, the inclusivity of groups, and the
extent of collaborative actions among farmers. At the macro-level, similar indicators for social self-organisation
are used, but they are applied at the regional or national level (e.g. collaborative actions would not be between
individualfarmers but between organisations or groups). Additional indicators may also be included at higher
levels, such as whether all stakeholder groups are adequately represented.
These indicators will now be used to re-design the participatory impact assessment review workshops and the
individualresilience snapshot questionnaires, to do a trail runprior to finalisation of the overall methodology
and process.
Date: 3 May 2024