
$-*."5&$)"/(&"%"15"5*0/'034."--)0-%&3
'"3.&34*/4065)"'3*$"
70-6.&1"35$0..6/*5:$-*."5&$)"/(&"%"15"5*0/
'"$*-*5"5*0/"."/6"-'03'"$*-*5"5*0/0'$-*."5&3&4*-*&/5
"(3*$6-563&'034."--)0-%&3'"3.&34
77
i
Climate Change Adaptation for
Smallholder Farmers in
South Africa
Volume 2 Part 1: Community Climate
Change Adaptation facilitation: A manual
for facilitation of Climate Resilient
Agriculture for smallholder farmers
Report to the
Water Research Commission
by
E Kruger
Mahlathini Development Foundation
WRC Report No. TT 841/2/20
February 2021
ii
Obtainable from
Water Research Commission
Private Bag X03
Gezina, 0031
orders@wrc.org.za or download from www.wrc.org.za or www.mahlathini.org
The publication of this report emanates from a project entitled Collaborative knowledge creation and
mediation strategies for the dissemination of Water and Soil Conservation practices and Climate Smart
Agriculture in smallholder farming systems. (WRC Project No.K5/2719/4)
This report forms part of a series of 9 reports. The reports are:
Volume 1: Climate Change Adaptation for smallholder farmers in South Africa. An implementation
and decision support guide. Summary report. (WRC Report No. TT 841/1/20)
Volume 2 Part 1: Community Climate Change Adaptation facilitation: A manual for facilitation of
Climate Resilient Agriculture for smallholder farmers. (WRC Report No. TT 841/2/20)
Volume 2 Part 2: Climate Resilient Agriculture. An implementation and support guide: Intensive
homestead food production practices. (WRC Report No. TT 841/3/20)
Volume 2 Part 3: Climate Resilient Agriculture. An implementation and support guide: Local, group-
based access to water for household food production. (WRC Report No. TT 841/4/20)
Volume 2 Part 4: Climate Resilient Agriculture. An implementation and support guide: Field cropping
and livestock integration practices. (WRC Report No. TT 841/5/20)
Volume 2 Part 5: Climate Resilient Agriculture learning materials for smallholder farmers in English.
(WRC Report No. TT 841/6/20)
Volume 2 Part 6: Climate Resilient Agriculture learning materials for smallholder farmers in isiXhosa.
(WRC Report No. TT 841/7/20)
Volume 2 Part 7: Climate Resilient Agriculture learning materials for smallholder farmers in isiZulu.
(WRC Report No. TT 841/8/20)
Volume 2 Part 8: Climate Resilient Agriculture learning materials for smallholder farmers in Sepedi.
(WRC Report No. TT 841/9/20)
DISCLAIMER
This report has been reviewed by the Water Research Commission (WRC) and approved for
publication. Approval does not signify that the contents necessarily reflect the views and policies of
the WRC, nor does mention of trade names or commercial productsconstitute endorsement or
recommendation for use.
ISBN 978-0-6392-0228-0
Printed in the Republic of South Africa
© WATER RESEARCH COMMISSION
iii
ACKNOWLEDGEMENTS
The following individuals and organisations deserve acknowledgement for their invaluable
contributions and support to this project:
Chris Stimie (Rural Integrated Engineering RIEng)
Dr Brigid Letty and Jon McCosh (Institute of Natural Resources – INR)
Nqe Dlamini (StratAct)
Dr Sharon Pollard, Ancois de Villiers, Bigboy Mkabela and Derick du Toit (Association for Water and
Rural Development)
Bobbie Louton
Hendrik Smith (GrainSA)
Marna de Lange (Socio-Technical Interfacing)
MDF interns and students: Khethiwe Mthethwa, Samukhelisiwe Mkhize, Sylvester Selala, Palesa
Motaung and Sanelise Tafa and
MDF board members: Timothy Houghton and Desiree Manicom
PROJECT FUNDED BY
REFERENCE GROUP MEMBERS
Prof S Mpandeli Water Research Commission
Dr S Hlophe-Ginindza Water Research Commission
Dr L NhamoWater Research Commission
Dr O CrespoUniversity of Cape Town
Dr A Manson KZN Department of Agriculture and Rural Development
Prof S WalkerAgricultural Research Council
Prof CJ Rautenbachpreviously of WeatherSA
COLLABORATING ORGANISATIONS
https://www.inr. org.za/https://award.org.za/https://amanziforfood.co.za/
https://foodtunnel.co.za/http://www.rieng.co.za/
iv
ABBREVIATIONS AND ACRONYMS
AEZ Agroecological zone
CA Conservation agriculture
CC Climate change
CCA Climatechange adaptation
CoP Community of practice
CRA Climate resilient agriculture
CSA Climatesmart agriculture
CSO Civil society organisation
DEA Department of Environmental Affairs
DSS Decision support system
NGO Non-government Organisation
OC Organic carbon
PAR Participatory Action research
PIA Participatory impact assessment
PID Participatory innovation development
PLA Participatory learning and action
PRA Participatory rural appraisal
PTD Participatory technology development
RWH Rainwater harvesting
SLT Social learning theory
SWC Soil and water conservation

v
CONTENTS
ACKNOWLEDGEMENTS .......................................................................................................................iii
PROJECT FUNDED BY ..........................................................................................................................iii
REFERENCE GROUP MEMBERS ........................................................................................................iii
COLLABORATING ORGANISATIONS ..................................................................................................iii
ABBREVIATIONS AND ACRONYMS.................................................................................................... iv
1PROJECT OVERVIEW .................................................................................................................... 1
2BRINGING TOGETHER THE METHODOLOGICAL ELEMENTS .................................................. 2
2.1LEARNING AND CHANGE..................................................................................................... 2
2.2SOCIAL LEARNING, KNOWLEDGE MEDIATION .................................................................3
2.3AGENCY ................................................................................................................................. 4
2.4SOCIAL ENGAGEMENT........................................................................................................ 5
2.5COMMUNITIES OF PRACTICE............................................................................................. 6
2.6INNOVATION SYSTEMS ........................................................................................................ 8
2.7PARTICIPATORY INNOVATION DEVELOPMENT (PID) ...................................................... 9
2.8ADDING THE ELEMENTS TOGETHER: COACTIVE GOVERNANCE IN A CHANGING
CLIMATE ............................................................................................................................... 11
3CLIMATE CHANGE ....................................................................................................................... 12
3.1CLIMATE CHANGE ADAPTATION...................................................................................... 12
3.2CLIMATE SMART / RESILIENT AGRICULTURE................................................................ 13
3.3CONCEPTS OF VULNERABILITY AND RESILIENCE ........................................................ 15
3.3.1VULNERABILITY ASSESSMENTS .................................................................................. 16
3.4SMALLHOLDER FARMING IN SOUTH AFRICA AND CRA ................................................ 17
3.4.1SMALLHOLDER FARMING SYSTEMS............................................................................ 18
3.5LOCAL AND TRADITIONAL KNOWLEDGE IN CRA........................................................... 20
4DECISION SUPPORT PROCESSES ............................................................................................ 22
4.1WHAT GOES INTO THE CRA SMALL SCALE FARMER DECISION SUPPORT SYSTEM ...
.............................................................................................................................................. 22
4.2HOW DOES THE FACILITATOR-FARMER DSS WORK?.................................................. 25
5HOW TO FACILITATE THE FACILITATOR-FARMER DSS ......................................................... 27
5.1BASELINE SURVEY ............................................................................................................. 27
5.1.1THE BASELINE SURVEY QUESTIONNAIRE .................................................................. 27
5.1.2EXAMPLE OF A BASELINE SURVEY ............................................................................. 28
5.2COMMUNITY LEVEL CLIMATE CHANGE ADAPTATION ANALYSIS – OUTLINE OF THE
3 WORKSHOPS ................................................................................................................... 29
5.3CCA WORKSHOP 1: CLIMATE CHANGE ANALYSIS – IMPACT AND ADAPTIVE
MEASURES .......................................................................................................................... 30
5.3.1OUTLINE OF THE TWO-DAY WORKSHOP .................................................................... 31
5.3.2FACILITATION TOOLS ..................................................................................................... 35
5.3.3HOUSEHOLD VISITS ....................................................................................................... 42
5.3.4EXAMPLE OF A CCA WORKSHOP1 PROCESS............................................................ 43
5.3.5PRIORITISATION OF ADAPTIVE MEASURES AND PRACTICES ................................. 46
vi
5.4CCA WORKSHOP 2: PRIORITIZATION OF ADAPTATION STRATEGIES AND
PRACTICES.......................................................................................................................... 47
5.4.1OUTLINE OF CCA WORKSHOP 2................................................................................... 48
5.4.2EXAMPLE OF CCA WORKSHOP 2 ................................................................................. 49
5.4.3SEASONAL WEATHER PREDICTIONS .......................................................................... 52
5.4.4FARMER EXPERIMENTATION ........................................................................................ 53
6PARTICIPATORY IMPACT ASSESSMENT (PIA) ........................................................................ 55
6.1BACKGROUND..................................................................................................................... 55
6.2PIA WORKSHOP OUTLINE ................................................................................................. 56
6.2.1RECAP CLIMATE CHANGE IMPACTS ............................................................................ 56
6.2.2RECAP ADAPTIVE STRATEGIES/ PRACTICES............................................................ 56
6.2.3PRACTICES: RECAP FIVE FINGERS AND LIST ALL PRACTICES UNDER EACH
CATEGORY ...................................................................................................................... 57
6.2.4WHAT HAVE BEEN THE CHANGES OR BENEFITS FROM EACH PRACTICE? .......... 57
6.2.5EXPANDING ON PRACTICES ......................................................................................... 57
6.2.6EXAMPLE OF A PIA ASSESSMENT OUTCOME: BERGVILLE KZN (2019).................. 58
6.3RESILIENCE SNAPSHOTS.................................................................................................. 60
6.3.1THE INDIVIDUAL CLIMATE CHANGE RESILIENCE QUESTIONNAIRE ....................... 60
6.3.2EXAMPLE OF A RESILIENCE SNAPSHOT ASSESSMENT FOR 12 PARTICIPANTS IN
BERGVILLE, KZN APRIL 2019 ......................................................................................... 63
7REFERENCES .............................................................................................................................. 66
1
Community CCA Facilitation
1 PROJECT OVERVIEW
This facilitation manual is one of the outputs for a Water Research Commission research brief entitled
“Collaborative knowledge creation and mediation strategies for the dissemination of water and soil
conservation practices and climate smart agriculture in smallholder farming systems”, undertaken
between 2017 and 2020.
The research objectives were defined as:
1. To evaluate and identify best practice options for climate resilient agriculture (CRA) and Soil
and Water Conservation (SWC) in smallholder farming systems, in two bioclimatic regions in
South Africa
2. To amplify collaborative knowledge creation of CRA practices with smallholder farmers in South
Africa
3. To test and adapt existing CRA decision support systems (DSS) for the South African
smallholder context
4. To evaluate the impact of CRA interventions identified through the DSS by piloting interventions
in smallholder farmer systems, considering water productivity, social acceptability and farm-
scale resilience
5. To test visual and proxy indicators appropriate for a Payment for Ecosystems based model at
community level for local assessment of progress and tested against field and laboratory
analysis of soil physical and chemical properties, and water productivity.
The design of the decision support system is seen as an ongoing process divided into three distinct
parts:
¾Practices: Collation, review, testing and finalisation of those CRA practices to be included.
This allows for new ideas and local practices to be included over time and also includes linkages
and reference to external sources of technical information around climate change, soils, water
management, etc. and how this will be done
¾Process: Through which CRA practices are implemented at smallholder farmer level. This also
includes the facilitation component, communities of practice, communication strategies and
capacity building and
¾Monitoring and evaluation: Design and implementation of local and visual assessment
protocols for assessing implementation and impact of practices as well as processes used. This
also includes site selection and quantitative measurements undertaken to support the visual
assessment protocols and development of visual and proxy indicators for future use in
incentive-based support schemes for smallholder farmers.
This manual focusses on the process; the methodological and facilitation components of the research
brief.
2
2 BRINGING TOGETHER THE METHODOLOGICAL ELEMENTS
When engaging with smallholder farmers the socio-cultural, economic and environmental complexities
of these farming systems need to be taken into account; explored, understood and managed. Any new
ideas and processes need to be facilitated inclusive of all socio-cultural, economic and environmental
aspects and in a setting of open dialogue and learning.
2.1 LEARNING AND CHANGE
To engage in exploring the change in farming systems happening due to climate change and thinking
into the kinds of changes required to consciously adapt to these changes, requires both the process of
learning (including new ideas and information into the mix) and the process of doing (how to implement
and farm differently).
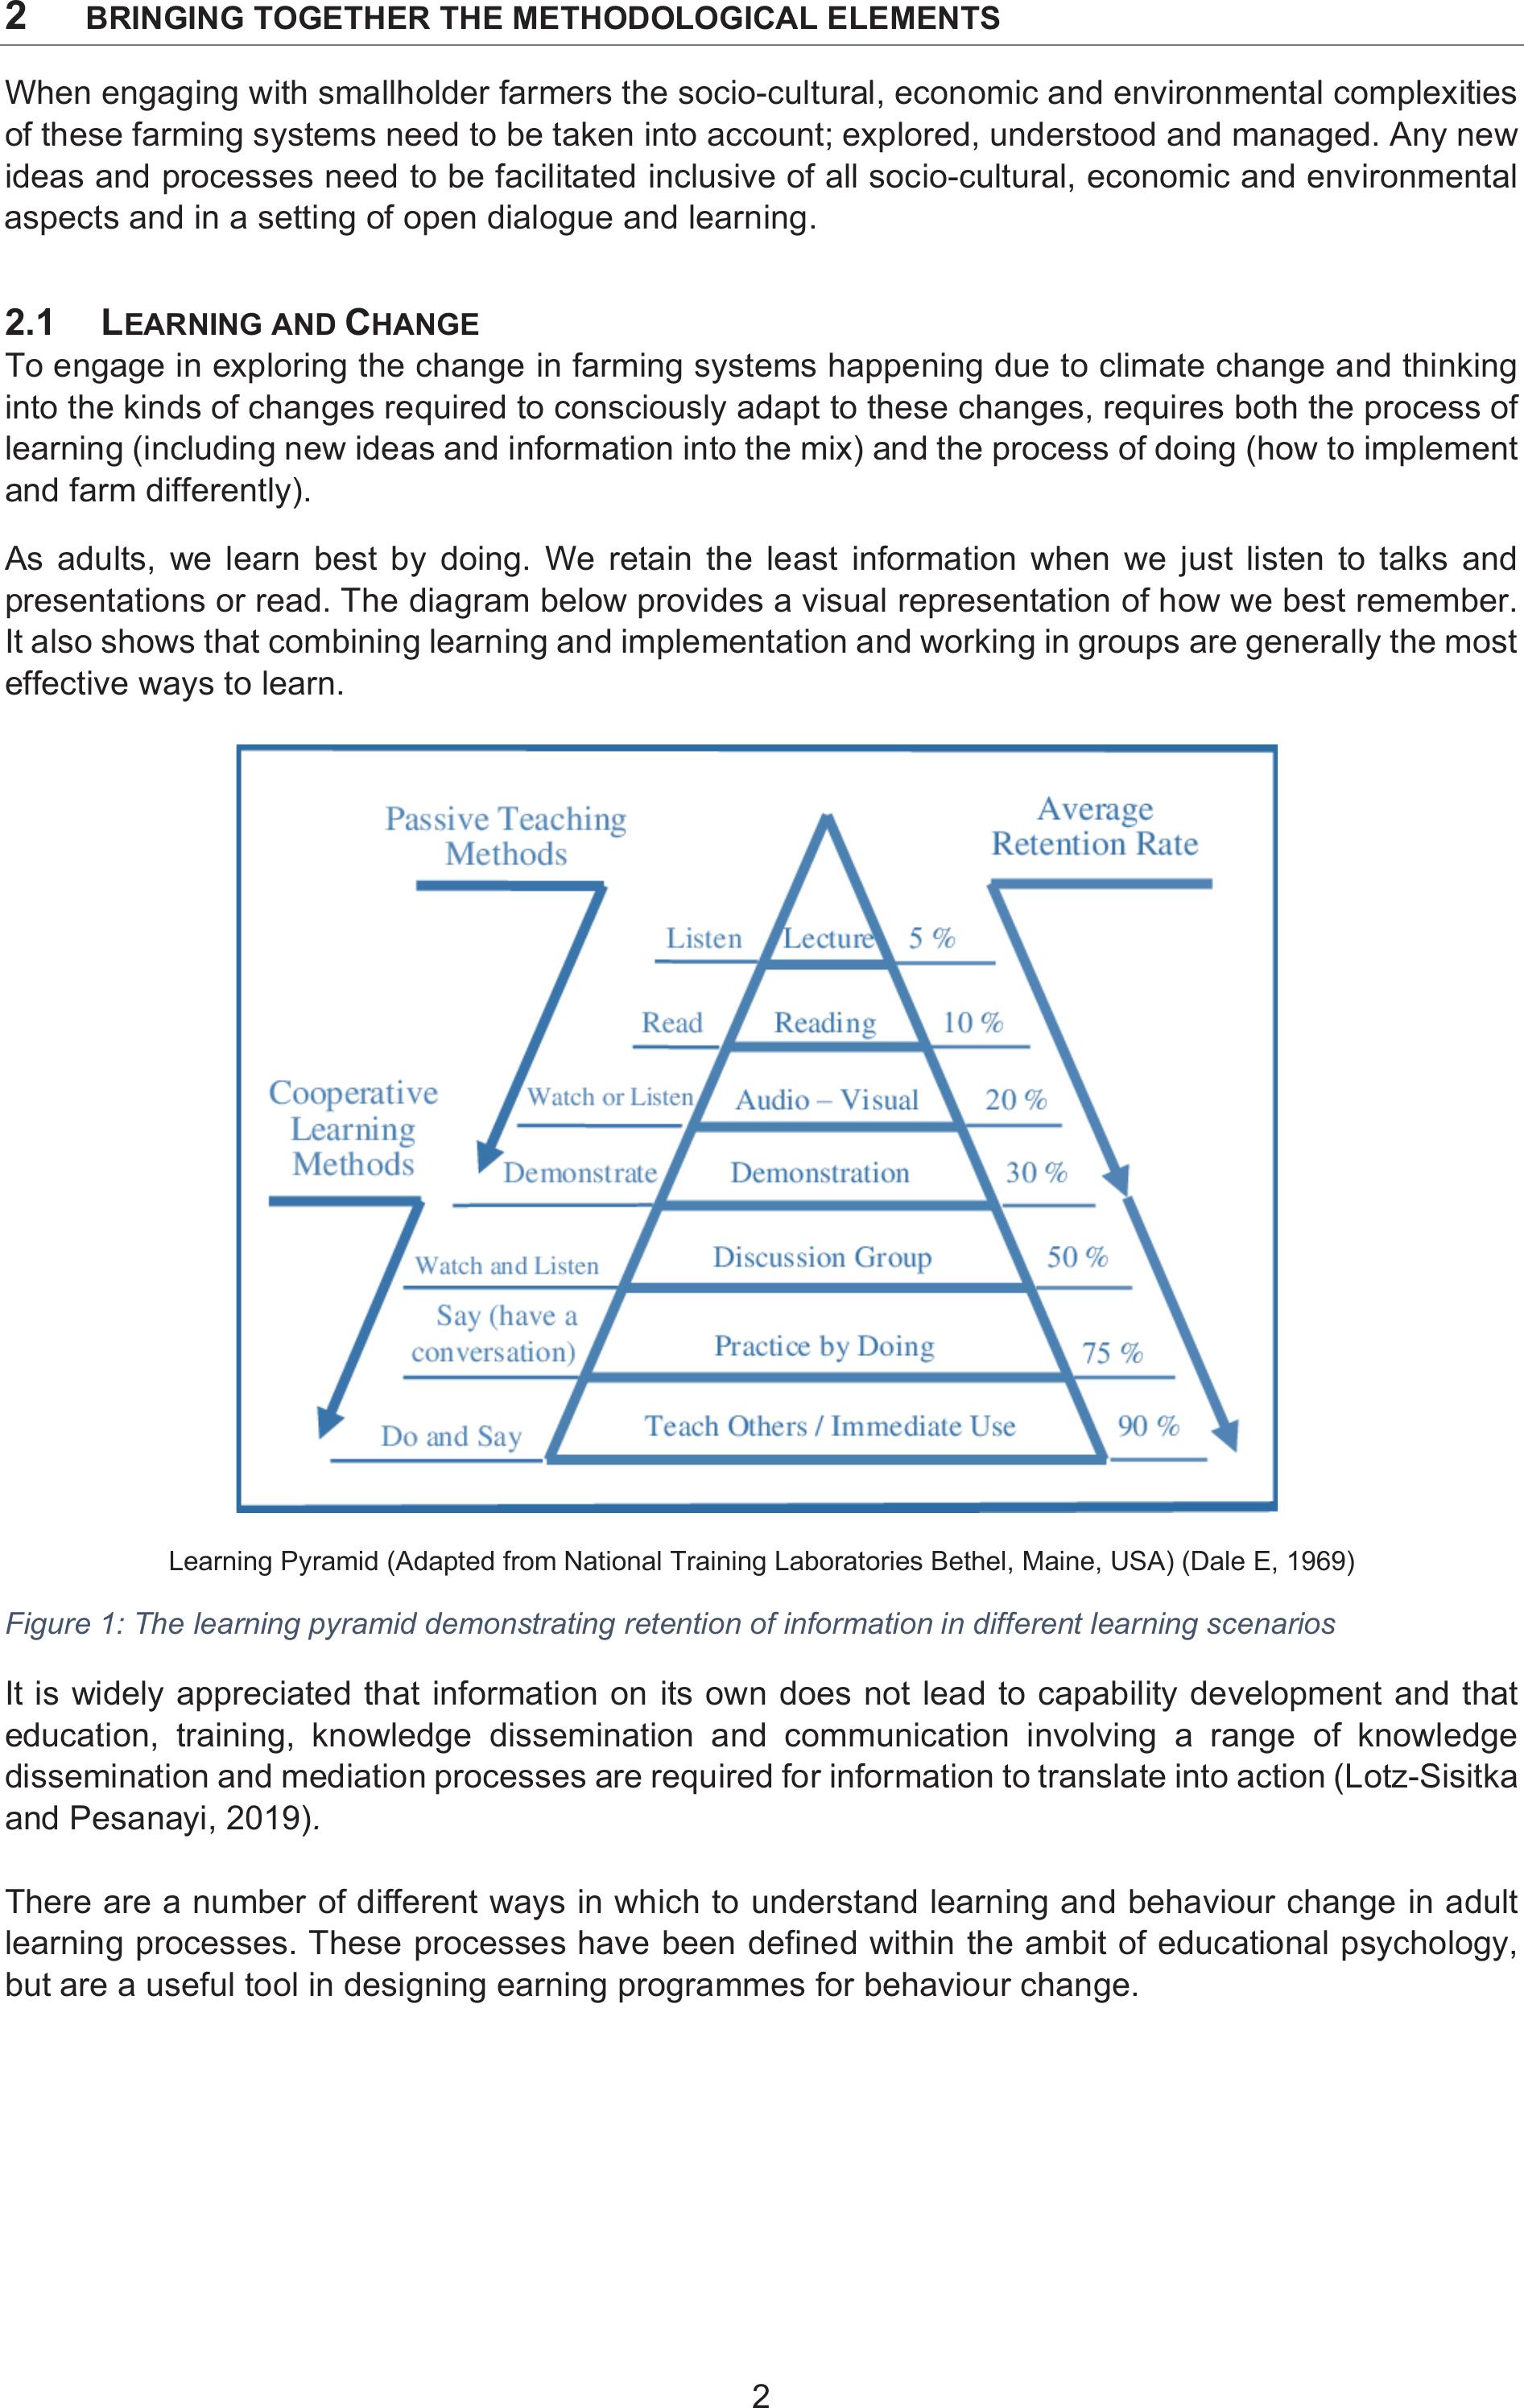
As adults, we learn best by doing. We retain the least information when we just listen to talks and
presentations or read. The diagram below provides a visual representation of how we best remember.
It also shows that combining learning and implementation and working in groups are generally the most
effective ways to learn.
Learning Pyramid (Adapted from National Training Laboratories Bethel, Maine, USA) (Dale E, 1969)
Figure 1: The learning pyramid demonstrating retention of information in different learning scenarios
It is widely appreciated that information on its own does not lead to capability development and that
education, training, knowledge dissemination and communication involving a range of knowledge
dissemination and mediation processes are required for information to translate into action (Lotz-Sisitka
and Pesanayi, 2019).
There are a number of different ways in which to understand learning and behaviour change in adult
learning processes. These processes have been defined within the ambit of educational psychology,
but are a useful tool in designing earning programmes for behaviour change.
3
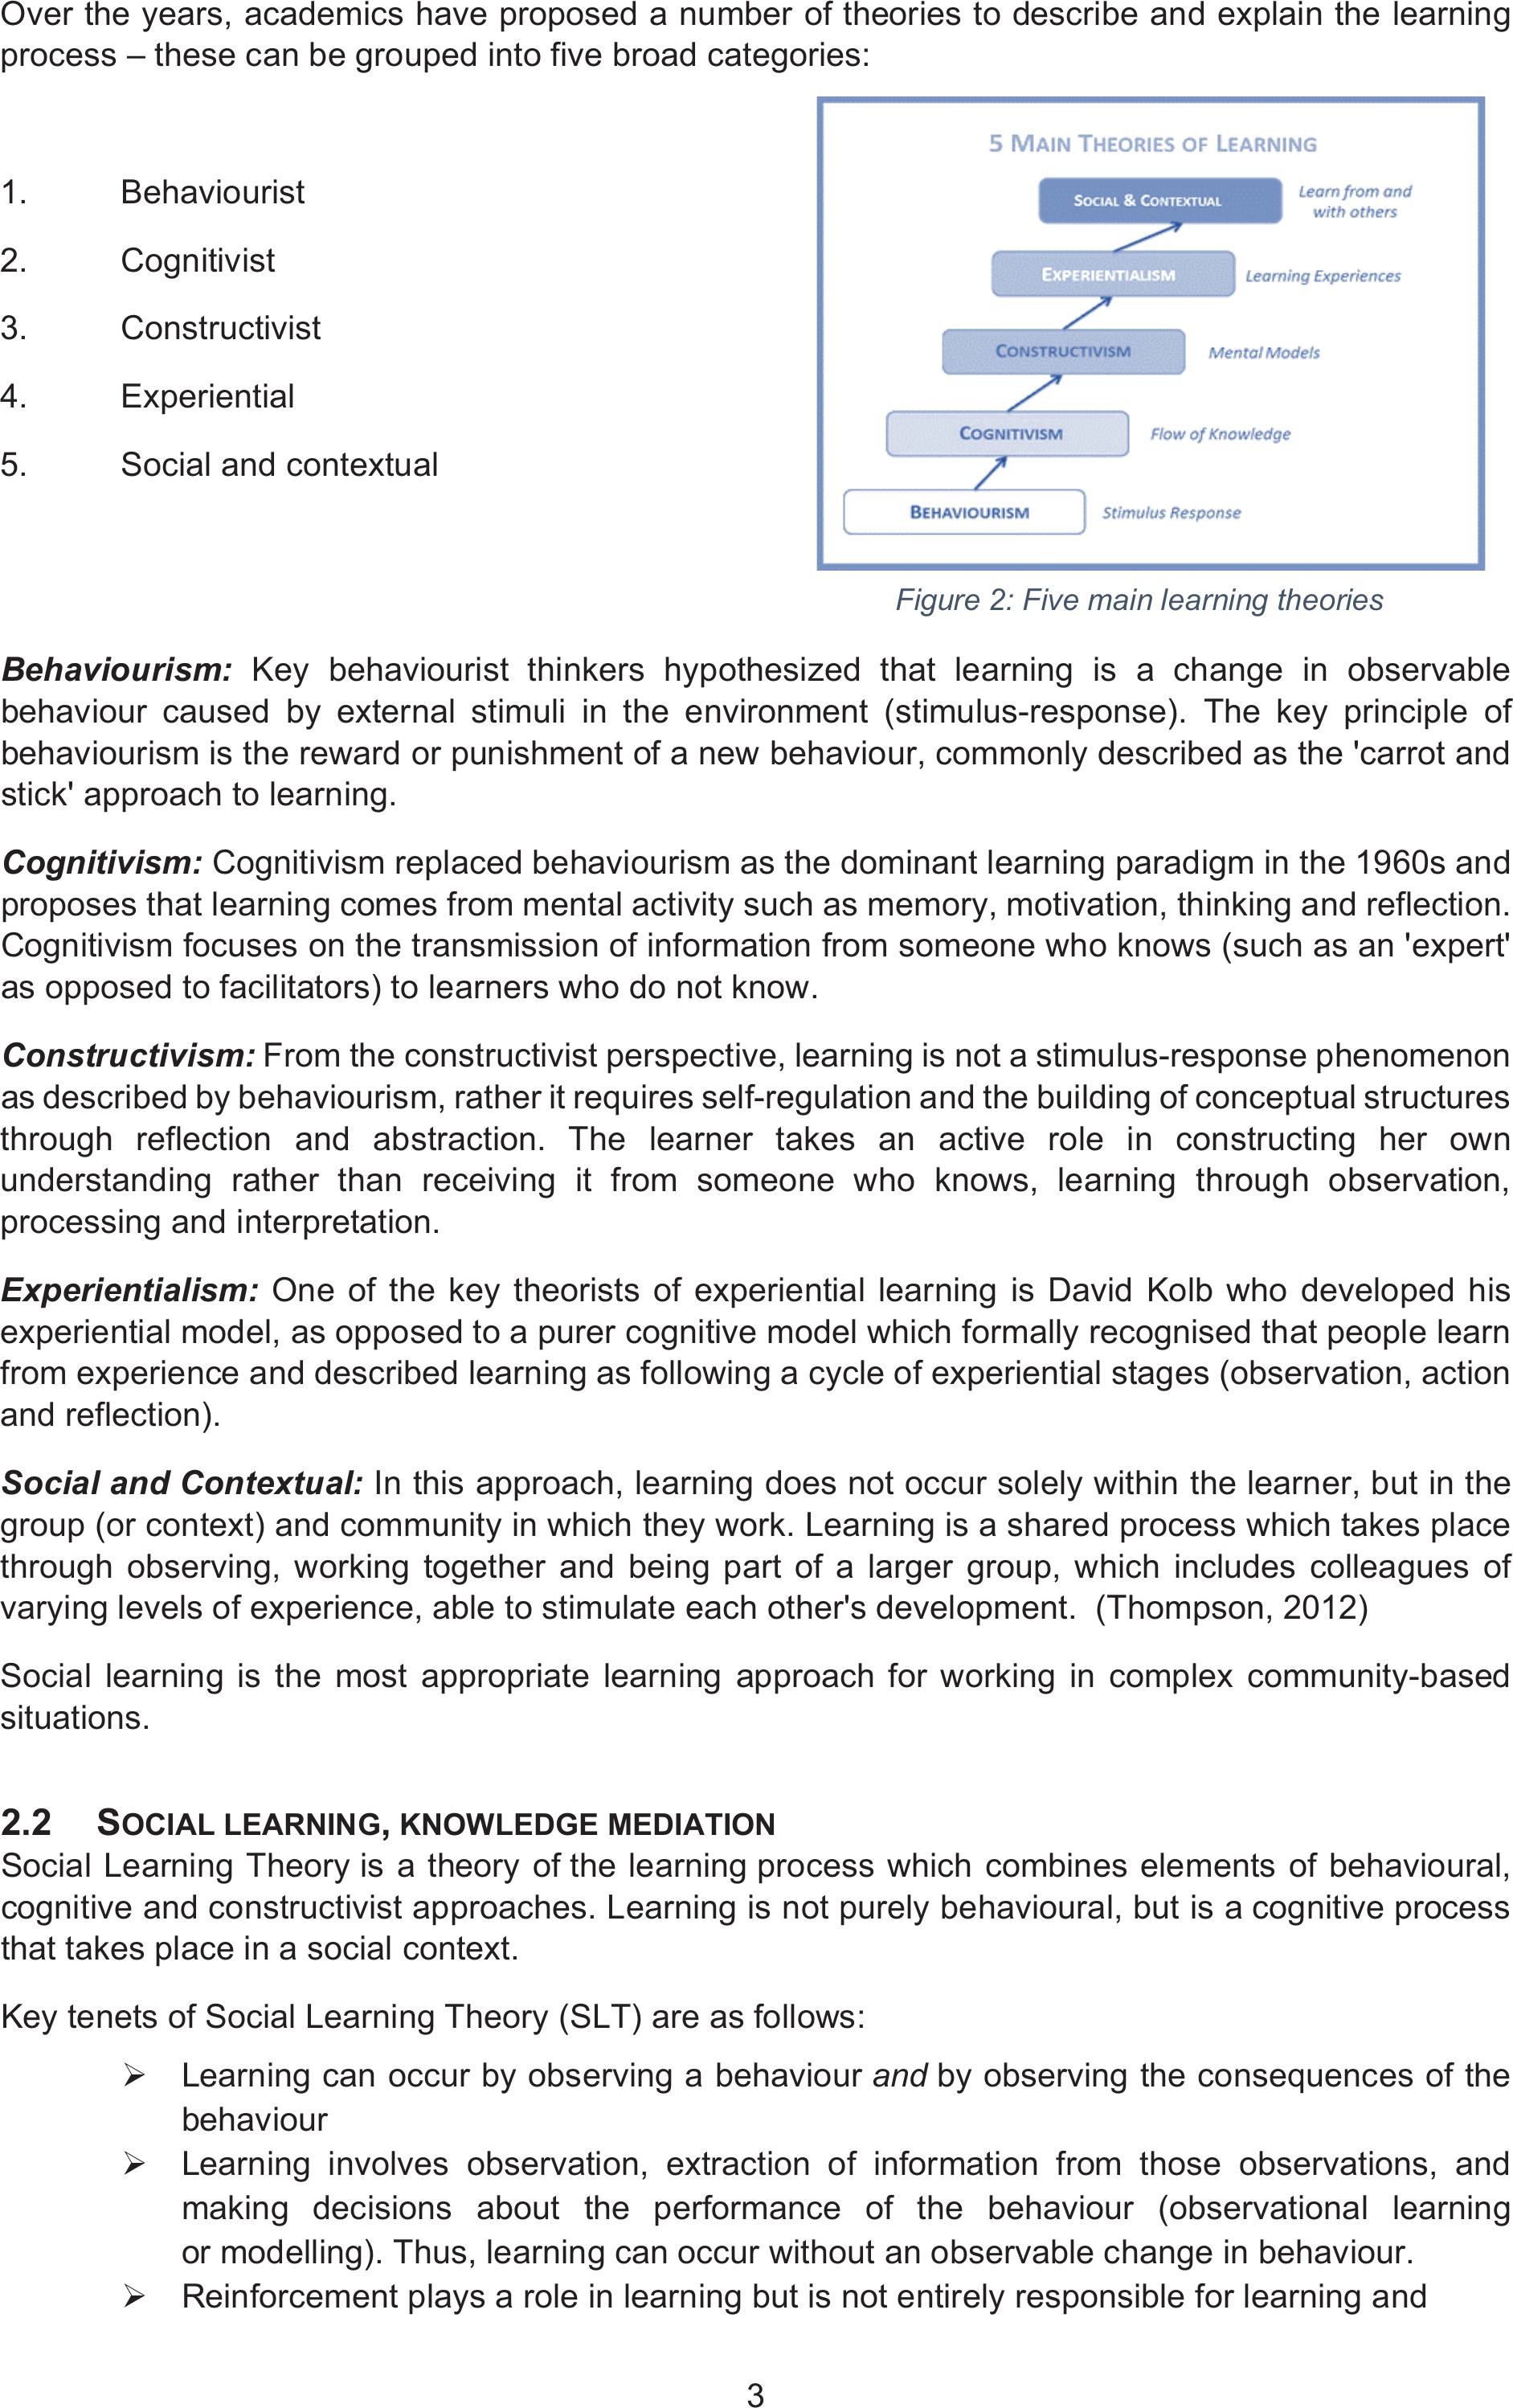
Over the years, academics have proposed a number of theories to describe and explain the learning
process – these can be grouped into five broad categories:
1. Behaviourist
2. Cognitivist
3. Constructivist
4. Experiential
5. Social and contextual
Figure 2: Five main learning theories
Behaviourism: Key behaviourist thinkers hypothesized that learning is a change in observable
behaviour caused by external stimuli in the environment (stimulus-response). The key principle of
behaviourism is the reward or punishment of a new behaviour, commonly described as the 'carrot and
stick' approach to learning.
Cognitivism: Cognitivism replaced behaviourism as the dominant learning paradigm in the 1960s and
proposes that learning comes from mental activity such as memory, motivation, thinking and reflection.
Cognitivism focuses on the transmission of information from someone who knows (such as an 'expert'
as opposed to facilitators) to learners who do not know.
Constructivism: From the constructivist perspective, learning is not a stimulus-response phenomenon
as described by behaviourism, rather it requires self-regulation and the building of conceptual structures
through reflection and abstraction. The learner takes an active role in constructing her own
understanding rather than receiving it from someone who knows, learning through observation,
processing and interpretation.
Experientialism: One of the key theorists of experiential learning is David Kolb who developed his
experiential model, as opposed to a purer cognitive model which formally recognised that people learn
from experience and described learning as following a cycle of experiential stages (observation, action
and reflection).
Social and Contextual: In this approach, learning does not occur solely within the learner, but in the
group (or context) and community in which they work. Learning is a shared process which takes place
through observing, working together and being part of a larger group, which includes colleagues of
varying levels of experience, able to stimulate each other's development. (Thompson, 2012)
Social learning is the most appropriate learning approach for working in complex community-based
situations.
2.2 SOCIAL LEARNING, KNOWLEDGE MEDIATION
Social Learning Theoryis a theory of the learning process which combines elements of behavioural,
cognitive and constructivist approaches. Learning is not purely behavioural, but is a cognitive process
that takes place in a social context.
Key tenets of Social Learning Theory (SLT) are as follows:
¾Learning can occur by observing a behaviourandby observing the consequences of the
behaviour
¾ Learning involves observation, extraction of information from those observations, and
making decisions about the performance of the behaviour (observational learning
or modelling). Thus, learning can occur without an observable change in behaviour.
¾Reinforcement plays a role in learning but is not entirely responsible for learning and
4
¾The learner is not a passive recipient of information. Cognition, environment, and behaviour
all mutually influence each other.
According to the sociocultural theory of education (an extension of SLT), learning is social; we learn
through interacting with others, through a meaningful exchange of ideas, concepts, and actions.
Knowledge is mediatedthrough dialoguing with the other (other members of the community,
stakeholders, facilitators, etc.). This process allows for the negotiation of meaning through dialogues
with others who have a different understanding of the topic. It allows for the interplay between different
sociocultural perspectives and the development of new understanding that can lead to different actions
and behaviours, or stated in a slightly different way”
“Contemporary theories of learning and change indicate that for knowledge or information to become
meaningful, there is 1) a need for the information to be related to the situation and experience of the
user; and that this needs to 2) be mediated in context; in addition to 3) providing new knowledge or
information that can expand existing knowledge and/or practice” (Lotz-Sisitka and Pesanayi, 2019).
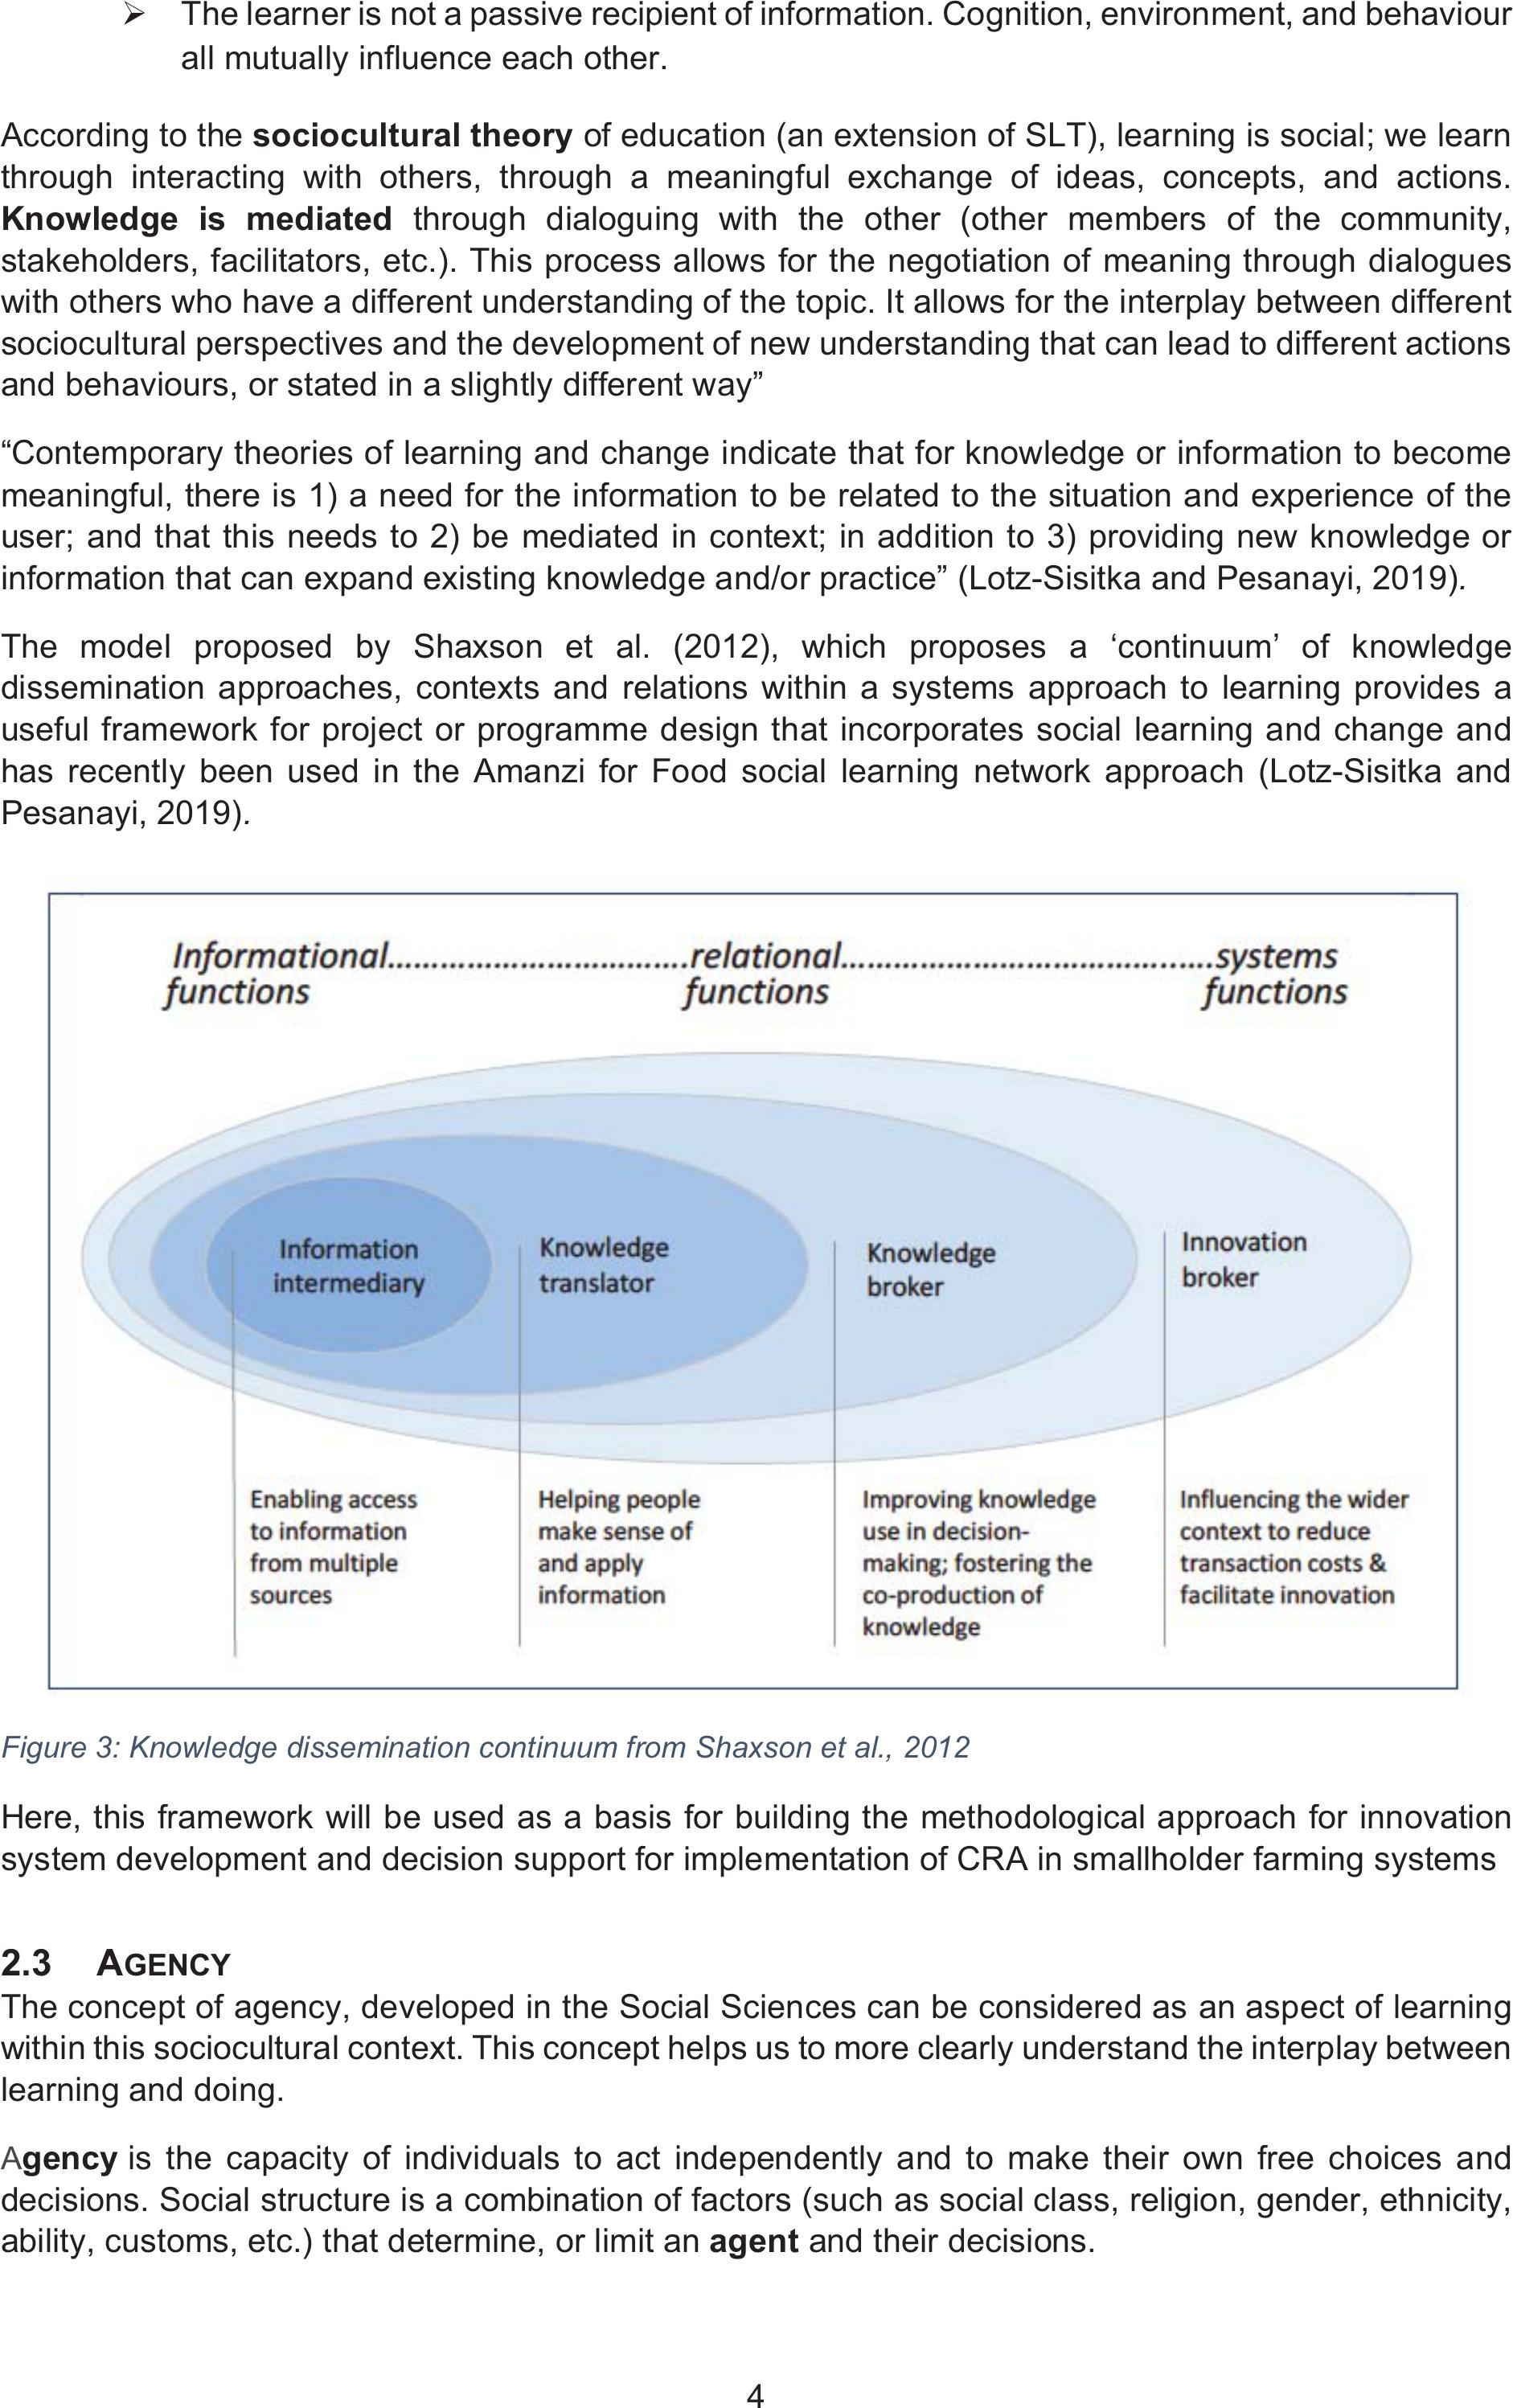
The model proposed by Shaxson et al. (2012), which proposes a ‘continuum’ of knowledge
dissemination approaches, contexts and relations within a systems approach to learning provides a
useful framework for project or programme design that incorporates social learning and change and
has recently been used in the Amanzi for Food social learning network approach (Lotz-Sisitka and
Pesanayi, 2019).
Figure 3: Knowledge dissemination continuum from Shaxson et al., 2012
Here, this framework will be used as a basis for building the methodological approach for innovation
system development and decision support for implementation of CRA in smallholder farming systems
2.3 AGENCY
The concept of agency, developed in the Social Sciences can be considered as an aspect of learning
within this sociocultural context. This concept helps us to more clearly understand the interplay between
learning and doing.
Agencyis the capacity of individuals to act independently and to make their own free choices and
decisions. Social structure is a combination of factors (such as social class, religion, gender, ethnicity,
ability, customs, etc.) that determine, or limit an agent and their decisions.
5
The ways in which people understand their own relationship to the past, future, and present also make
a difference to their actions; there are cultural habits and ways of understanding one’s place in the
world, that sustain identities, meaning and interactions over time. These differ between cultures and
change over time. It is also possible for individuals within cultures to change their own understanding
of their role and their understanding of the world as more or less responsive to human imagination,
purpose, and effort. While repertoires are limited by individual and collective histories and may be more
or less extensive and flexible, they do require a certain degree of manoeuvrability in order to assure the
appropriateness of the response to the situation at hand.
Habitual actions are largely unreflective (not thought about) and taken for granted, but are nevertheless
a form of agency, as they involve attention and effort. People encounter problematic situations that
need imagination and judgement solve and these situations provide for reflection and the analysis of
patterns that may in some contexts allow for greater imagination, choice, and conscious purpose.
(Emirbayer and Mische, 1998)
But people do not merely repeat past routines, they are also the inventors of new possibilities for thought
and action. A certain increase in freedom and flexibility of action is possible, as one becomes more
conscious of one’s situation. “Experience in its vital form is experimental, an effort to change the given;
it is characterized by projection, by reaching forward into the unknown.” (Dewey, 1981)
We draw upon past experiences (our own and that of others) in order to clarify motives, goals, and
intentions, to locate possible future constraints, and to identify morally and practically appropriate
courses of action.
After surveying possible scenarios of action, actors face the task of proposing solutions that will
adequately respond to their moral, practical and emotional concerns. Such resolutions will often attempt
to resolve several conflicts simultaneously and to incorporate different fields of intended action. They
may be put to the test in tentative or exploratory social interactions; interactions that may be
transformative in nature. (Hays, 1994)
Even relatively unreflective routine dispositions must be adjusted in changing situations; and newly
imagined projects must be brought down to earth within real-world circumstances. Moreover, judgments
and choices must often be made in the face of considerable ambiguity, uncertainty, and conflict; means
and ends sometimes contradict each other, and unintended consequences require changes in strategy
and direction.
By increasing their capacity for practical evaluation, actors strengthen their ability to exercise agency in
a mediating fashion, enabling them (at least potentially) to pursue their projects in ways that may
challenge and transform their societies. (New, 2007)
This orientation toward action provides a powerful tool to respond to a rapidly changing world;
composed of increasingly complex and overlapping matrices of social, political, and economic relations.
If we cannot control the consequences of our interventions, we can at least commit ourselves to a
responsive, experimental, and deliberative attitude as we confront emergent problems and possibilities
across the variety of contexts within which we act.
2.4 SOCIAL ENGAGEMENT
From the previous sections, we have ascertained that involvement in any communities, including rural,
farming communities, is a process of social engagement first and foremost as well as a process of
research; exploration, understanding and trying out new ideas.
Key principles of engagement resonate with the previously discussed concepts of learning processes
and agency and can be summarised as follows:
COLLABORATION: Researchers and community members co-create the intervention;
Assessment of need, design of intervention, and evaluation are done together, with community inputs
6
carrying weight. Collective self-determination should be the basis for needs assessment. This requires
flexibility as the intervention may take new directions not initially envisioned by researchers.
INCLUSION: Everyone who has a stake in the intervention has a right to participate in processes
and decisions; Efforts are made to ensure no one who has stake is excluded from participation or
decision making on the basis of any demographic or socio-political factor. Work for diversity. The
research team will not default to working with visible or influential players. The vulnerable, marginalised,
least vocal will be actively included. Be aware of how power is recognised, structured and shared in a
community.
SAFETY: The process and intervention are conducted in a way that is safe for all participants;
This includes the spaces chosen for meetings, the design of processes and interactions (e.g. how small
groups are set up), the design of learning tasks (begin with simple, clear tasks). Allow small groups to
find their voices. Establishing competence and experience contributes to safety. Make space for
informal interactions where views or needs can be expressed in safety.
RESPECT AND BUILD ON LOCAL AND TRADITIONAL KNOWLEDGE: People are experts in their
own context and what they know is the foundational for new engagement. The research team must
become thoroughly acquainted with the community: culture, social networks, economic conditions,
demographics, history with other interventions – and respond to the realities and dynamics that exist.
MUTUALITY AND EQUALITY IN LEARNING: Everyone already has knowledge and experience,
everyone will learn; Prior knowledge of everyone is taken into account; life experience is used as the
basis for relating to new knowledge, attitudes or skills. Researchers and participants are equals; all are
learners. Peers challenge and mentor each other. Aim for both individual and collective learning and
growth.
PRAXIS: Learning is structured through active doing and reflecting;Learners consider new
content (skills, knowledge, attitudes) and re-create them to fit their context, then try it and reflect on how
it works. Learning happens with the mind, emotions and muscles. Passive learning teaches passivity.
The process, not only the outcomes, are important.
BUILD A CULTURE OF OPEN DIALOGUE: Encourage expression of different opinions and value
minority views and individual insights. Talk transparently about power dynamics.
FLEXIBILITY:The research, programmes, projects and interventions must serve the wellbeing of the
community and the environment; not the other way around. They should be structured with reflective
processes that allow them to be reshaped as needed as a clearer perspective unfolds.
TRANSPARENCY AND ACCOUNTABILITY;Work for a culture where researchers and community
members operate with transparency and are accountable for their roles and actions. Work for a culture
of accountability to oneself for realising one’s aims in the process.
BUILD FOR THE LONG TERM; Build into the intervention mechanisms to sustain collaborations over
the long term and work to mobilise community assets to this end; as collaborations mature and grow,
their ability to address complex and long-range issues also grows.
2.5 COMMUNITIES OF PRACTICE
Communities of Practice (CoPs) are a progressive theory of knowledge management, knowledge
creation and learning; knowledge mediation. It is a type of contextualised learning, proposing that the
learning process of an individual is much more than the cognitive process of acquisition of skills and
knowledge but situated in a social context, and it is through participation in the social context that the
learning process occurs. (Lave and Wenger, 1991)
7
It thus depends on a group of people, contextually defined, who share a common interest and a desire
to learn from and contribute to the community with their variety of experiences. Stated more simply, the
primary purpose of a CoP is to provide a way for practitioners to share tips and best practices, ask
questions of their colleagues, and provide support for each other.
Work on large, complex projects goes beyond the knowledge of one person to require the knowledge
and skills of people from different disciplines. They need to coordinate their activities and synthesize
their knowledge. Cross-disciplinary team participation requires an ability to negotiate team process and
participate in decision-making (Poggenpohl, 2015). It moves from primary experience through refined
reflection to explanation; moving from the tacit to the explicit.
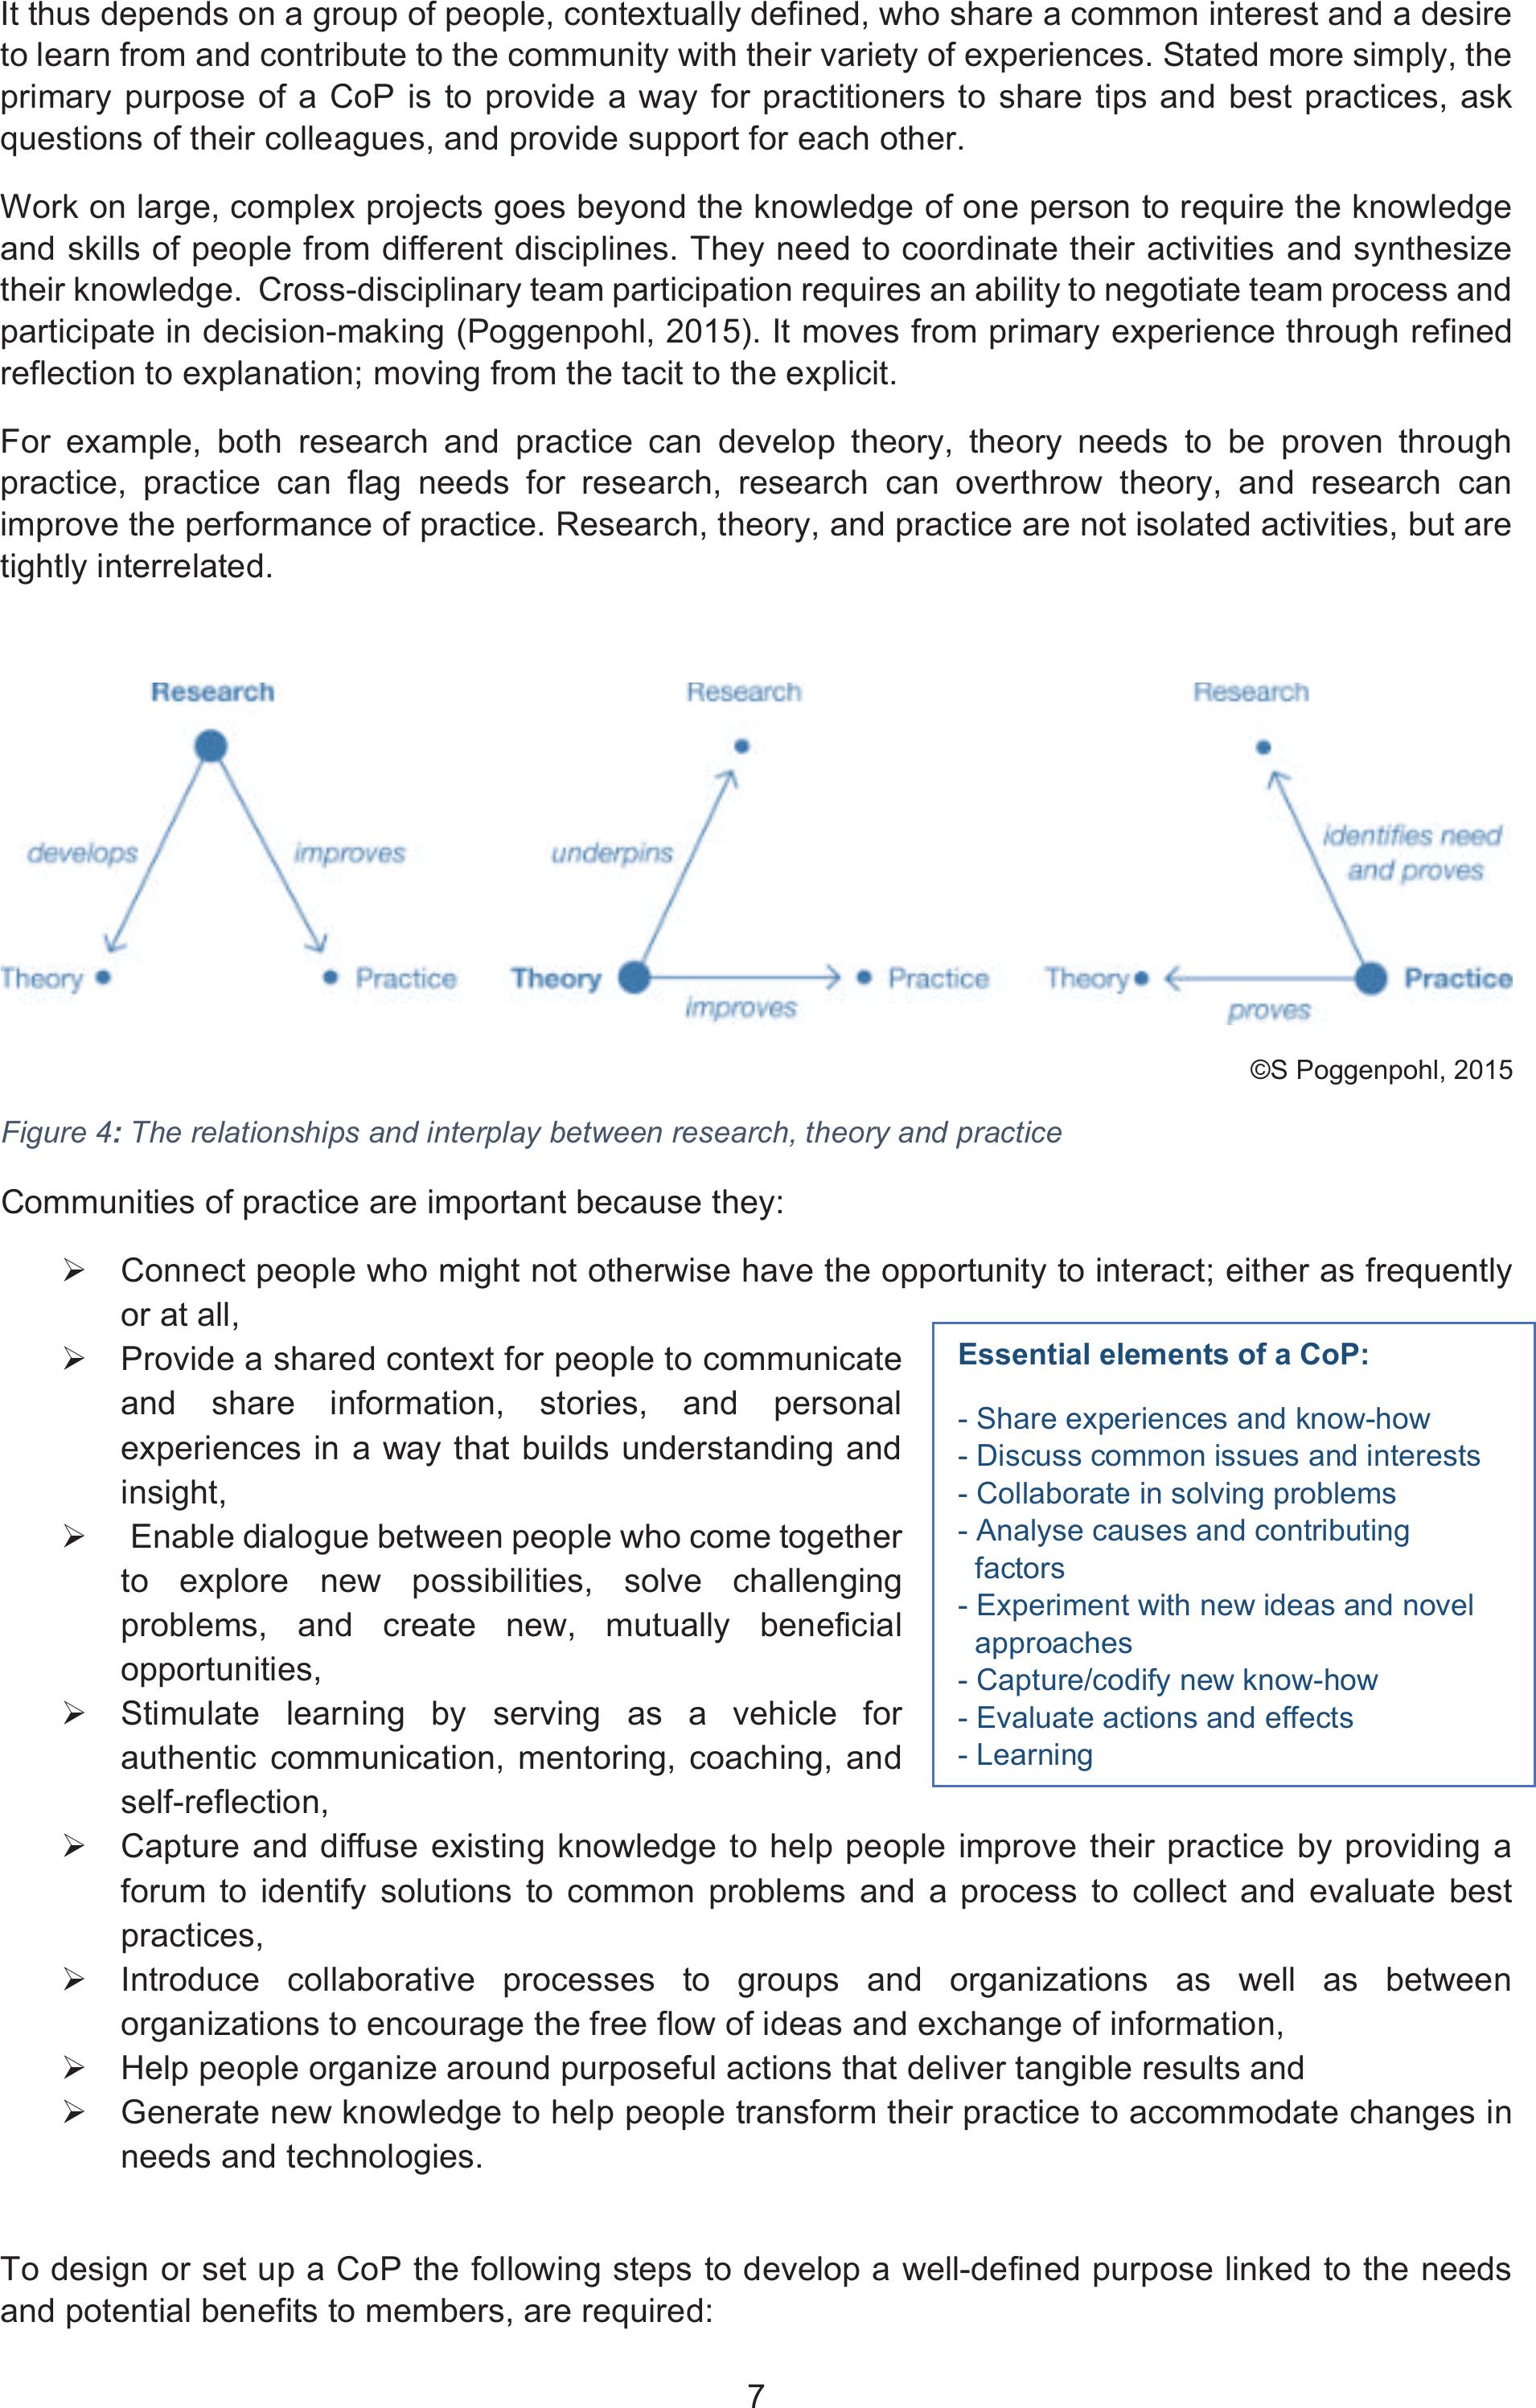
For example, both research and practice can develop theory, theory needs to be proven through
practice, practice can flag needs for research, research can overthrow theory, and research can
improve the performance of practice. Research, theory, and practice are not isolated activities, but are
tightly interrelated.
©S Poggenpohl, 2015
Figure 4: The relationships and interplay between research, theory and practice
Communities of practice are important because they:
¾Connect people who might not otherwise have the opportunity to interact; either as frequently
or at all,
¾Provide a shared context for people to communicate
and share information, stories, and personal
experiences in a way that builds understanding and
insight,
¾Enable dialogue between people who come together
to explore new possibilities, solve challenging
problems, and create new, mutually beneficial
opportunities,
¾Stimulate learning by serving as a vehicle for
authentic communication, mentoring, coaching, and
self-reflection,
¾Capture and diffuse existing knowledge to help people improve their practice by providing a
forum to identify solutions to common problems and a process to collect and evaluate best
practices,
¾Introduce collaborative processes to groups and organizations as well as between
organizations to encourage the free flow of ideas and exchange of information,
¾Help people organize around purposeful actions that deliver tangible results and
¾Generate new knowledge to help people transform their practice to accommodate changes in
needs and technologies.
To design or set up a CoP the following steps to develop a well-defined purpose linked to the needs
and potential benefits to members, are required:
Essential elements of a CoP:
- Share experiences and know-how
- Discuss common issues and interests
- Collaborate in solving problems
- Analyse causes and contributing
factors
- Experiment with new ideas and novel
approaches
- Capture/codify new know-how
- Evaluate actions and effects
- Learning
8
1. Developing relationships: Interaction with and developing of a wider network of peers working
with a process of building trust, reciprocity, mutual respect and commitment.
2. Developing practice: Practice evolves with the community as a collective product, becomes
integrated into members’ work and organizes knowledge in a way that reflects practitioners’
perspectives. Successful practice development depends on a balance between “the production
of ‘things’ like documents or tools and deep learning experiences for community members.
3. Carrying out tasks and projects:Small group projects, sponsored by the community, help
members create personal relationships and also provide a way to produce the resources for
developing the practice: cases, effective practices, tools, methods, articles, lessons learned,
databases, learning tools and aids, models and the like.
4. Creating new knowledge:Members go beyond current practice to explore the cutting edge of
the domain, to innovate. Community may redefine its boundaries and membership and foster
boundary-crossing, possibly working with people from other communities to explore emerging
technologies, practices, and ideas.
Actions for the CoP are based on the premises of inquiry, design, activities, communication, interaction,
learning, knowledge sharing, collaboration, roles and social structures and piloting and roll out of the
processes.
Examples of CoPs are learning groups, innovation platforms, forums, networks and research and
implementation teams.
2.6 INNOVATION SYSTEMS
Methodologies for agricultural development and research have been designed to incorporate the
concepts of social engagement, learning, experimentation and agency into the process.
The international development community is giving increased attention to agricultural innovation
processes and systems that lead to outcomes at scale. Inclusive multi-dimensional and multi-
stakeholder learning processes are seen as important. Smallholder family farmers become more
central in the design and implementation of research processes as partners in planning and
implementation processes (Kruger and Gilles, 2014).
Key trends in Participatory Agricultural development thinking show a movement or change from:
¾Increases in production to improvement in local livelihoods,
¾Technology transfer to local innovation development,
¾Beneficiaries of projects to influential stakeholders within programmes,
¾Technology transfer to co-development of innovation systems,
¾Functional participation to empowerment and
¾Applied and adaptive research to strategic and pre-adaptive research.
Global experience shows that new ways of thinking about and doing agricultural research and
development are required. The basic paradigm shift is one of moving away from the idea that research
and development is a process of generating and transferring modern technology to farmers. And then
moving towards seeing the idea as an inclusive multi-dimensional learning process that:
¾Works from a holistic perspective that includes biophysical, socio-political and economic
perspectives in agriculture and natural resource management,
¾Draws upon diverse sources of knowledge – from local to global,
¾Provides for meaningful participation of user groups in the process of investigating improvements
in local situations,

9
¾And builds synergy between local capacities, resources and innovations by
oProviding decision support tools and information that enables various types of users to
make strategic choices and actions,
¾Which results in a wide range of knowledge products (technological through to socio-political) for
generating, sharing, exchanging and utilizing knowledge.
Now, concepts such as strategic and pre-adaptive participatory research become important as does
the idea of best practise scenarios and options and the mainstreaming of cross cutting issues and
themes. In many ways, these concepts are still in a developmental phase and are not as yet integral in
existing institutional and research cultures.
The development of methodological frameworks and processes to encompass the above themes and
goals has followed two broad tracks/lines depending to an extent, on the type of institution at work and
their overall aims; namely Participatory Action research (PAR) and Participatory Innovation
Development (PID). (Brock and Pettit, 2007).
2.7 PARTICIPATORY INNOVATION DEVELOPMENT (PID)
Participatory Innovation Development (PID) is an approach to learning and innovation that is used
in international development as part of projects and programmes relating to sustainable agriculture. The
approach involves collaboration between researchers and farmers in the analysis of agricultural
problems and testing of alternative farming practices.
It has developed out of methodologies such as Farming Systems Research and Extension, PRA
(participatory rural appraisal), PLA (participatory learning and action) and Indigenous Technical
Knowledge Systems and incorporates further methodologies such as Farmer Field Schools.
This approach enables the research and development community to respond to locally defined
problems and to find solutions that build upon local knowledge and are consistent with local resources
and contexts. Moreover, by involving farmers as the users of the research process, it is more likely that
farmers would share and use (new) knowledge.
Local innovation in agriculture and natural resource management goes beyond technologies to socio-
organizational arrangements such as new ways of regulating the use of resources, new ways of
community organization, or new ways of stakeholder interaction. The term Participatory Innovation
Development (PID) embraces this broader understanding of joint research and development and is now
being used alongside, or in place of PTD (Participatory Technology Development). It is a process in
which farmers and other stakeholders engage in joint exploration and experimentation leading to new
technologies or socio-institutional arrangements for more sustainable livelihoods. This action-oriented
approach promotes engagement in a process that strengthens the capacities of agricultural services to
support community-led initiatives (Hartmann, 2009, Wettasinha et al., 2009).
The following statement in a recent publication in the agricultural development and extension field, sums
up the imperative for working with these approaches:

10
“Scientists are being challenged to re-consider that their role in technology development is through
innovation and a complex process involving a reorganization of social relationships, not just technical
practice. In this context, technology shifts from something to be applied to something leveraged for
networking and organizing. To ensure the future, the idea of sustainability as a dynamic process rather
than an endpoint offers a route for understanding and engagement between research, policy and
personal spheres. For both research and extension agendas; in considering traditional agriculture in
the context of economic development we have to create the capacity to co-operate in a way that opens
up the possibility of social change; a way of interacting that preserves and creates new forms of social
cohesion. Researchers will come to understand that attitude, environment and relevant issues, not
specific tools, achieves participation” (Caister et al., 2012).
Figure 5: The interplay between researchers, facilitators and farmers, indicating associated methodologies
Farmer led innovation builds on the PID concepts to include local innovations into the system and
describes the interaction between local communities and outside facilitators, as:
¾Gaining a joint understanding of the main
characteristics and changes of that particular
agroecological system,
¾Defining priority problems,
¾ Experimenting locally with a variety of options
derived both from indigenous knowledge … and
from formal science and
¾Enhancing farmer’s experimental capacities and
farmer-to-farmer communication (Wettasinha et
al., 2009, Rai and Shrestha, 2006).
The text box alongside provides an example of steps
that can be followed to implement a farmer led
innovation process.
A summary of the Farmer Led Innovation
steps
1.Getting started (getting to know each
other);
2.Joint analysis of the situation – the
problems and opportunities;
3.Looking for things to try to improve the local
situation;
4.Trying them out in community-led
participatory experimentation;
5.Jointly analysis and sharing the results; and
6.Strengthening the process, often through
improving local organization and linkages
with other actors in R&D, so that the
innovation process will continue.
PRA/PLA
Farmer to Farmer
PTD/ PID
PAR (Participatory action research)
PRA/PLA (Participatory rural
appraisal/participatory learning and
action)
Farming systems research
Farmer participatory research
PTD/PID (participatory
technology/innovation development)
FFS (Farmer field schools)
PID
Agroecology
Researcher
Developmentfacilitator/
extension/ innovator
Farmer
11
2.8 ADDING THE ELEMENTS TOGETHER: COACTIVE GOVERNANCE IN A CHANGING CLIMATE
The concept of coactive governance is borrowed from industry, where it is being developed to manage
service relationships. This new way shares strategy and responsibility between the client and provider
equally and allows an innovation environment to flourish. Implementing collaborative models in
enterprise environments requires organizational readiness – that is, willingness – to adopt a different
working attitude that accepts change as a condition, rather than an event (Batty, 2017).
In this process we need to combine and synergise the way people learn, what they learn and how they
incorporate this learning into changing their practice into a coherent model that can support an individual
farmer’s decision-making process about which adaptive practices to implement in their context and
farming system.
12
3 CLIMATE CHANGE
There is ample evidence of national and local changes in the temperature and rainfall climatology of
South Africa over at least the past five decades and a high probability that these changes will increase
in the coming decades:
xMean annual temperatures have increased by more than 1.5 times the observed global average of
0.65°C,
xMaximum and minimum temperatures have been increasing annually and in almost all seasons,
xHot and cold extremes have increased and decreased respectively in frequency, in most seasons
across the country, particularly in the western and northern interior,
xIn almost all hydrological zones there has been a marginal reduction in rainfall for the autumn
months. Annual rainfall has not changed significantly, but an overall reduction in the number of rain
days implies a tendency towards an increase in the intensity of rainfall events and increased dry
spell duration and
xExtreme rainfall events show a tendency towards increasing in frequency annually, and especially
in spring and summer, with a reduction in extremes in autumn (DEA, 2013).
Given South Africa’s present trajectory and already alarming increase in average temperatures, the
predictions of strongly increased drought, increased rainfall variability and strongly increased extreme
rainfall events into the future are all but guaranteed.
Climate change impacts on South Africa are likely to be felt primarily via effects on water resources;
with increased evapotranspiration, run-off and soil erosion and reduced surface and underground water
reserves. Significant trade-offs are likely to occur between developmental aspirations, particularly in
terms of the allocation between agricultural and urban-industrial water use, linked to the high costs of
enhancing water supply (DEA, 2017).
With regard to the impact of climate change on food security in Southern Africa, the IPPC makes the
following predictions:
xMaize-based systems, particularly in Southern Africa, are among the most vulnerable to climate
change with predicted yield losses for South Africa and Zimbabwe in excess of 30%,
xLoss of livestock under prolonged drought conditions is a critical risk given the extensive rangeland
in Southern Africa that is prone to drought,
xGroundwater recharge may also be significantly affected by climate change in areas that receive
less than 500 mm per year.
3.1 CLIMATE CHANGE ADAPTATION
Small-holder farmers and pastoralists in particular are being especially hard hit by these changes. Many
of these small-scale producers are already coping with a degraded natural resource base. They often
lack knowledge about potential options for adapting their production systems and have limited assets
and risk-taking capacity to access and use technologies and financial services (SARVA, 2013).
Climate change is intricately linked to almost all facets of our society, particularly socio-economic
progression as resources such as water, feedstock in the form of food and fibre and biodiversity,
amongst others determine the production potential of many sectors of the economy, which in turn affect
human development aspirations of the country.
In South Africa, emphasis is being placed on the development of policies and strategies for climate
change mitigation, albeit slowly, with a much smaller focus on adaptation. Nonetheless, processes such
as collaborative, participatory research that includes scientists and farmers, strengthening of
communication systems for anticipating and responding to climate risks, and increased flexibility in
livelihood options, which serve to strengthen coping strategies in agriculture for near-term risks from

13
climate variability, provide potential pathways for strengthening adaptive capacities for climate change
(IPCC, 2014).
The IPCC defines adaptation as the “adjustments in human and natural systems in response to actual
or expected climatic stimuli or effects, which moderates harm or exploits beneficial opportunities” (ibid.).
Planned adaptations to climate risks are “most likely to be implemented when they are developed as
FRPSRQHQWVRIRUDVPRGL¿FDWLRQVWRH[LVWLQJUHVRXUFHPDQDJHPHQWSURJUDPVRUDVSDUWRIQDWLRQDO
or regional strategies for sustainable development.” (ibid.).
3.2 CLIMATE SMART / RESILIENT AGRICULTURE
The United Nations Food and Agriculture Organisation (FAO) presented its response to climate change;
an approach it has termed Climate Smart Agriculture (CSA) in 2010 (FAO, 2013). In this study, the
research team opted to use the term Climate Resilient Agriculture (CRA), to clearly situate the practices
promoted here within the agroecological sphere, rather than the technological and internet of things
spheres, which are also considered climate smart under the broader definition.
According to the FAO, “Enhancing food security while contributing to mitigation of climate change and
preserving the natural resource base and vital ecosystem services requires the transition to agricultural
production systems that are more productive, use inputs more efficiently, have less variability and
greater stability in their outputs, and are more resilient to risks, shocks and long-term climate variability.
More productive and more resilient agriculture requires a major shift in the way land, water, soil nutrients
and genetic resources are managed to ensure that these resources are used more efficiently” (ibid.)
CRA contributes to the achievement of sustainable development goals. It integrates the three
dimensions of sustainable development (economic, social and environmental) by jointly addressing
food security and climate challenges. It is composed of three main pillars:
1. Sustainably increasing agricultural productivity and incomes,
2. Adapting and building resilience to climate change and
3. Reducing and/or removing greenhouse gases emissions, where possible.
This approach aims to strengthen livelihoods and food security, by improving the management and use
of natural resources and adopting appropriate methods and technologies for the production, processing
and marketing of agricultural goods. The approach is entirely compatible with the idea that CRA
practices are essentially good developmental agricultural practices, applicable in and suitable for a wide
range of contexts (ibid).
Climate Smart Agriculture is the overarching approach (shown in the diagram below) that has been
used to inform this decision support process for smallholder farmers. All CSA practices have the
potential to directly benefit farmers and increase food production in the communities as a whole,
irrespective of any climate change predictions. However, they also have the capacity to buffer farmers
against any increases in temperature or changes in rainfall quantities and patterns occasioned by
climate change.

14
Figure 6: The FAO concept of CSA as an overarching approach to sustainable development (Arslan, 2014)
The FAO characterises CSA as an approach that:
1. Addresses the complex interrelated challenges of food security, development and climate
change and identifies integrated options that create synergies and benefits and reduce trade-
offs
2. Recognizes that these options will be shaped by specific country contexts and capacities and
by the particular social, economic and environmental situation where it will be applied
3. Assesses the interactions between sectors and the needs of different involved stakeholders
4. Identifies barriers to adoption, especially among farmers and provides appropriate solutions in
terms of policies, strategies, actions and incentives,
5. Seeks to create enabling environments through a greater alignment of policies, financial
investments and institutional arrangements
6. Strives to achieve multiple objectives with the understanding that priorities need to be set and
collective decisions made on different benefits and trade-offs
7. Prioritizes the strengthening of livelihoods, especially those of smallholders, by improving
access to services, knowledge, resources (including genetic resources), financial products and
markets
8. Addresses adaptation and builds resilience to shocks, especially those related to climate
change, as the magnitude of the impacts of climate change has major implications for
agricultural and rural development
9. Considers climate change mitigation as a potential secondary co-benefit, especially in low-
income, agricultural-based populations and
10. Seeks to identify opportunities to access climate-related financing and integrate it with
traditional sources of agricultural investment finance (FAO, 2013).
The FAO’s description of CSA makes it clear that appropriate technologies that have been developed
under different agricultural regimes can be entirely compatible with the broad concept of CRA. The
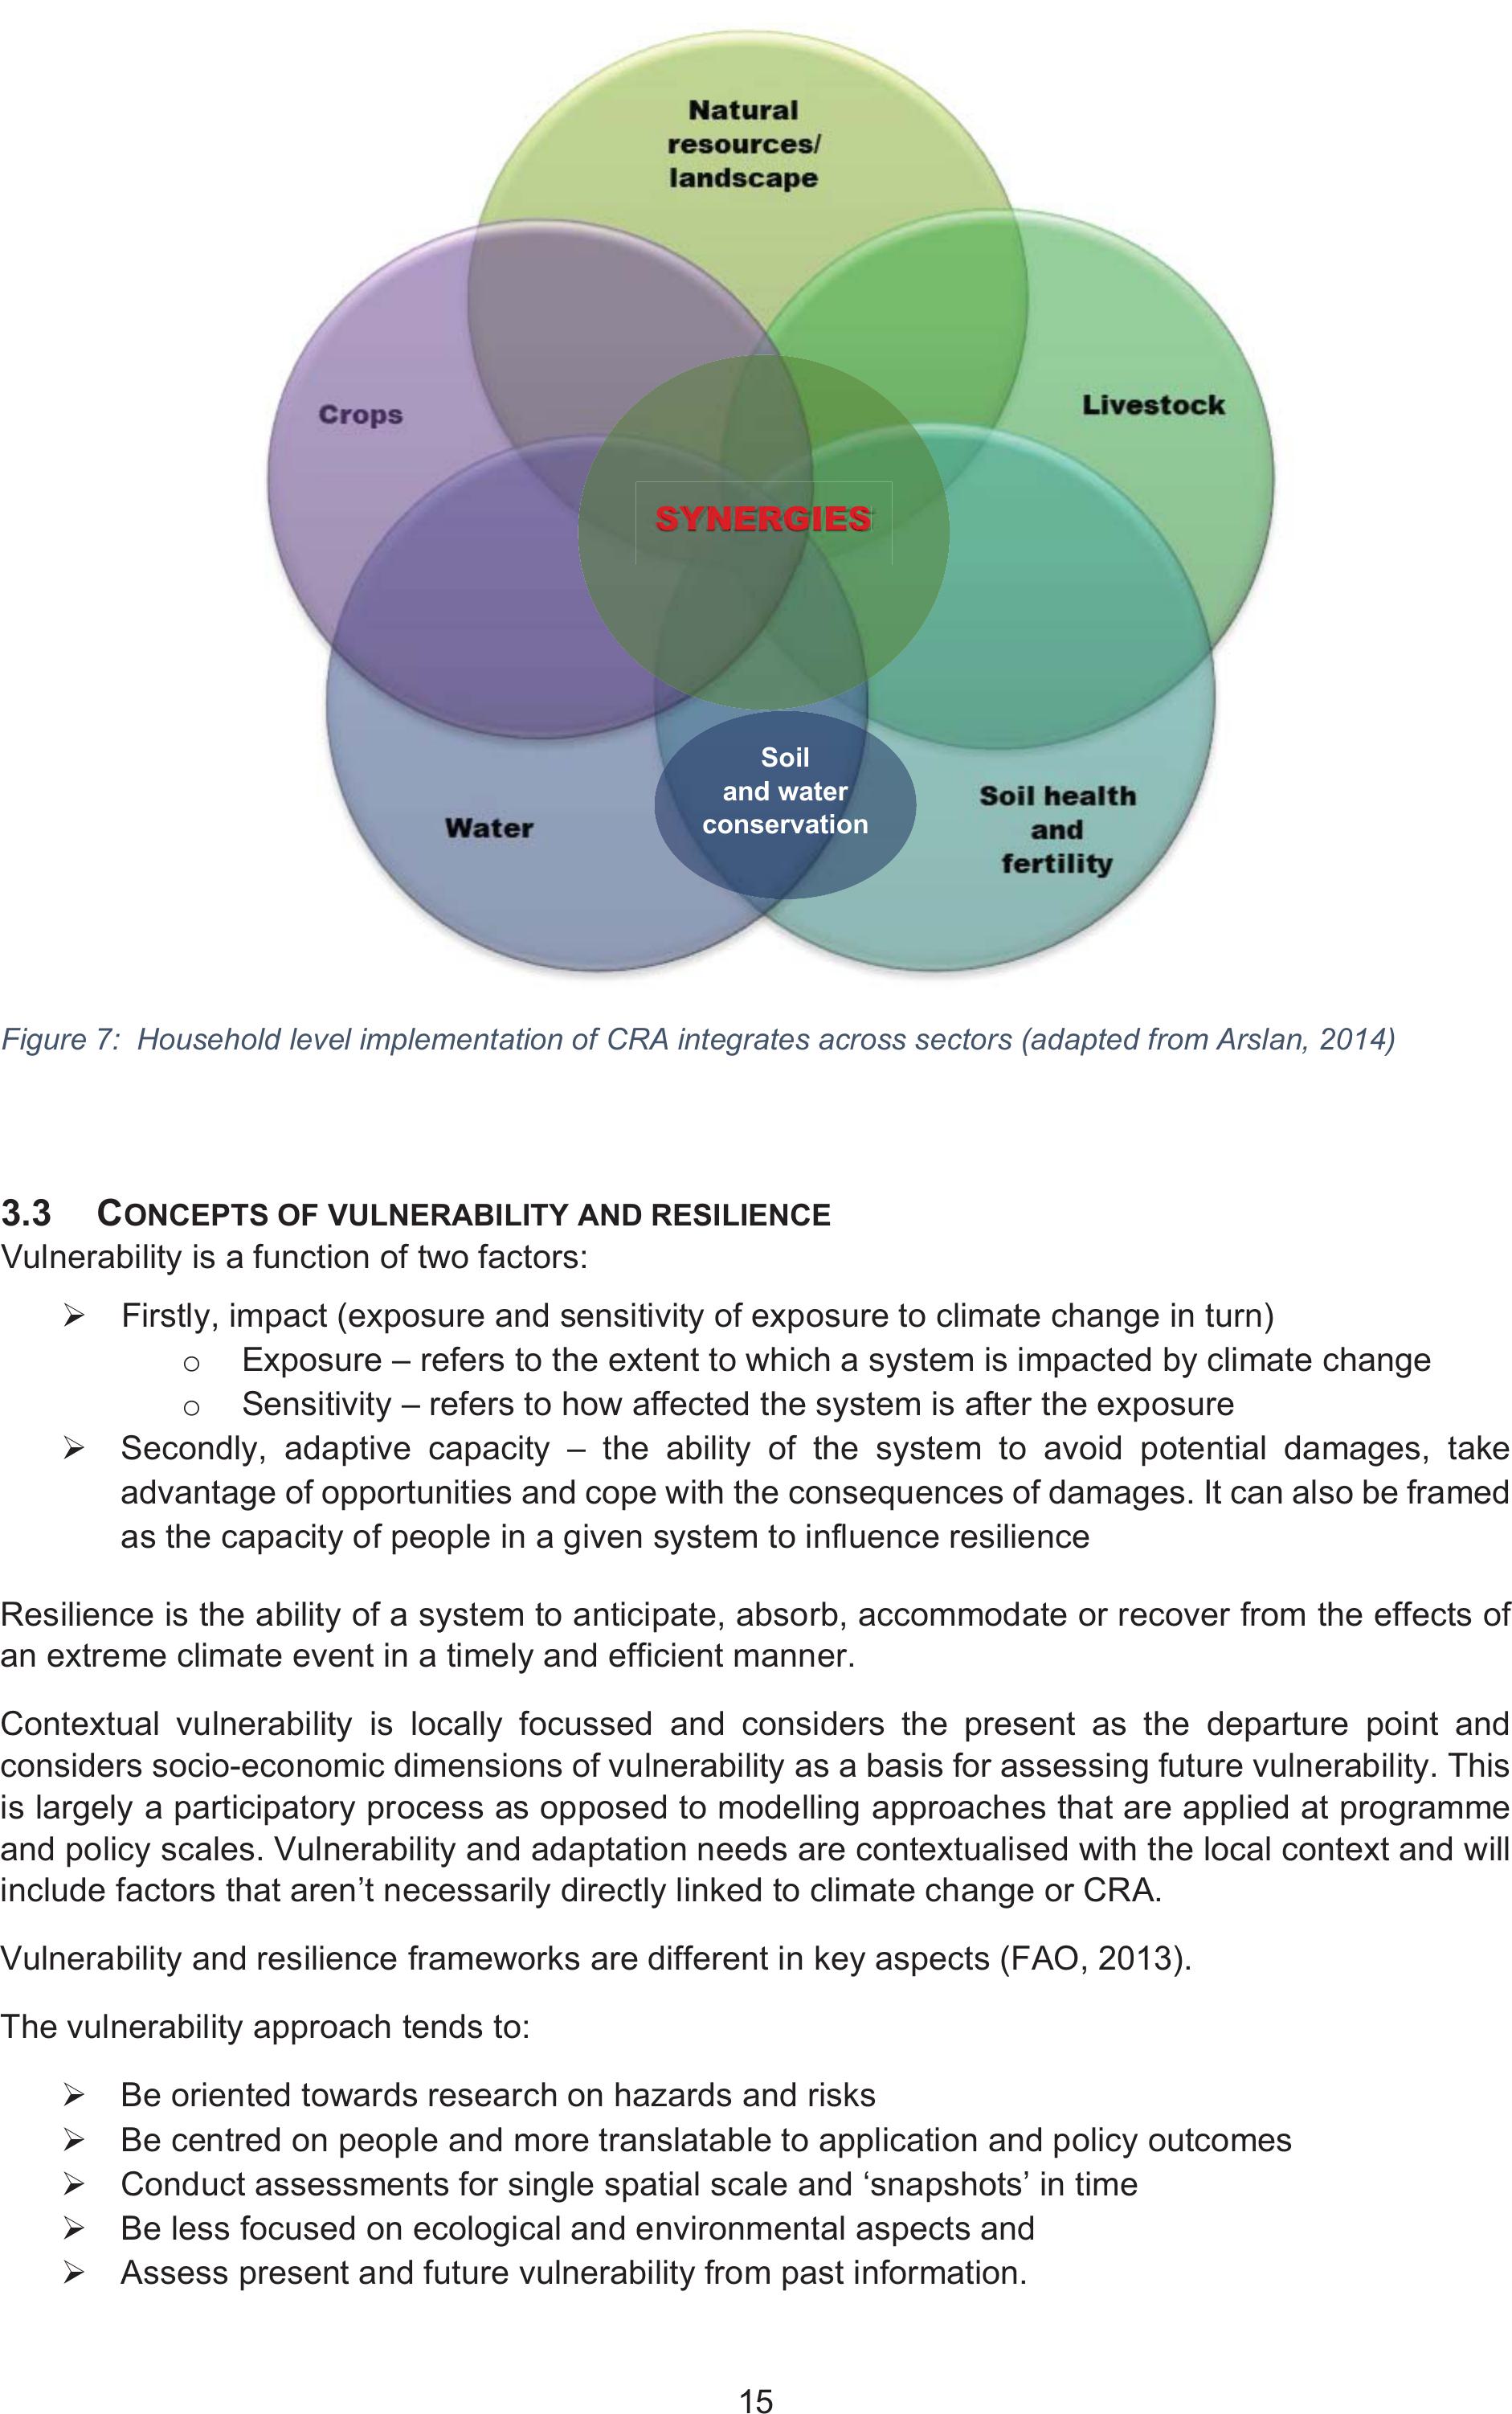
approach here is to work directly with smallholders in local contexts to improve practices and synergise
across sectors. The emphasis is thus at farm/household level. Here CRA aims to improve aspects of
crop production, livestock and pasture management, natural resource management, as well as soil and
water management as depicted in Figure 7.
From farm-basedto comprehensivedevelopmentconcepts
Conservation agriculture
Sustainable land
management
Agroecology
Organic farming
Macro
Micro
Farming
technics
Area - based
management
Multi-function
planning and policies
Climatesmart agriculture
Value
chain
15
Figure 7: Household level implementation of CRA integrates across sectors (adapted from Arslan, 2014)
3.3 CONCEPTS OF VULNERABILITY AND RESILIENCE
Vulnerability is a function of two factors:
¾Firstly, impact (exposure and sensitivity of exposure to climate change in turn)
oExposure – refers to the extent to which a system is impacted by climate change
oSensitivity – refers to how affected the system is after the exposure
¾ Secondly, adaptive capacity – the ability of the system to avoid potential damages, take
advantage of opportunities and cope with the consequences of damages. It can also be framed
as the capacity of people in a given system to influence resilience
Resilience is the ability of a system to anticipate, absorb, accommodate or recover from the effects of
an extreme climate event in a timely and efficient manner.
Contextual vulnerability is locally focussed and considers the present as the departure point and
considers socio-economic dimensions of vulnerability as a basis for assessing future vulnerability. This
is largely a participatory process as opposed to modelling approaches that are applied at programme
and policy scales. Vulnerability and adaptation needs are contextualised with the local context and will
include factors that aren’t necessarily directly linked to climate change or CRA.
Vulnerability and resilience frameworks are different in key aspects (FAO, 2013).
The vulnerability approach tends to:
¾Be oriented towards research on hazards and risks
¾Be centred on people and more translatable to application and policy outcomes
¾Conduct assessments for single spatial scale and ‘snapshots’ in time
¾Be less focused on ecological and environmental aspects and
¾Assess present and future vulnerability from past information.
SYNERGIES
SY
SY
SY
SY
SY
SY
SY
SY
SY
SY
SY
SY
S
S
S
SY
Y
SY
S
S
S
S
S
S
S
S
S
S
Y
Y
Y
NE
NE
NE
NE
NE
NE
N
NE
N
NE
NE
E
NE
E
NE
N
N
NE
N
N
E
RGRG
RG
RG
RG
RG
RG
RG
RG
RG
RG
RG
G
G
G
RG
RG
G
G
RG
G
R
R
G
G
G
G
R
R
R
G
IE
IE
IE
IE
IE
IE
IE
E
E
IE
IE
IE
E
IE
E
I
E
S
S
S
S
S
S
S
S
S
S
S
S
S
S
S
S
S
S
S
S
S
S
S
S
S
S
S
Soil
and water
conservation
16
The resilience approach, on the other hand tends to:
¾Be oriented towards ecological sciences
¾Be more focused on complex interactions, feedbacks and processes of social-ecological
systems
¾Be conceptual and not easily translatable into practice
¾Assess one particular system and can often not be generalised for wider application
¾Produce more dynamic assessments (but with present methodological difficulties in measuring
and characterising)
¾Be less focused on the social aspects of social-ecological systems and
¾Assess more positively future needs by building on present assets.
However, more recently, resilience frameworks are placing more emphasis on social systems (moving
towards a social-ecological-system framework), while vulnerability frameworks are including more
environmental factors and are thus becoming more alike. Nevertheless, both frameworks are connected
through adaptive capacity assessments (FAO, 2013). Ultimately, the effect of any CRA intervention
should contribute simultaneously to reduced vulnerability and increased resilience.
3
3.3.1
Vulnerability assessments
Vulnerability of livelihoods is determined by the capacity of communities to replace a negatively affected
production system with one which would prevent losses in income, sustain subsistence production or
supply food to markets. Vulnerability assessments characterise areas that have low livelihood
resilience, allow for the identification of vulnerable subsectors in the community (e.g. elderly, women,
youth) and provide the basis for developing strategies to increase the resilience of livelihoods to climate
change (FAO, 2013).
A useful toolkit has been developed by the CGIAR/CCAFS (Ulrichs, Cannon, Newsham, Naess and
Marshall, 2015). This vulnerability assessment toolkit for assessing community level potential for
adaptation to climate change, can be used to understand the interrelations between climate impacts,
food systems and livelihood strategies at the local level. It applies a multidimensional view of
vulnerability of livelihood strategies to climate change, with a focus on differentiated access and
entitlements to livelihood resources and food for different groups within the community (often
determined according to gender, ethnicity and socio-economic class). It is based on a concept of five
(5) Dimensions of Vulnerability (DoV), illustrated in Figure 8.

17
Figure 8: The 5 dimensions of vulnerability (CGIAR/CCAFS, 2015)
For each of these vulnerability dimensions a set of criteria and indicators can be developed to
benchmark the baseline conditions in a locality. A wide range of participatory approaches, techniques
and practices are available and include for example: transect walks, village mapping, historical timelines
and climate trends, well-being ranking, seasonal calendars, ranking of livelihood strategies, chaining
farming practices and crops, climate risk and coping mechanisms matrix, food system analysis and
institutional mapping and Venn diagrams
3.4 SMALLHOLDER FARMING IN SOUTH AFRICA AND CRA
Development in South Africa is inextricably tied to massive challenges rooted in both the past and in
the future. In the past, colonial appropriation and control of access to resources was taken to disastrous
extremes through the policies of apartheid; twenty-five years into democracy poverty and dispossession
still plague us. At the same time, problems anticipated in the future already loom large: South Africa as
a water stressed country can expect to face particularly difficult challenges in terms of food security due
to the increased temperatures and pests and decreased water access anticipated to result from climate
change
About 2.5 million households (15,6%) were involved in agricultural activities in South Africa in 2017.
Most of these households are found in Limpopo (25%), Eastern Cape (20%) and KwaZulu-Natal (20%).
They are mainly headed by females (52,8%) and mostly involved in the production of fruits and
vegetables (53,4%), grain and other food crops (51,8%), as well as in livestock (47,1%) and poultry
(35,3%) farming. The main source of income for these households is social grants. Furthermore, most
households involved in agricultural activities do so to supplement food for the household (43,7%)
(StatsSA, 2017).
Poverty levels in the rural areas of South Africa are difficult to assess and are now believed to be a lot
higher than the officially recorded level. Indigency, as recorded by the municipalities is around 22% of
households, meaning that these households earn less than R3200/ month (7 household members). In
2015, over half of South Africa’s population (55.5%) lived in poverty, below the poverty line – for which
the upper bound poverty line was R1 183 per person in 2018. This percentage is slowly increasing
every year. Poverty is highest in the provinces with the largest rural populations; the Eastern Cape,
Limpopo and KwaZulu-Natal (Africheck, 2018). Women headed households are more vulnerable to
poverty.
18
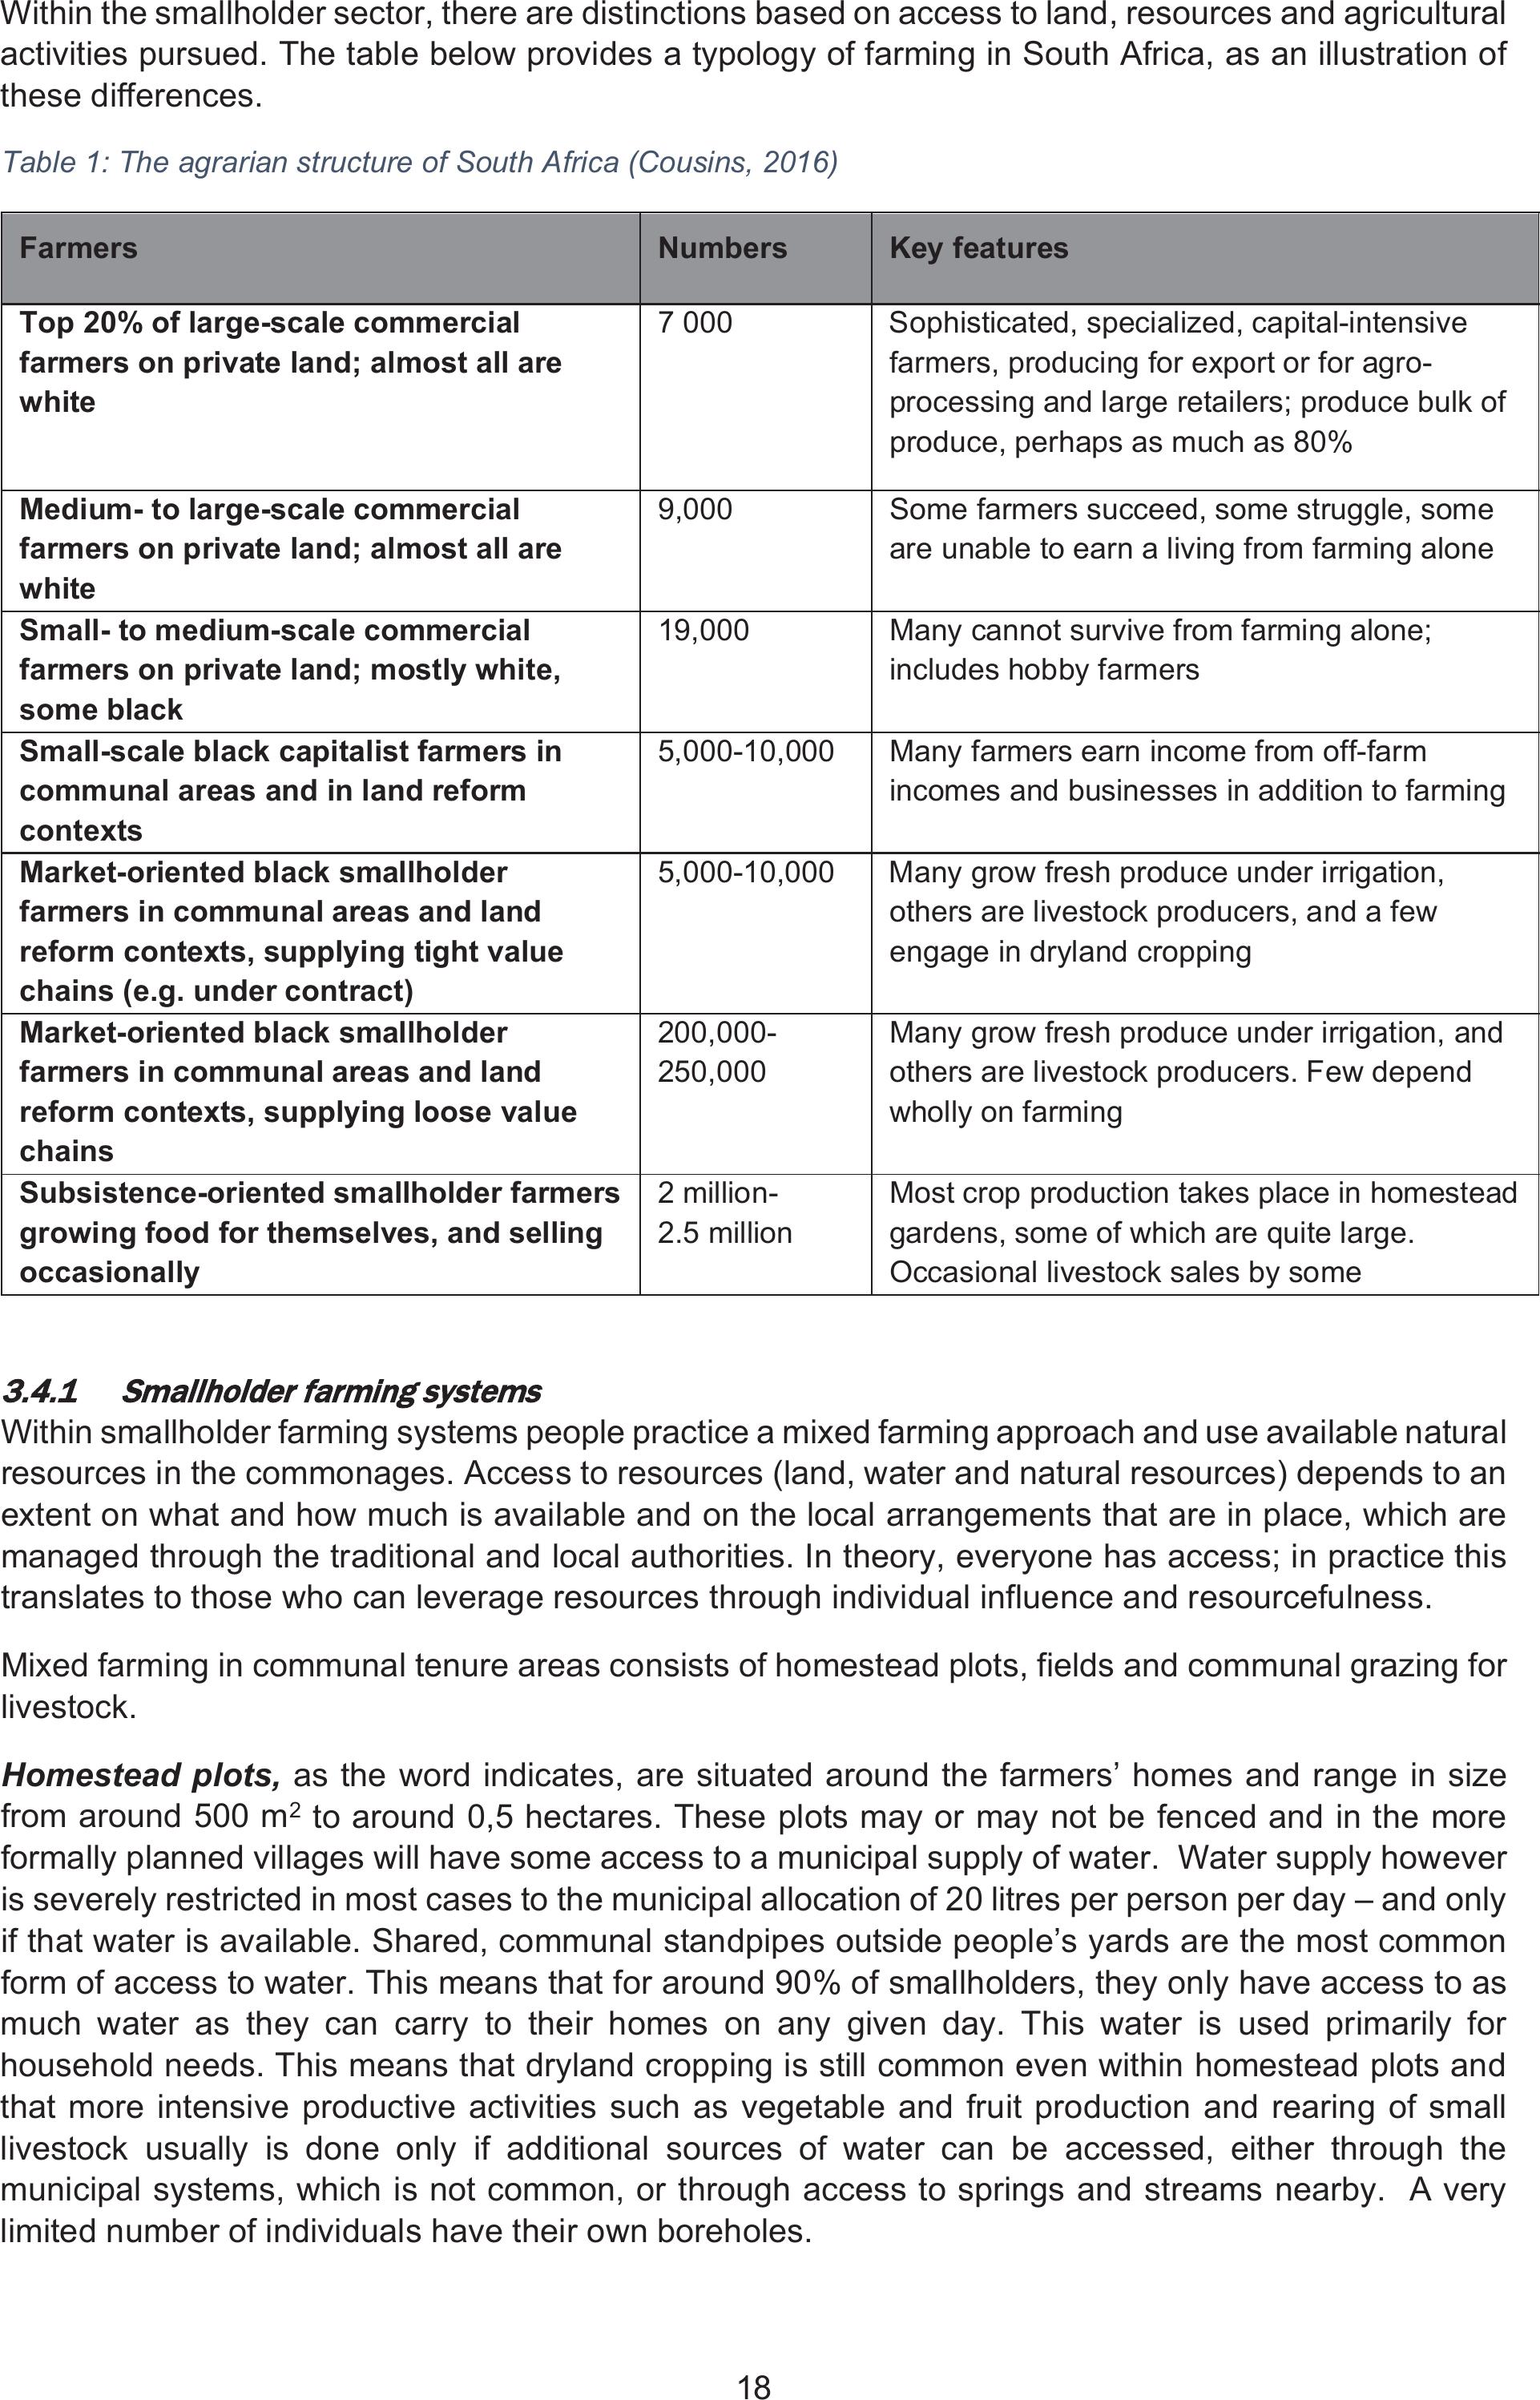
Within the smallholder sector, there are distinctions based on access to land, resources and agricultural
activities pursued. The table below provides a typology of farming in South Africa, as an illustration of
these differences.
Table 1: The agrarian structure of South Africa (Cousins, 2016)
Farmers Numbers Key features
Top 20% of large-scale commercial
farmers on private land; almost all are
white
7 000 Sophisticated, specialized, capital-intensive
farmers, producing for export or for agro-
processing and large retailers; produce bulk of
produce, perhaps as much as 80%
Medium- to large-scale commercial
farmers on private land; almost all are
white
9,000 Some farmers succeed, some struggle, some
are unable to earn a living from farming alone
Small- to medium-scale commercial
farmers on private land; mostly white,
some black
19,000 Many cannot survive from farming alone;
includes hobby farmers
Small-scale black capitalist farmers in
communal areas and in land reform
contexts
5,000-10,000 Many farmers earn income from off-farm
incomes and businesses in addition to farming
Market-oriented black smallholder
farmers in communal areas and land
reform contexts, supplying tight value
chains (e.g. under contract)
5,000-10,000 Many grow fresh produce under irrigation,
others are livestock producers, and a few
engage in dryland cropping
Market-oriented black smallholder
farmers in communal areas and land
reform contexts, supplying loose value
chains
200,000-
250,000
Many grow fresh produce under irrigation, and
others are livestock producers. Few depend
wholly on farming
Subsistence-oriented smallholder farmers
growing food for themselves, and selling
occasionally
2 million-
2.5 million
Most crop production takes place in homestead
gardens, some of which are quite large.
Occasional livestock sales by some
3
3.4.1
Smallholder farming systems
Within smallholder farming systems people practice a mixed farming approach and use available natural
resources in the commonages. Access to resources (land, water and natural resources) depends to an
extent on what and how much is available and on the local arrangements that are in place, which are
managed through the traditional and local authorities. In theory, everyone has access; in practice this
translates to those who can leverage resources through individual influence and resourcefulness.
Mixed farming in communal tenure areas consists of homestead plots, fields and communal grazing for
livestock.
Homestead plots, as the word indicates, are situated around the farmers’ homes and range in size
from around 500 m2 to around 0,5 hectares. These plots may or may not be fenced and in the more
formally planned villages will have some access to a municipal supply of water. Water supply however
is severely restricted in most cases to the municipal allocation of 20 litres per person per day – and only
if that water is available. Shared, communal standpipes outside people’s yards are the most common
form of access to water. This means that for around 90% of smallholders, they only have access to as
much water as they can carry to their homes on any given day. This water is used primarily for
household needs. This means that dryland cropping is still common even within homestead plots and
that more intensive productive activities such as vegetable and fruit production and rearing of small
livestock usually is done only if additional sources of water can be accessed, either through the
municipal systems, which is not common, or through access to springs and streams nearby. A very
limited number of individuals have their own boreholes.
19
Fields are generally allocated to individuals and are often not in direct proximity to the homesteads.
Sizes range from 0,1-5 ha, averaging around 1 ha in size. Historically these have been used primarily
for field cropping grains (maize, sorghum, millet), pumpkin species and legumes (sugar beans). Fields
may be fenced or unfenced and are worked by hand or by paying for private or government-based
mechanisation services. At this scale, a number of group projects exist in the communal tenure areas
and in some cases, projects run by government and non-government organisations have included
irrigation options. A very small percentage (around 1-5%) of individuals have set up their own irrigation
systems.
Communal grazing is managed on a village level and livestock are allowed to graze in and around the
villages and fields in winter months and adjacent veld, bush and hillsides during summer. Individual
smallholders often have kraals for their livestock and pay towards herding and dipping systems for their
livestock. Mostly these systems apply to cattle and sheep. In the past goats were not herded, but due
to increasing pressure on grazing areas and conflicts related to livestock destroying crops and gardens
this is becoming more common. Rangeland management is notoriously difficult in these communal
tenure areas and the quality and quantity of grazing appears to be in an almost continual decline.
Systems for fodder production, supplementary feeding and rotational grazing are not widespread.
Natural resources are harvested extensively for firewood, thatch, reed and grass crafts, food (e.g. wild
leafy greens) and medicinal purposes. Very few systems for control, management and regeneration of
natural resources are currently in place and in addition wide scale poverty and population pressure in
the communal tenure areas have led to overuse of resources and denuding of the commons.
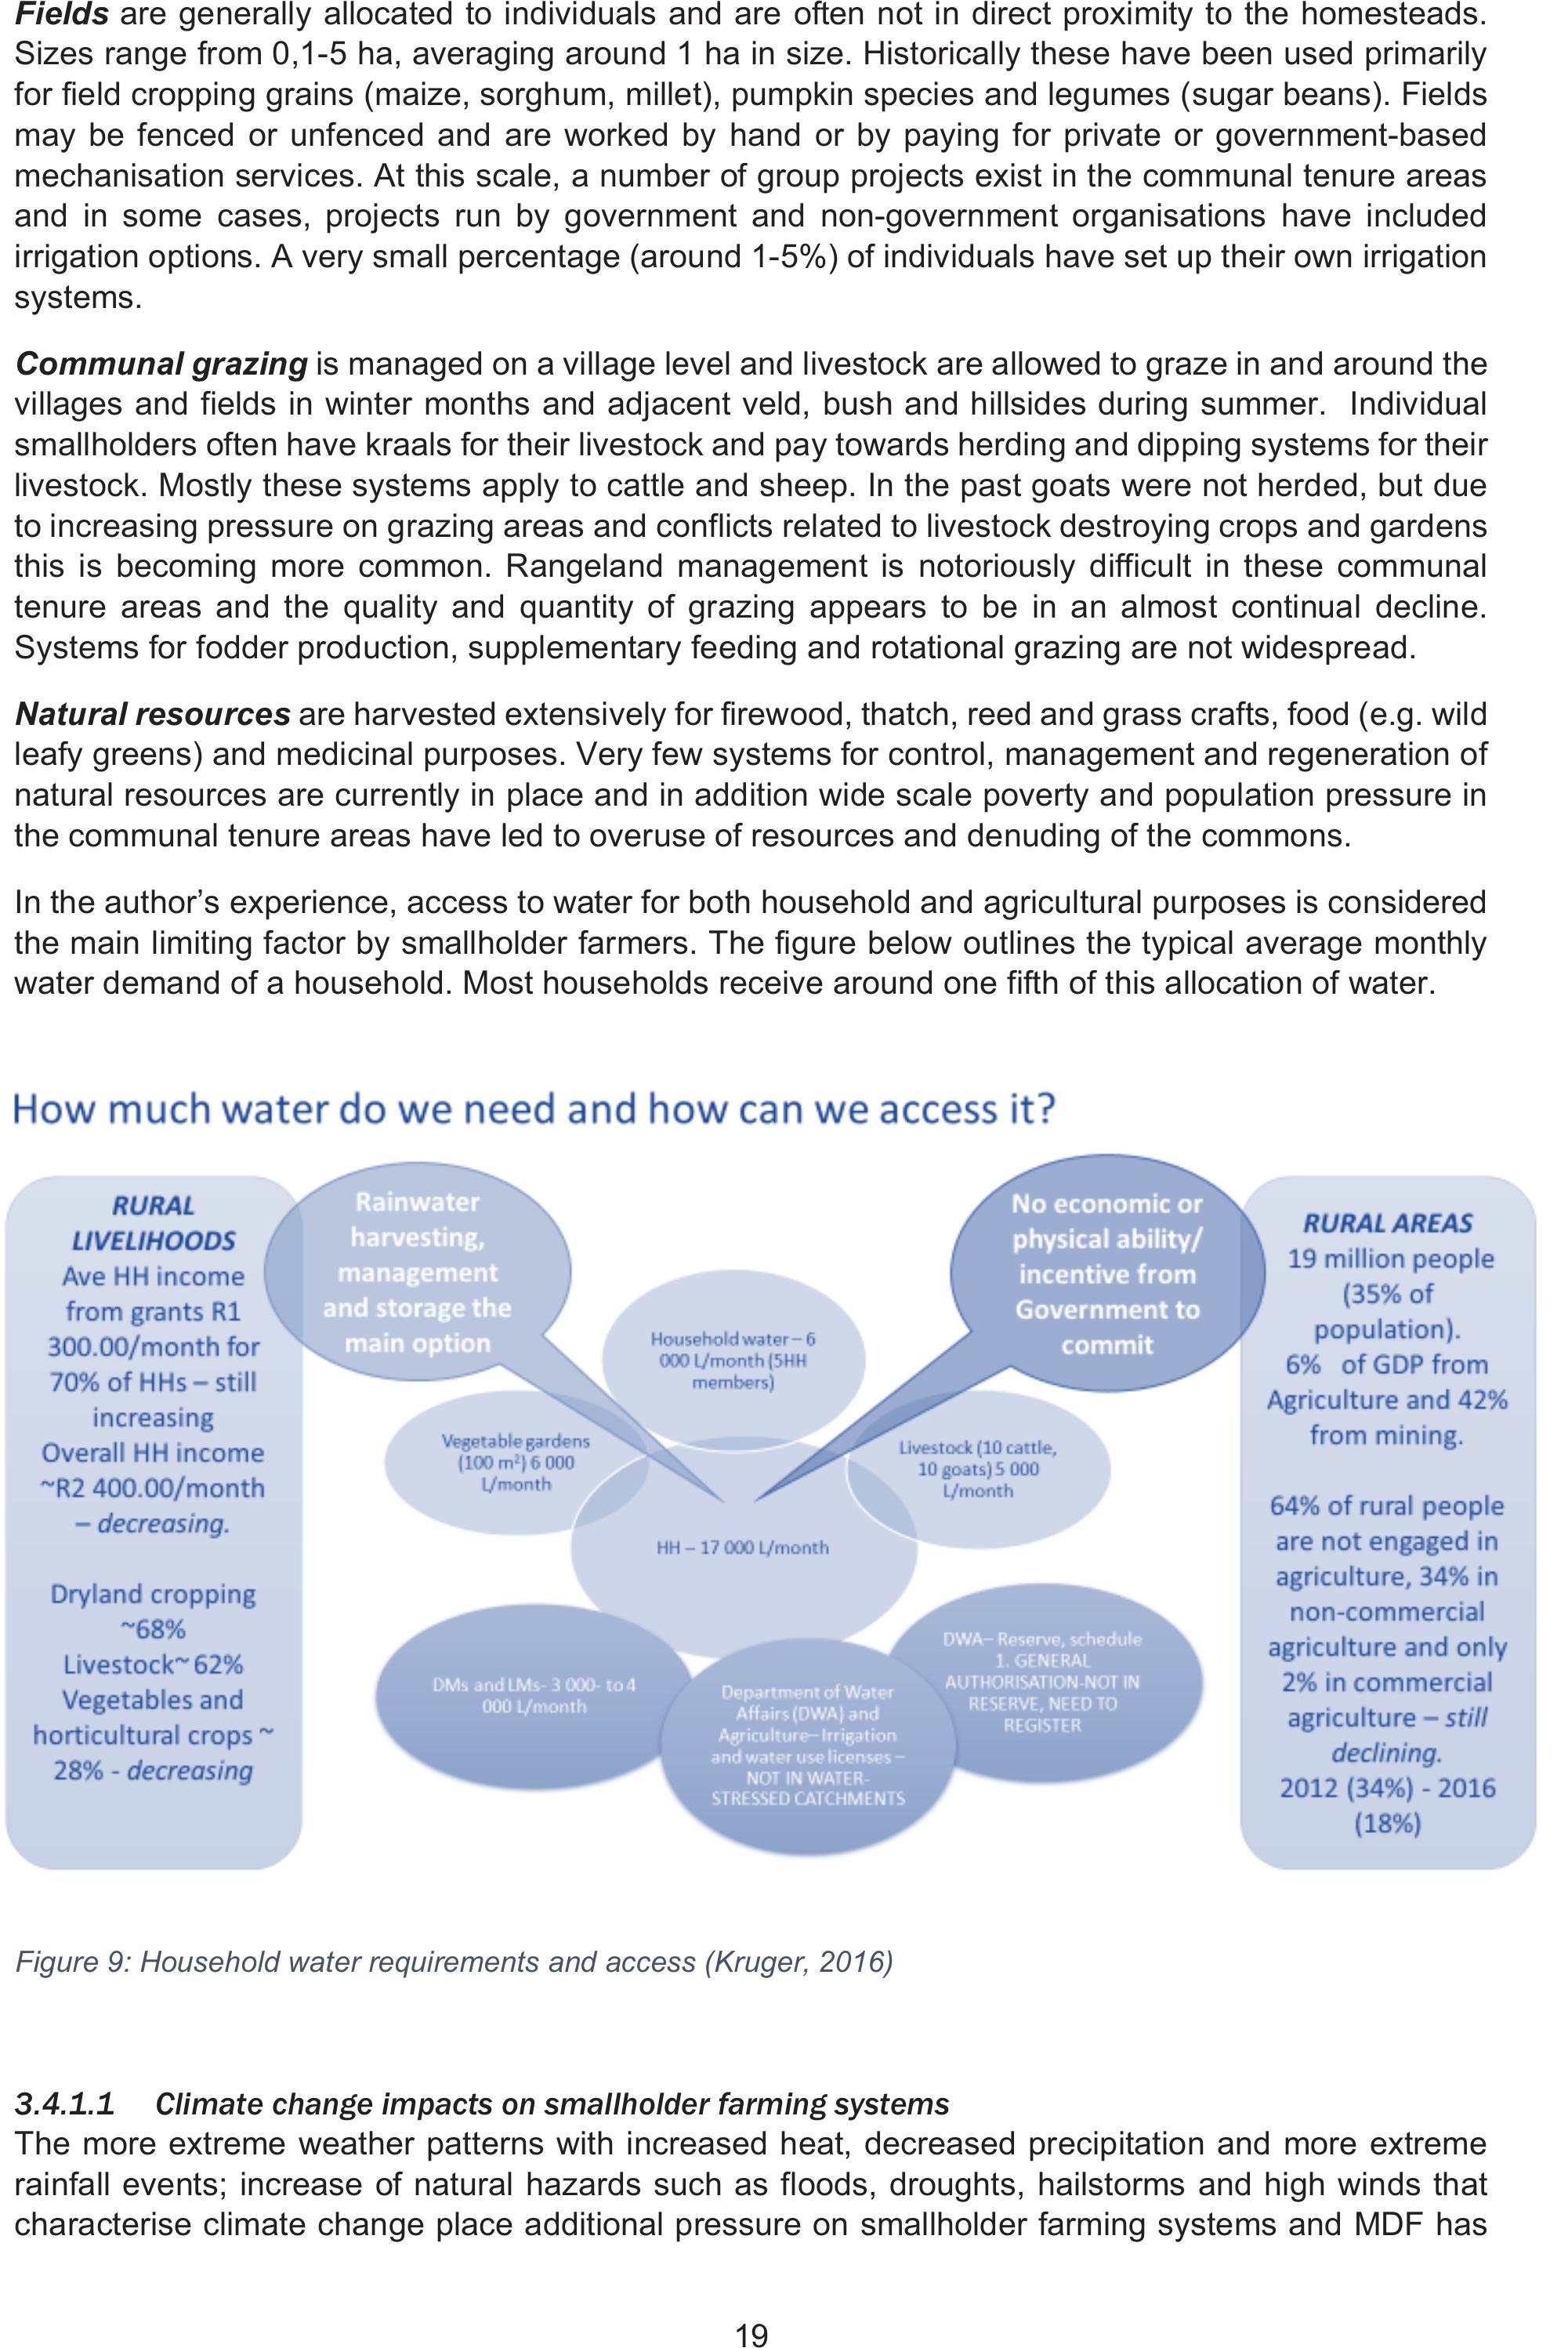
In the author’s experience, access to water for both household and agricultural purposes is considered
the main limiting factor by smallholder farmers. The figure below outlines the typical average monthly
water demand of a household. Most households receive around one fifth of this allocation of water.
Figure 9: Household water requirements and access (Kruger, 2016)
3.4.1.1Climate change impacts on smallholder farming systems
The more extreme weather patterns with increased heat, decreased precipitation and more extreme
rainfall events; increase of natural hazards such as floods, droughts, hailstorms and high winds that
characterise climate change place additional pressure on smallholder farming systems and MDF has
20
found that this has already led to severe losses in crop and vegetable production and mortality in
livestock. A significant proportion of smallholders have abandoned agricultural activities and this
number is still on the increase. Smallholders are generally not well prepared for these more extreme
weather conditions and experience high levels of increased vulnerability as a consequence (Manderson
et al., 2016).
It is becoming clear that climate change will have drastic consequences for low-income and otherwise
disadvantaged communities. Despite their vulnerability, these communities will have to make the most
climate adaptations (Fenton et al., 2015). It is possible for individual smallholders to manage their
agricultural and natural resources better and in a manner that could substantially reduce their risk and
vulnerability generally and more specifically to climate change. Through a combination of best bet
options in agroecology, water and soil conservation, water harvesting, conservation agriculture and
rangeland management a measurable impact on livelihoods and increased productivity can be made
(Hansford, 2010.)
3.5 LOCAL AND TRADITIONAL KNOWLEDGE IN CRA
Most of the CRA practices with which the project will be concerned are likely to be quite site-specific,
which makes local and traditional knowledge extremely relevant for implementing such practices at a
ground (community) level. It should be acknowledged that some of the CRA practices correspond with
many existing local practices. Local and traditional knowledge is deeply embedded in many
communities and the associated practices are considered cost effective and easy to scale out to other
communities.
The literature indicates that for adoption of CRA practices to be successful it should be built on existing
local and traditional knowledge (FAO, 2013). However, local understanding of the practices and reasons
to take up a practice often differs to that in the scientific domain. It is important for development
practitioners and researchers to have some understanding of the local and traditional knowledge to
allow better implementation of improved practices (e.g. CRA practices). Building links between the
scientific information and local and traditional knowledge presents a potential opportunity for developing
a holistic approach for dealing with the negative impacts of climate change at community level. The
Association for Water and Rural Development (AWARD) is implementing a programme to increase
resilience in the Olifants River Basin – the approach, involving systemic social learning, is one example
of this (Kruger and Selala, 2017) (AWARD, 2017).
It is important to note that the depths of such knowledge and the implementation of such practices
varies considerably between communities in different areas across South Africa. In areas with a long
continuous tradition of indigenous agricultural practices, such knowledge is strong and the practices
well understood. Such areas include much of Limpopo Province, and the coastal sections of the former
Transkei homeland in the Eastern Cape Province, historically inhabited by the amaPondo and
amaThembu clans. However, in many other areas – such as those to which people were forcibly
relocated during the establishment of the former homelands – there is not such a long continuous
tradition and many of the farming practices have been derived from people’s acquaintance, often as
farm labourers, with the conventional agriculture practiced by the white commercial farmers. Even in
these areas, however, it is possible to find traditional practices such as ‘matamo’ (construction of small
ponds) or ’gelesha’ (ripping the ground to improve infiltration, prior to planting) (Denison and Manona,
2007).
Communities are already needing to use local, traditional and indigenous knowledge to help cope with
the negative impact of climate change. This includes knowledge of food preservation techniques (e.g.
fermentation and sun drying), knowledge of indigenous plants (e.g. for use in natural pest control), seed
selection to avoid drought and disease control in livestock. The list below shows some other local and
traditional practices which correspond with CRA principles and practices:
¾Seasonal weather forecasting (Use of shift in seasonal migration for birds as an indicator
for weather forecasting)
21
¾Selection of seed to avoid the risk of drought and pests
¾Water harvesting techniques (e.g. roof water harvesting)
¾Use of ash for seed preservation
¾Soil and water conservation using planting basins, furrows and ridges
¾Use of sunken and raised beds to accommodate for water holding capacity and soil types
¾Mixed cropping or intercropping and diversification
¾Use of supplementary feed for livestock
¾Preservation of pasture for use by young, lactating and sick animals in cases of drought
¾Transhumance to avoid risk of livestock loss
¾Culling of weak livestock for food
¾Diversification in the herd to survive climate extremes (Kruger and Selala, 2017).
CRA may provide a valuable opportunity to revive local and traditional knowledge and practices, as
they have considerable potential for amelioration of some of the negative impacts of climate change on
small-scale agriculture.
22
4 DECISION SUPPORT PROCESSES
This project aims to design a framework of methodologies, associated processes and a selection of
best bet practices, informed by the issues that have been discussed, which can be used to assess,
implement and monitor likely local CRA strategies. The practices themselves are discussed in the
accompanying handbook.
Within the climate change community, decision support systems for climate smart agriculture options
at a local level have thus far been designed in top-down processes – using climatic, geographic and
demographic databases and information to select a range of appropriate practices on regional level as
for example through USAID, Care International and FAO. Generally, a DSS is currently seen as a
computer, or perhaps more saliently, internet-based system, which enables large amounts of diverse
information to be analysed in order for managers to reach rational decisions.
A recent review, discusses the different types of models presently available and along with equation-,
agent and geographic-based models, discusses more participatory models as well (Nay, Chu,
Gallagher and Wright, 2014). Their conclusion is that it is advisableto adopt approaches incorporating
both technical and social components in a DSS.
The Consultative Group for International Agricultural Research (CGIAR), has developed a decision
support system for identifying appropriate CRA practices; described as a set of filters for evaluating
CRA options & establishing CRA investment portfolios for National and sub-national decision makers
donors, NGOs, implementers (CGIAR, 2017).
Here however, we are focussing the decision support process on a bottom-up approach, where
individual farmers in a locality make decisions regarding the ‘basket’ of CRA approaches and practices
most suited to their specific situation. To do this in a way that also includes the concepts of social
learning, innovation and agency the following decision support concept has been developed.
4.1 WHAT GOES INTO THE CRA SMALL SCALE FARMER DECISION SUPPORT SYSTEM
Using a systemic approach and social learning from a socio-ecological perspective, the model consists
of a number of layers of input parameters or filters used to define a basket of best bet CRA options for
a specific smallholder farmer, using a combination of participatory processes linked to technical
databases.
23
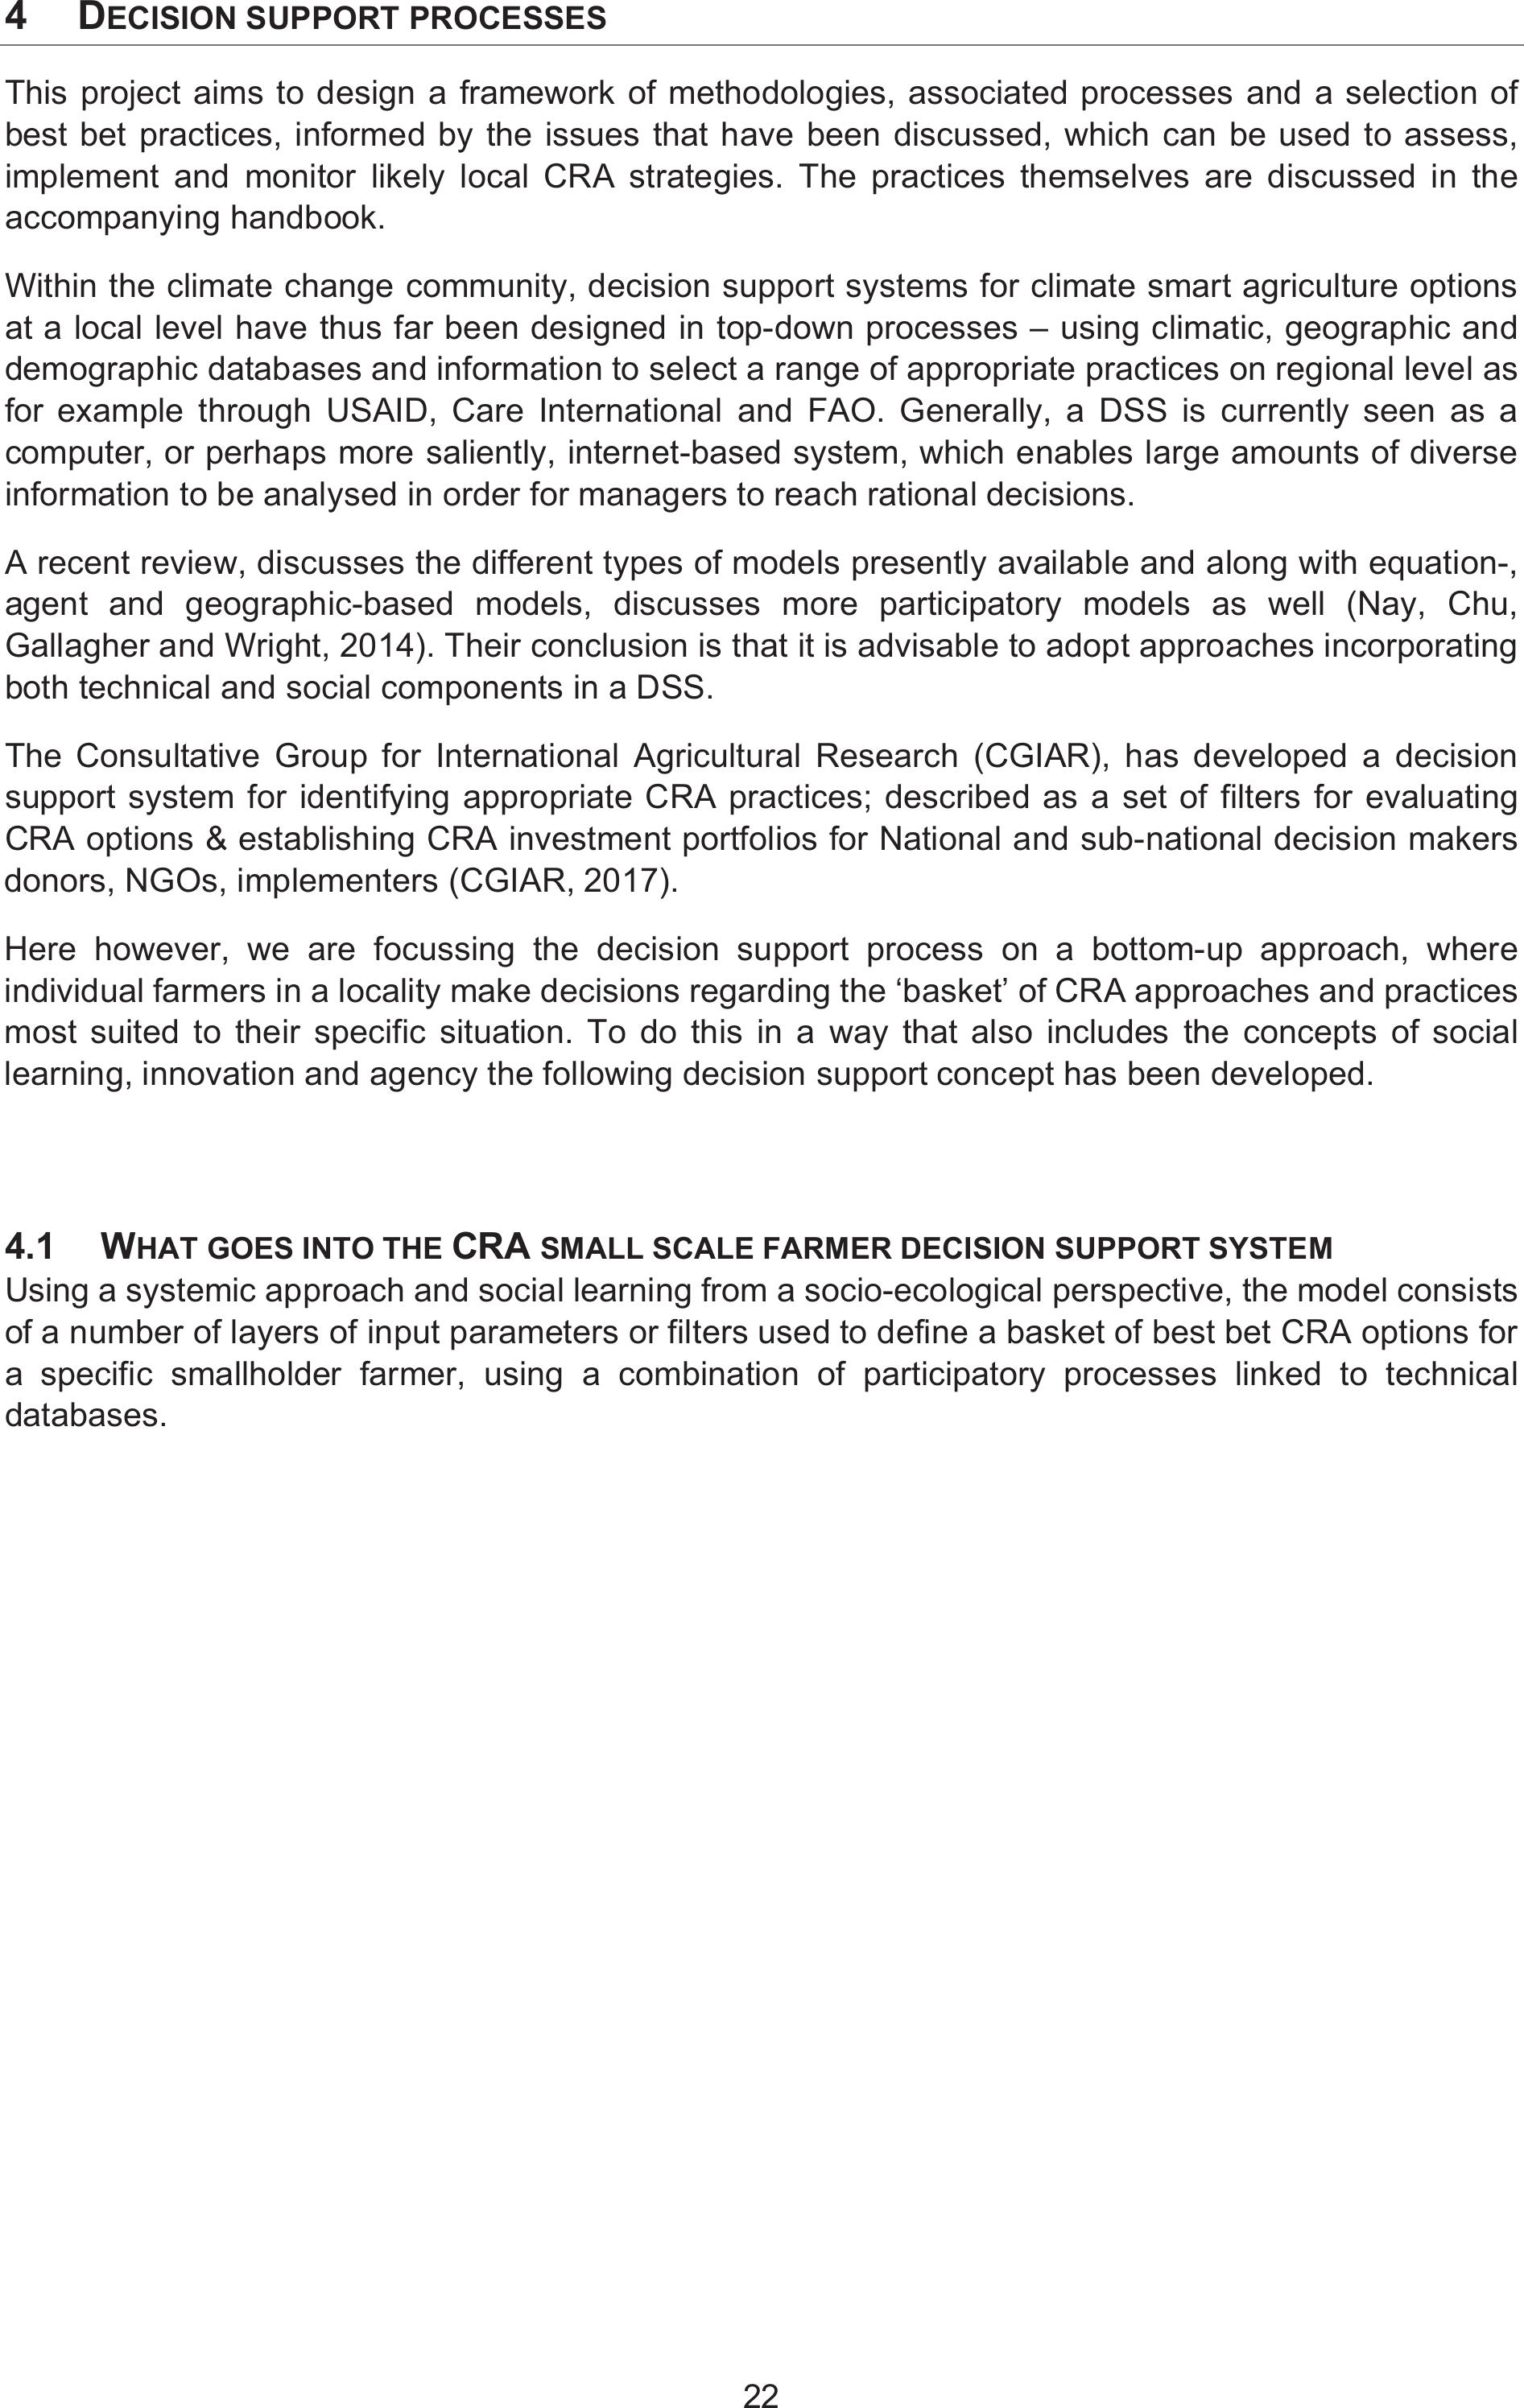
The process is designed to also support and assist the facilitator in their decision making, in support of
the smallholder farmers; meaning that the facilitator accesses information such as the basic climate
change predictions for the area, the agroecological characteristics including rainfall, temperature, soil
texture, etc.) and an initial contextualised basket of CRA practices from which to negotiate prioritized
practices with farmers. Practices are thus chosen by both facilitators and farmers.
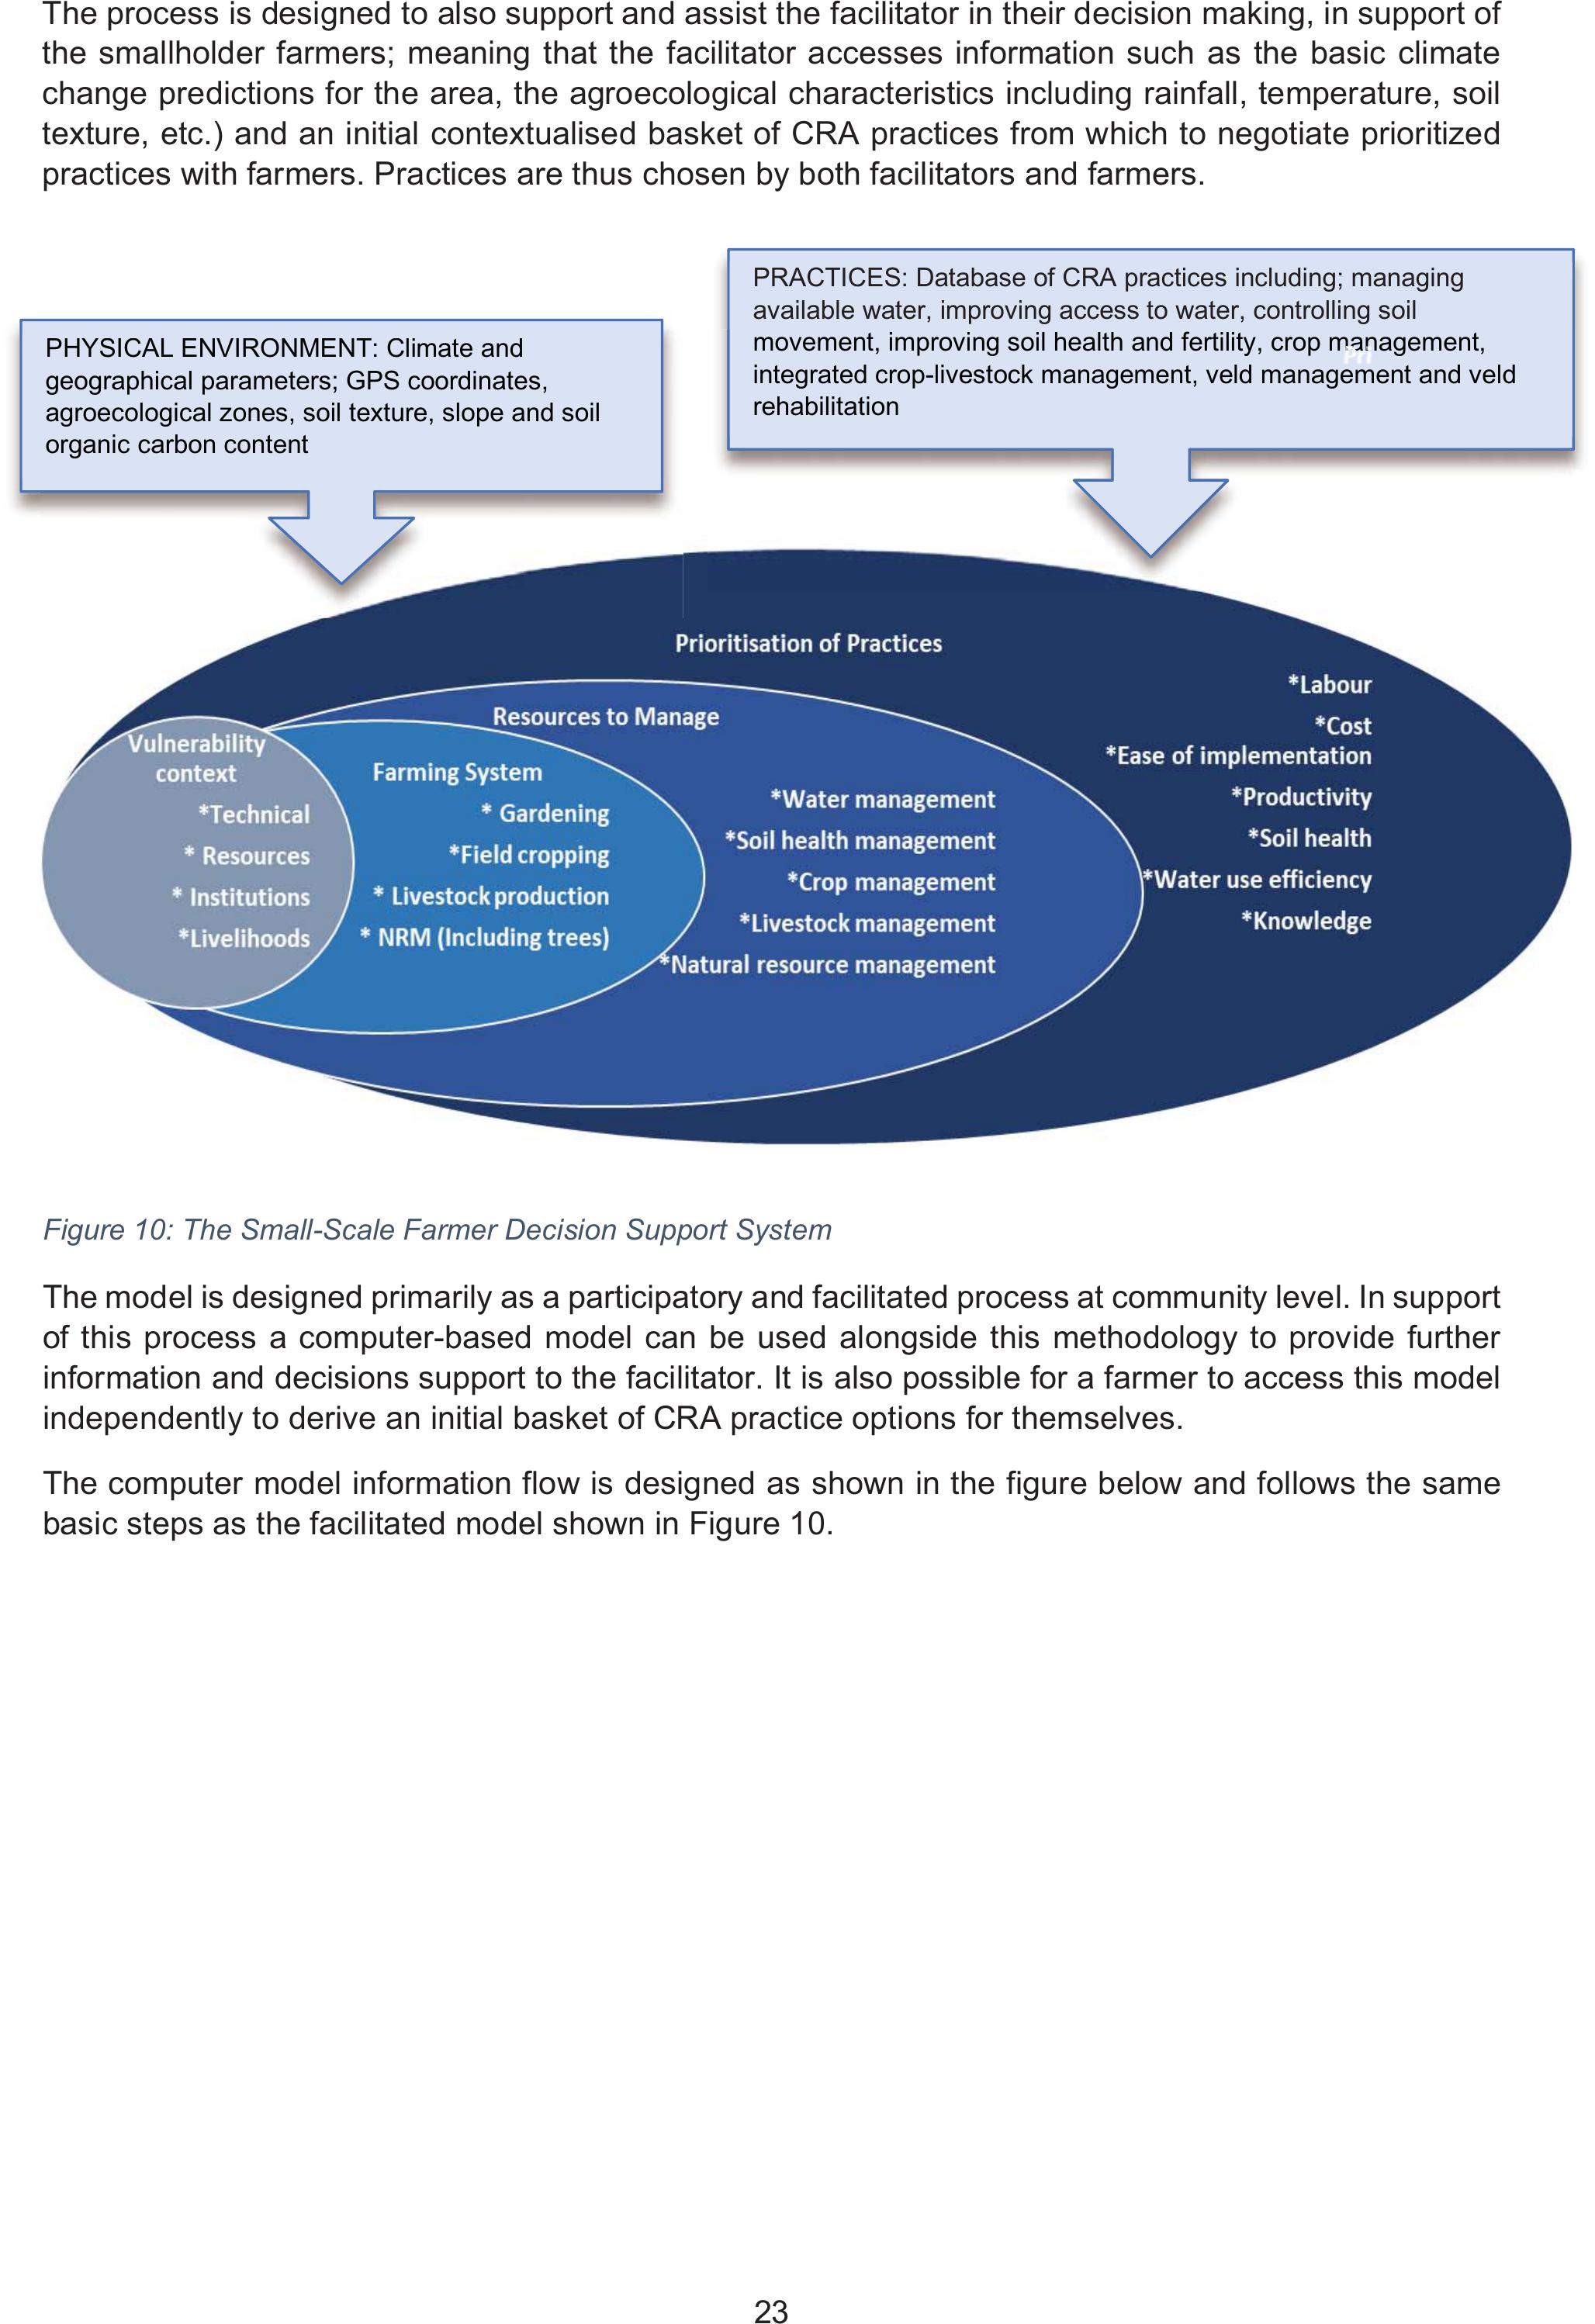
Figure 10: The Small-Scale Farmer Decision Support System
The model is designed primarily as a participatory and facilitated process at community level. In support
of this process a computer-based model can be used alongside this methodology to provide further
information and decisions support to the facilitator. It is also possible for a farmer to access this model
independently to derive an initial basket of CRA practice options for themselves.
The computer model information flow is designed as shown in the figure below and follows the same
basic steps as the facilitated model shown in Figure 10.
PHYSICAL ENVIRONMENT: Climate and
geographical parameters; GPS coordinates,
agroecological zones, soil texture, slope and soil
organic carbon content
PRACTICES: Database of CRA practices including; managing
available water, improving access to water, controlling soil
movement, improving soil health and fertility, crop management,
integrated crop-livestock management, veld management and veld
rehabilitation
PH
YS
IC
AL
E
NV
IR
ON
ME
NT
:
Cl
im
at
e
an
d
g
eo
g
raphical parameters;
G
P
S
coordinates,
a
g
roecolo
g
ical zones, soil texture, slope and soil
organ
i
c car
b
on content
movement, improvin
g
soil health and fertilit
y
, crop
ma
m
m
m
ma
ma
a
m
m
a
m
a
a
a
a
a
a
a
a
a
a
a
a
a
na
n
n
n
n
n
n
n
n
n
g
ement,
i
nte
g
rate
d
crop
-
li
vestoc
k
mana
g
ement, ve
ld
mana
g
ement an
d
v
e
l
d
r
e
h
ab
ilit
a
ti
o
n
24
Figure 11: The computer-based model for the smallholder DSS
In our case the set of criteria (proxies used as indicators for the complex reality) that helps to make
informed decisions on management practices are:
¾The current farming systems; gardening, field cropping, livestock production and natural
resource management (NRM) (including trees),
¾The physical environment: agroecological zone, soil texture, slope and organic soil carbon and
¾The socio-economic background of the farmer; demographic information (gender HH head,
age, dependency ratio), level of education, sources of income (unemployment vs. external
employment, own business, grants, farm, etc.), total income, access to services, infrastructure,
technology (Electricity, water (tap, borehole, rainwater harvesting, etc.), irrigation (buckets,
standpipes, etc.), fencing and farming tools (hand vs traction/other), social organisation,
market access (formal vs. informal), farm size and farming purpose (food vs. selling).
Besides this, the resources and related management strategies as well as a list of practices need to be
provided as input to the system. All information, except the physical environment; i.e. climate, soil and
topography, and the resources and management strategies, are derived through the use of a range of
participatory processes. Data on the physical environmental conditions have been taken from datasets
freely available online. This information can however be customised by the DSS user, in case more
appropriate information is available for the specific farmer concerned.
For the Facilitator-Farmer DSS the resources and related management strategies are discussed and
negotiated in the participatory process. For the computer based or Individual Farmer DSS these are
provided as an input into the model using the framework shown in Figure 12.

25
Figure 12: Resources to manage and their associated management strategies
The practices have been identified by both farmers and South African development experts, as well as
desk top reviews.
4.2 HOW DOES THE FACILITATOR-FARMER DSS WORK?
In effect, the DSS discussed above is a way of providing and making sense of information. This
information is contextualised in a social learning system (a group of people learning and implementing
together) using the framework shown in Figure 13.
Activities and
processes
Local good practice Climate Change Farmer level
experimentation to test
practices
CoPs and innovation
platforms
Best practise
options
Impacts of climate
change
Introduction of new
practices and ideas to
tr
y
Benchmarking for visual
indicators
Stakeholder
en
g
a
g
ements
Adaptive strategiesLearning and mentoring
Materials and
information
Appropriate practices Assessment of
outcomes and impacts
internet based
platform
Cyclical, iterative
learning and
implementation
Facilitator-Farmer Decision Support System
Figure 13: A systemic view of the Facilitator-Farmer DSS indicating associated activities and processes

26
The DSS thus incorporates the whole system of social learning and innovation, in an iterative process
that can lead to social change and agency in climate change adaptation, as depicted in Figure 14.
Figure 14: Social learning, innovation and building agency is an iterative process that includes careful monitoring
and evaluation
Agency
Innovation
Social
learning
cy
In
Indicators: qualitative and
quantitative, process,
output, outcome and impact
indicators
Cyclical analysis,
planning, implementation
and review (monitoring
and evaluation)

27
5 HOW TO FACILITATE THE FACILITATOR-FARMER DSS
An assumption made is that entry into a community has already been made and that it is possible to
arrange a community level meeting for interested participants.
This means that an introductory workshop explaining the process would need to be held first, before
launching into the short series of 3 climate change adaptation (CCA) workshops. The intention of these
workshops is also to create and strengthen the learning group, to enable the social learning process to
unfold.
In addition, as baseline survey is important to understand the existing conditions in the locality. These
baselines also provide the information for the individual DSS process in terms of the environmental
conditions and vulnerability criteria for the individual (socio-economic criteria and typology).
5.1 BASELINE SURVEY
Generally, this is done during the 1st CCA workshop when individual household visits are undertaken,
but can also be a stand-alone exercise conducted at the beginning of a CRA intervention
5
5.1.1
The baseline survey questionnaire
Date Area
VillageGPS
Surname First name
Cellno
ID number
Gender ⋒⋓⋕⋖Household
head (Y/N)
Education
Members of Social
organisation/s
(describe), e.g. savings
group, learning group,
etc.)
No of Adults in
household (HH)
No of children
Income sources (grants,
employment,
remittances, other –
specify)
Level of
income –
monthly per
household)
Type of grant (s) – add
in no
Child Support Old Age Foster care
Scale of operation 0,1-1 ha 1-2 ha >2 ha

28
Farming activities
Garden (size) Fields (size) Livestock (No)
Cattle
Goats
Chickens
Other:
Nat resources –
specify
Trees
Indigenous plants
Resources and
infrastructure
Water (list – tick
and describe)
– tap
– standpipe
– RWH
– Other
HH infrastructure
– dwellings
– electricity
– fencing
– other
Farming
infrastructure and
tools (list
Other
Other livelihood activities
(list)
Market access
(describe)
Training and advice
(Name sources of
support)
5
5.1.2
Example of a baseline survey
The responses to these questionnaires can be input into an excel sheet and coded to be able to
summarise information from a number of different participants and get an indication of the ‘profile’ of
the participants involved. Below are two bar charts summarising information for 41 participants across
7 villages in KZN, EC and Limpopo as an example. The charts summarise the livelihoods and resource
indicators of the questionnaires.
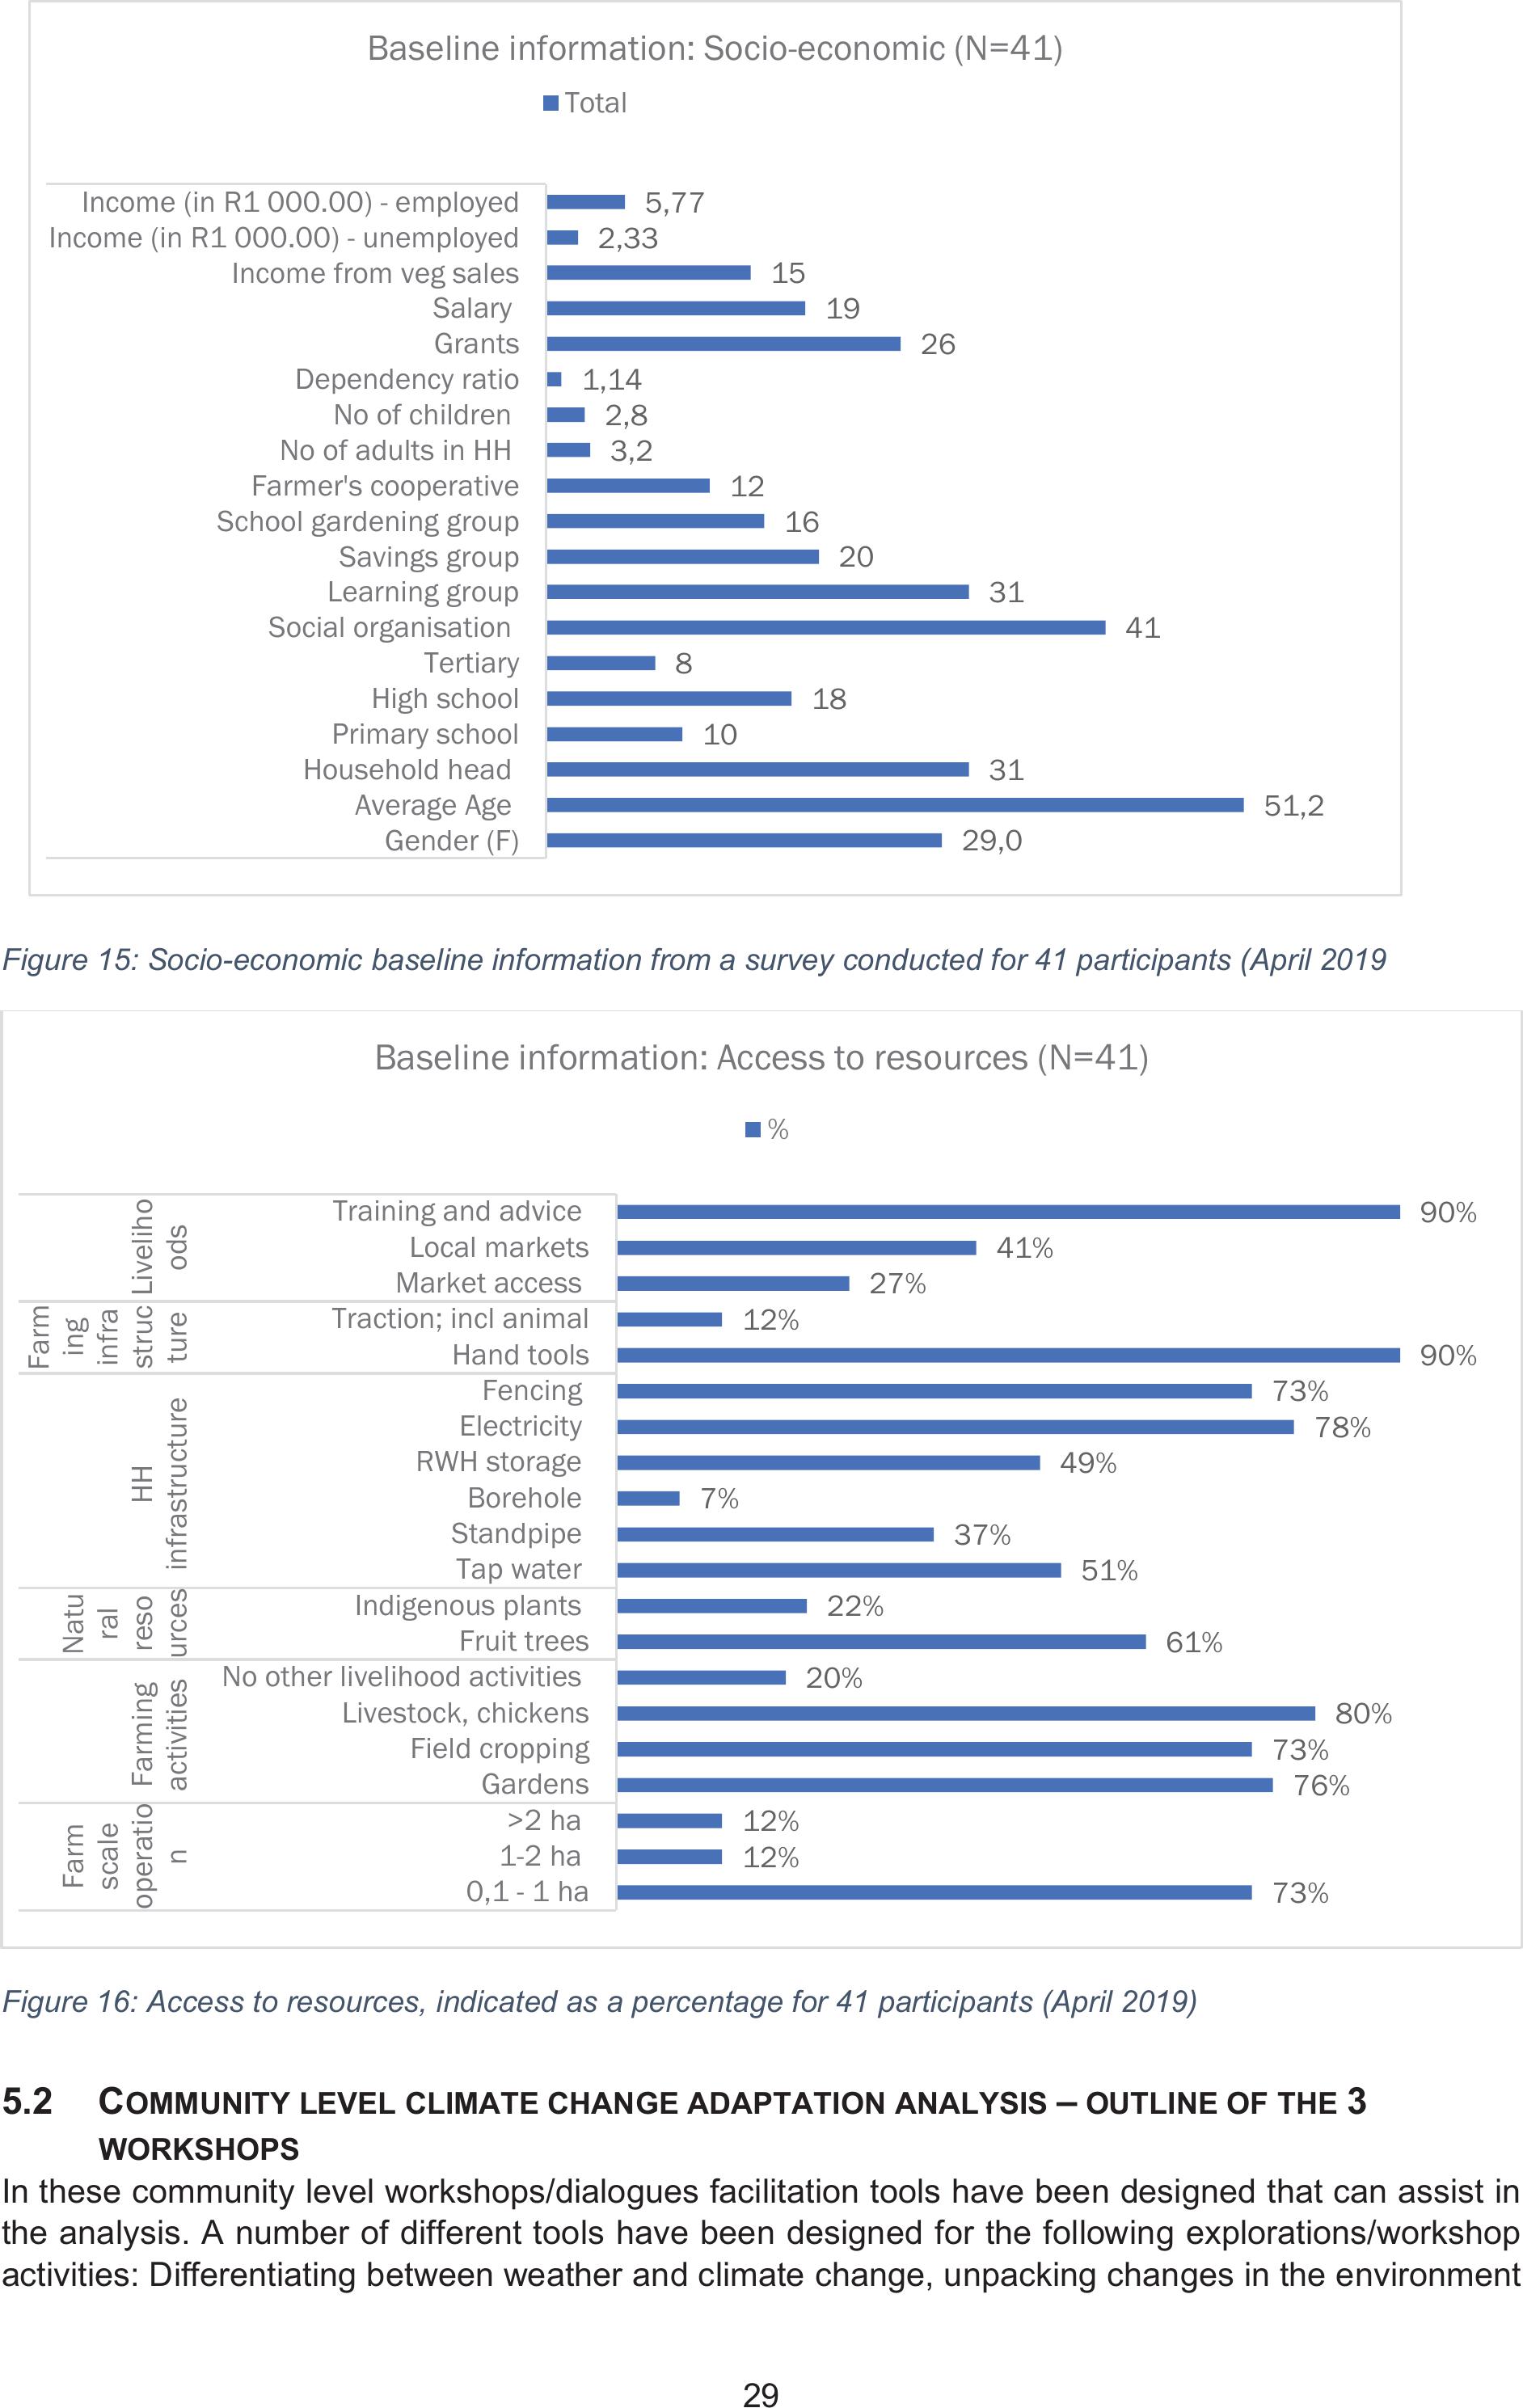
29
Figure 15: Socio-economic baseline information from a survey conducted for 41 participants (April 2019
Figure 16: Access to resources, indicated as a percentage for 41 participants (April 2019)
5.2 COMMUNITY LEVEL CLIMATE CHANGE ADAPTATION ANALYSIS – OUTLINE OF THE 3
WORKSHOPS
In these community level workshops/dialogues facilitation tools have been designed that can assist in
the analysis. A number of different tools have been designed for the following explorations/workshop
activities: Differentiating between weather and climate change, unpacking changes in the environment
73%
12%
12%
76%
73%
80%
20%
61%
22%
51%
37%
7%
49%
78%
73%
90%
12%
27%
41%
90%
0,1 - 1 ha
1-2 ha
>2 ha
Gardens
Field cropping
Livestock, chickens
No other livelihood activities
Fruit trees
Indigenous plants
Tap water
Standpipe
Borehole
RWH storage
Electricity
Fencing
Hand tools
Traction; incl animal
Market access
Local markets
Training and advice
Farm
scale
operatio
n
Farming
activities
Natu
ral
reso
urces
HH
infrastructure
Farm
ing
infra
struc
ture
Liveliho
ods
Baseline information: Access to resources (N=41)
%
29,0
51,2
31
10
18
8
41
31
20
16
12
3,2
2,8
1,14
26
19
15
2,33
5,77
Gender (F)
Average Age
Household head
Primary school
High school
Tertiary
Social organisation
Learning group
Savings group
School gardening group
Farmer's cooperative
No of adults in HH
No of children
Dependency ratio
Grants
Salary
Income from veg sales
Income (in R1 000.00) - unemployed
Income (in R1 000.00) - employed
Baseline information: Socio-economic (N=41)
Total
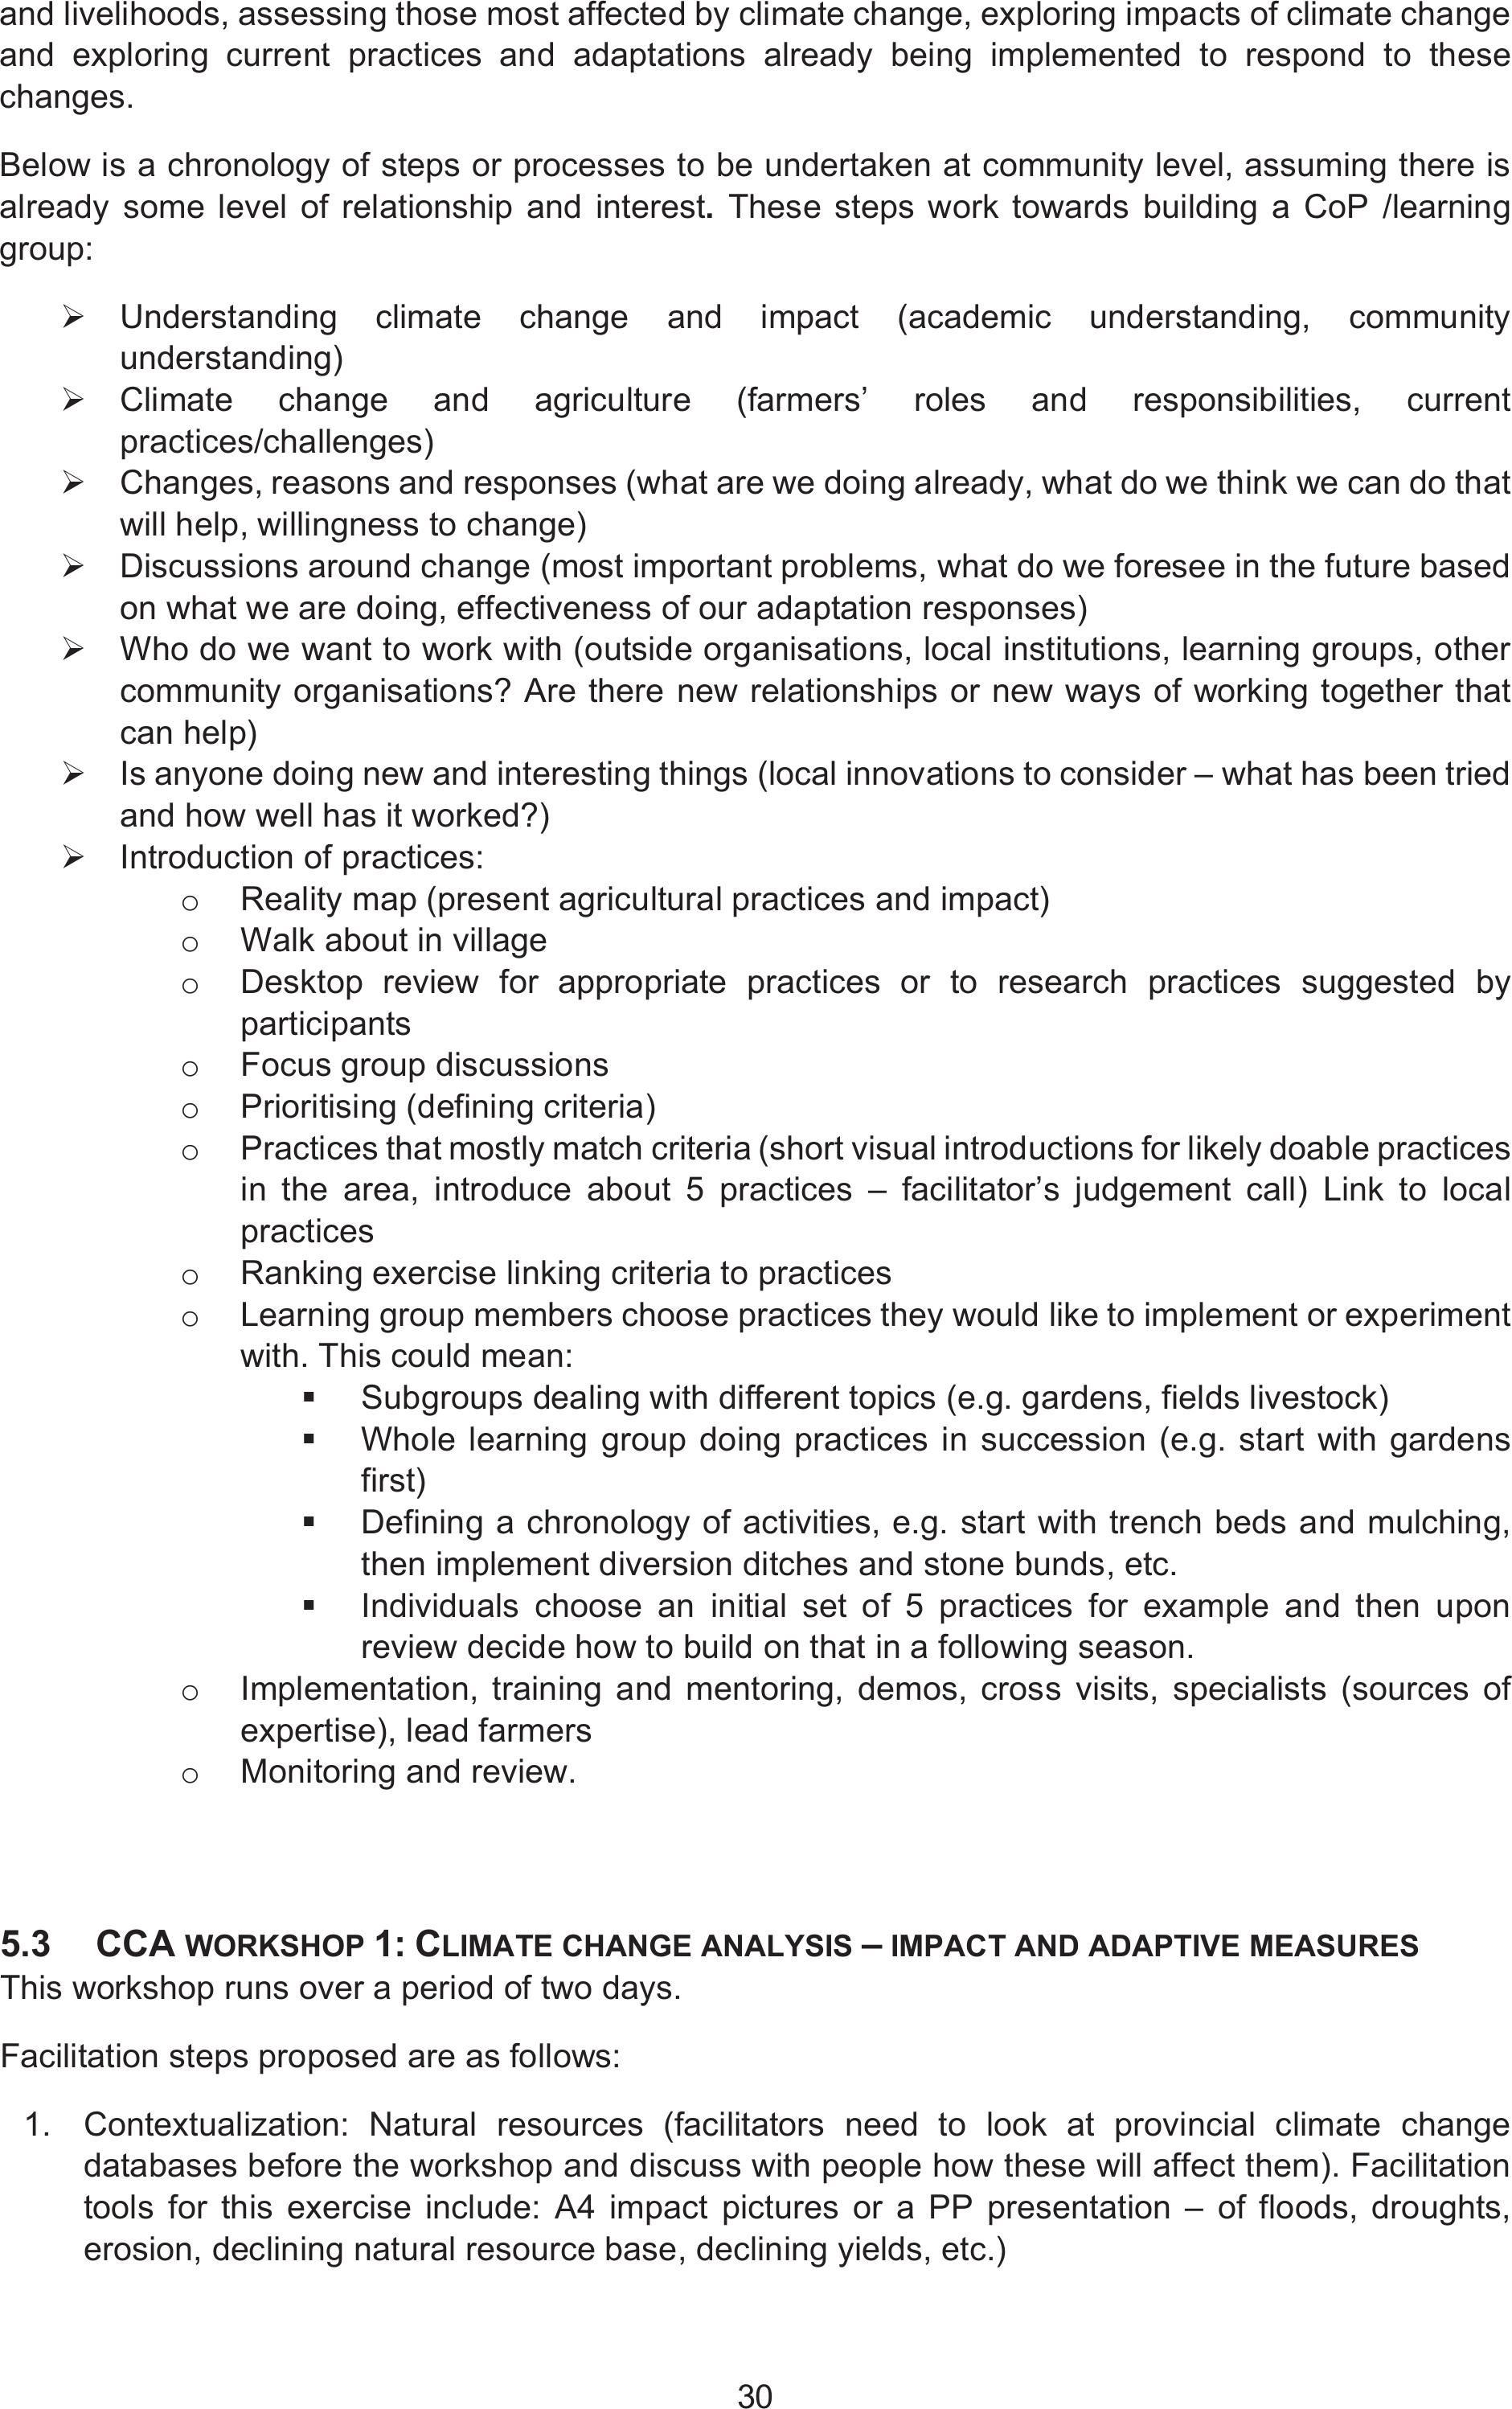
30
and livelihoods, assessing those most affected by climate change, exploring impacts of climate change
and exploring current practices and adaptations already being implemented to respond to these
changes.
Below is a chronology of steps or processes to be undertaken at community level, assuming there is
already some level of relationship and interest. These steps work towards building a CoP /learning
group:
¾Understanding climate change and impact (academic understanding, community
understanding)
¾Climate change and agriculture (farmers’ roles and responsibilities, current
practices/challenges)
¾Changes, reasons and responses (what are we doing already, what do we think we can do that
will help, willingness to change)
¾Discussions around change (most important problems, what do we foresee in the future based
on what we are doing, effectiveness of our adaptation responses)
¾Who do we want to work with (outside organisations, local institutions, learning groups, other
community organisations? Are there new relationships or new ways of working together that
can help)
¾Is anyone doing new and interesting things (local innovations to consider – what has been tried
and how well has it worked?)
¾ Introduction of practices:
oReality map (present agricultural practices and impact)
oWalk about in village
o Desktop review for appropriate practices or to research practices suggested by
participants
o Focusgroup discussions
oPrioritising (defining criteria)
oPractices that mostly match criteria (short visual introductions for likely doable practices
in the area, introduce about 5 practices – facilitator’s judgement call) Link to local
practices
oRanking exercise linking criteria to practices
oLearning group members choose practices they would like to implement or experiment
with. This could mean:
Subgroups dealing with different topics (e.g. gardens, fields livestock)
Whole learning group doing practices in succession (e.g. start with gardens
first)
Defining a chronology of activities, e.g. start with trench beds and mulching,
then implement diversion ditches and stone bunds, etc.
Individuals choose an initial set of 5 practices for example and then upon
review decide how to build on that in a following season.
oImplementation, training and mentoring, demos, cross visits, specialists (sources of
expertise), lead farmers
o Monitoring and review.
5.3 CCA WORKSHOP 1:CLIMATE CHANGE ANALYSIS – IMPACT AND ADAPTIVE MEASURES
This workshop runs over a period of two days.
Facilitation steps proposed are as follows:
1. Contextualization: Natural resources (facilitators need to look at provincial climate change
databases before the workshop and discuss with people how these will affect them). Facilitation
tools for this exercise include: A4 impact pictures or a PP presentation – of floods, droughts,
erosion, declining natural resource base, declining yields, etc.)
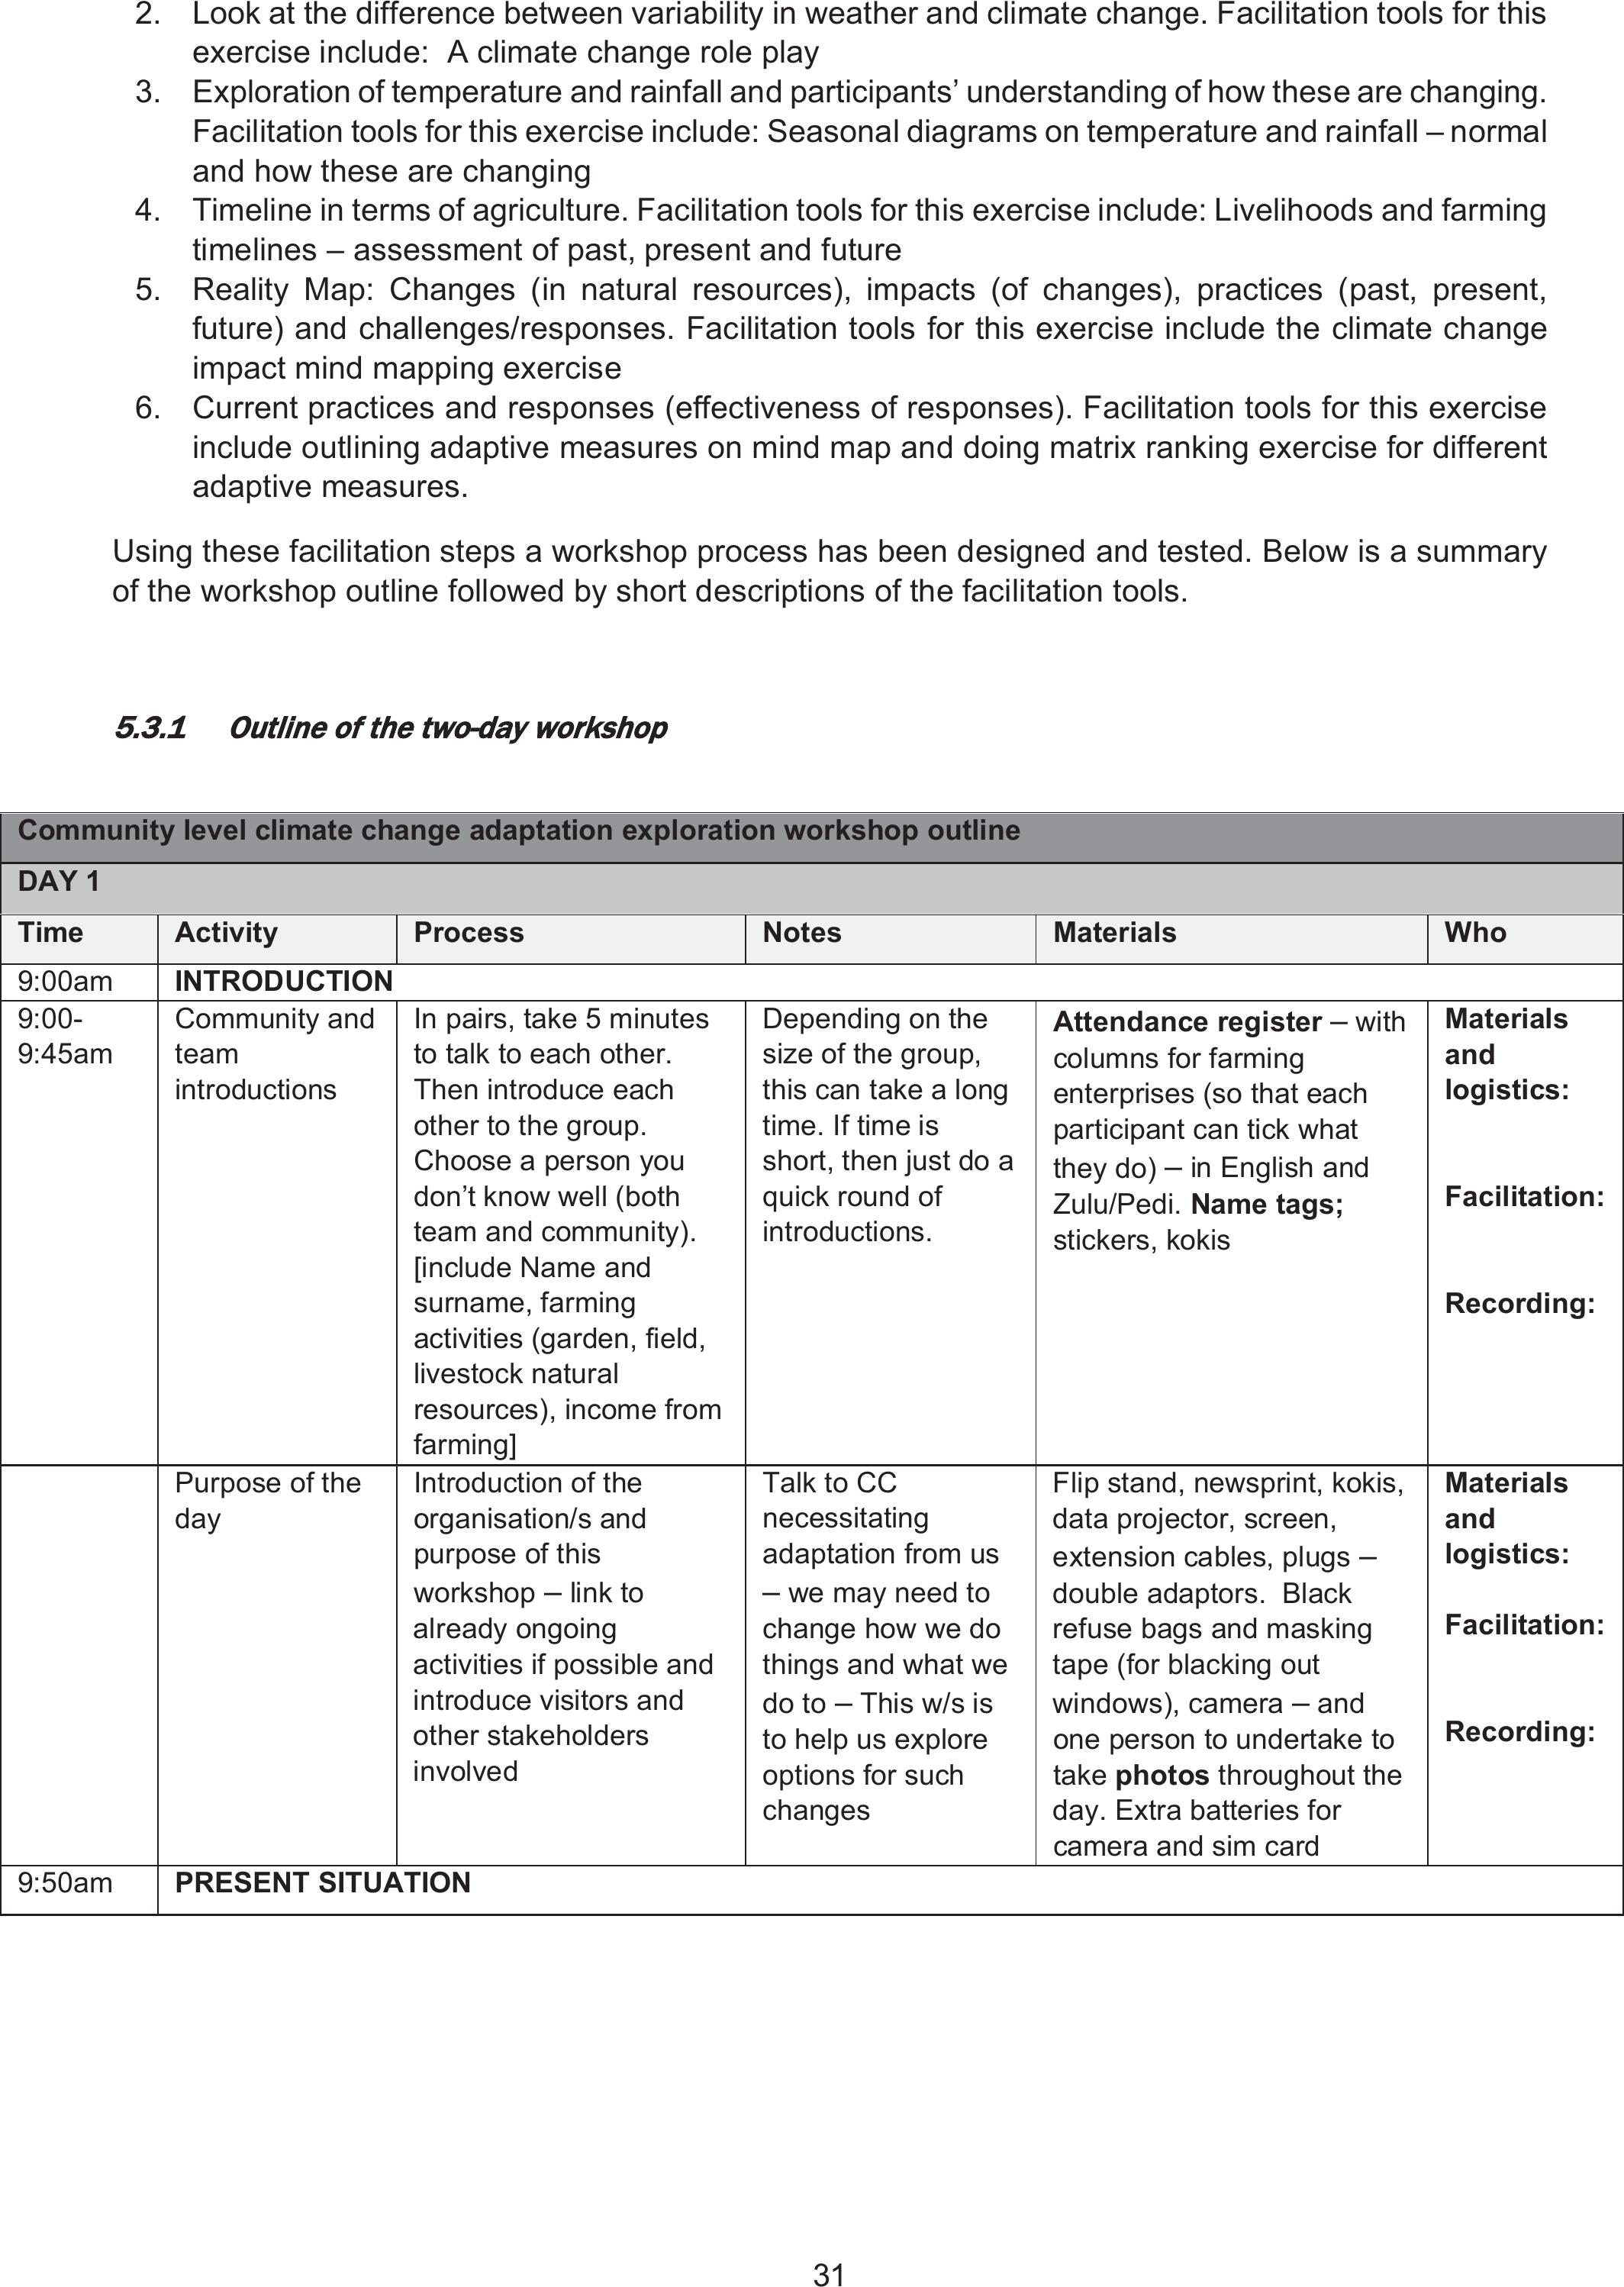
31
2. Look at the difference between variability in weather and climate change. Facilitation tools for this
exercise include: A climate change role play
3. Exploration of temperature and rainfall and participants’ understanding of how these are changing.
Facilitation tools for this exercise include: Seasonal diagrams on temperature and rainfall – normal
and how these are changing
4. Timeline in terms of agriculture. Facilitation tools for this exercise include: Livelihoods and farming
timelines – assessment of past, present and future
5. Reality Map: Changes (in natural resources), impacts (of changes), practices (past, present,
future) and challenges/responses. Facilitation tools for this exercise include the climate change
impact mind mapping exercise
6. Current practices and responses (effectiveness of responses). Facilitation tools for this exercise
include outlining adaptive measures on mind map and doing matrix ranking exercise for different
adaptive measures.
Using these facilitation steps a workshop process has been designed and tested. Below is a summary
of the workshop outline followed by short descriptions of the facilitation tools.
5
5.3.1
Outline of the two-day workshop
Community level climate change adaptation exploration workshop outline
DAY 1
Time Activity Process Notes Materials Who
9:00am INTRODUCTION
9:00-
9:45am
Community and
team
introductions
In pairs, take 5 minutes
to talk to each other.
Then introduce each
other to the group.
Choose a person you
don’t know well (both
team and community).
[include Name and
surname, farming
activities (garden, field,
livestock natural
resources), income from
farming]
Depending on the
size of the group,
this can take a long
time. If time is
short, then just do a
quick round of
introductions.
Attendance register– with
columns for farming
enterprises (so that each
participant can tick what
they do) – in English and
Zulu/Pedi. Name tags;
stickers, kokis
Materials
and
logistics:
Facilitation:
Recording:
Purpose of the
day
Introduction of the
organisation/s and
purpose of this
workshop – link to
already ongoing
activities if possible and
introduce visitors and
other stakeholders
involved
Talk to CC
necessitating
adaptation from us
– we may need to
change how we do
things and what we
do to – This w/s is
to help us explore
options for such
changes
Flip stand, newsprint, kokis,
data projector, screen,
extension cables, plugs –
double adaptors. Black
refuse bags and masking
tape (for blacking out
windows), camera – and
one person to undertake to
take photos throughout the
day. Extra batteries for
camera and sim card
Materials
and
logistics:
Facilitation:
Recording:
9:50am PRESENT SITUATION
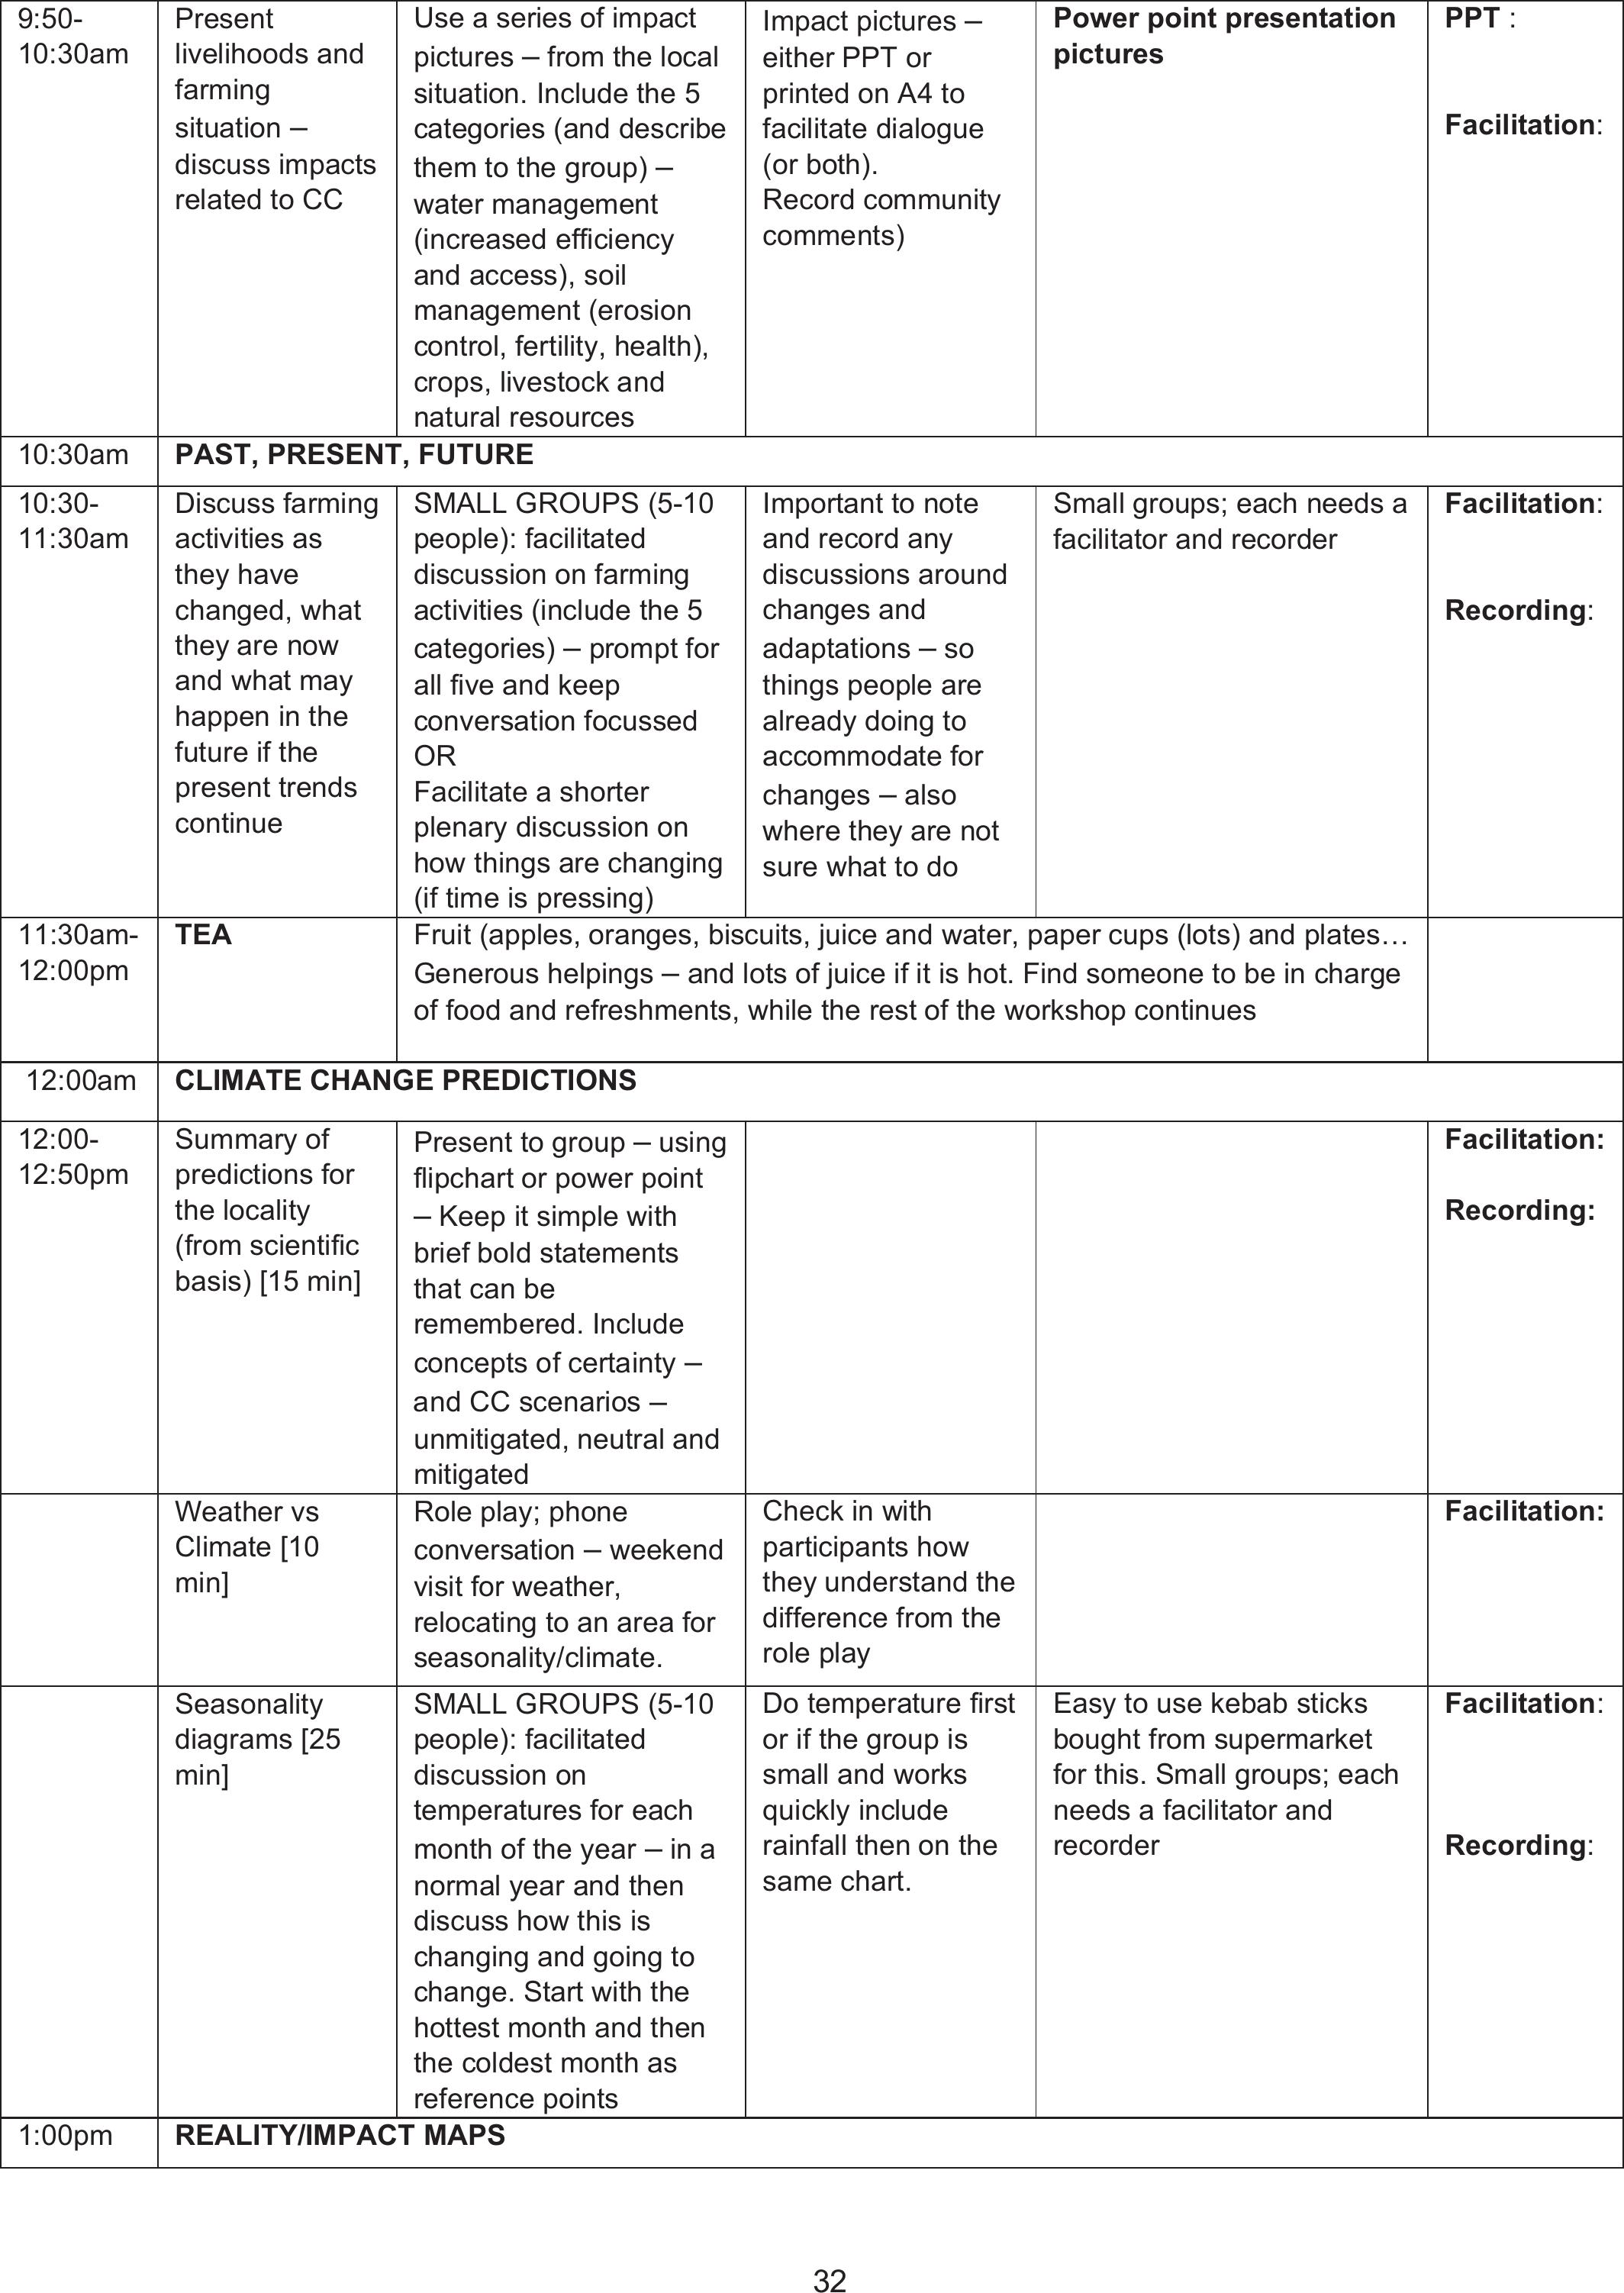
32
9:50-
10:30am
Present
livelihoods and
farming
situation –
discuss impacts
related to CC
Use a series of impact
pictures – from the local
situation. Include the 5
categories (and describe
them to the group) –
water management
(increased efficiency
and access), soil
management (erosion
control, fertility, health),
crops, livestock and
natural resources
Impact pictures –
either PPT or
printed on A4 to
facilitate dialogue
(or both).
Record community
comments)
Power point presentation
pictures
PPT :
Facilitation:
10:30am PAST, PRESENT, FUTURE
10:30-
11:30am
Discuss farming
activities as
they have
changed, what
they are now
and what may
happen in the
future if the
present trends
continue
SMALL GROUPS (5-10
people): facilitated
discussion on farming
activities (include the 5
categories) – prompt for
all five and keep
conversation focussed
OR
Facilitate a shorter
plenary discussion on
how things are changing
(if time is pressing)
Important to note
and record any
discussions around
changes and
adaptations – so
things people are
already doing to
accommodate for
changes – also
where they are not
sure what to do
Small groups; each needs a
facilitator and recorder
Facilitation:
Recording:
11:30am-
12:00pm
TEA Fruit (apples, oranges, biscuits, juice and water, paper cups (lots) and plates…
Generous helpings – and lots of juice if it is hot. Find someone to be in charge
of food and refreshments, while the rest of the workshop continues
12:00am CLIMATE CHANGE PREDICTIONS
12:00-
12:50pm
Summary of
predictions for
the locality
(from scientific
basis) [15 min]
Present to group– using
flipchart or power point
– Keep it simple with
brief bold statements
that can be
remembered. Include
concepts of certainty –
and CC scenarios –
unmitigated, neutral and
mitigated
Facilitation:
Recording:
Weather vs
Climate [10
min]
Role play; phone
conversation – weekend
visit for weather,
relocating to an area for
seasonality/climate.
Check in with
participants how
they understand the
difference from the
role play
Facilitation:
Seasonality
diagrams [25
min]
SMALL GROUPS (5-10
people): facilitated
discussion on
temperatures for each
month of the year – in a
normal year and then
discuss how this is
changing and going to
change. Start with the
hottest month and then
the coldest month as
reference points
Do temperature first
or if the group is
small and works
quickly include
rainfall then on the
same chart.
Easy to use kebab sticks
bought from supermarket
for this. Small groups; each
needs a facilitator and
recorder
Facilitation:
Recording:
1:00pm REALITY/IMPACT MAPS

33
1:00-
2:00pm
Impact of CC
mind map
SMALL GROUPS (5-10
people): facilitated
discussion – MIND MAP
of livelihood and farming
impacts (using the 5
categories) using Hotter
(drier) as the starting
point – LINKAGES
between cards on the
mind map – make
arrows (and include
more cards if need be
and discuss (e.g. hotter
soils, lead to poor
germination lead to poor
yields lead to hunger)
Prompt for social,
economic,
environmental
impacts as well if
these don't come
up in the group…
Small groups; each needs a
facilitator and recorder
Facilitation:
Recording:
2:00-
2:30pm
Possible
adaptive
measures
POSSIBLE
SOLUTIONS: things that
people know, have
changed, have tried and
or are trying, to deal with
the changes. Use
different coloured cards
to attach these solutions
to the mind map. If
participants are
struggling then rephrase
the -ve impact
statements into a +ve
outcome and ask what
actions are possible.
Also make a
separate list on
newsprint of names
of people trying
things plus the
innovation they are
trying (this is to
facilitate h/h visits
on day 2)
The cards need to be
written in local language
with smaller translations in
English written in on the
cards as well (to avoid the
need for later translations)
Facilitation:
Recording:
2:30-
2:45pm
CLOSURE REPORT BACKS – of
possible solutions
PLANNING FOR DAY 2
– choose 3-4
participants for
household visits and ask
for a small group of
other interested
individuals to join.
Decide on venue and
time (12 noon) for
continuing with practices
Households to be
within walking
distance hopefully.
Otherwise drive
these 3-4
participants around
and meet for focus
group thereafter
Rapporteurs need to be
chosen from the group to
summarise the solutions in
the report backs [5
min/group]
Facilitation:
Recording:
LUNCH Local catering groups to provide meals – ~R45 per head (Rice and stew with one
veg… or something similar)
DAY 2
9:00am HOUSEHOLD VISITS

34
9:00 am-
12:00pm
To look at local
adaptations and
innovations
To assess the
household situations
To start to elucidate
criteria people use to
make choices and
decisions
Use questionnaire
and fill in through
semi structured
interview and
observations
Questionnaires to contain
the following info:
• Head of household
(male/female)
• No of adults
• No of children
(dependency ratio)
• Income sources
• Level of income
• Scale of operation: 0,1-1
ha, 1-2 ha, > 2 ha
• Farming activities:
Gardens, fields, livestock
,trees
• Market access
• Other activities
• Resources
• Water access
• Infrastructure
• Knowledge and skills
• Literacy rate
• Social organisation
Facilitation:
Recording:
Team meets in evening (BEFORE DAY 2) to discuss mind maps and lists of solutions and
choose a range of practices from the database to present (5-10). Also, summarise criteria that
came from the household visit discussions.
TEA Packed tea for on the go to share with household members
12:00 PRACTICES
12:00-
1:00pm
New ideas/
practices/
innovations
Recap and summary of
day 1
Introduce a selection of
new practices _power
point and A4s (chosen
the night before by
facilitation team to
match the general sense
of what participants
need ideas for or what
they are trying (to
improve upon those).
Provide descriptions and
get questions and
comments
Select the 5-10
practices
beforehand and
make sure there
are 3-4 copies of
the A4s for the
small groups and or
a power point
presentation –
record comments
from participants
Sets of practices (A 4s),
attendance registers
Materials
and
logistics:
Facilitation:
Recording:
1:00-
1:20pm
Criteria for
selection of
practices
In plenary present
criteria, discuss with
group and add more
(prompt for criteria to
relate to five categories
(e.g. saving and using
water well, increasing
access to water,
improving organic
matter, increasing soil
health, increasing
natural resources....
etc.) along with criteria
like cost, labour, time....
Choose 5-7/8
criteria max. Some
criteria can be
made from two into
one…
Flipchart, newsprint, kokis Facilitation:
Recording:
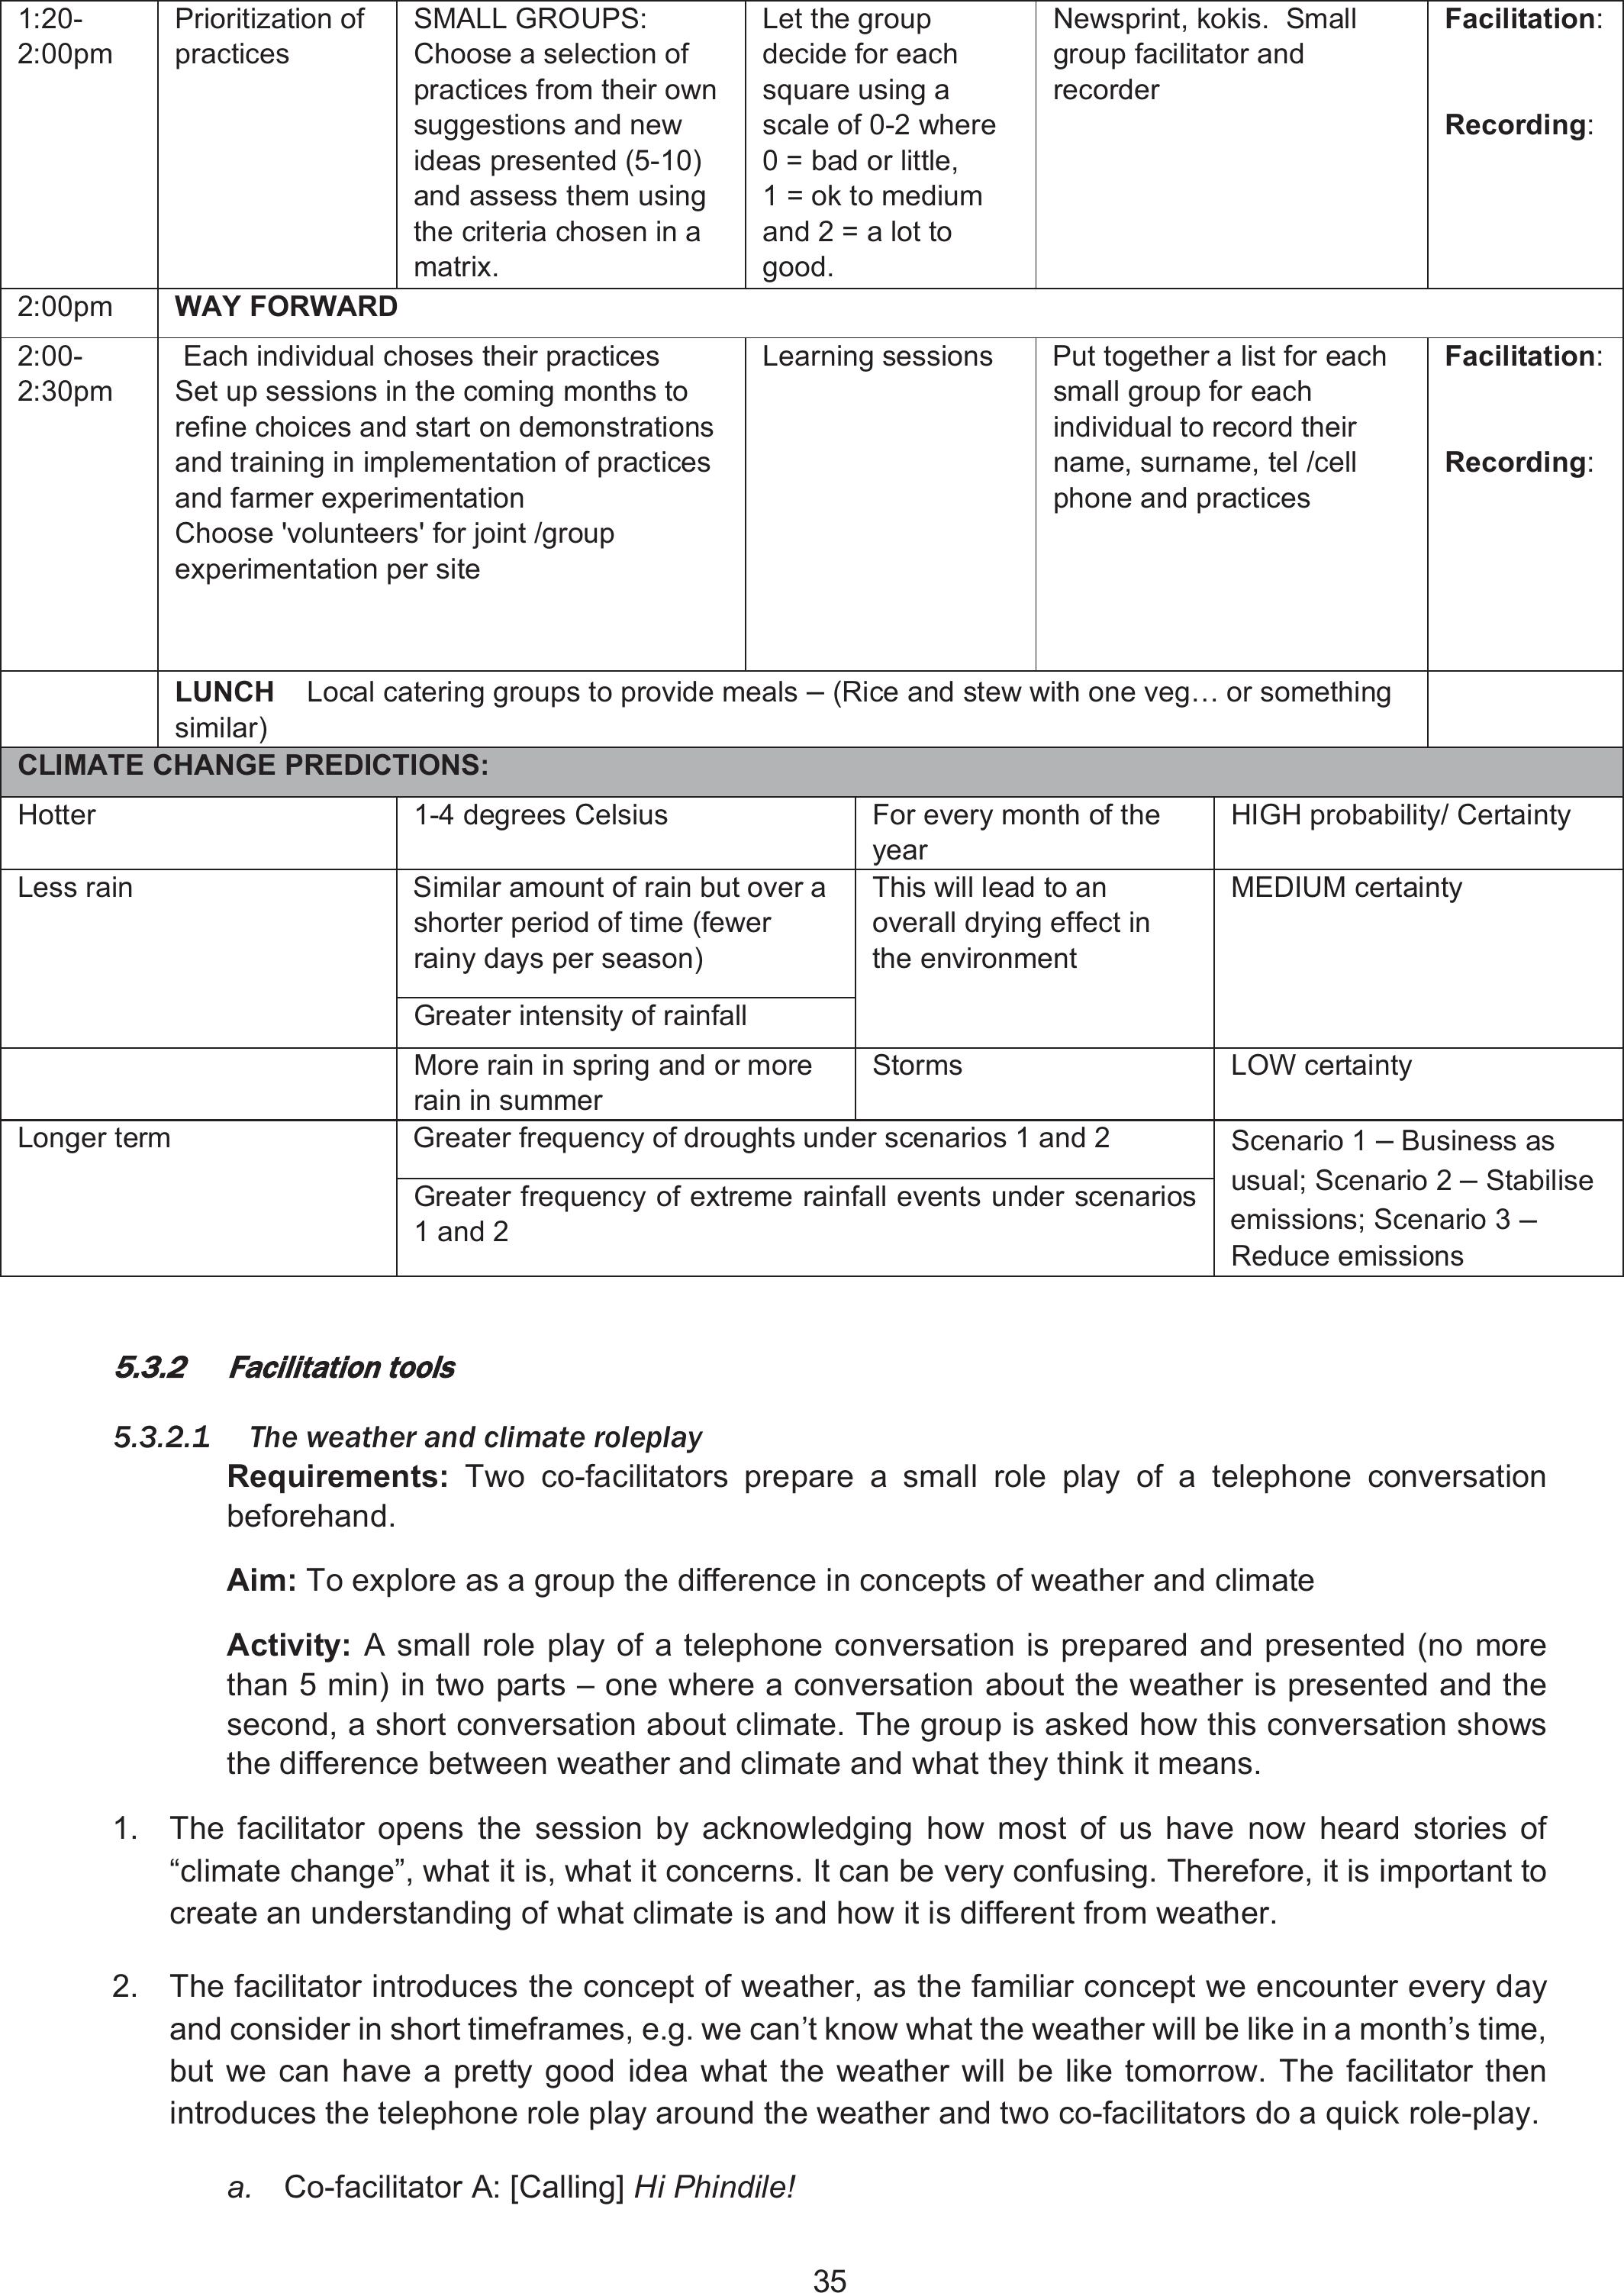
35
1:20-
2:00pm
Prioritization of
practices
SMALL GROUPS:
Choose a selection of
practices from their own
suggestions and new
ideas presented (5-10)
and assess them using
the criteria chosen in a
matrix.
Let the group
decide for each
square using a
scale of 0-2 where
0 = bad or little,
1 = ok to medium
and 2 = a lot to
good.
Newsprint, kokis. Small
group facilitator and
recorder
Facilitation:
Recording:
2:00pm WAY FORWARD
2:00-
2:30pm
Each individual choses their practices
Set up sessions in the coming months to
refine choices and start on demonstrations
and training in implementation of practices
and farmer experimentation
Choose 'volunteers' for joint /group
experimentation per site
Learning sessions Put together a list for each
small group for each
individual to record their
name, surname, tel /cell
phone and practices
Facilitation:
Recording:
LUNCH Local catering groups to provide meals – (Rice and stew with one veg… or something
similar)
CLIMATE CHANGE PREDICTIONS:
Hotter 1-4 degrees Celsius For every month of the
year
HIGH probability/ Certainty
Less rainSimilar amount of rain but over a
shorter period of time (fewer
rainy days per season)
This will lead to an
overall drying effect in
the environment
MEDIUM certainty
Greater intensity of rainfall
More rain in spring and or more
rain in summer
Storms LOW certainty
Longer term Greater frequency of droughts under scenarios 1 and 2 Scenario 1– Business as
usual; Scenario 2 – Stabilise
emissions; Scenario 3 –
Reduce emissions
Greater frequency of extreme rainfall events under scenarios
1 and 2
5
5.3.2
Facilitation tools
5.3.2.1The weather and climate roleplay
Requirements: Two co-facilitators prepare a small role play of a telephone conversation
beforehand.
Aim: To explore as a group the difference in concepts of weather and climate
Activity: A small role play of a telephone conversation is prepared and presented (no more
than 5 min) in two parts – one where a conversation about the weather is presented and the
second, a short conversation about climate. The group is asked how this conversation shows
the difference between weather and climate and what they think it means.
1. The facilitator opens the session by acknowledging how most of us have now heard stories of
“climate change”, what it is, what it concerns. It can be very confusing. Therefore, it is important to
create an understanding of what climate is and how it is different from weather.
2. The facilitator introduces the concept of weather, as the familiar concept we encounter every day
and consider in short timeframes, e.g. we can’t know what the weather will be like in a month’s time,
but we can have a pretty good idea what the weather will be like tomorrow. The facilitator then
introduces the telephone role play around the weather and two co-facilitators do a quick role-play.
a. Co-facilitator A: [Calling] Hi Phindile!
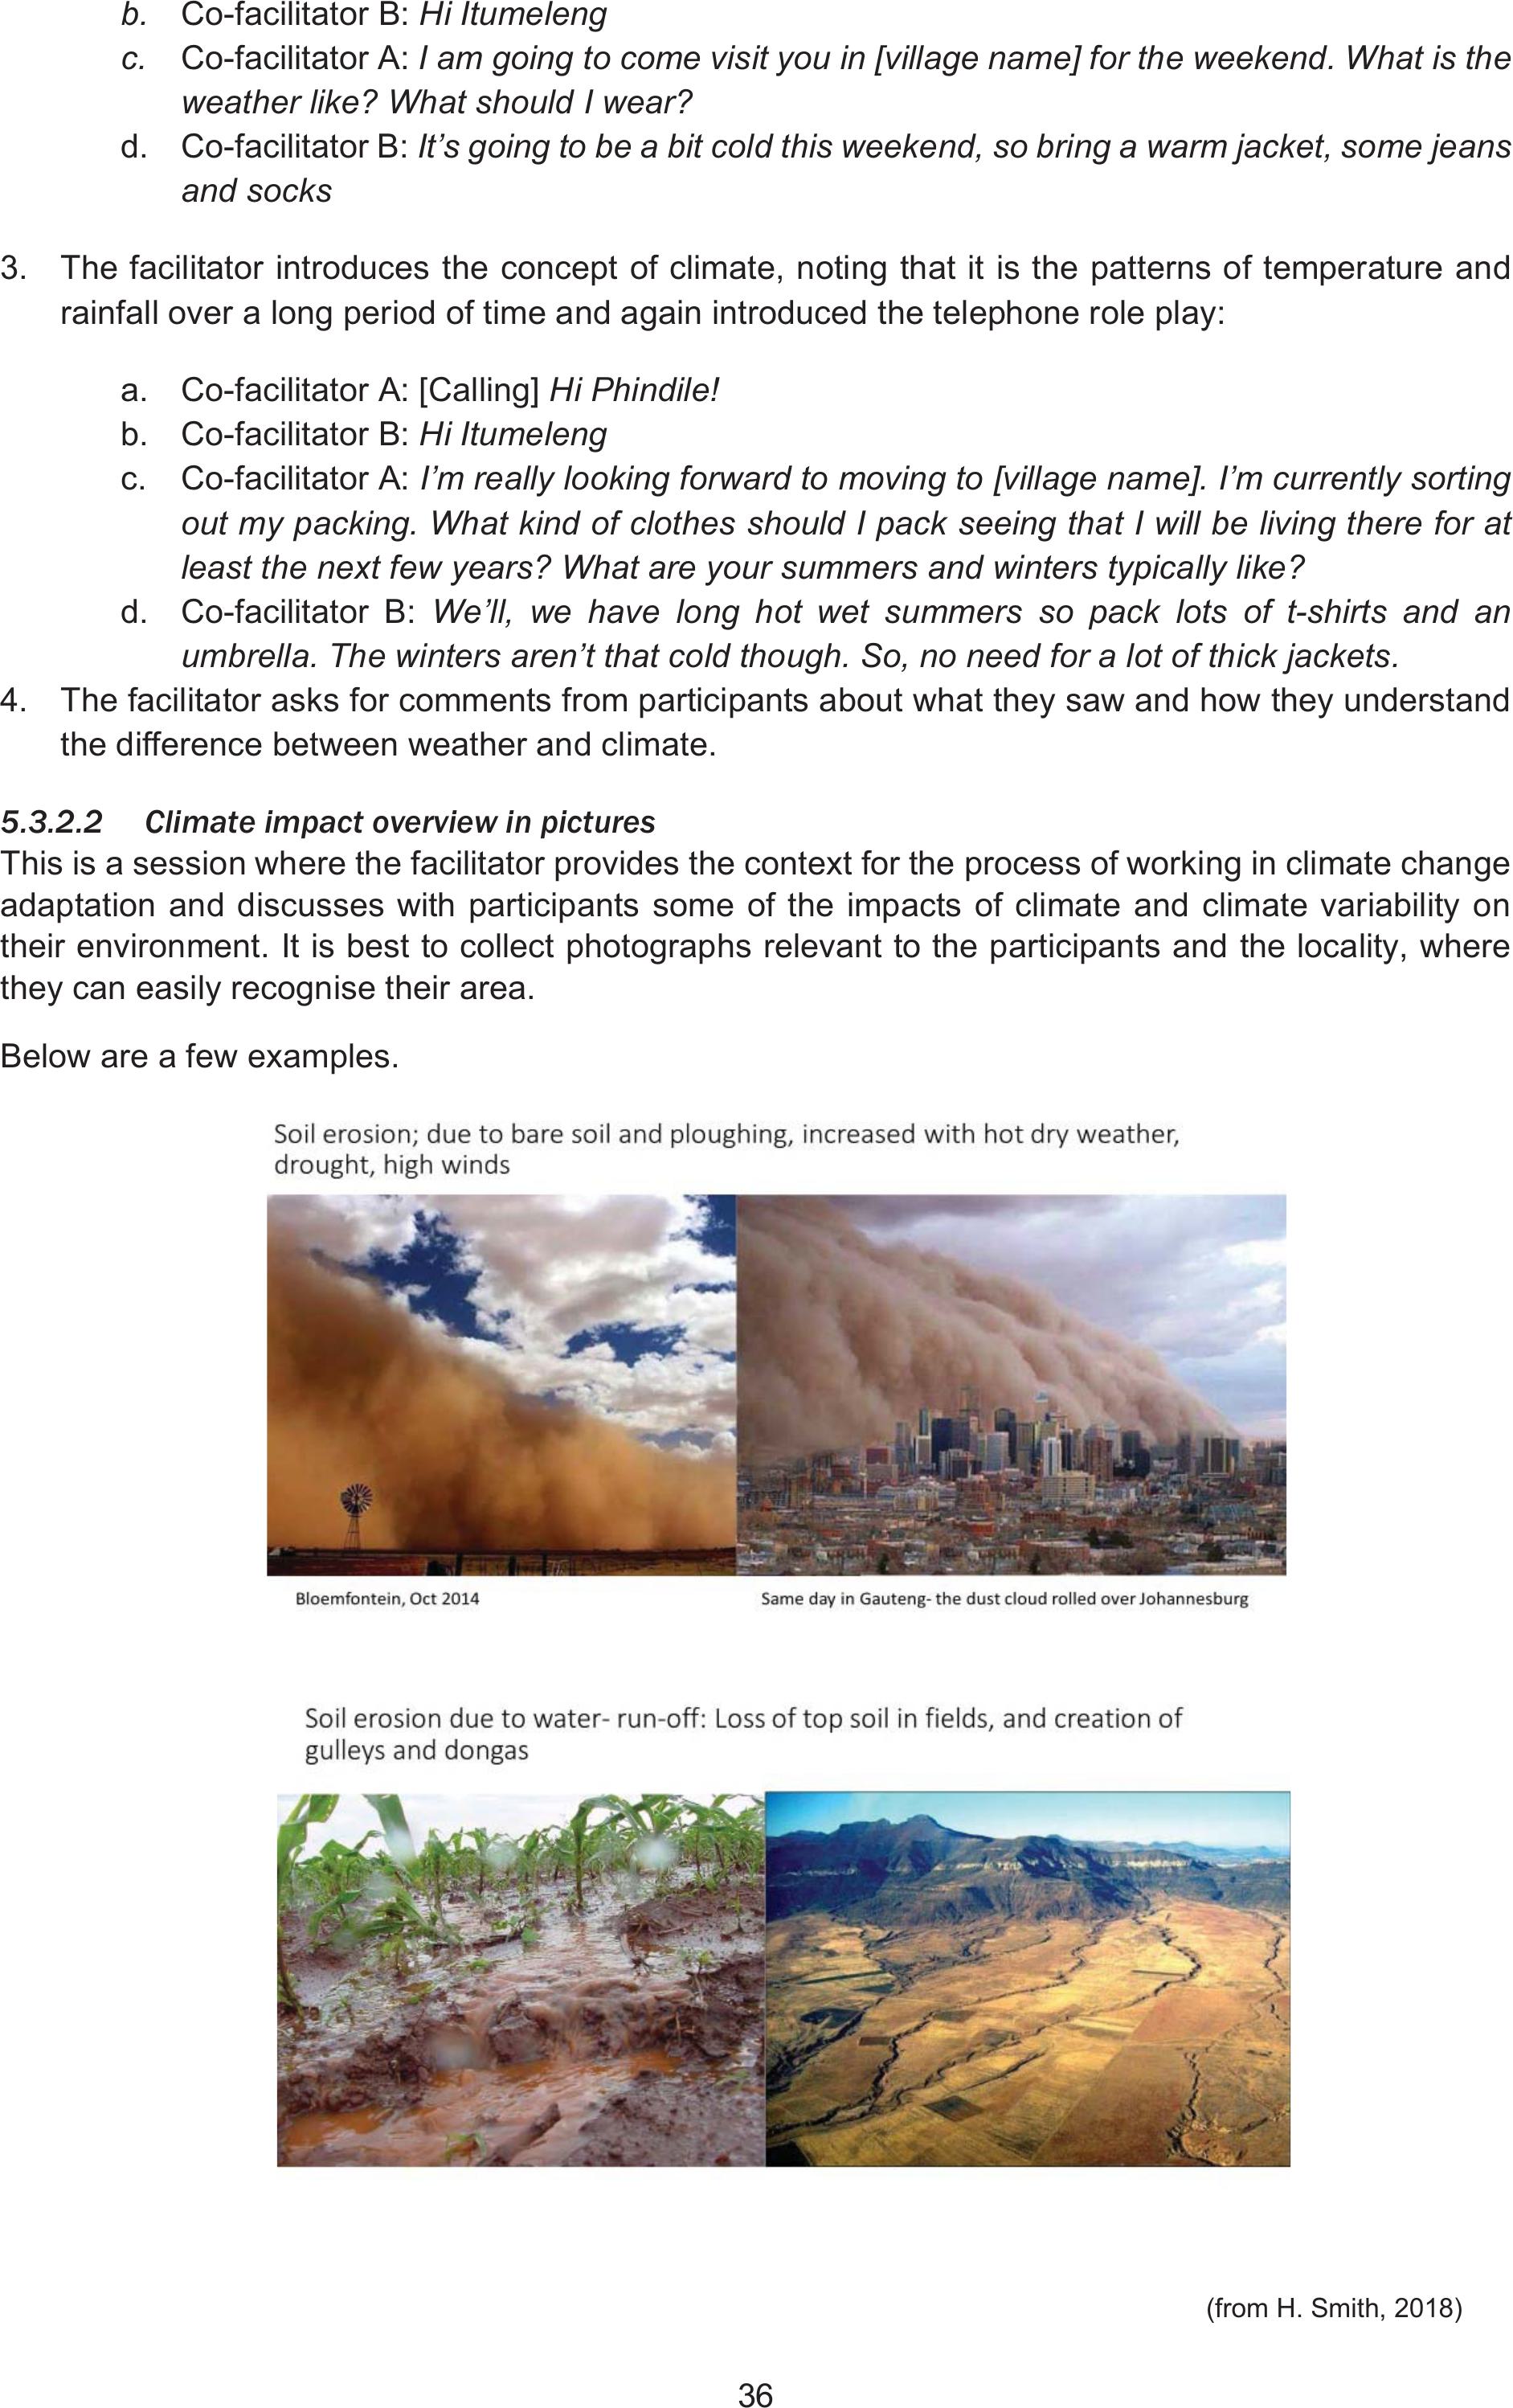
36
b. Co-facilitator B: Hi Itumeleng
c. Co-facilitator A: I am going to come visit you in [village name] for the weekend. What is the
weather like? What should I wear?
d. Co-facilitator B:It’s going to be a bit cold this weekend, so bring a warm jacket, some jeans
and socks
3. The facilitator introduces the concept of climate, noting that it is the patterns of temperature and
rainfall over a long period of time and again introduced the telephone role play:
a. Co-facilitator A: [Calling] Hi Phindile!
b. Co-facilitator B: Hi Itumeleng
c. Co-facilitatorA: I’m really looking forward to moving to [village name]. I’m currently sorting
out my packing. What kind of clothes should I pack seeing that I will be living there for at
least the next few years? What are your summers and winters typically like?
d. Co-facilitator B: We’ll, we have long hot wet summers so pack lots of t-shirts and an
umbrella. The winters aren’t that cold though. So, no need for a lot of thick jackets.
4. The facilitator asks for comments from participants about what they saw and how they understand
the difference between weather and climate.
5.3.2.2Climate impact overview in pictures
This is a session where the facilitator provides the context for the process of working in climate change
adaptation and discusses with participants some of the impacts of climate and climate variability on
their environment. It is best to collect photographs relevant to the participants and the locality, where
they can easily recognise their area.
Below are a few examples.
(from H. Smith, 2018)
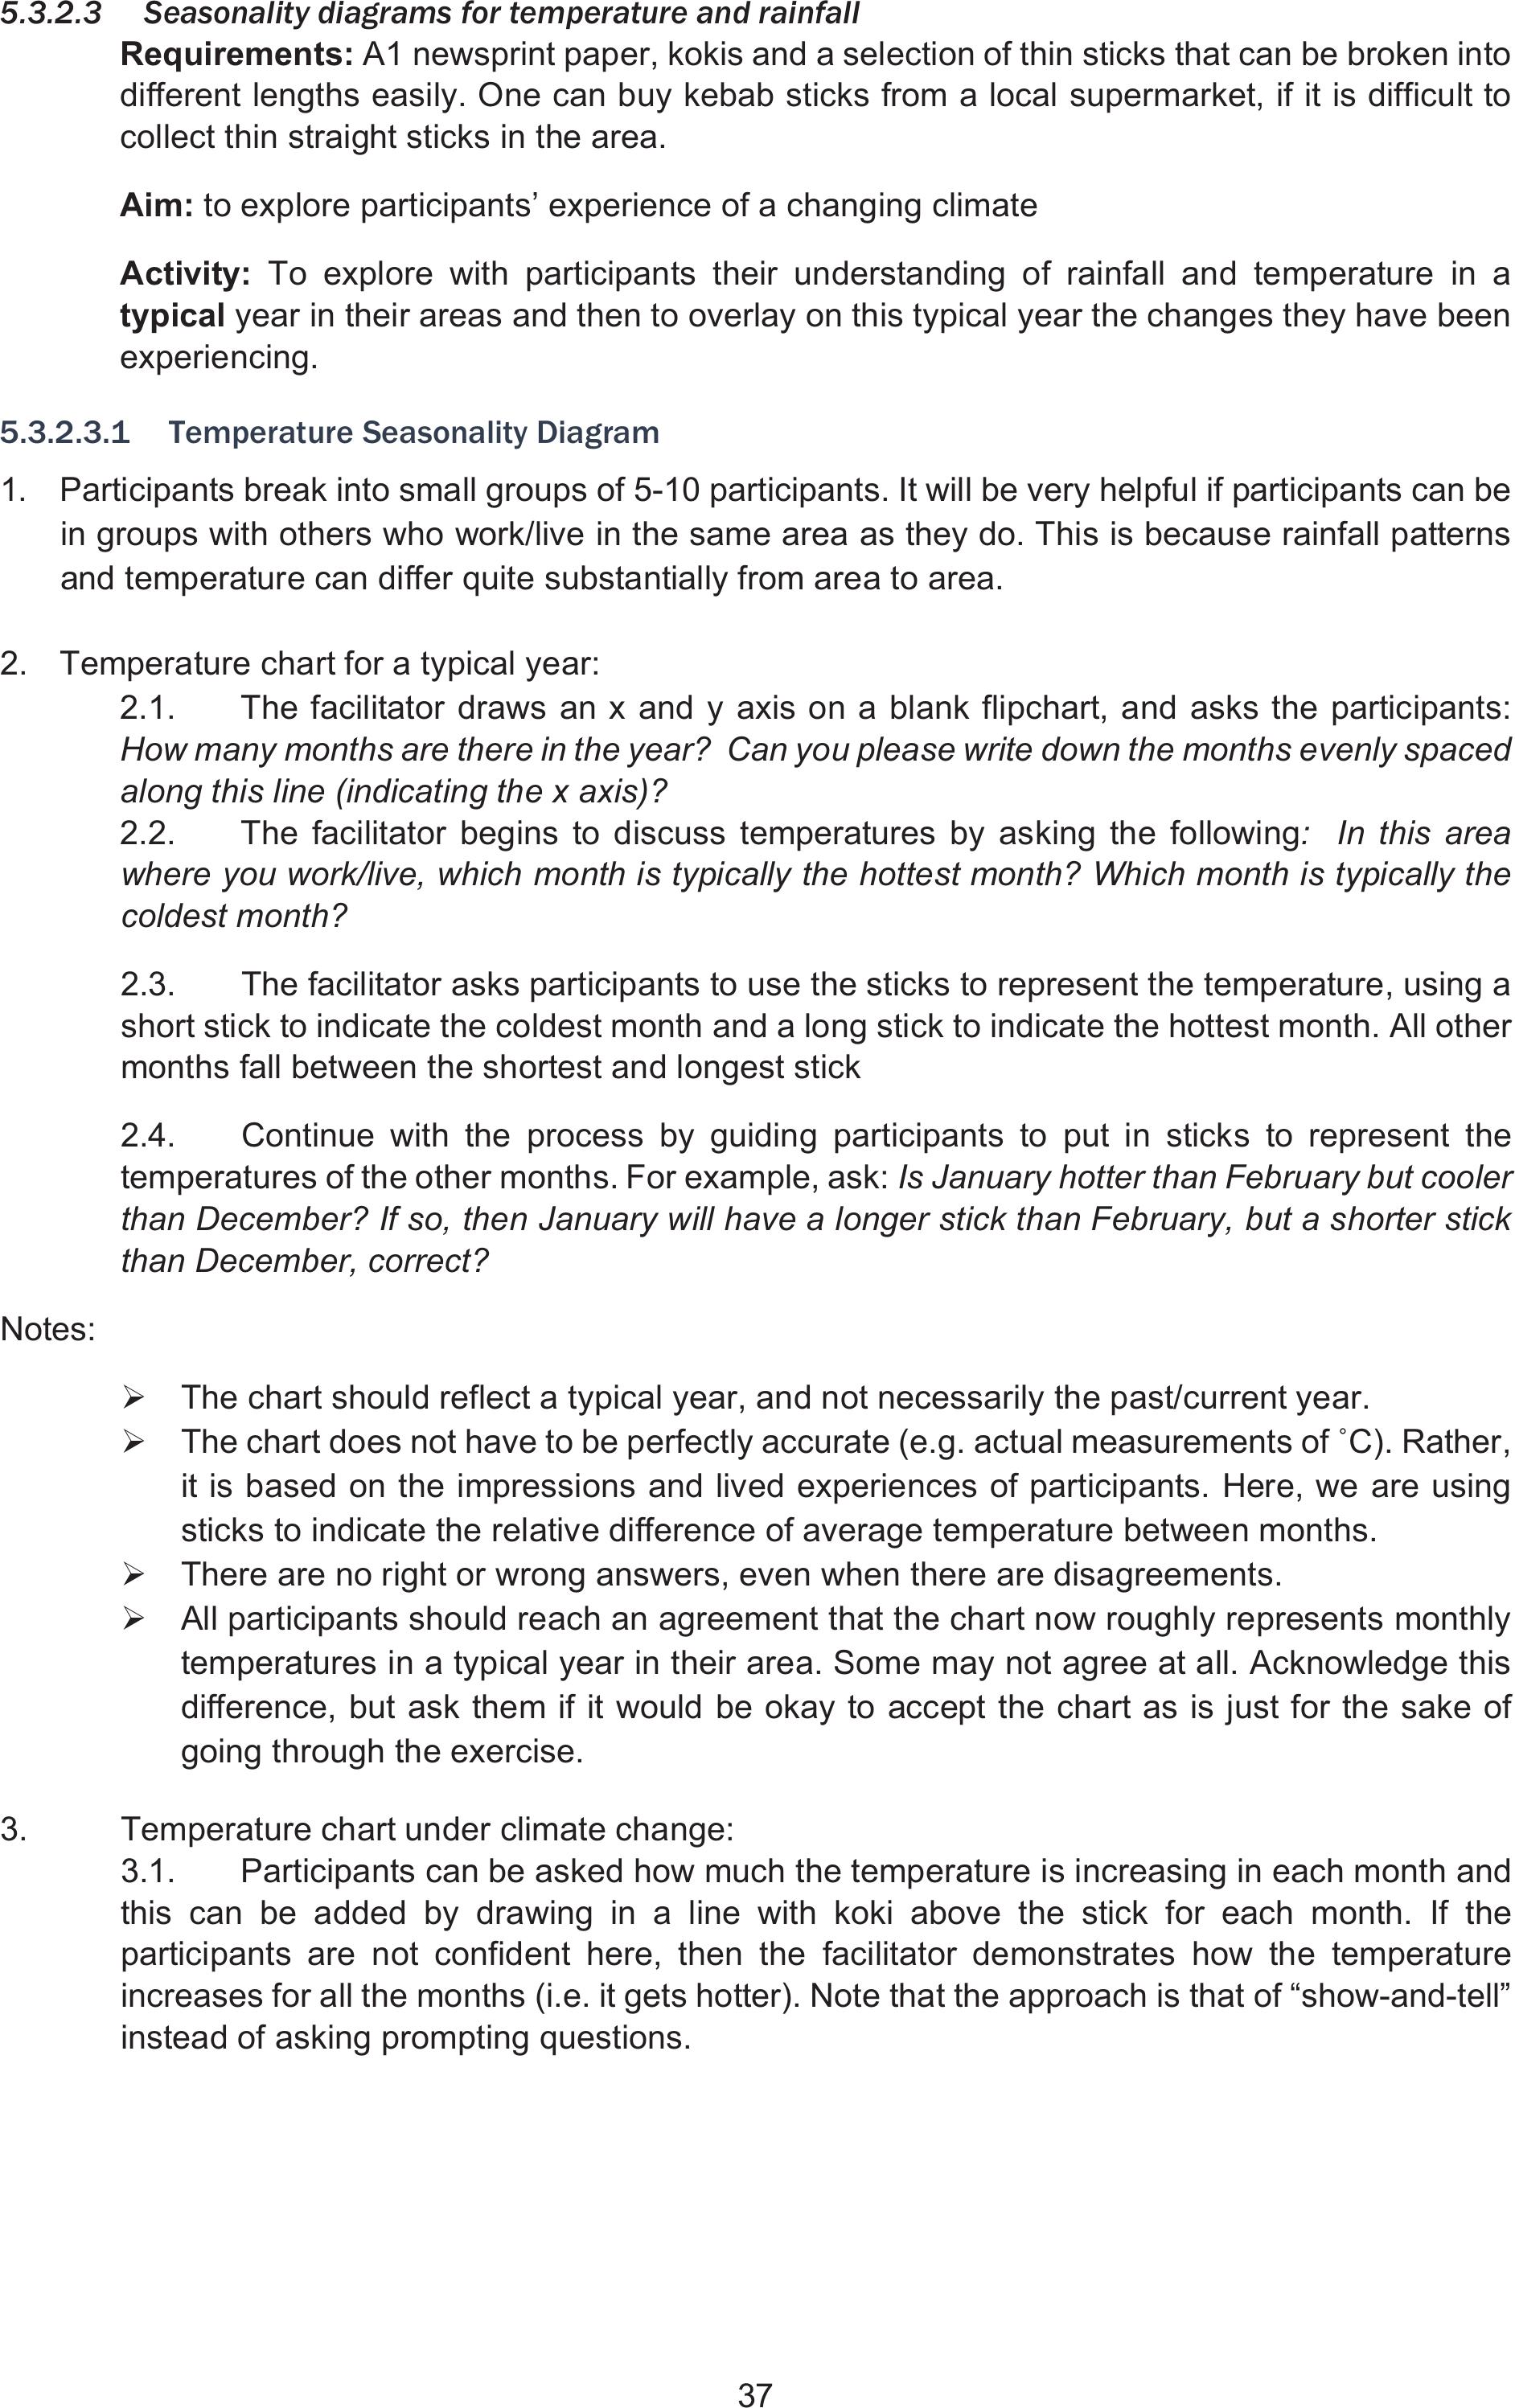
37
5.3.2.3Seasonality diagrams for temperature and rainfall
Requirements: A1 newsprint paper, kokis and a selection of thin sticks that can be broken into
different lengths easily. One can buy kebab sticks from a local supermarket, if it is difficult to
collect thin straight sticks in the area.
Aim: to explore participants’ experience of a changing climate
Activity: To explore with participants their understanding of rainfall and temperature in a
typical year in their areas and then to overlay on this typical year the changes they have been
experiencing.
5.3.2.3.1Temperature Seasonality Diagram
1. Participants break into small groups of 5-10 participants. It will be very helpful if participants can be
in groups with others who work/live in the same area as they do. This is because rainfall patterns
and temperature can differ quite substantially from area to area.
2. Temperature chart for a typical year:
2.1. The facilitator draws an x and y axis on a blank flipchart, and asks the participants:
How many months are there in the year? Can you please write down the months evenly spaced
along this line (indicating the x axis)?
2.2. The facilitator begins to discuss temperatures by asking the following: In this area
where you work/live, which month is typically the hottest month? Which month is typically the
coldest month?
2.3. The facilitator asks participants to use the sticks to represent the temperature, using a
short stick to indicate the coldest month and a long stick to indicate the hottest month. All other
months fall between the shortest and longest stick
2.4. Continue with the process by guiding participants to put in sticks to represent the
temperatures of the other months. For example, ask: Is January hotter than February but cooler
than December? If so, then January will have a longer stick than February, but a shorter stick
than December, correct?
Notes:
¾The chart should reflect a typical year, and not necessarily the past/current year.
¾7KHFKDUWGRHVQRWKDYHWREHSHUIHFWO\DFFXUDWHHJDFWXDOPHDVXUHPHQWVRIÛ&5DWKHU
it is based on the impressions and lived experiences of participants. Here, we are using
sticks to indicate the relative difference of average temperature between months.
¾There are no right or wrong answers, even when there are disagreements.
¾All participants should reach an agreement that the chart now roughly represents monthly
temperatures in a typical year in their area. Some may not agree at all. Acknowledge this
difference, but ask them if it would be okay to accept the chart as is just for the sake of
going through the exercise.
3. Temperature chart under climate change:
3.1. Participants can be asked how much the temperature is increasing in each month and
this can be added by drawing in a line with koki above the stick for each month. If the
participants are not confident here, then the facilitator demonstrates how the temperature
increases for all the months (i.e. it gets hotter). Note that the approach is that of “show-and-tell”
instead of asking prompting questions.
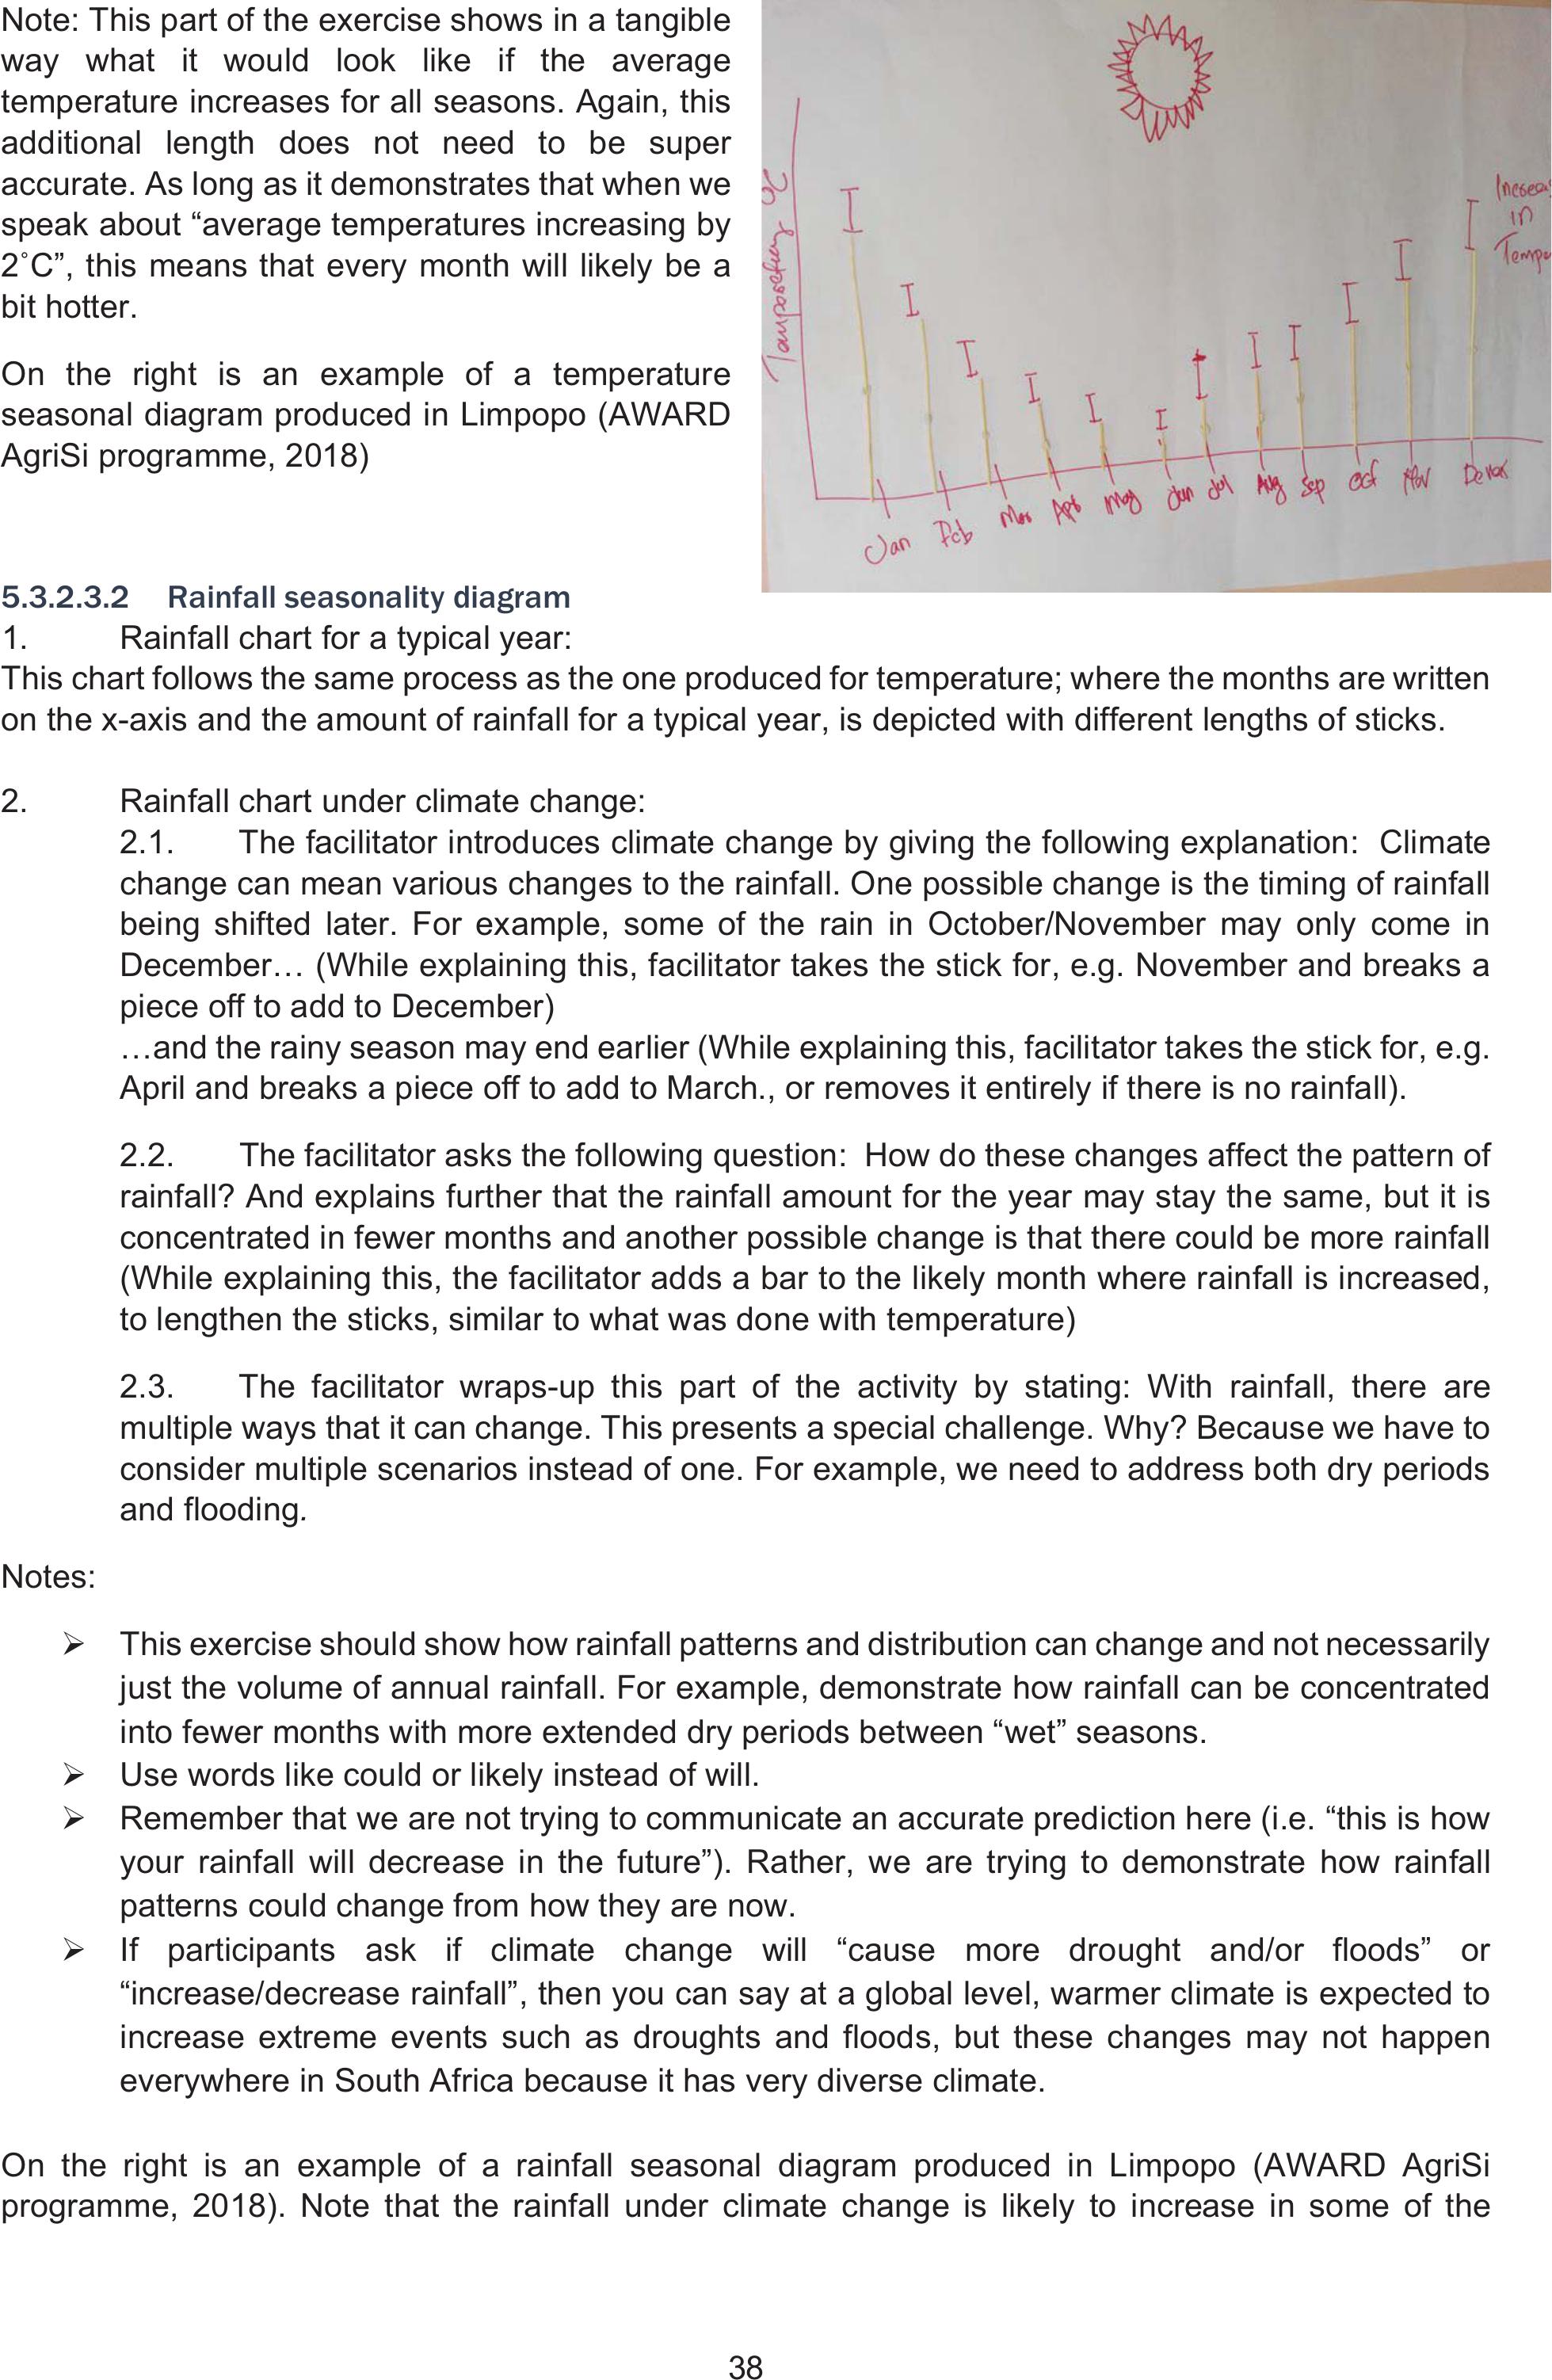
38
Note: This part of the exercise shows in a tangible
way what it would look like if the average
temperature increases for all seasons. Again, this
additional length does not need to be super
accurate. As long as it demonstrates that when we
speak about “average temperatures increasing by
Û&´WKLVPHDQVWKDWHYHU\PRQWKZLOOOLNHO\EHD
bit hotter.
On the right is an example of a temperature
seasonal diagram produced in Limpopo (AWARD
AgriSi programme, 2018)
5.3.2.3.2Rainfall seasonality diagram
1. Rainfall chart for a typical year:
This chart follows the same process as the one produced for temperature; where the months are written
on the x-axis and the amount of rainfall for a typical year, is depicted with different lengths of sticks.
2. Rainfall chart under climate change:
2.1. The facilitator introduces climate change by giving the following explanation: Climate
change can mean various changes to the rainfall. One possible change is the timing of rainfall
being shifted later. For example, some of the rain in October/November may only come in
December… (While explaining this, facilitator takes the stick for, e.g. November and breaks a
piece off to add to December)
…and the rainy season may end earlier (While explaining this, facilitator takes the stick for, e.g.
April and breaks a piece off to add to March., or removes it entirely if there is no rainfall).
2.2. The facilitator asks the following question: How do these changes affect the pattern of
rainfall? And explains further that the rainfall amount for the year may stay the same, but it is
concentrated in fewer months and another possible change is that there could be more rainfall
(While explaining this, the facilitator adds a bar to the likely month where rainfall is increased,
to lengthen the sticks, similar to what was done with temperature)
2.3. The facilitator wraps-up this part of the activity by stating: With rainfall, there are
multiple ways that it can change. This presents a special challenge. Why? Because we have to
consider multiple scenarios instead of one. For example, we need to address both dry periods
and flooding.
Notes:
¾This exercise should show how rainfall patterns and distribution can change and not necessarily
just the volume of annual rainfall. For example, demonstrate how rainfall can be concentrated
into fewer months with more extended dry periods between “wet” seasons.
¾Use words like could or likely instead of will.
¾Remember that we are not trying to communicate an accurate prediction here (i.e. “this is how
your rainfall will decrease in the future”). Rather, we are trying to demonstrate how rainfall
patterns could change from how they are now.
¾If participants ask if climate change will “cause more drought and/or floods” or
“increase/decrease rainfall”, then you can say at a global level, warmer climate is expected to
increase extreme events such as droughts and floods, but these changes may not happen
everywhere in South Africa because it has very diverse climate.
On the right is an example of a rainfall seasonal diagram produced in Limpopo (AWARD AgriSi
programme, 2018). Note that the rainfall under climate change is likely to increase in some of the
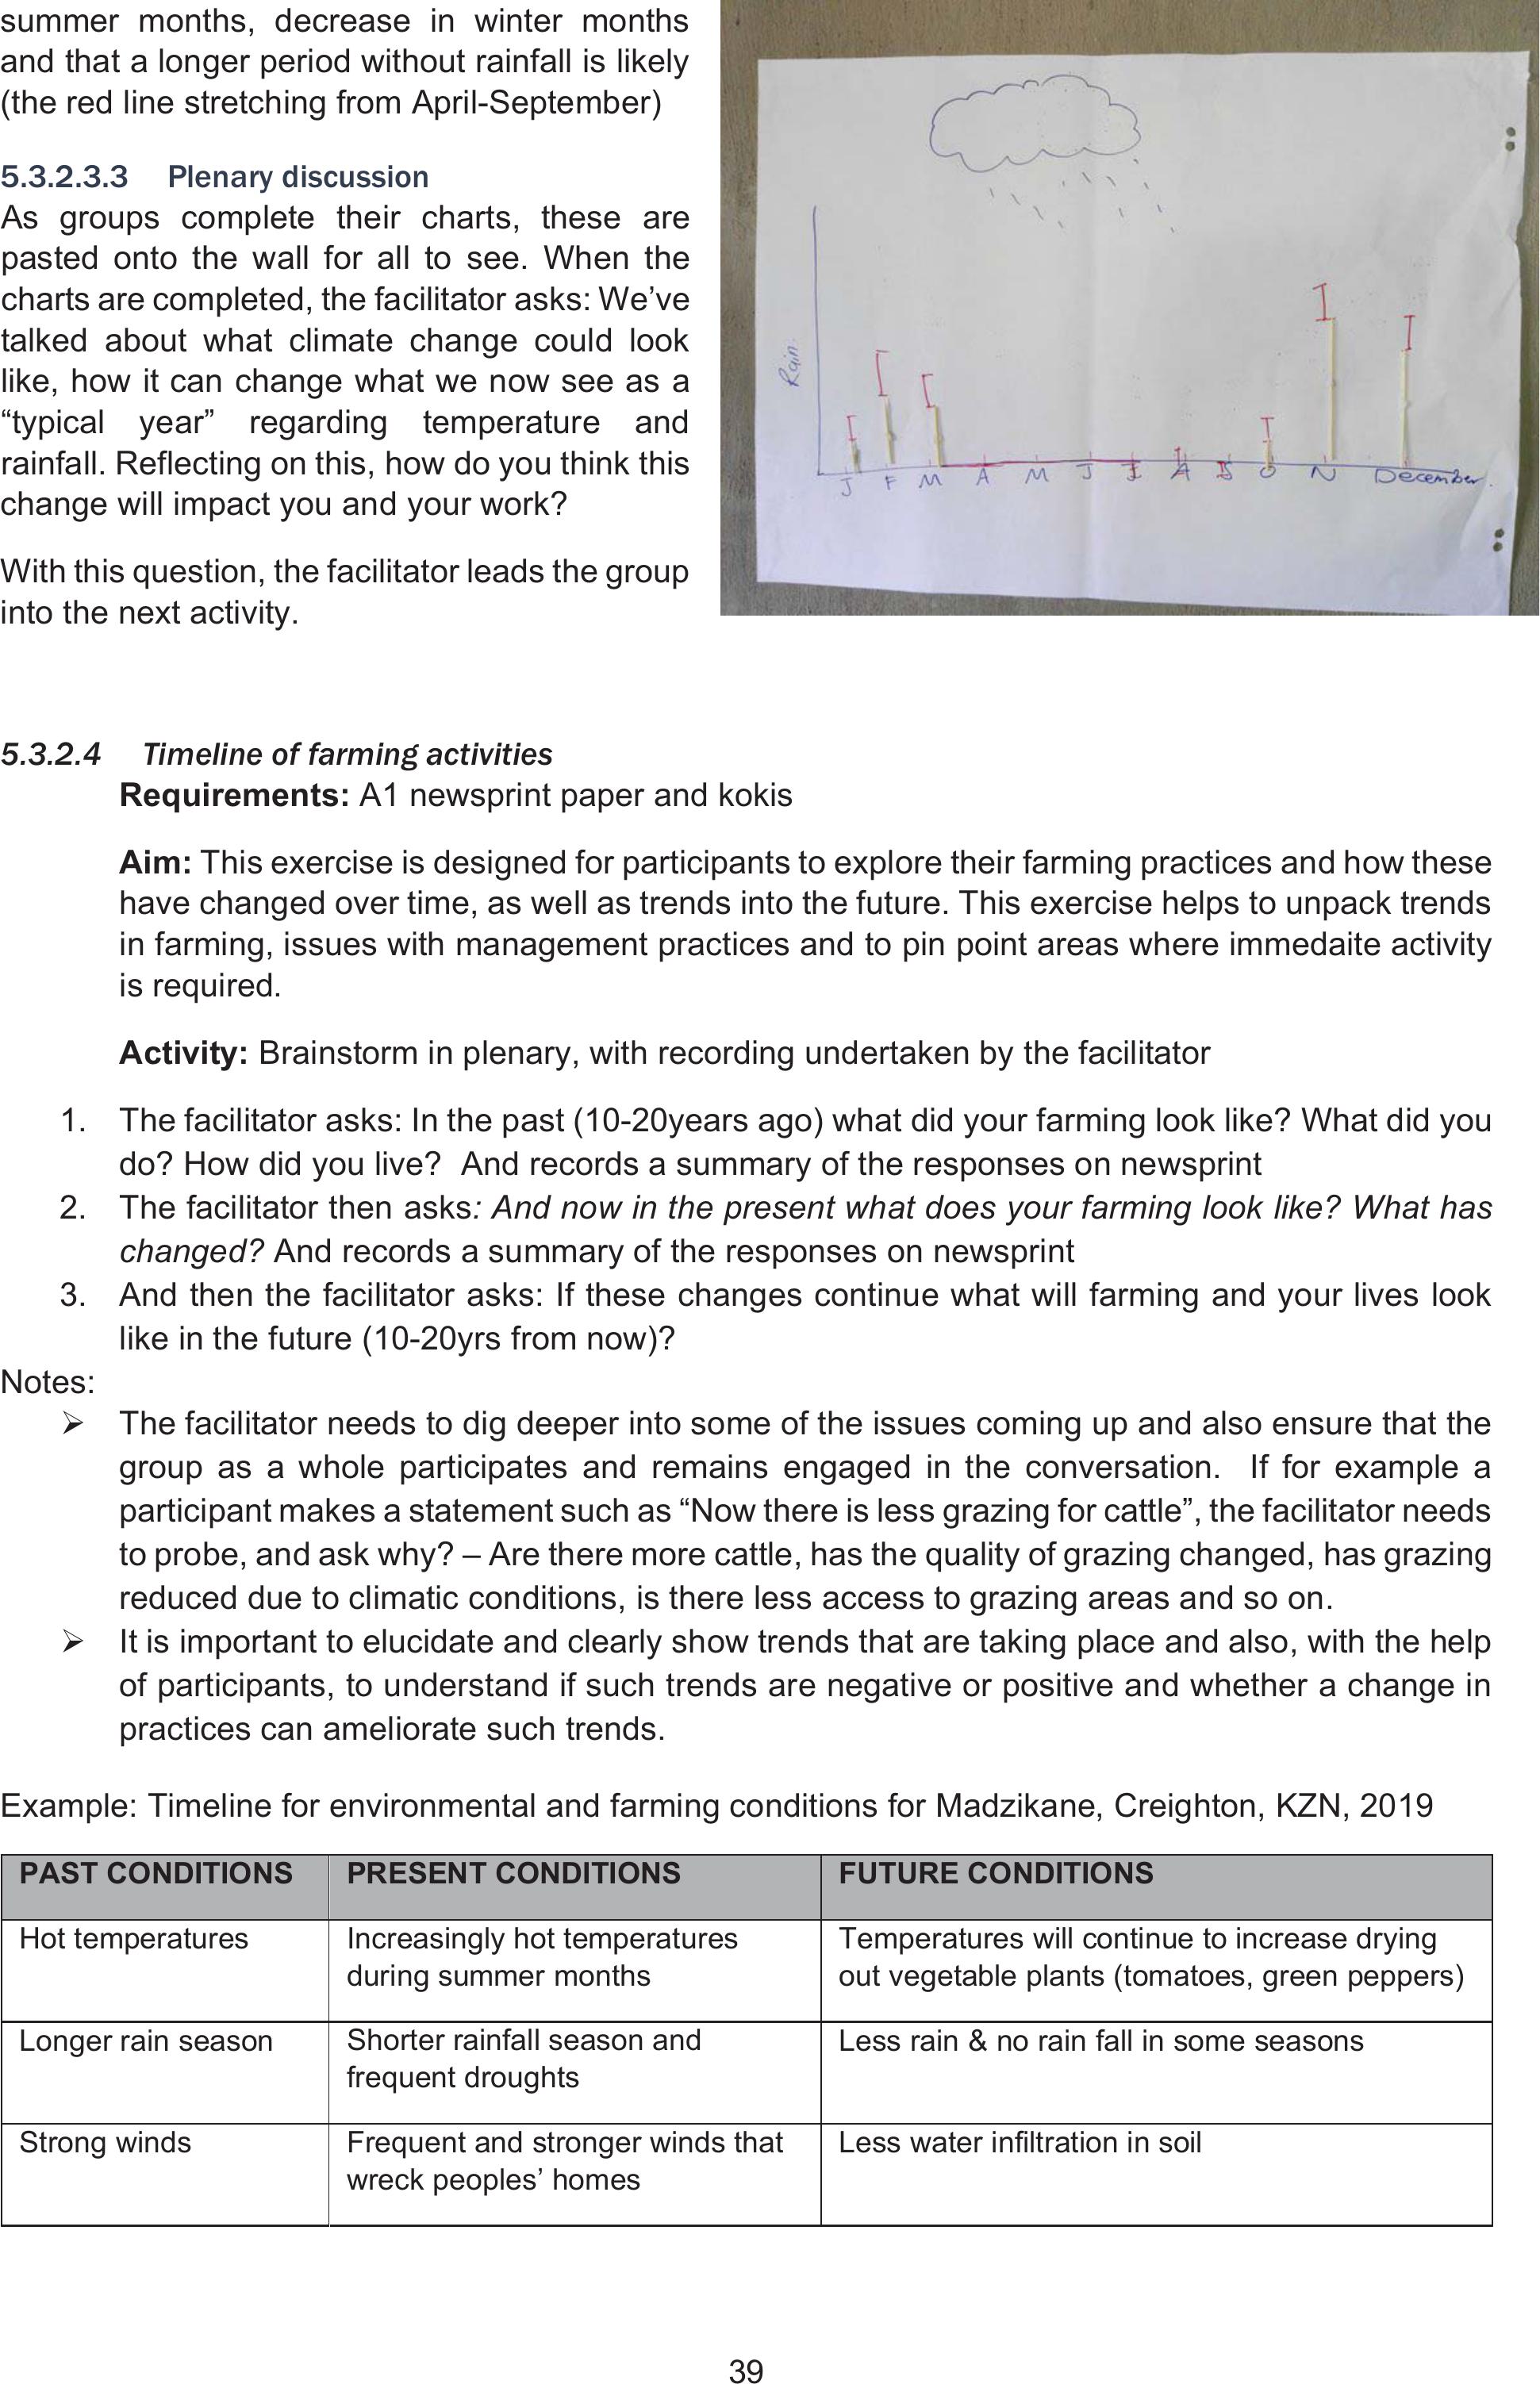
39
summer months, decrease in winter months
and that a longer period without rainfall is likely
(the red line stretching from April-September)
5.3.2.3.3Plenary discussion
As groups complete their charts, these are
pasted onto the wall for all to see. When the
charts are completed,the facilitator asks: We’ve
talked about what climate change could look
like, how it can change what we now see as a
“typical year” regarding temperature and
rainfall. Reflecting on this, how do you think this
change will impact you and your work?
With this question, the facilitator leads the group
into the next activity.
5.3.2.4Timeline of farming activities
Requirements: A1 newsprint paper and kokis
Aim: This exercise is designed for participants to explore their farming practices and how these
have changed over time, as well as trends into the future. This exercise helps to unpack trends
in farming, issues with management practices and to pin point areas where immedaite activity
is required.
Activity: Brainstorm in plenary, with recording undertaken by the facilitator
1. The facilitator asks: In the past (10-20years ago) what did your farming look like? What did you
do? How did you live? And records a summary of the responses on newsprint
2. The facilitator then asks: And now in the present what does your farming look like? What has
changed? And records a summary of the responses on newsprint
3. And then the facilitator asks: If these changes continue what will farming and your lives look
like in the future (10-20yrs from now)?
Notes:
¾The facilitator needs to dig deeper into some of the issues coming up and also ensure that the
group as a whole participates and remains engaged in the conversation. If for example a
participant makes a statement such as “Now there is less grazing for cattle”, the facilitator needs
to probe, and ask why? – Are there more cattle, has the quality of grazing changed, has grazing
reduced due to climatic conditions, is there less access to grazing areas and so on.
¾It is important to elucidate and clearly show trends that are taking place and also, with the help
of participants, to understand if such trends are negative or positive and whether a change in
practices can ameliorate such trends.
Example: Timeline for environmental and farming conditions for Madzikane, Creighton, KZN, 2019
PAST CONDITIONS PRESENT CONDITIONS FUTURE CONDITIONS
Hot temperatures Increasingly hot temperatures
during summer months
Temperatures will continue to increase drying
out vegetable plants (tomatoes, green peppers)
Longer rain season Shorter rainfall season and
frequent droughts
Less rain & no rain fall in some seasons
Strong winds Frequent and stronger winds that
wreck peoples’ homes
Less water infiltration in soil
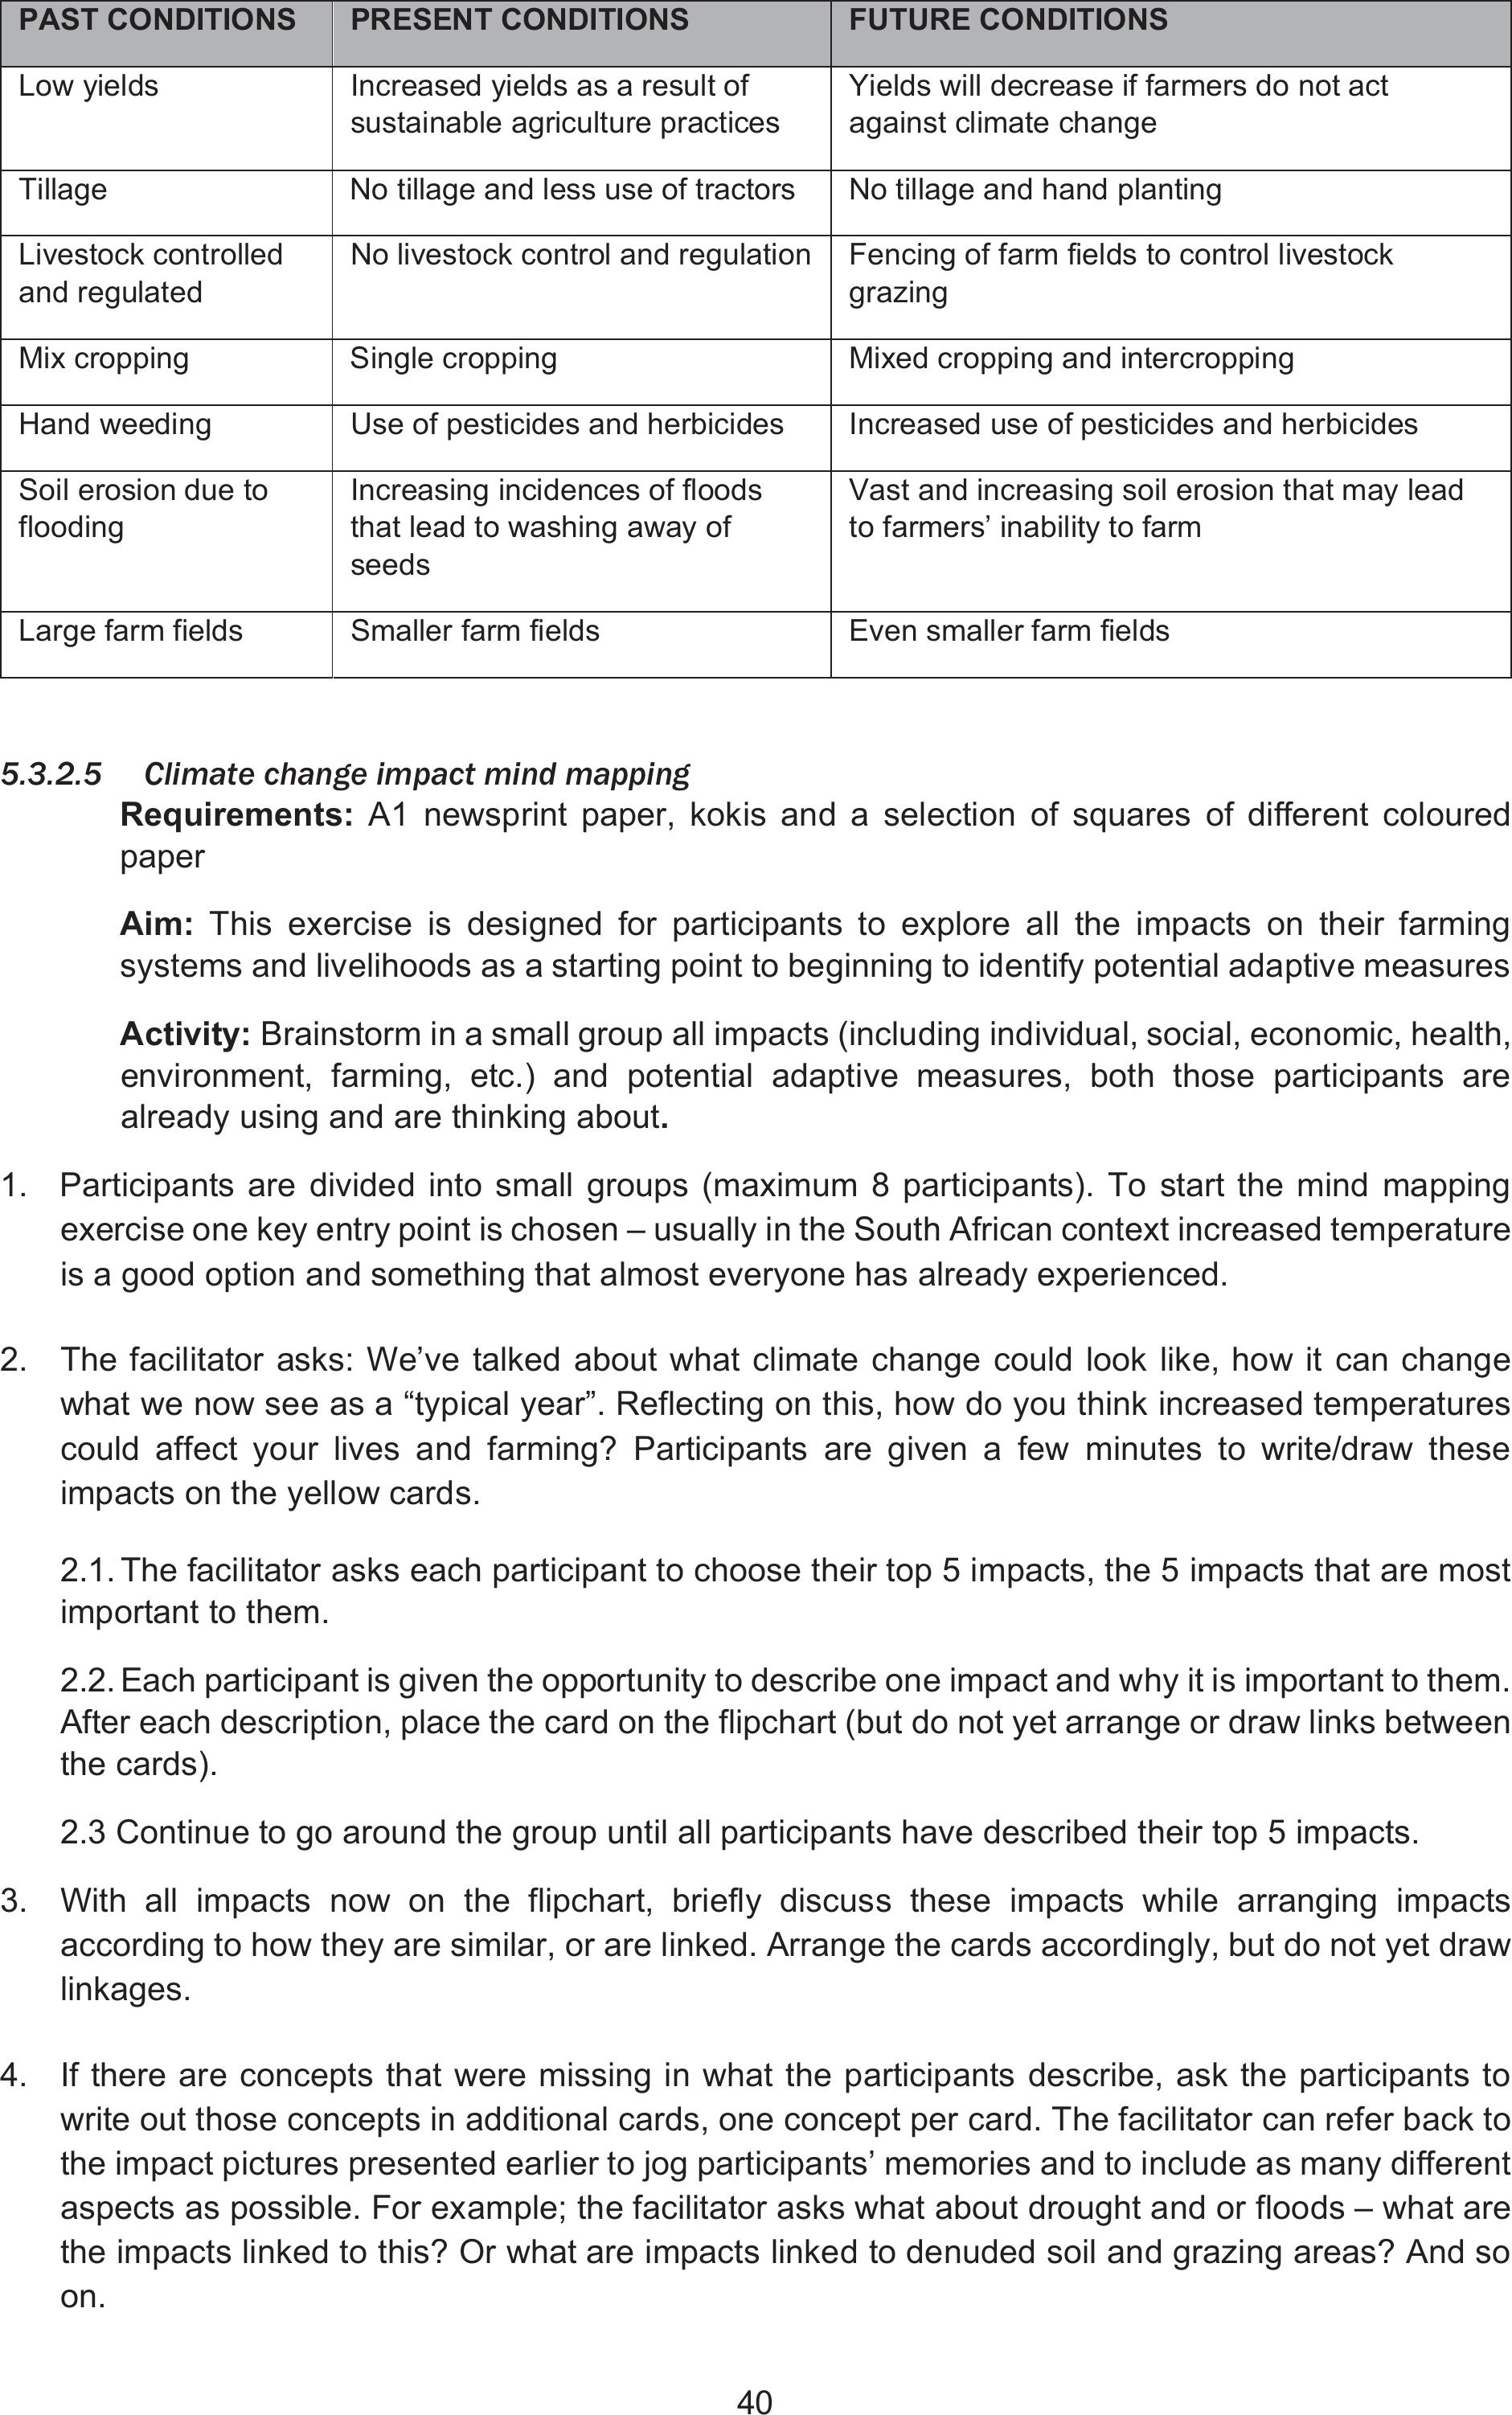
40
PAST CONDITIONS PRESENT CONDITIONS FUTURE CONDITIONS
Low yields Increased yields as a result of
sustainable agriculture practices
Yields will decrease if farmers do not act
against climate change
Tillage No tillage and less use of tractors No tillage and hand planting
Livestock controlled
and regulated
No livestock control and regulationFencing of farm fields to control livestock
grazing
Mix cropping Single cropping Mixed cropping and intercropping
Hand weedingUse of pesticides and herbicides Increased use of pesticides and herbicides
Soil erosion due to
flooding
Increasing incidences of floods
that lead to washing away of
seeds
Vast and increasing soil erosion that may lead
to farmers’ inability to farm
Large farm fields Smaller farm fields Even smaller farm fields
5.3.2.5Climate change impact mind mapping
Requirements: A1 newsprint paper, kokis and a selection of squares of different coloured
paper
Aim: This exercise is designed for participants to explore all the impacts on their farming
systems and livelihoods as a starting point to beginning to identify potential adaptive measures
Activity: Brainstorm in a small group all impacts (including individual, social, economic, health,
environment, farming, etc.) and potential adaptive measures, both those participants are
already using and are thinking about.
1. Participants are divided into small groups (maximum 8 participants). To start the mind mapping
exercise one key entry point is chosen – usually in the South African context increased temperature
is a good option and something that almost everyone has already experienced.
2. The facilitator asks: We’ve talked about what climate change could look like, how it can change
what we now see as a “typical year”. Reflecting on this, how do you think increased temperatures
could affect your lives and farming? Participants are given a few minutes to write/draw these
impacts on the yellow cards.
2.1. The facilitator asks each participant to choose their top 5 impacts, the 5 impacts that are most
important to them.
2.2. Each participant is given the opportunity to describe one impact and why it is important to them.
After each description, place the card on the flipchart (but do not yet arrange or draw links between
the cards).
2.3 Continue to go around the group until all participants have described their top 5 impacts.
3. With all impacts now on the flipchart, briefly discuss these impacts while arranging impacts
according to how they are similar, or are linked. Arrange the cards accordingly, but do not yet draw
linkages.
4. If there are concepts that were missing in what the participants describe, ask the participants to
write out those concepts in additional cards, one concept per card. The facilitator can refer back to
the impact pictures presented earlier to jog participants’ memories and to include as many different
aspects as possible. For example; the facilitator asks what about drought and or floods – what are
the impacts linked to this? Or what are impacts linked to denuded soil and grazing areas? And so
on.
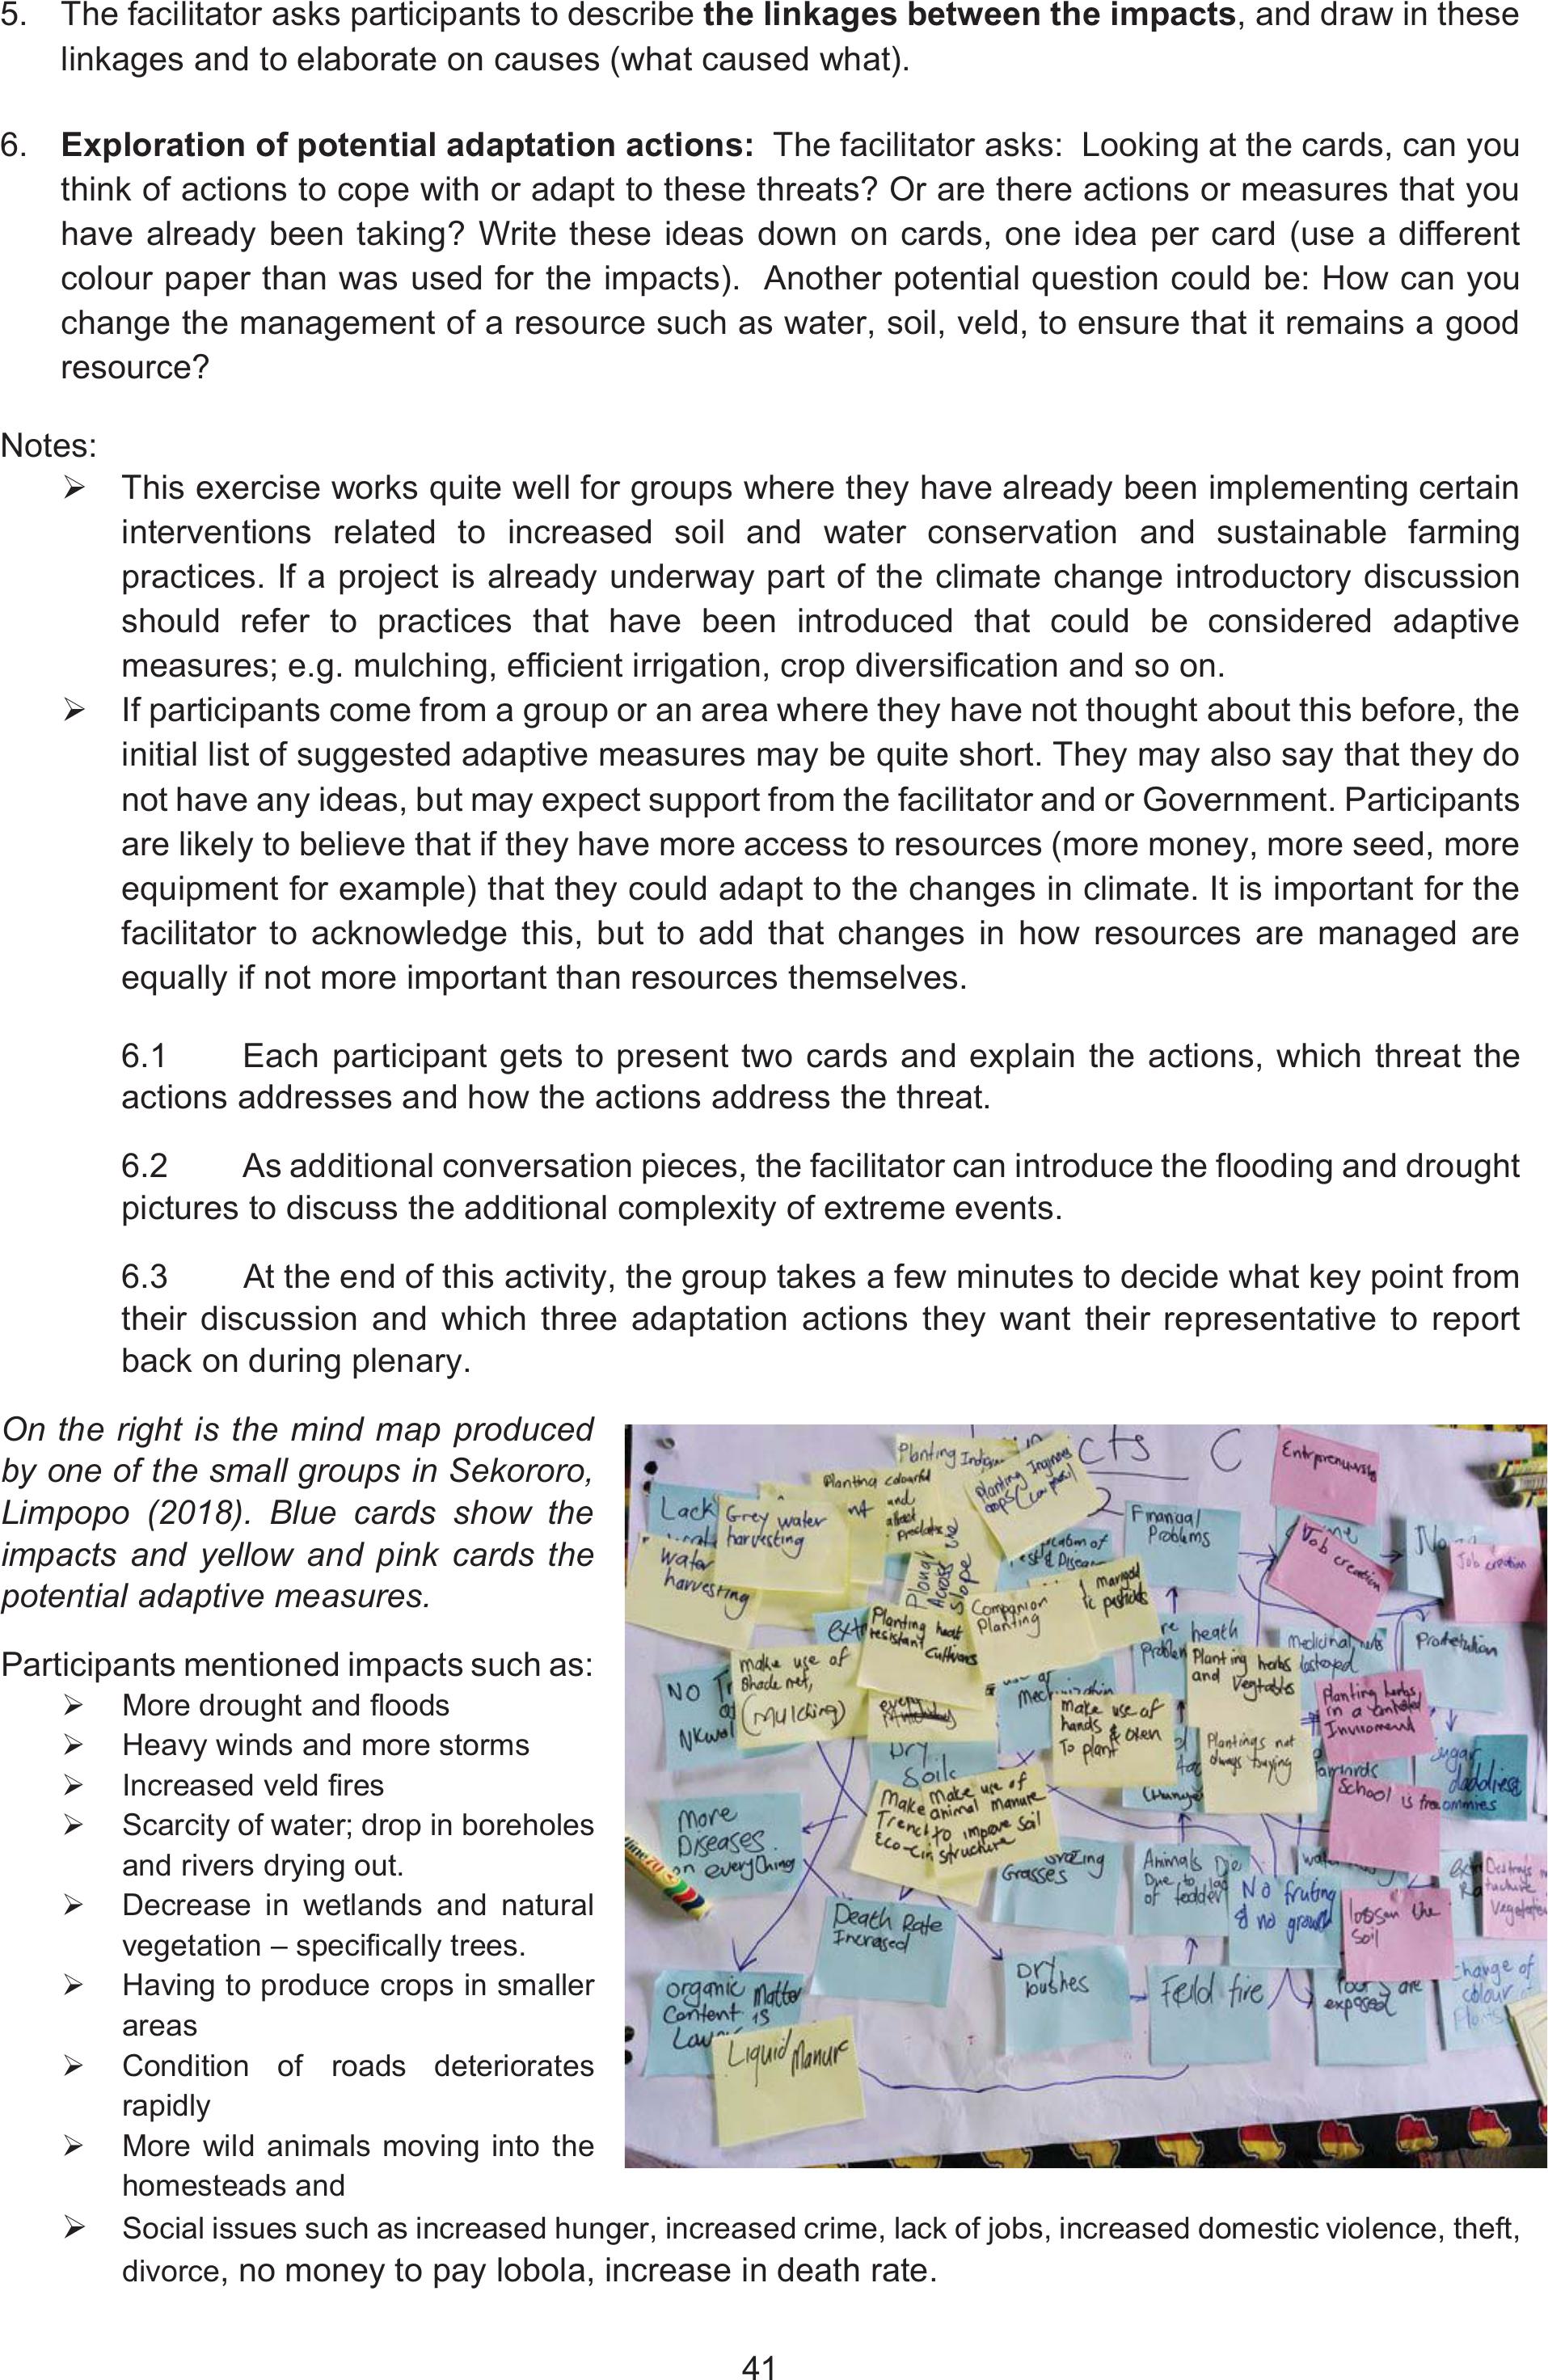
41
5. The facilitator asks participants to describe the linkages between the impacts, and draw in these
linkages and to elaborate on causes (what caused what).
6. Exploration of potential adaptation actions: The facilitator asks: Looking at the cards, can you
think of actions to cope with or adapt to these threats? Or are there actions or measures that you
have already been taking? Write these ideas down on cards, one idea per card (use a different
colour paper than was used for the impacts). Another potential question could be: How can you
change the management of a resource such as water, soil, veld, to ensure that it remains a good
resource?
Notes:
¾This exercise works quite well for groups where they have already been implementing certain
interventions related to increased soil and water conservation and sustainable farming
practices. If a project is already underway part of the climate change introductory discussion
should refer to practices that have been introduced that could be considered adaptive
measures; e.g. mulching, efficient irrigation, crop diversification and so on.
¾If participants come from a group or an area where they have not thought about this before, the
initial list of suggested adaptive measures may be quite short. They may also say that they do
not have any ideas, but may expect support from the facilitator and or Government. Participants
are likely to believe that if they have more access to resources (more money, more seed, more
equipment for example) that they could adapt to the changes in climate. It is important for the
facilitator to acknowledge this, but to add that changes in how resources are managed are
equally if not more important than resources themselves.
6.1 Each participant gets to present two cards and explain the actions, which threat the
actions addresses and how the actions address the threat.
6.2 As additional conversation pieces, the facilitator can introduce the flooding and drought
pictures to discuss the additional complexity of extreme events.
6.3 At the end of this activity, the group takes a few minutes to decide what key point from
their discussion and which three adaptation actions they want their representative to report
back on during plenary.
On the right is the mind map produced
by one of the small groups in Sekororo,
Limpopo (2018). Blue cards show the
impacts and yellow and pink cards the
potential adaptive measures.
Participants mentioned impacts such as:
¾More drought and floods
¾Heavy winds and more storms
¾Increased veld fires
¾Scarcity of water; drop in boreholes
and rivers drying out.
¾Decrease in wetlands and natural
vegetation – specifically trees.
¾Having to produce crops in smaller
areas
¾Condition of roads deteriorates
rapidly
¾More wild animals moving into the
homesteads and
¾Social issues such as increased hunger, increased crime, lack of jobs, increased domestic violence, theft,
divorce, no money to pay lobola, increase in death rate.
42
5
5.3.3
Household visits
This is part of day 2 of the 1st workshop. The idea is to do a bit of a transect walk through the village or
area to broadly ascertain from visual observation;
-General environmental conditions in the area
-Access to resources and infrastructure and
-Vulnerability of the people.
The household visits also provide an opportunity to conduct the baseline interviews (mentioned above)
and ascertain circumstances at household level.
In addition, these household visits are set up to showcase practices and local innovations that
participants are already undertaking. The ‘walkabouts’ are informal and conversations are recorded for
later summaries and photographs are taken to record the conditions in the area and the practices.
5.3.3.1Example of a walkabout with household visits in Sekororo, Limpopo (2017)
Summary of discussions around CRA practices from a group of 9 participants visiting 4-5 households
scattered across the village:
Practices we are already familiar with: Mulching trench beds, furrows and ridges, intercropping, planting
herbs, diversification (or different kinds of crops planted together), small dams, compost.
Further comments made by the group include:
¾Mulching is done, but is not so popular, because of lack of materials
¾Earth dams are dangerous for children
¾Rainwater harvesting tanks are expensive – we are using drip irrigation (2nd hand from
commercial farms)
¾Hybrid seeds are expensive and problematic as seed cannot be kept, even though they have
given very positive results.
Practices gleaned from community walkabout: Small earth dams, planting grass in eroded areas,
planting and keeping seed of old and traditional crops such as shallots, cowpeas, as well as indigenous
greens such as cleome, using kitchen scraps in shallow trenches, compost pits, banana circles,
management of mango trees by some pruning, planting green beans under shade of trees rather than
sugar beans as the latter does not pod well in the shade., protecting litchis from birds using netting.
Participants learnt about pollination processes for mangoes. They did not know about male and female
flowers. They also commented that ‘normally when we see brown patches on the mango leaves, we
did not think that this can affect the fruiting’. With the age of the trees, quality and quantity of fruit
deteriorates.
Above Left to right: Local innovations
1 small dam 2 shallots grown and seed kept 3 banana circles with compost4 furrows and ridges

43
5
5.3.4
Example of a CCA workshop1 process
A number of workshops were held across three provinces in 7 villages, working with around 200
participants in total and the results have been summarised to provide a ‘snapshot’ of climate change
impacts for these three provinces
Table 2: Summary of climate change impacts from CCA workshop 1, across three provinces (2017-2018)
Climate change impacts on livelihoods and farming
KZN EC Limpopo
Water Less water in the landscape;
streams and springs dry up,
borehole run dry, soils dry
out quickly after rain
Less water in the landscape;
streams and springs dry up,
borehole run dry, soils dry
out quickly after rain
Less water in the landscape;
streams and springs dry up,
borehole run dry, soils dry out
quickly after rain
Dams dry up Dams dry up Dams dry up
Municipal water supply
becoming more unreliable
Municipal water supply
becoming more unreliable
Municipal water supply
becoming more unreliable;
Need to buy water for
household use – now
sometimes for more than 6
months of the year
RWH storage only enough for
household use.
Soil More erosion More erosion More erosion
Soils becoming more
compacted and infertile
Soils becoming more
compacted and infertile
Soils becoming more
compacted and infertile
Soils too hot to sustain plant
growth
Cropping Timing for planting has
changed – later
Timing for planting has
changed – later
Can no longer plant dryland
maize
All cropping now requires
irrigation – even crops such
as sweet potato
Drought tolerant crops such
as sorghum and millet grow–
but severe bird damage
Heat damage to crops Heat damage to crops Heat damage to crops
Reduced germination and
growth
Reduced germination and
growth
Reduced germination and
growth
Seeding of legumes
becoming unreliable
Seeding of legumes
becoming unreliable
Seeding of legumes becoming
unreliable
Lower yieldsLower yieldsLower yields
Winter vegetables don’t do
well – stress induced bolting
and lack of growth
More pests and diseases More pests and diseasesMore pests and diseases
Loss of indigenous seed
stocks
Loss of indigenous seed
stocks
Livestock Less grazing; not enough to
see cattle through winter
Less grazing, not enough to
see cattle through winter
Less grazing; not enough to
see cattle through winter
More disease in cattle and
heat stress symptoms
More disease in cattle and
heat stress symptoms
More disease in cattle and
heat stress symptoms
Fewer calves Fewer calves Fewer calves
More deaths More deaths More deaths
Natural
resources
Fewer trees; too much
cutting for firewood
Fewer trees, too much
cutting for firewood
Fewer trees; too much cutting
for firewood
Decrease in wild animals
and indigenous plants
Decrease in wild animals
and indigenous plants
Decrease in wild animals and
indigenous plants
Increased crop damage from
wild animals such as birds
and monkeys
Increased crop damage from
wild animals such as birds
and monkeys
Increased crop damage from
wild animals such as birds
and monkeys
Availability of indigenous
vegetables has decreased
No longer able to harvest any
resources due to scarcity
Increased population puts
pressure on resources
Social More diseases More diseasesMore diseases
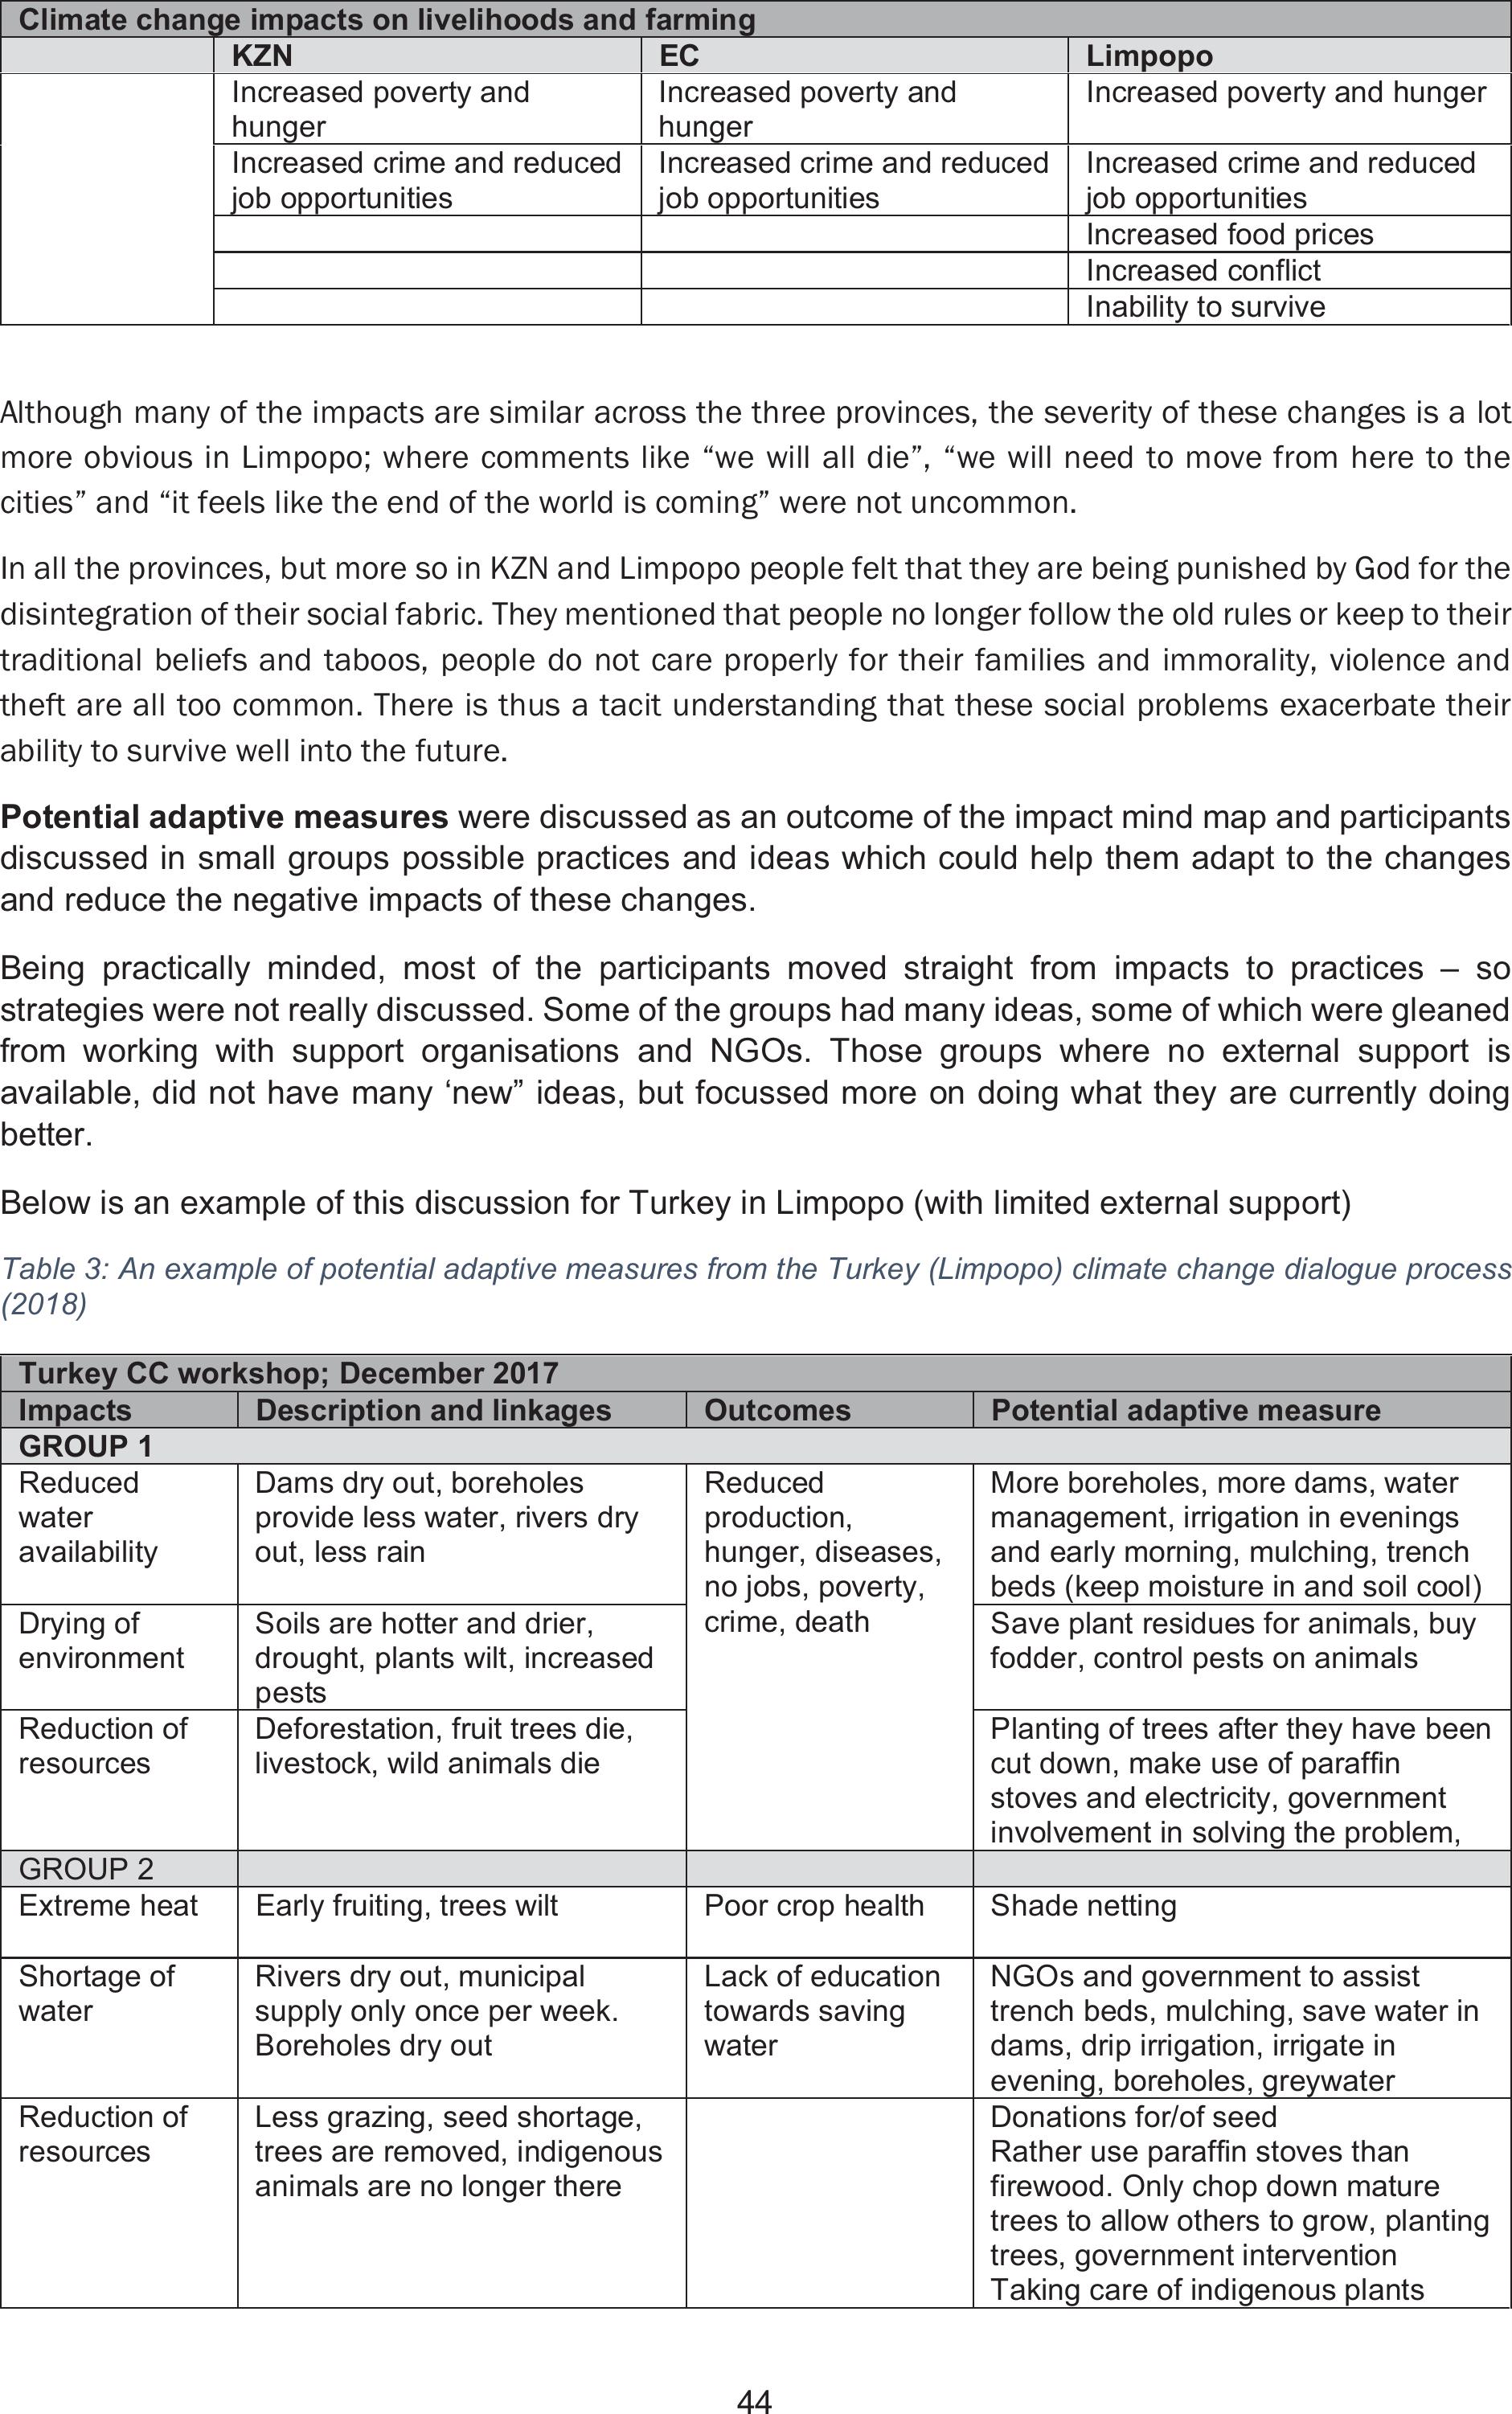
44
Climate change impacts on livelihoods and farming
KZN EC Limpopo
Increased poverty and
hunger
Increased poverty and
hunger
Increased poverty and hunger
Increased crime and reduced
job opportunities
Increased crime and reduced
job opportunities
Increased crime and reduced
job opportunities
Increasedfood prices
Increased conflict
Inability to survive
Although many of the impacts are similar across the three provinces, the severity of these changes is a lot
more obvious in Limpopo; where comments like “we will all die”, “we will need to move from here to the
cities” and “it feels like the end of the world is coming” were not uncommon.
In all the provinces, but more so in KZN and Limpopo people felt that they are being punished by God for the
disintegration of their social fabric. They mentioned that people nolonger follow the old rules or keep to their
traditional beliefs and taboos, people do not care properly for their families and immorality, violence and
theft are all too common. There is thus a tacit understanding that these social problems exacerbate their
ability to survive well into the future.
Potential adaptive measures were discussed as an outcome of the impact mind map and participants
discussed in small groups possible practices and ideas which could help them adapt to the changes
and reduce the negative impacts of these changes.
Being practically minded, most of the participants moved straight from impacts to practices – so
strategies were not really discussed. Some of the groups had many ideas, some of which were gleaned
from working with support organisations and NGOs. Those groups where no external support is
available, did not have many ‘new” ideas, but focussed more on doing what they are currently doing
better.
Below is an example of this discussion for Turkey in Limpopo (with limited external support)
Table 3: An example of potential adaptive measures from the Turkey (Limpopo) climate change dialogue process
(2018)
Turkey CC workshop; December 2017
ImpactsDescription and linkages OutcomesPotential adaptive measure
GROUP 1
Reduced
water
availability
Dams dry out, boreholes
provide less water, rivers dry
out, less rain
Reduced
production,
hunger, diseases,
no jobs, poverty,
crime, death
More boreholes, more dams, water
management, irrigation in evenings
and early morning, mulching, trench
beds (keep moisture in and soil cool)
Drying of
environment
Soils are hotter and drier,
drought, plants wilt, increased
pests
Save plant residues for animals, buy
fodder, control pests on animals
Reduction of
resources
Deforestation, fruit trees die,
livestock, wild animals die
Planting of trees after they have been
cut down, make use of paraffin
stoves and electricity, government
involvement in solving the problem,
GROUP 2
Extreme heatEarly fruiting, trees wiltPoor crop health Shade netting
Shortage of
water
Rivers dry out, municipal
supply only once per week.
Boreholes dry out
Lack of education
towards saving
water
NGOs and government to assist
trench beds, mulching, save water in
dams, drip irrigation, irrigate in
evening, boreholes, greywater
Reduction of
resources
Less grazing, seed shortage,
trees are removed, indigenous
animals are no longer there
Donations for/of seed
Rather use paraffin stoves than
firewood. Only chop down mature
trees to allow others to grow, planting
trees, government intervention
Taking care of indigenous plants

45
Turkey CC workshop; December 2017
ImpactsDescription and linkages OutcomesPotential adaptive measure
Plant fodder for livestock
Soils Poor cultivation practices, soil
erosion, dry soils, sandy soils
Using crop residues and manure
Social
repercussions
Less or no food, health
problems, no jobs
Burning of buses,
divorce,
separation of
families, poverty,
crime
Getting access to health care,
parents must work
Shortage of
implements
Setting up cooperatives for
government support, use animal
drawn traction – oxen and donkeys,
improvise, make our own tools, make
use of hand hoes
When this table is compared to a community who have been involved in a support programme, such a
Sekororo where Lima RDF have been running a Food security and livelihoods improvement
programme, the differences in suggestions clearly indicate some ideas gleaned from the facilitating
organisation
Table 4: An example of potential adaptive measures from the Sekororo (Limpopo) climate change dialogue process
Sekororo; CC workshop November 2017
ImpactsDescription and
linkages
Outcomes Potential adaptive measure
GROUP 1
Heat Plants wilt and die Lack of grazing, livestock
ide
Mulching, controlled grazing, reduce
stock, save/store fodder – leaves and
grasses for dry season
Water
shortages
Rivers drying out,
boreholes drying out
Greywater, purification using moringa
seeds, water storage for dry season
Soil Soil erosion (more
dongas), soil fertility
decreasing,
Deterioration of roads –
making access difficult
Planting in tyres, keyhole beds, tower
gardens,
Crop
production,
resources
Lower yields, more
pests, veld fires,
reduction of indigenous
trees
Common pests:
cutworms, millipedes,
centipedes
Natural pest and disease control,
mulching (but this can increase some
pests), inter cropping, crop rotation,
use of multi-purpose plants (e.g.
marigolds)
Use the wild cucumber (yellow
inside) dry, grind and spray on crops
to control nematodes and soil pests
Manage cutting of trees and plant
more
Plant in tunnels
LivestockLack of grazing, more
diseases, more
damage of crops
Livestock decreasing, not
healthy
Control grazing,
Social
repercussions
Poverty, diseases,
hunger
Crime, murder and theft,
domestic violence,
divorce, increased death
rate, no money to pay
lobola
GROUP 2
Extreme heatVeld fires Use of tunnels, plant heat resistant
cultivars, irrigate in early mornings
and evenings
Lack of water No grazing, drying of
natural vegetation and
bushes, wilting of
plants, trees do not
fruit, extreme rains
destroy infrastructure,
Food shortages, animals
die due to lack of
grazing,
Water harvesting, earth dams, grey
water and management of existing
water, diversion furrows
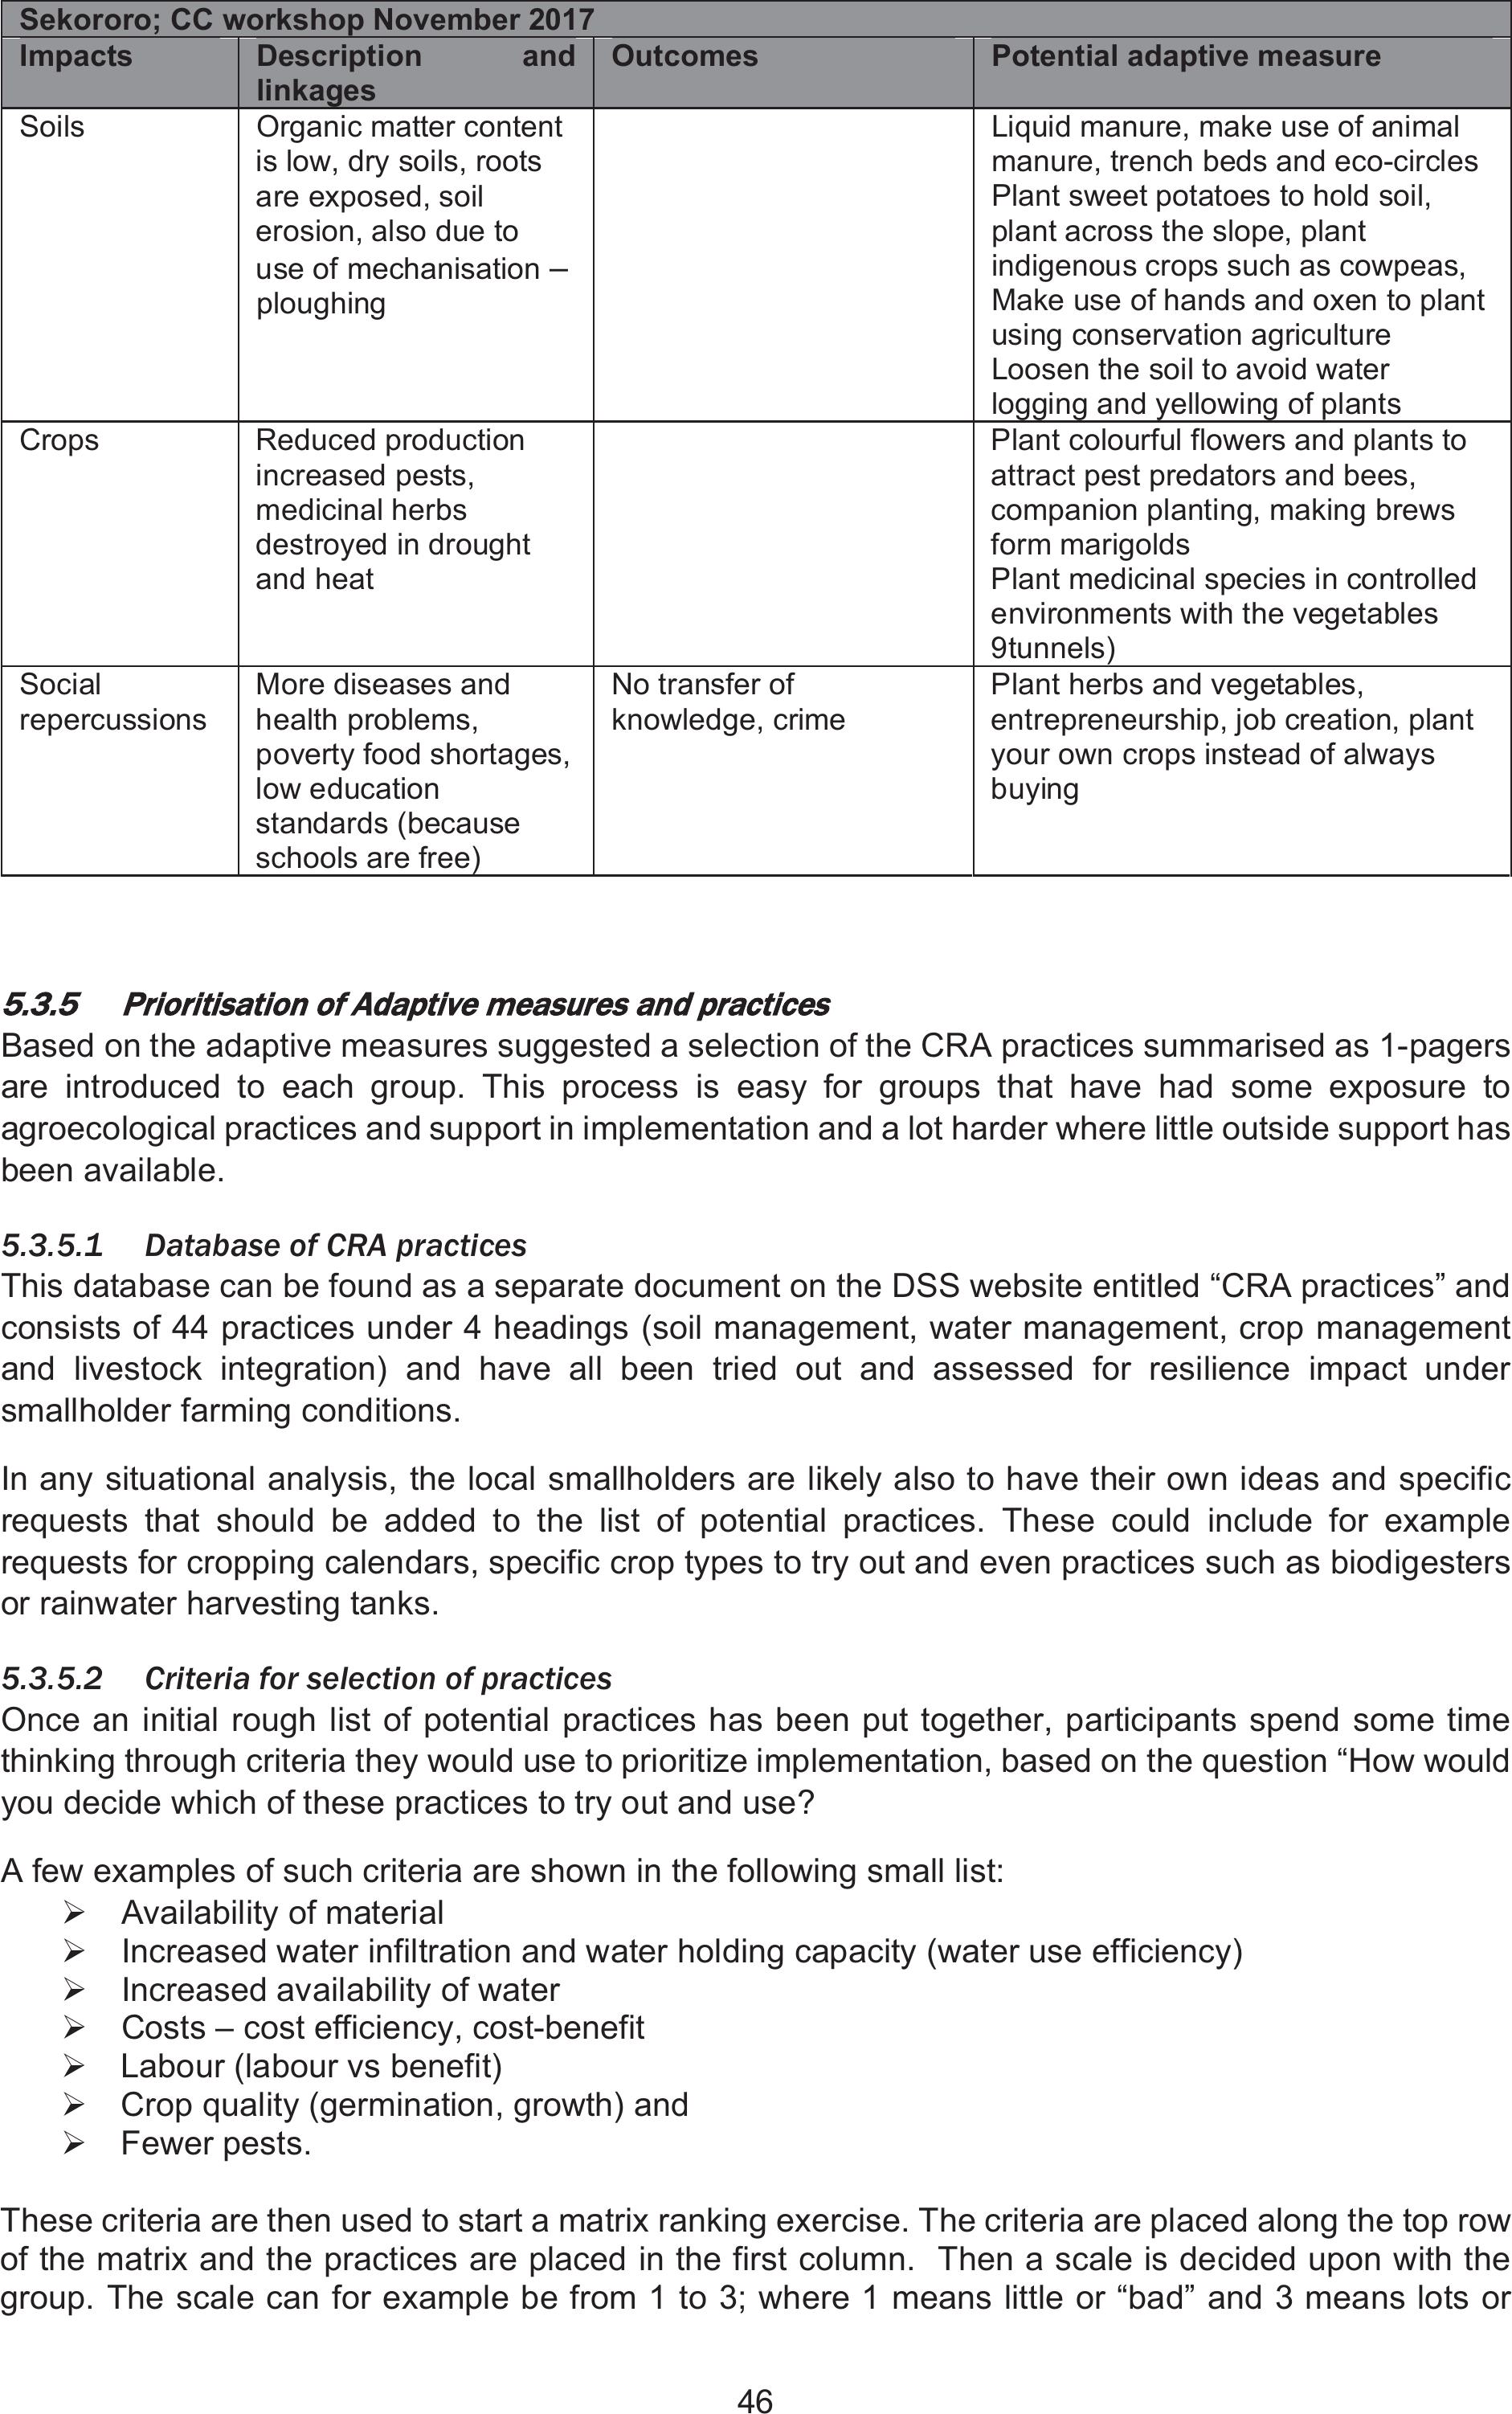
46
Sekororo; CC workshop November 2017
ImpactsDescription and
linkages
Outcomes Potential adaptive measure
Soils Organicmatter content
is low, dry soils, roots
are exposed, soil
erosion, also due to
use of mechanisation –
ploughing
Liquid manure, make use of animal
manure, trench beds and eco-circles
Plant sweet potatoes to hold soil,
plant across the slope, plant
indigenous crops such as cowpeas,
Make use of hands and oxen to plant
using conservation agriculture
Loosen the soil to avoid water
logging and yellowing of plants
Crops Reduced production
increased pests,
medicinal herbs
destroyed in drought
and heat
Plant colourful flowers and plants to
attract pest predators and bees,
companion planting, making brews
form marigolds
Plant medicinal species in controlled
environments with the vegetables
9tunnels)
Social
repercussions
More diseases and
health problems,
poverty food shortages,
low education
standards (because
schools are free)
No transfer of
knowledge, crime
Plant herbs and vegetables,
entrepreneurship, job creation, plant
your own crops instead of always
buying
5.3.5
Prioritisation of Adaptive measures and practices
Based on the adaptive measures suggested a selection of the CRA practices summarised as 1-pagers
are introduced to each group. This process is easy for groups that have had some exposure to
agroecological practices and support in implementation and a lot harder where little outside support has
been available.
5.3.5.1Database of CRA practices
This database can be found as a separate document on the DSS website entitled “CRA practices” and
consists of 44 practices under 4 headings (soil management, water management, crop management
and livestock integration) and have all been tried out and assessed for resilience impact under
smallholder farming conditions.
In any situational analysis, the local smallholders are likely also to have their own ideas and specific
requests that should be added to the list of potential practices. These could include for example
requests for cropping calendars, specific crop types to try out and even practices such as biodigesters
or rainwater harvesting tanks.
5.3.5.2Criteria for selection of practices
Once an initial rough list of potential practices has been put together, participants spend some time
thinking through criteria they would use to prioritize implementation, based on the question “How would
you decide which of these practices to try out and use?
A few examples of such criteria are shown in the following small list:
¾Availability of material
¾Increased water infiltration and water holding capacity (water use efficiency)
¾Increased availability of water
¾Costs – cost efficiency, cost-benefit
¾Labour (labour vs benefit)
¾Crop quality (germination, growth) and
¾ Fewer pests.
These criteria are then used to start a matrix ranking exercise. The criteria are placed along the top row
of the matrix and the practices are placed in the first column. Then a scale is decided upon with the
group. The scale can for example be from 1 to 3; where 1 means little or “bad” and 3 means lots or
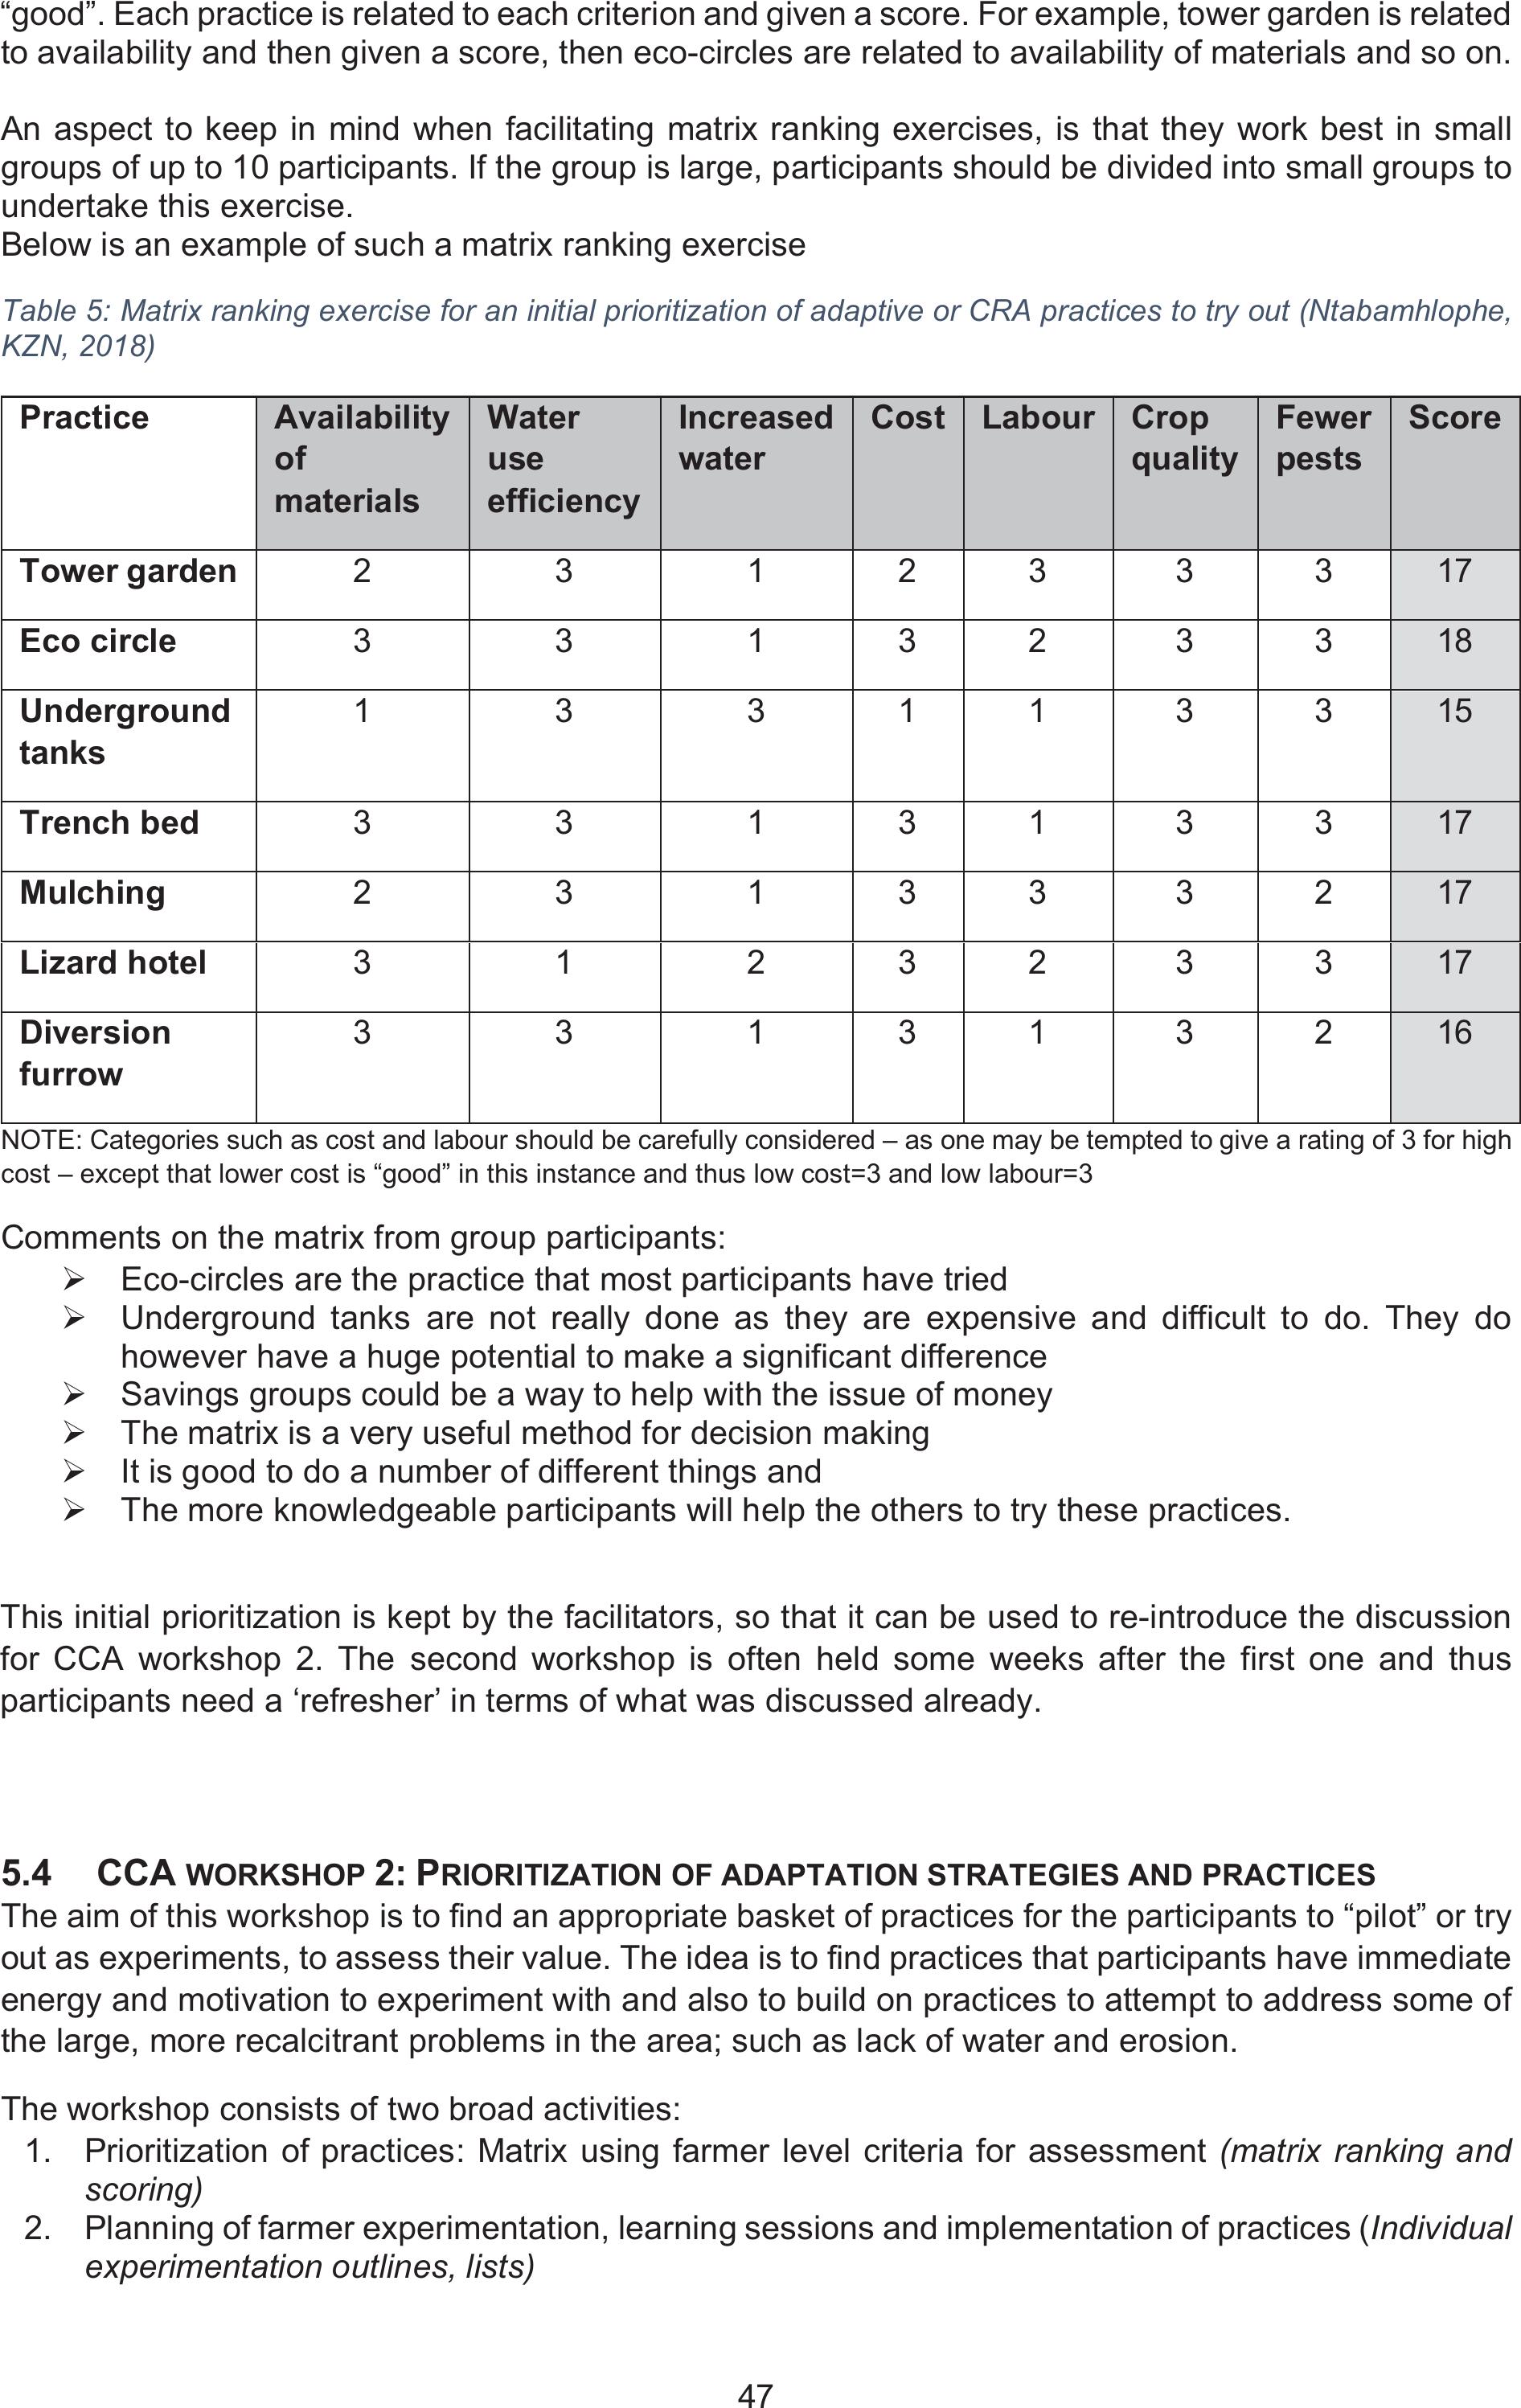
47
“good”. Each practice is related to each criterion and given a score. For example, tower garden is related
to availability and then given a score, then eco-circles are related to availability of materials and so on.
An aspect to keep in mind when facilitating matrix ranking exercises, is that they work best in small
groups of up to 10 participants. If the group is large, participants should be divided into small groups to
undertake this exercise.
Below is an example of such a matrix ranking exercise
Table 5: Matrix ranking exercise for an initial prioritization of adaptive or CRA practices to try out (Ntabamhlophe,
KZN, 2018)
PracticeAvailability
of
materials
Water
use
efficiency
Increased
water
Cost Labour Crop
quality
Fewer
pests
Score
Tower garden 2 3 1 2 3 3 3 17
Eco circle 3 3 1 3 2 3 3 18
Underground
tanks
1 3 3 1 1 3 3 15
Trench bed3 3 1 3 1 3 3 17
Mulching2 3 1 3 3 3 2 17
Lizard hotel 3 1 2 3 2 3 3 17
Diversion
furrow
3 3 1 3 1 3 2 16
NOTE: Categories such as cost and labour should be carefully considered – as one may be tempted to give a rating of 3 for high
cost – except that lower cost is “good” in this instance and thus low cost=3 and low labour=3
Comments on the matrix from group participants:
¾Eco-circles are the practice that most participants have tried
¾Underground tanks are not really done as they are expensive and difficult to do. They do
however have a huge potential to make a significant difference
¾Savings groups could be a way to help with the issue of money
¾The matrix is a very useful method for decision making
¾It is good to do a number of different things and
¾The more knowledgeable participants will help the others to try these practices.
This initial prioritization is kept by the facilitators, so that it can be used to re-introduce the discussion
for CCA workshop 2. The second workshop is often held some weeks after the first one and thus
participants need a ‘refresher’ in terms of what was discussed already.
5.4 CCA WORKSHOP 2:PRIORITIZATION OF ADAPTATION STRATEGIES AND PRACTICES
The aim of this workshop is to find an appropriate basket of practices for the participants to “pilot” or try
out as experiments, to assess their value. The idea is to find practices that participants have immediate
energy and motivation to experiment with and also to build on practices to attempt to address some of
the large, more recalcitrant problems in the area; such as lack of water and erosion.
The workshop consists of two broad activities:
1. Prioritization of practices: Matrix using farmer level criteria for assessment (matrix ranking and
scoring)
2. Planning of farmer experimentation, learning sessions and implementation of practices (Individual
experimentation outlines, lists)

48
5
5.4.1
Outline of CCA workshop 2
Community level climate change adaptation: Prioritisation and planning workshop outline
DAY 1
Time Activity ProcessNotes Materials Who
9:00am Introduction
9:00-
10:00am
Community and
team
introductions
In pairs, take 5 minutes to
talk to each other. Each
person names one
practice they know or are
doing that is good for CCA
– a CRA practice. OR one
they would most like to try
out.
Practices to be
summarised on a
flip chart.
Attendance
register–
with column
for CRA
practices – in
English and
Zulu/Pedi.
Name tags;
stickers, kokis
Preparation:
Facilitation:
Recording:
SAEON weather
predictions
Presentation and group
discussion on the SAEON
weather prediction maps
that are produced
quarterly to ascertain
usefulness to farmers as
a decision-making tool
Copies of the
temperature and
rainfall maps
produced for
each small group
Preparation:
Facilitation:
Recording:
Purpose of the
day
Introduction of the
organisation/s and
purpose of this workshop
– Review of
understanding of CC,
Impacts and adaptive
measures. Introduction to
CRA principles
Summarise from
report of 1st
workshop – Use
the 5 categories
– summarise
measures under
each. Use two
PP slides
attached
Flip stand,
newsprint,
kokis, camera
– and one
person to
undertake to
take photos
throughout
the day. Extra
batteries for
camera and
sim card
Preparation:
Facilitation:
Recording:
10:00am Prioritization of practices
10:00 to
11:00am
Review practices
mentioned in
detail – both
community level
and presented
from 1pgers
Divide into small groups –
for prioritization matrix;
Use five categories (Nat
res, soil, water, crop,
livestock). Supply with
cards where all prioritized
practises are written.
They then prioritize these
in a list under each
category, based on what
to try first, second and so
on – make sure the
criteria used for these
choices are recorded.
Come back in plenary,
present and get overall
choices summarised for
all small groups
See Community
level
prioritization of
practices Excel
worksheet
Flipchart
paper, kokis,
cards with all
prioritized
practices
written out,
prestik
Preparation:
Facilitation:
Recording:
11:00-
11:30am
TEA Fruit (apples, oranges, biscuits, juice and water, paper cups
(lots) and plates… Generous helpings – and lots of juice if it is
hot. Find someone to be in charge of food and refreshments,
while the rest of the workshop continues
Preparation:
11:30 Demonstrations and learning
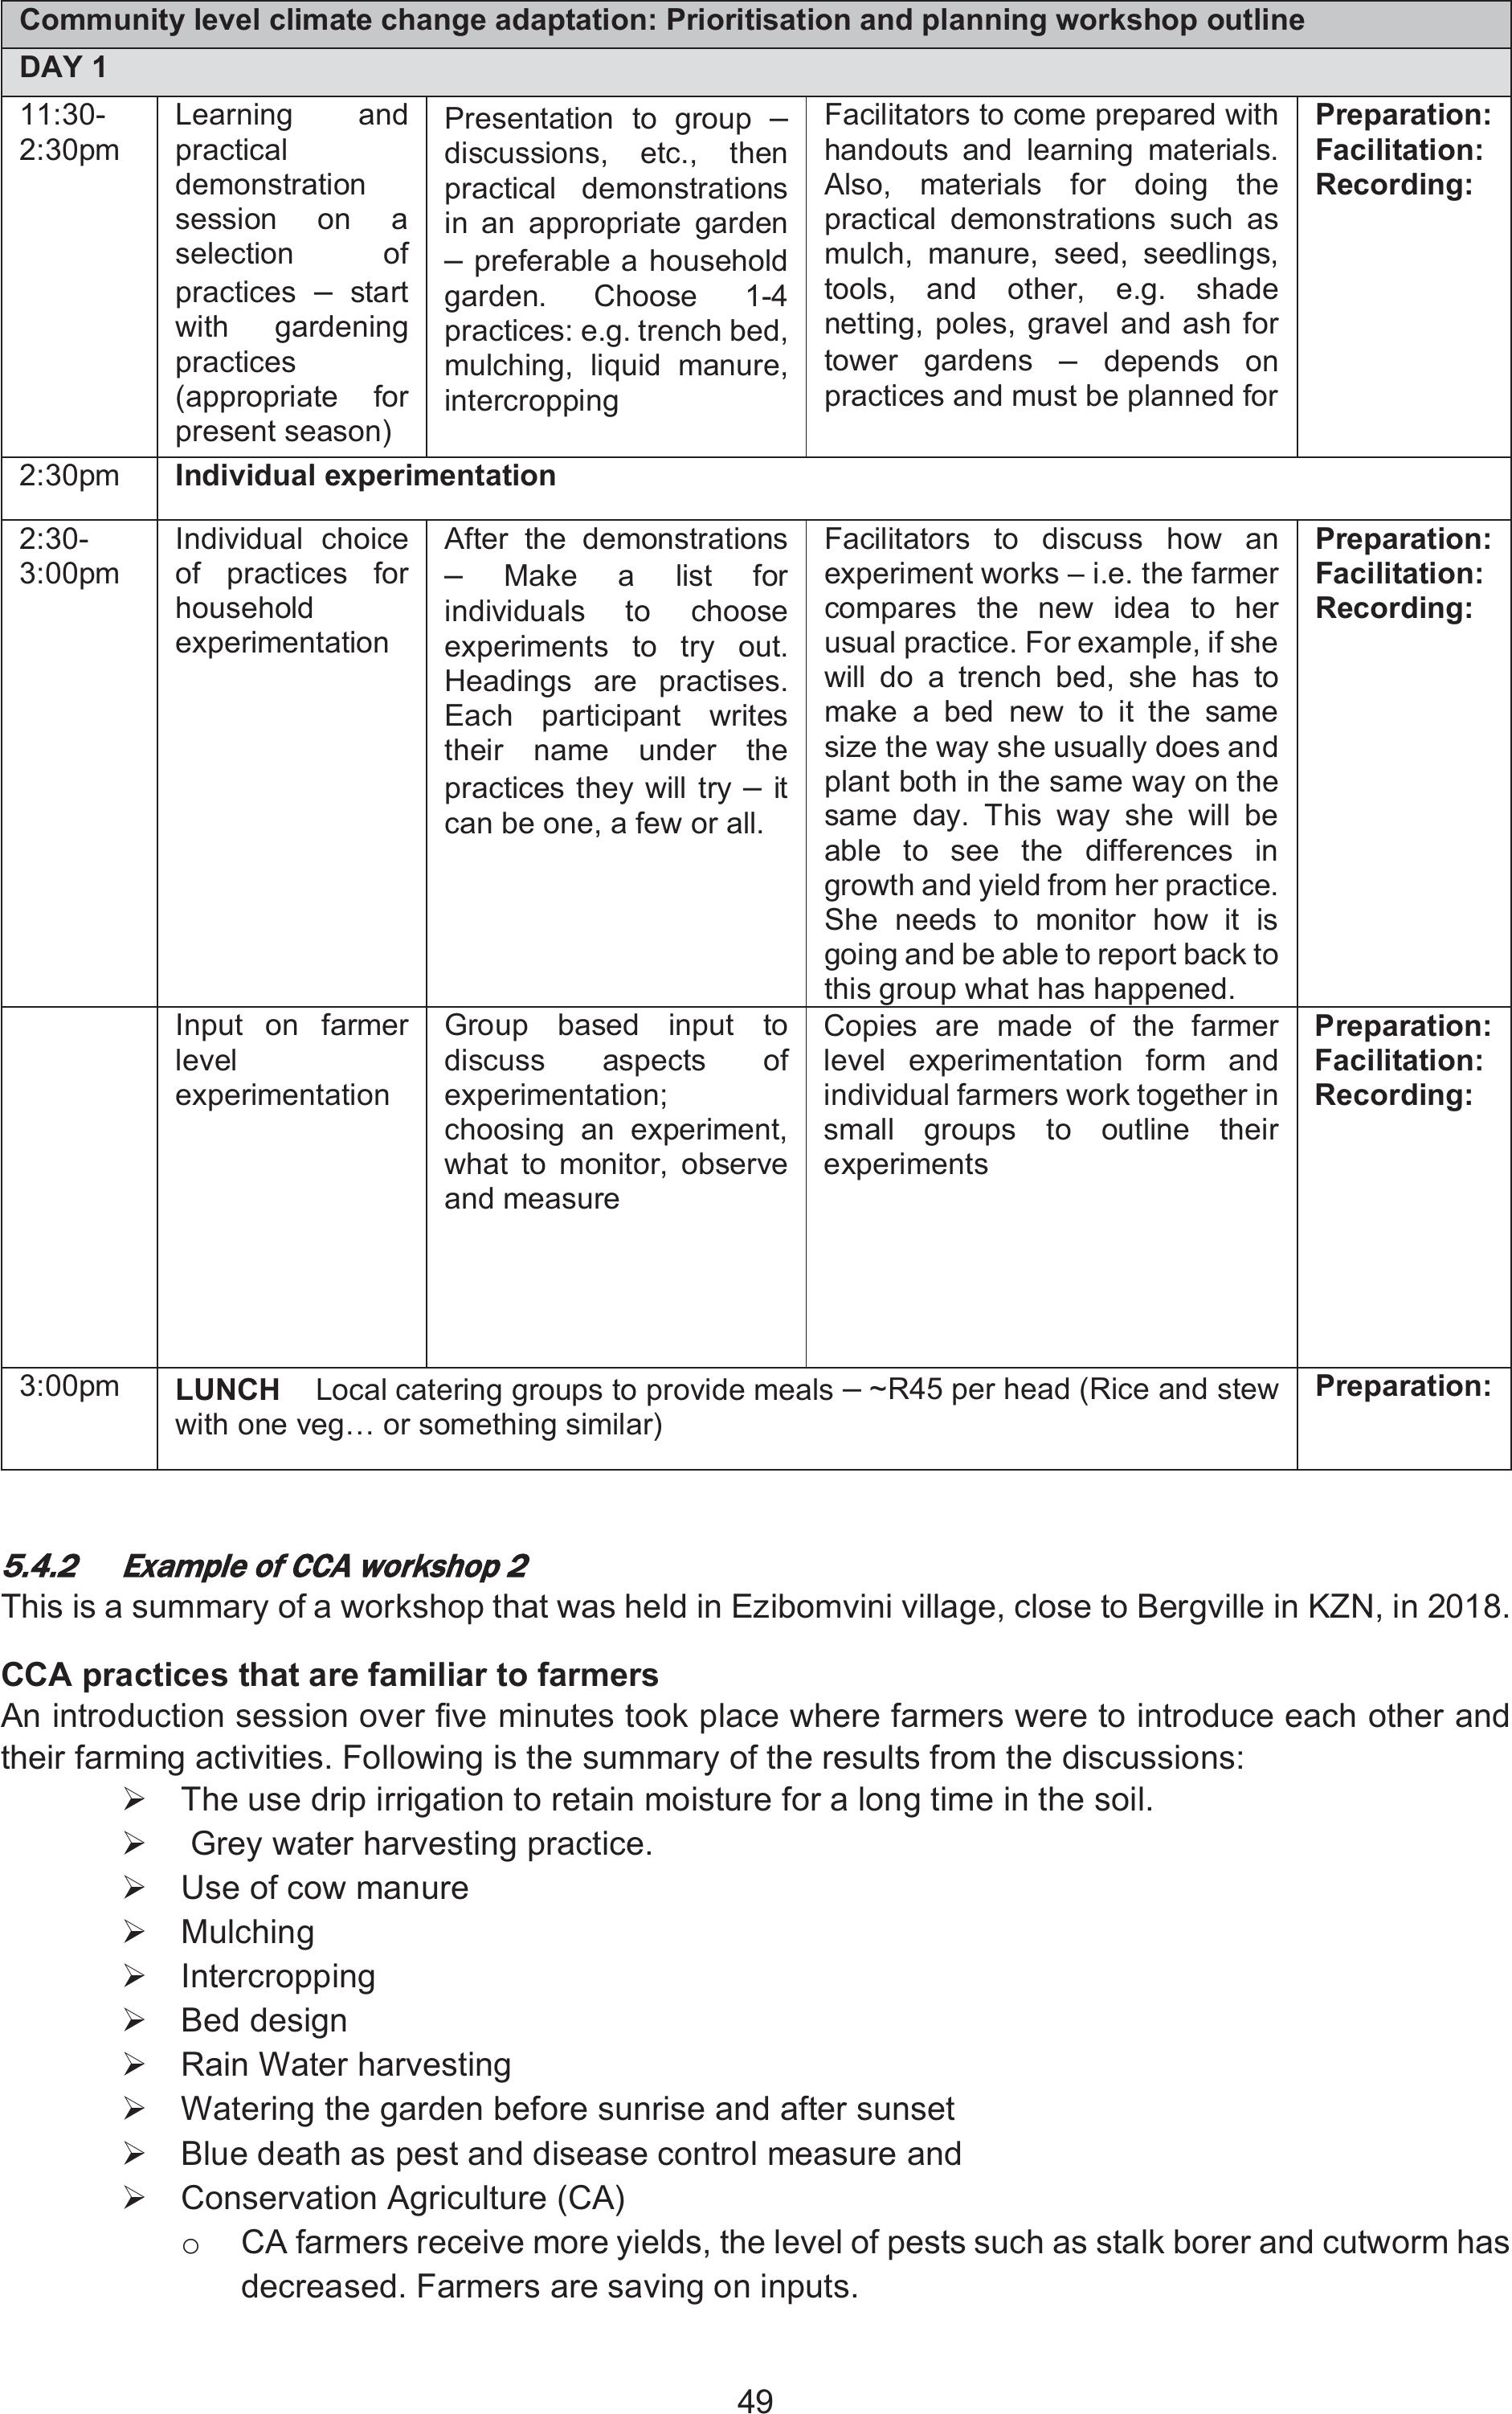
49
Community level climate change adaptation: Prioritisation and planning workshop outline
DAY 1
11:30-
2:30pm
Learning and
practical
demonstration
session on a
selection of
practices – start
with gardening
practices
(appropriate for
present season)
Presentation to group –
discussions, etc., then
practical demonstrations
in an appropriate garden
– preferable a household
garden. Choose 1-4
practices: e.g. trench bed,
mulching, liquid manure,
intercropping
Facilitators to come prepared with
handouts and learning materials.
Also, materials for doing the
practical demonstrations such as
mulch, manure, seed, seedlings,
tools, and other, e.g. shade
netting, poles, gravel and ash for
tower gardens – depends on
practices and must be planned for
Preparation:
Facilitation:
Recording:
2:30pm Individual experimentation
2:30-
3:00pm
Individual choice
of practices for
household
experimentation
After the demonstrations
– Make a list for
individuals to choose
experiments to try out.
Headings are practises.
Each participant writes
their name under the
practices they will try – it
can be one, a few or all.
Facilitators to discuss how an
experiment works – i.e. the farmer
compares the new idea to her
usual practice. For example, if she
will do a trench bed, she has to
make a bed new to it the same
size the way she usually does and
plant both in the same way on the
same day. This way she will be
able to see the differences in
growth and yield from her practice.
She needs to monitor how it is
going and be able to report back to
this group what has happened.
Preparation:
Facilitation:
Recording:
Input on farmer
level
experimentation
Group based input to
discuss aspects of
experimentation;
choosing an experiment,
what to monitor, observe
and measure
Copies are made of the farmer
level experimentation form and
individual farmers work together in
small groups to outline their
experiments
Preparation:
Facilitation:
Recording:
3:00pm LUNCH Local catering groups to provide meals – ~R45 per head (Rice and stew
with one veg… or something similar)
Preparation:
5
5.4.2
Example of CCA workshop 2
This is a summary of a workshop that was held in Ezibomvini village, close to Bergville in KZN, in 2018.
CCA practices that are familiar to farmers
An introduction session over five minutes took place where farmers were to introduce each other and
their farming activities. Following is the summary of the results from the discussions:
¾The use drip irrigation to retain moisture for a long time in the soil.
¾ Grey water harvesting practice.
¾Use of cow manure
¾ Mulching
¾ Intercropping
¾ Bed design
¾Rain Water harvesting
¾Watering the garden before sunrise and after sunset
¾Blue death as pest and disease control measure and
¾ Conservation Agriculture (CA)
oCA farmers receive more yields, the level of pests such as stalk borer and cutworm has
decreased. Farmers are saving on inputs.
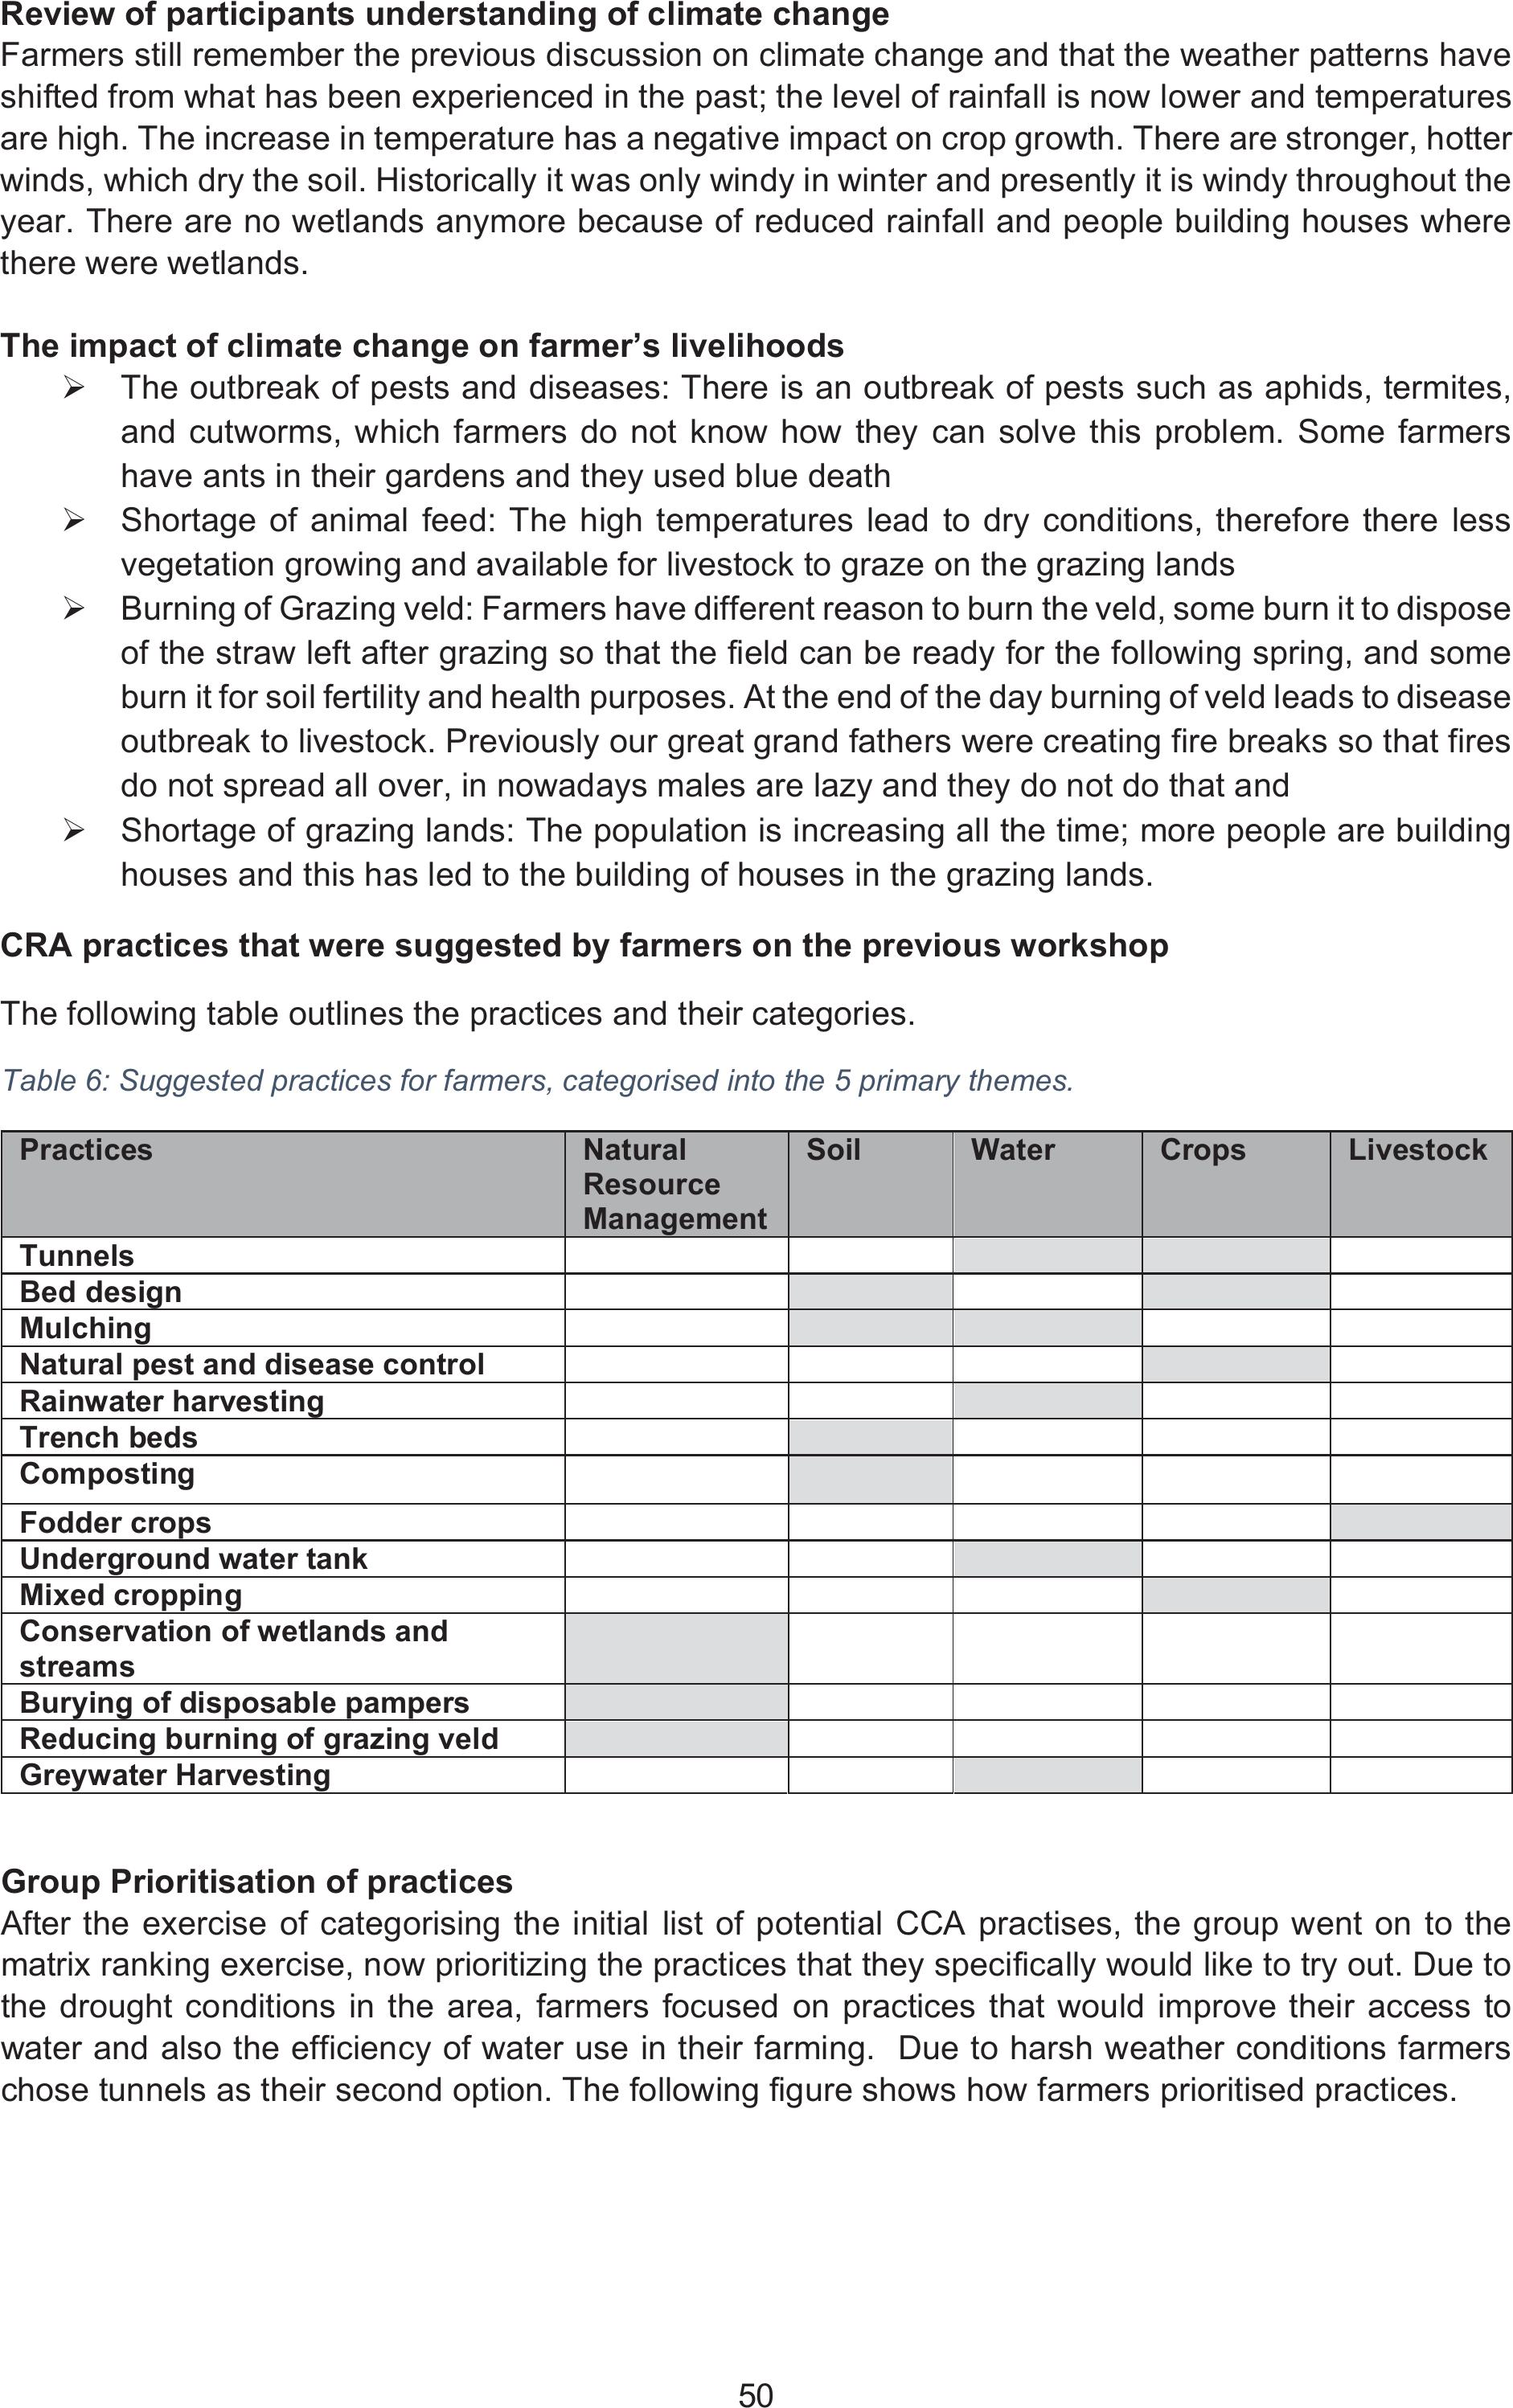
50
Review of participants understanding of climate change
Farmers still remember the previous discussion on climate change and that the weather patterns have
shifted from what has been experienced in the past; the level of rainfall is now lower and temperatures
are high. The increase in temperature has a negative impact on crop growth. There are stronger, hotter
winds, which dry the soil. Historically it was only windy in winter and presently it is windy throughout the
year. There are no wetlands anymore because of reduced rainfall and people building houses where
there were wetlands.
The impact of climate change on farmer’s livelihoods
¾The outbreak of pests and diseases: There is an outbreak of pests such as aphids, termites,
and cutworms, which farmers do not know how they can solve this problem. Some farmers
have ants in their gardens and they used blue death
¾Shortage of animal feed: The high temperatures lead to dry conditions, therefore there less
vegetation growing and available for livestock to graze on the grazing lands
¾Burning of Grazing veld: Farmers have different reason to burn the veld, some burn it to dispose
of the straw left after grazing so that the field can be ready for the following spring, and some
burn it for soil fertility and health purposes. At the end of the day burning of veld leads to disease
outbreak to livestock. Previously our great grand fathers were creating fire breaks so that fires
do not spread all over, in nowadays males are lazy and they do not do that and
¾Shortage of grazing lands: The population is increasing all the time; more people are building
houses and this has led to the building of houses in the grazing lands.
CRA practices that were suggested by farmers on the previous workshop
The following table outlines the practices and their categories.
Table 6: Suggested practices for farmers, categorised into the 5 primary themes.
Practices Natural
Resource
Management
Soil Water Crops Livestock
Tunnels
Bed design
Mulching
Natural pest and disease control
Rainwater harvesting
Trench beds
Composting
Fodder crops
Underground water tank
Mixed cropping
Conservation of wetlands and
streams
Burying of disposable pampers
Reducing burning of grazing veld
Greywater Harvesting
Group Prioritisation of practices
After the exercise of categorising the initial list of potential CCA practises, the group went on to the
matrix ranking exercise, now prioritizing the practices that they specifically would like to try out. Due to
the drought conditions in the area, farmers focused on practices that would improve their access to
water and also the efficiency of water use in their farming. Due to harsh weather conditions farmers
chose tunnels as their second option. The following figure shows how farmers prioritised practices.
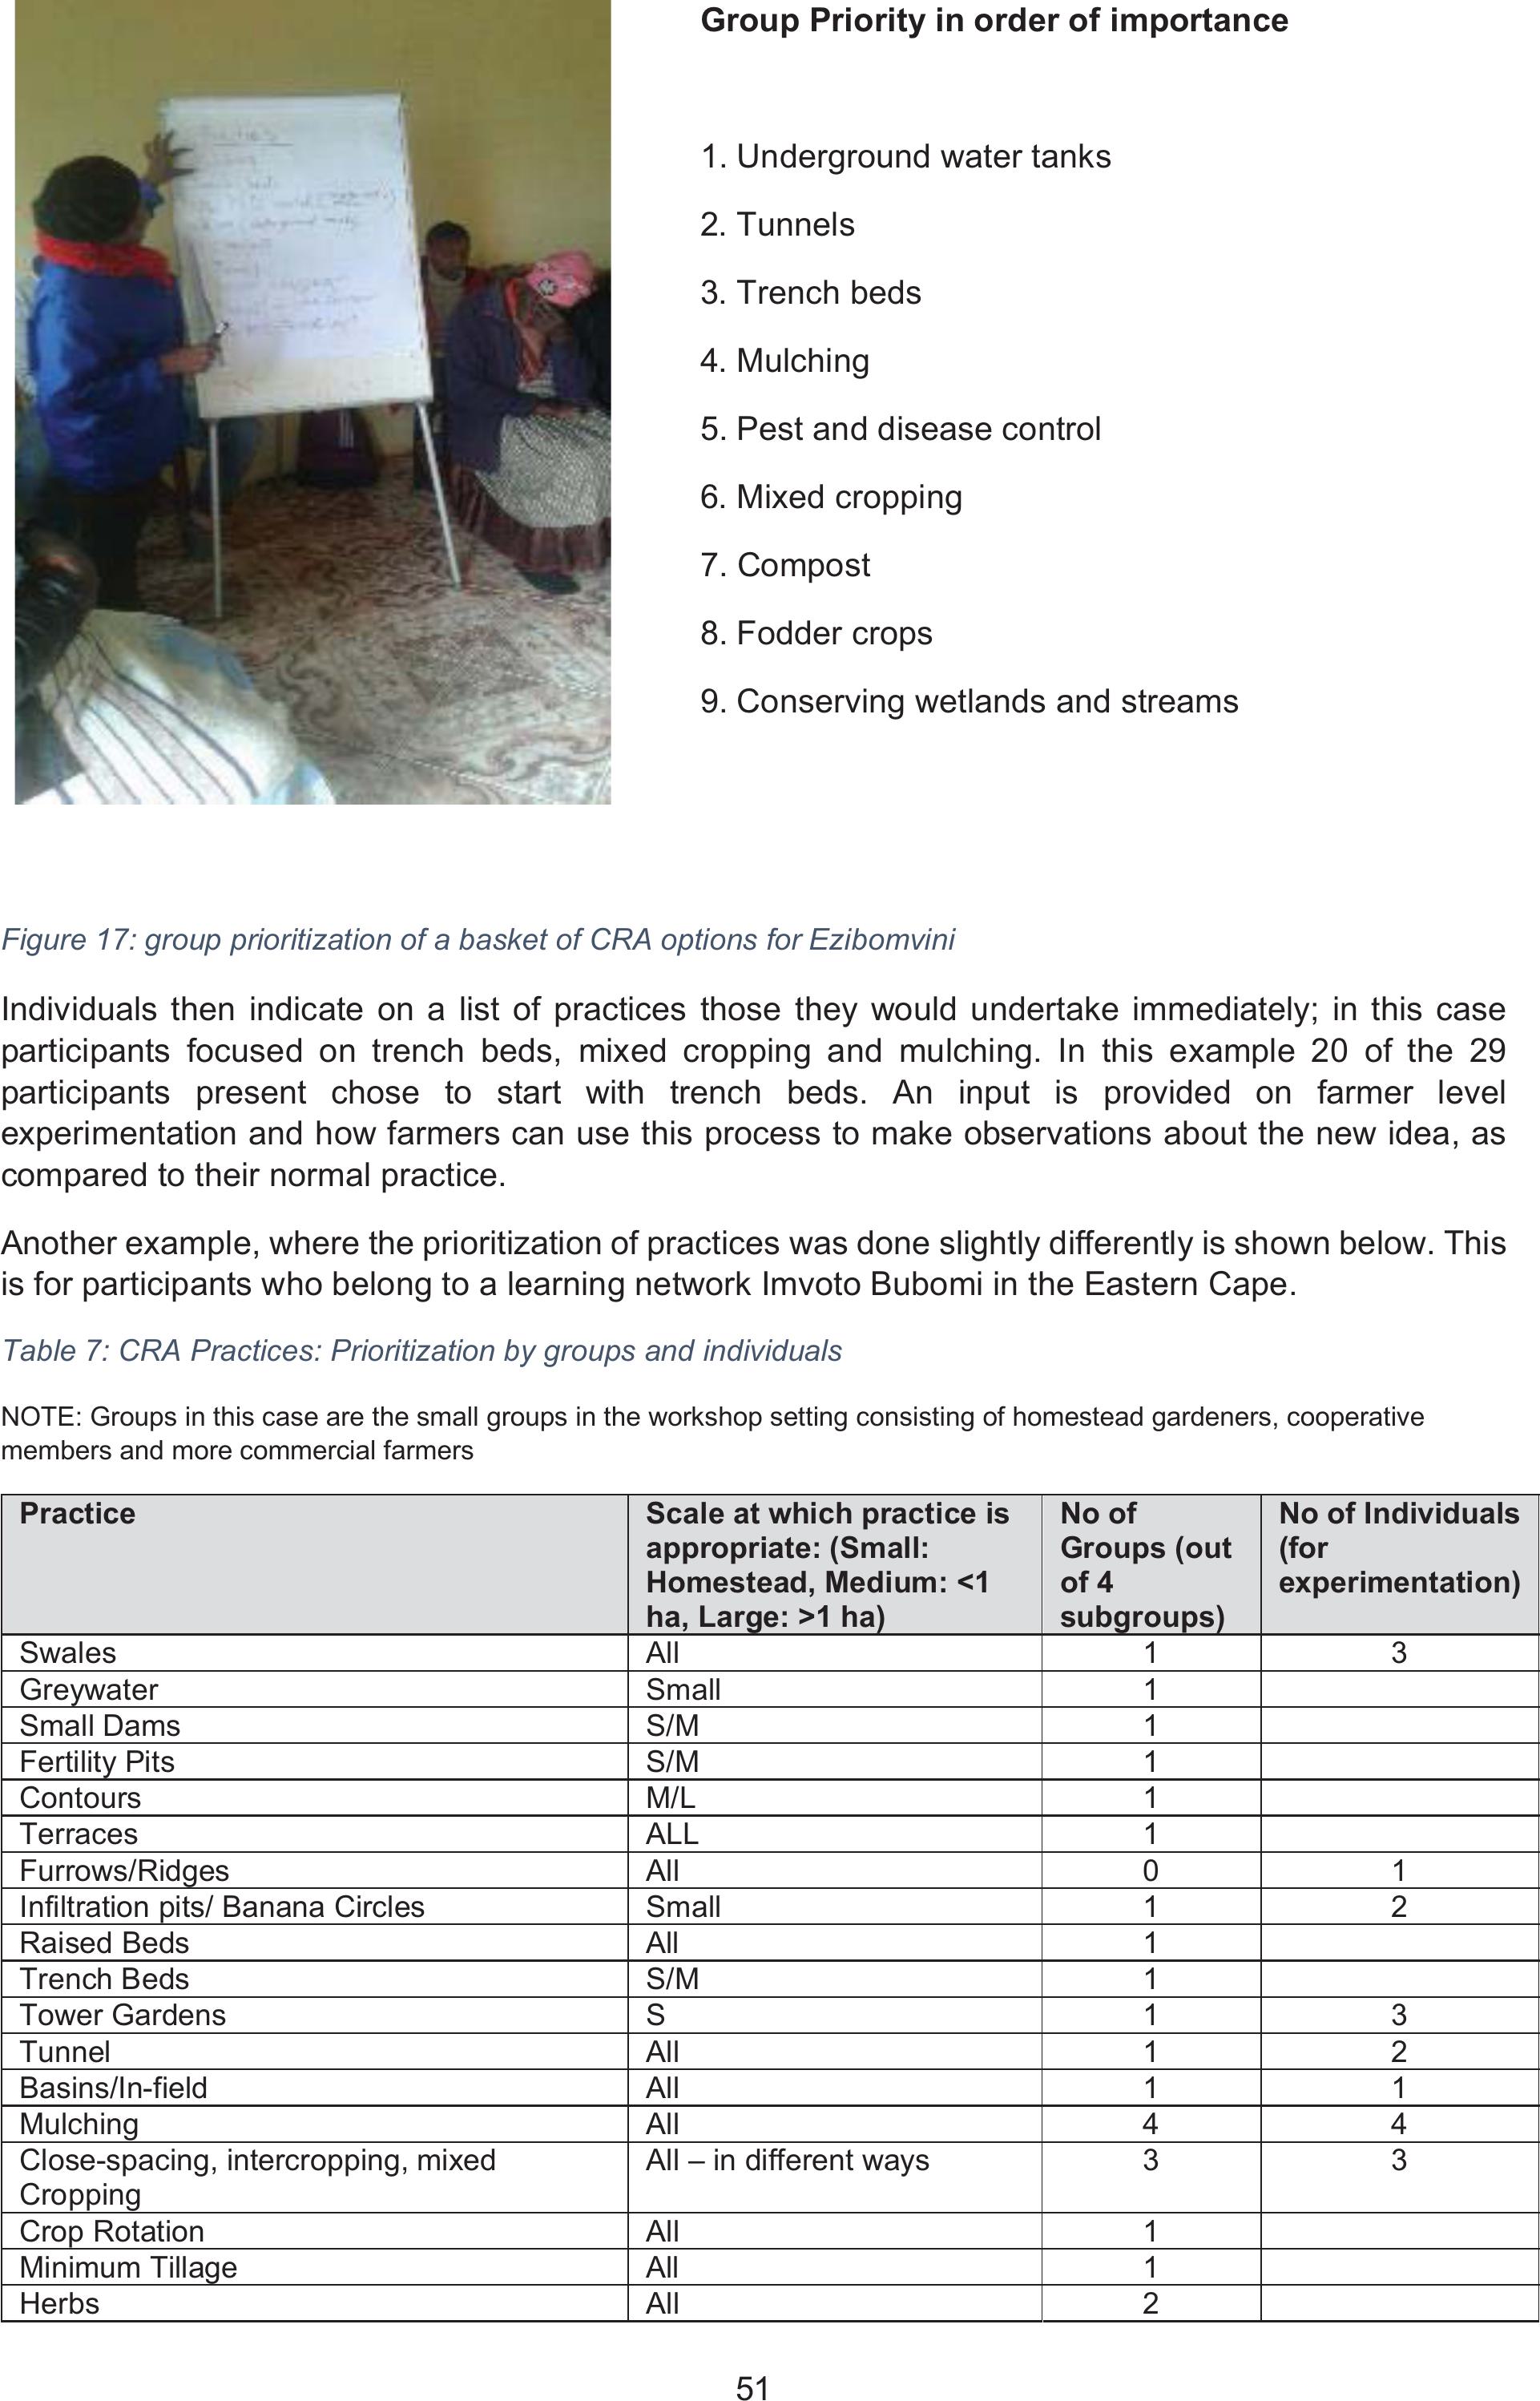
51
Figure 17: group prioritization of a basket of CRA options for Ezibomvini
Individuals then indicate on a list of practices those they would undertake immediately; in this case
participants focused on trench beds, mixed cropping and mulching. In this example 20 of the 29
participants present chose to start with trench beds. An input is provided on farmer level
experimentation and how farmers can use this process to make observations about the new idea, as
compared to their normal practice.
Another example, where the prioritization of practices was done slightly differently is shown below. This
is for participants who belong to a learning network Imvoto Bubomi in the Eastern Cape.
Table 7: CRA Practices: Prioritization by groups and individuals
NOTE: Groups in this case are the small groups in the workshop setting consisting of homestead gardeners, cooperative
members and more commercial farmers
Practice Scale at which practice is
appropriate: (Small:
Homestead, Medium: <1
ha, Large: >1 ha)
No of
Groups (out
of 4
subgroups)
No of Individuals
(for
experimentation)
Swales All 1 3
Greywater Small 1
Small DamsS/M 1
Fertility Pits S/M 1
Contours M/L 1
Terraces ALL1
Furrows/Ridges All 0 1
Infiltration pits/ Banana Circles Small 1 2
Raised Beds All1
Trench BedsS/M 1
Tower Gardens S 1 3
Tunnel All1 2
Basins/In-field All 1 1
Mulching All 4 4
Close-spacing, intercropping, mixed
Cropping
All – in different ways3 3
Crop Rotation All 1
Minimum TillageAll 1
Herbs All 2
Group Priority in order of importance
1. Underground water tanks
2. Tunnels
3. Trench beds
4. Mulching
5. Pest and disease control
6. Mixed cropping
7. Compost
8. Fodder crops
9. Conserving wetlands and streams
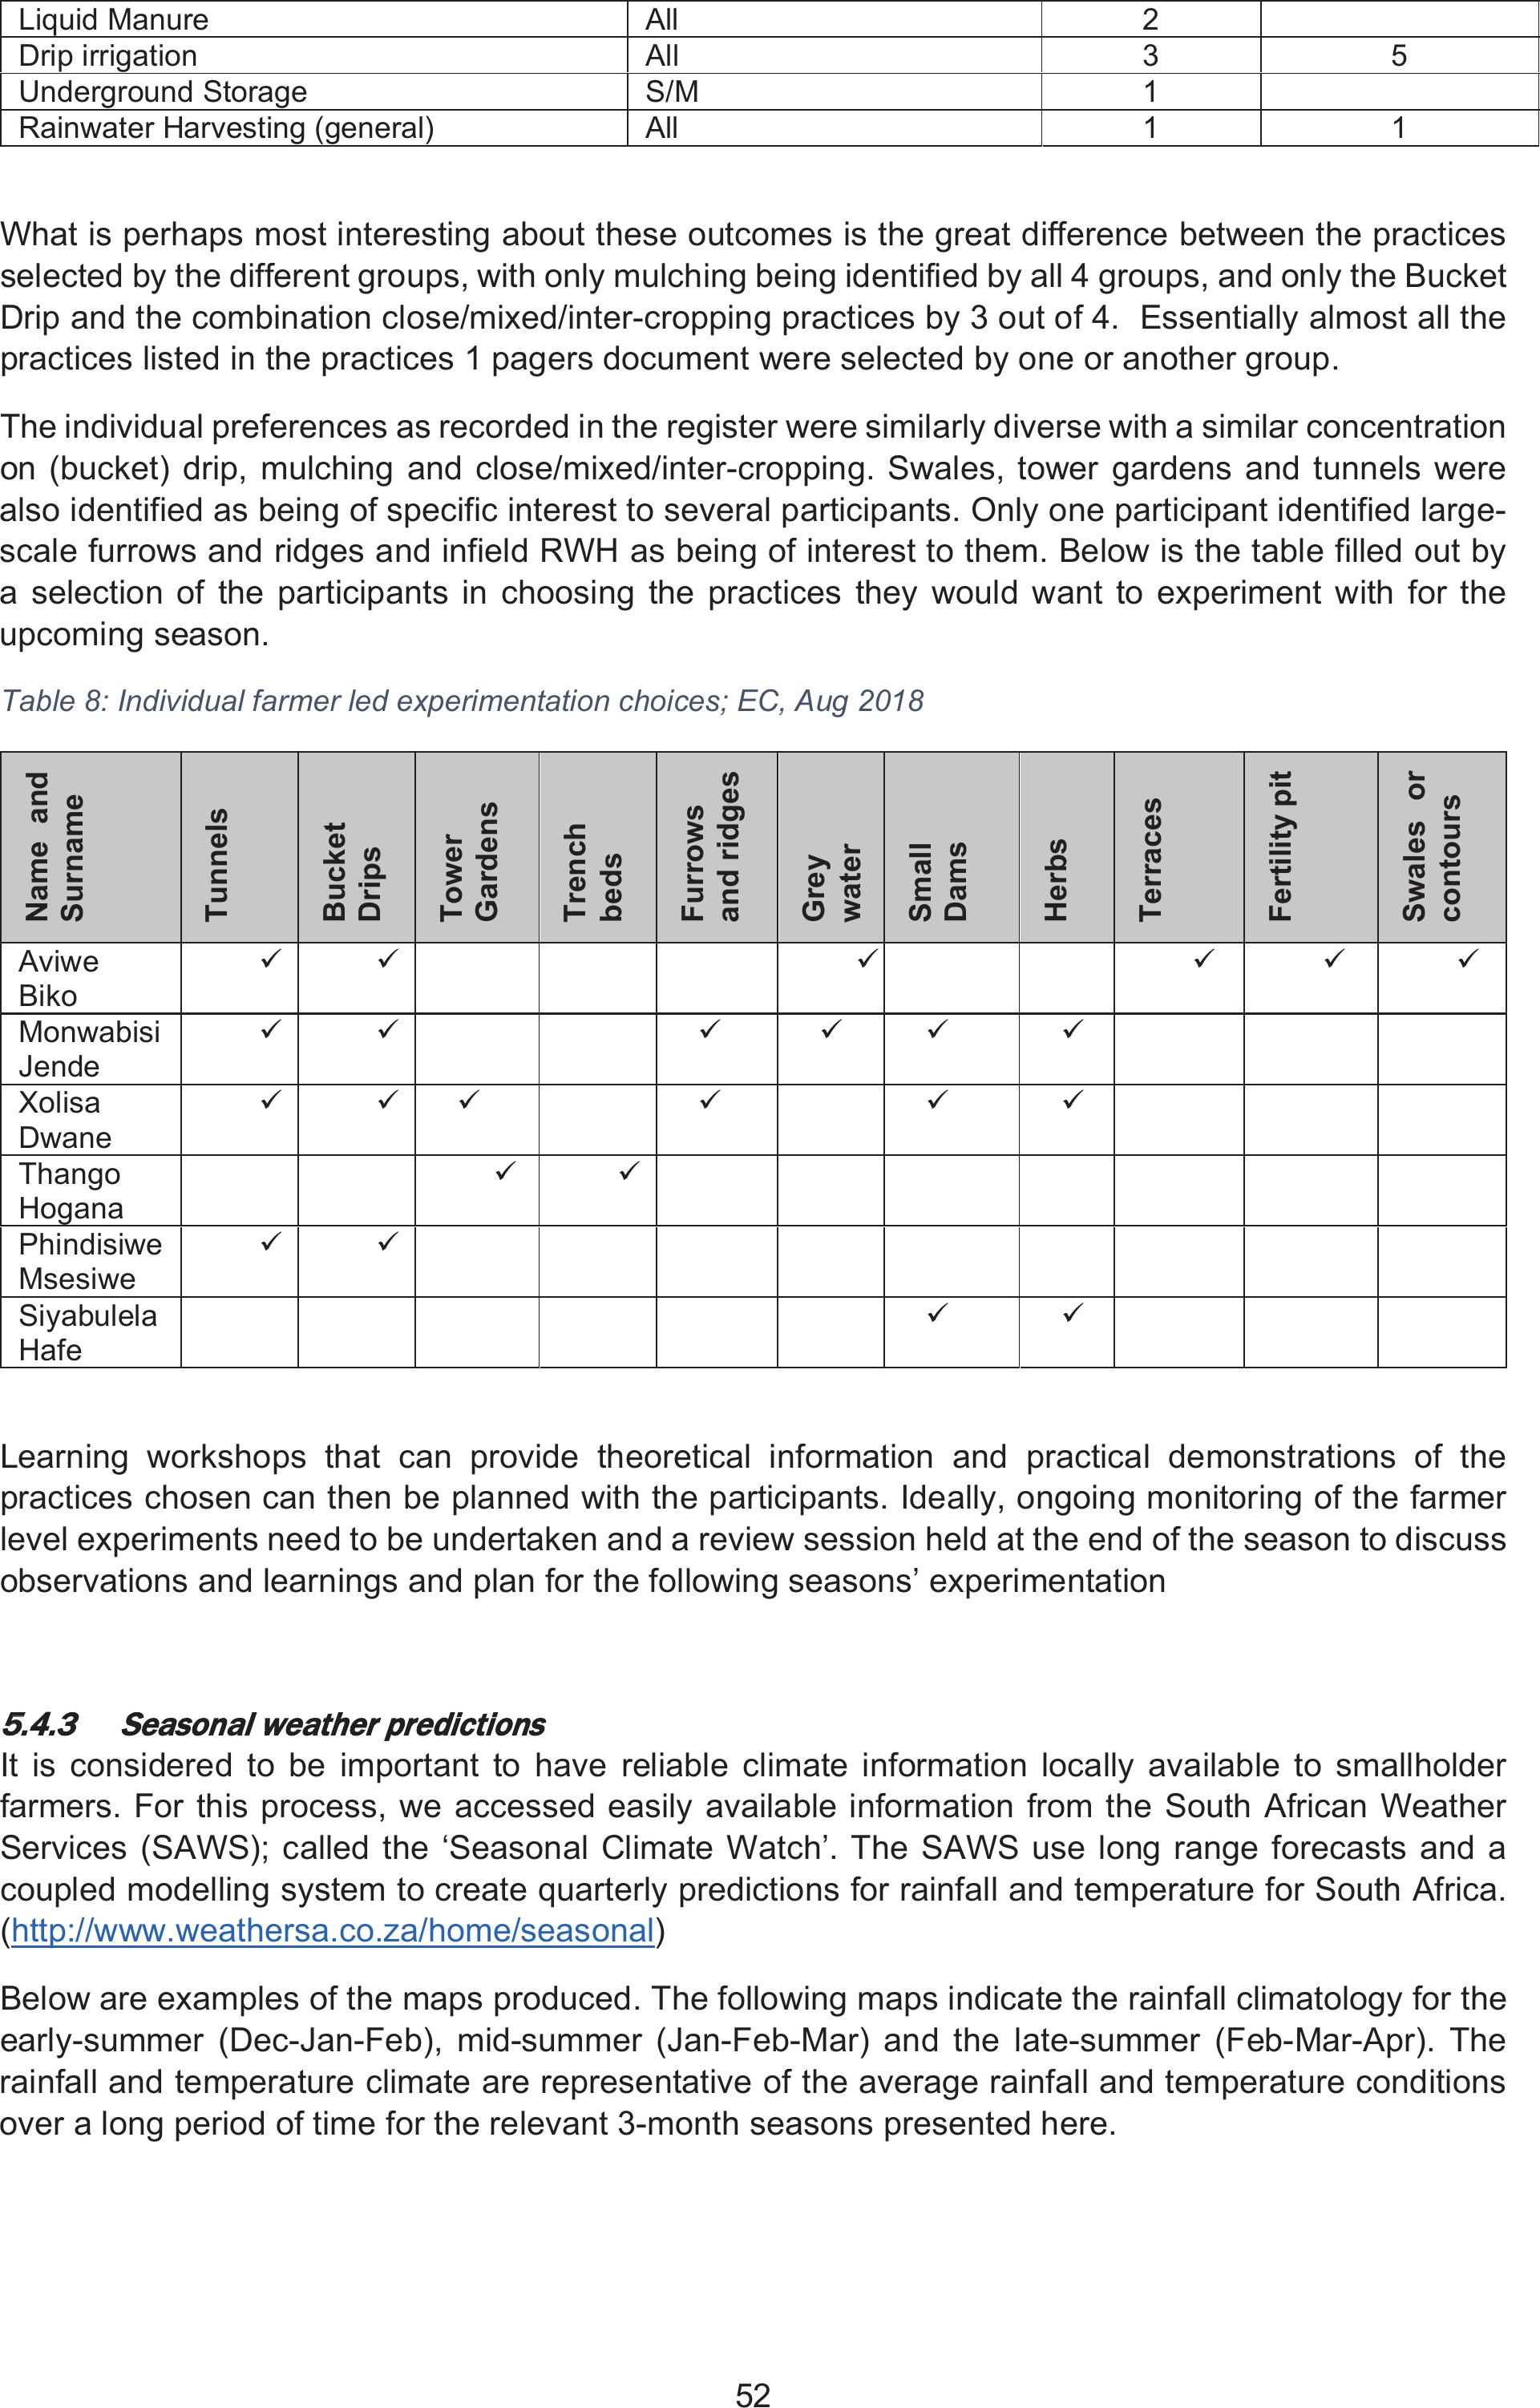
52
Liquid Manure All 2
Drip irrigation All 3 5
Underground Storage S/M 1
Rainwater Harvesting (general) All 1 1
What is perhaps most interesting about these outcomes is the great difference between the practices
selected by the different groups, with only mulching being identified by all 4 groups, and only the Bucket
Drip and the combination close/mixed/inter-cropping practices by 3 out of 4. Essentially almost all the
practices listed in the practices 1 pagers document were selected by one or another group.
The individual preferences as recorded in the register were similarly diverse with a similar concentration
on (bucket) drip, mulching and close/mixed/inter-cropping. Swales, tower gardens and tunnels were
also identified as being of specific interest to several participants. Only one participant identified large-
scale furrows and ridges and infield RWH as being of interest to them. Below is the table filled out by
a selection of the participants in choosing the practices they would want to experiment with for the
upcoming season.
Table 8: Individual farmer led experimentation choices; EC, Aug 2018
Learning workshops that can provide theoretical information and practical demonstrations of the
practices chosen can then be planned with the participants. Ideally, ongoing monitoring of the farmer
level experiments need to be undertaken and a review session held at the end of the season to discuss
observations and learnings and plan for the following seasons’ experimentation
5
5.4.3
Seasonal weather predictions
It is considered to be important to have reliable climate information locally available to smallholder
farmers. For this process, we accessed easily available information from the South African Weather
Services (SAWS); called the ‘Seasonal Climate Watch’. The SAWS use long range forecasts and a
coupled modelling system to create quarterly predictions for rainfall and temperature for South Africa.
(http://www.weathersa.co.za/home/seasonal)
Below are examples of the maps produced. The following maps indicate the rainfall climatology for the
early-summer (Dec-Jan-Feb), mid-summer (Jan-Feb-Mar) and the late-summer (Feb-Mar-Apr). The
rainfall and temperature climate are representative of the average rainfall and temperature conditions
over a long period of time for the relevant 3-month seasons presented here.
Name and
Surname
Tunnels
Bucket
Drips
Tower
Gardens
Trench
beds
Furrows
and ridges
Grey
water
Small
Dams
Herbs
Terraces
Fertility pit
Swales or
contours
Aviwe
Biko
999999
Monwabisi
Jende
999999
Xolisa
Dwane
999999
Thango
Hogana
99
Phindisiwe
Msesiwe
99
Siyabulela
Hafe
99
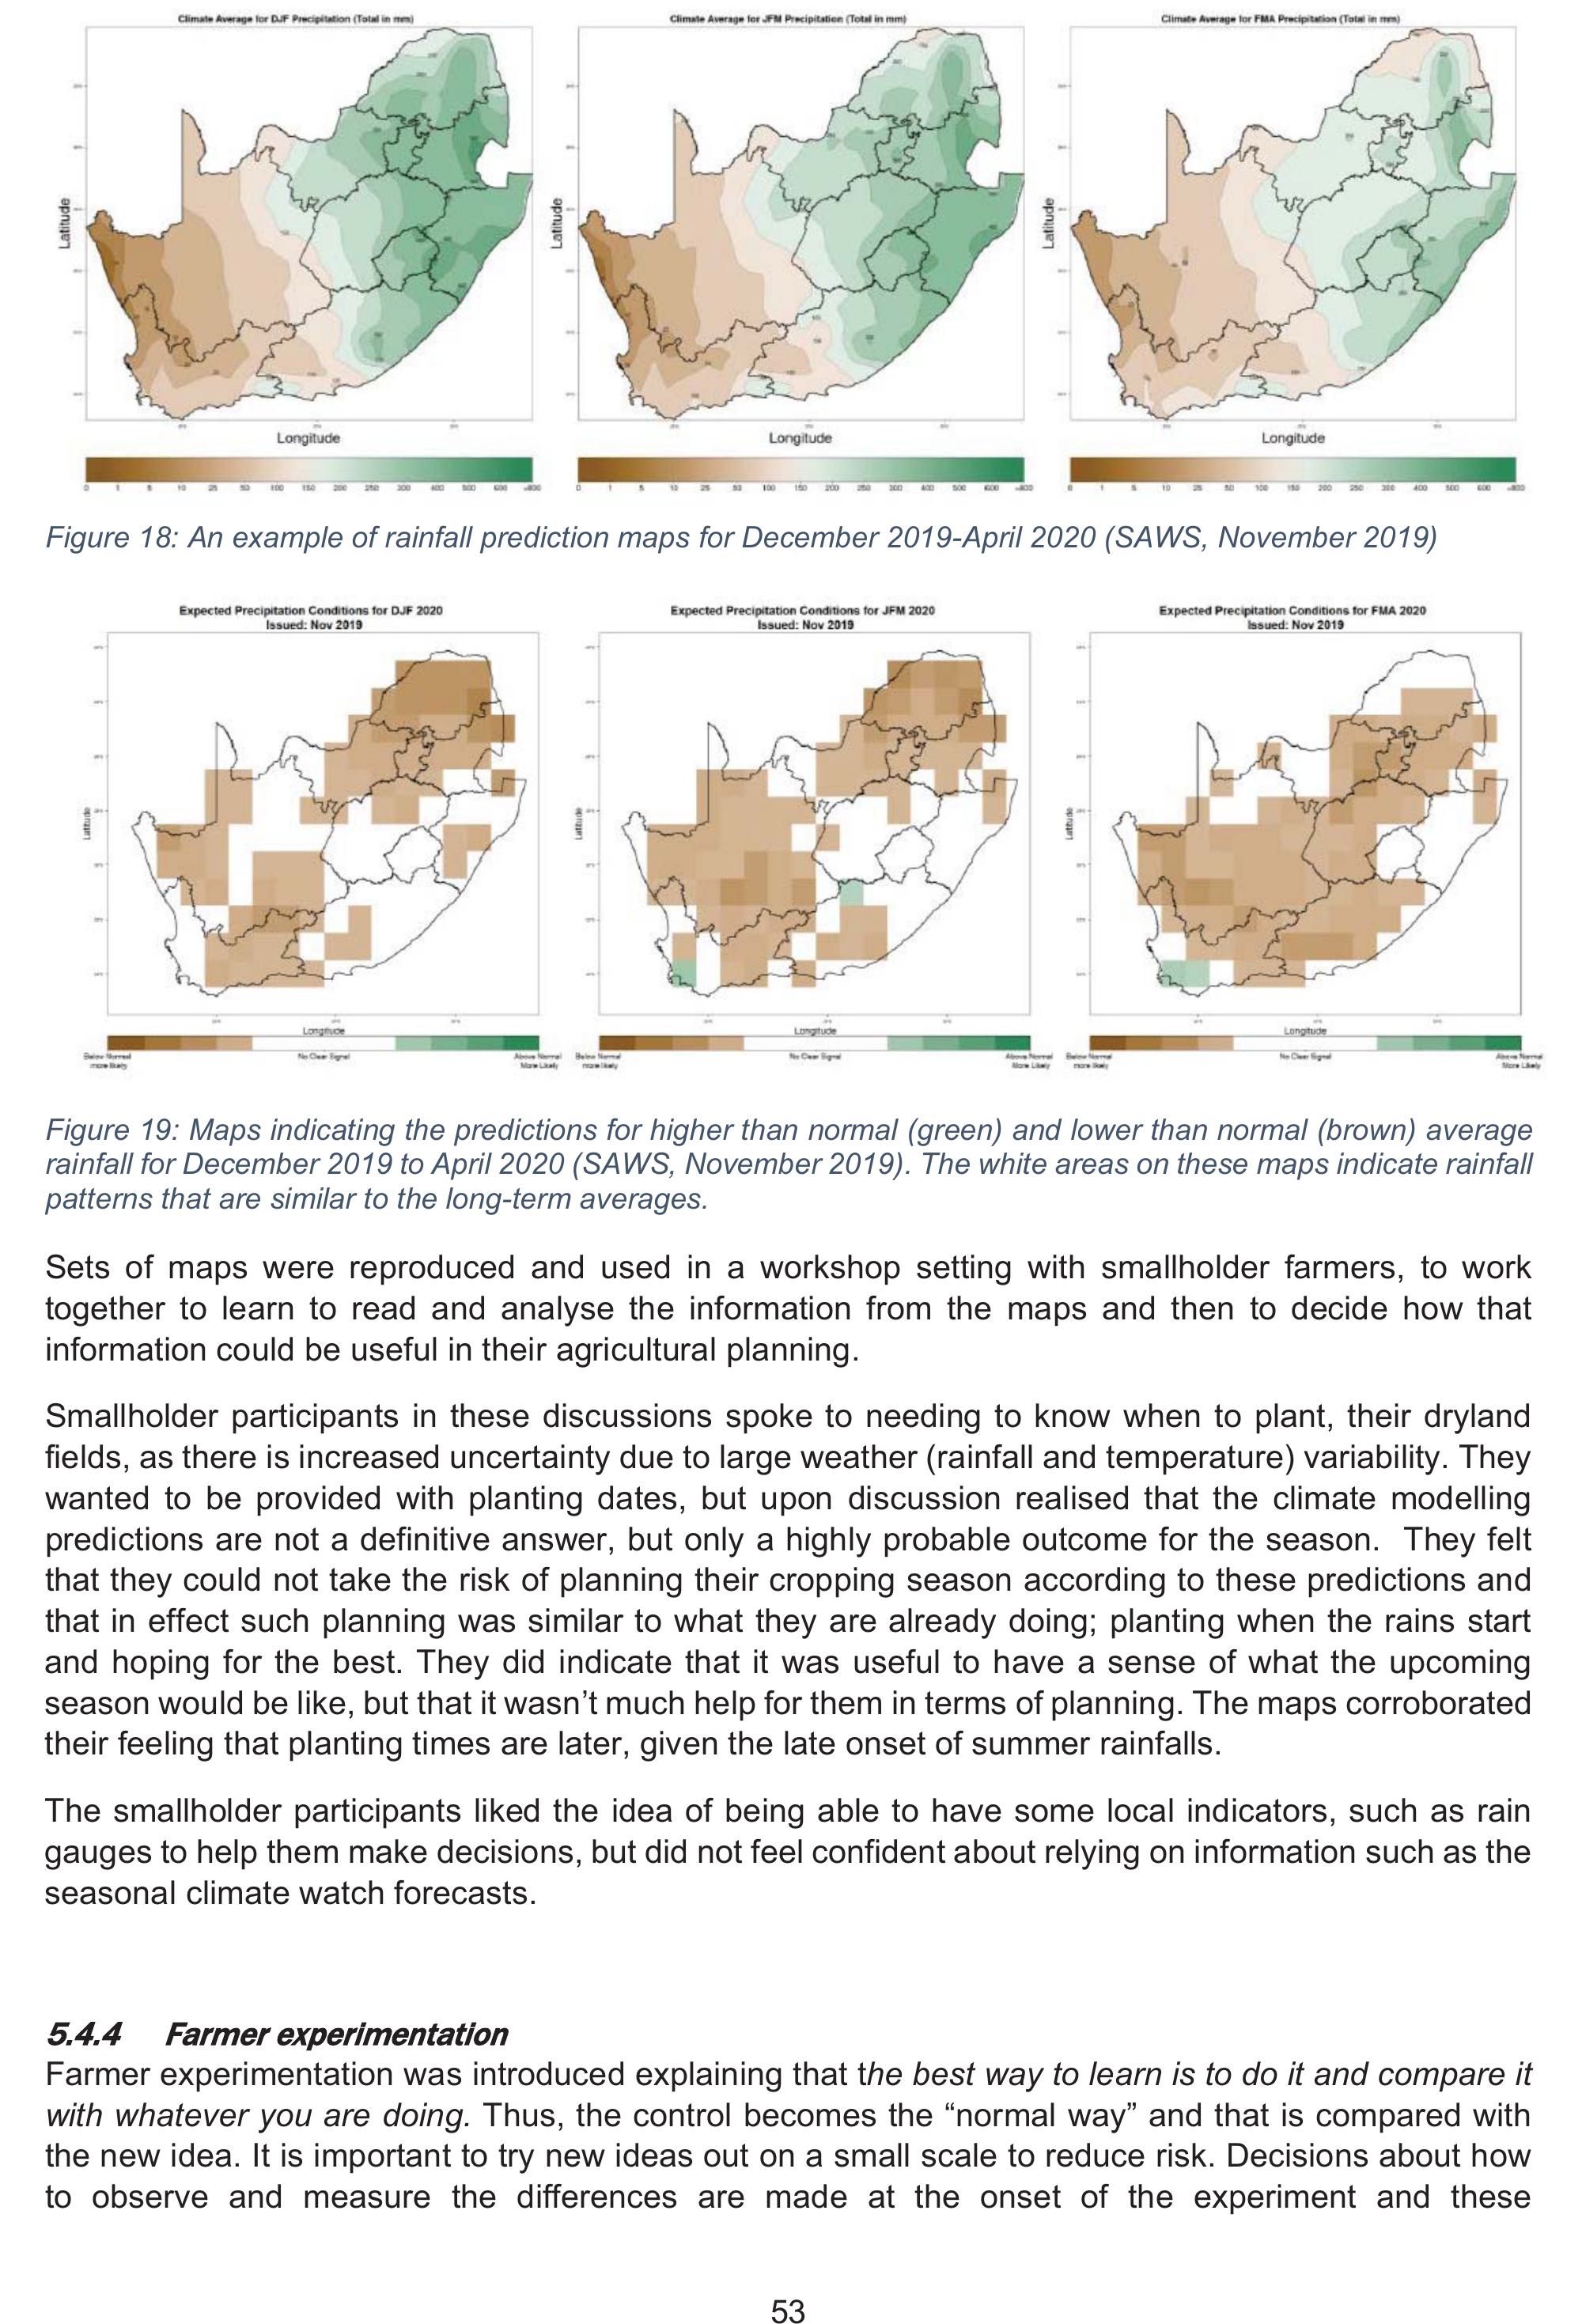
53
Figure 18: An example of rainfall prediction maps for December 2019-April 2020 (SAWS, November 2019)
Figure 19: Maps indicating the predictions for higher than normal (green) and lower than normal (brown) average
rainfall for December 2019 to April 2020 (SAWS, November 2019). The white areas on these maps indicate rainfall
patterns that are similar to the long-term averages.
Sets of maps were reproduced and used in a workshop setting with smallholder farmers, to work
together to learn to read and analyse the information from the maps and then to decide how that
information could be useful in their agricultural planning.
Smallholder participants in these discussions spoke to needing to know when to plant, their dryland
fields, as there is increased uncertainty due to large weather (rainfall and temperature) variability. They
wanted to be provided with planting dates, but upon discussion realised that the climate modelling
predictions are not a definitive answer, but only a highly probable outcome for the season. They felt
that they could not take the risk of planning their cropping season according to these predictions and
that in effect such planning was similar to what they are already doing; planting when the rains start
and hoping for the best. They did indicate that it was useful to have a sense of what the upcoming
season would be like, but that it wasn’t much help for them in terms of planning. The maps corroborated
their feeling that planting times are later, given the late onset of summer rainfalls.
The smallholder participants liked the idea of being able to have some local indicators, such as rain
gauges to help them make decisions, but did not feel confident about relying on information such as the
seasonal climate watch forecasts.
5
5.4.4
Farmer experimentation
Farmer experimentation was introduced explaining that the best way to learn is to do it and compare it
with whatever you are doing. Thus, the control becomes the “normal way” and that is compared with
the new idea. It is important to try new ideas out on a small scale to reduce risk. Decisions about how
to observe and measure the differences are made at the onset of the experiment and these
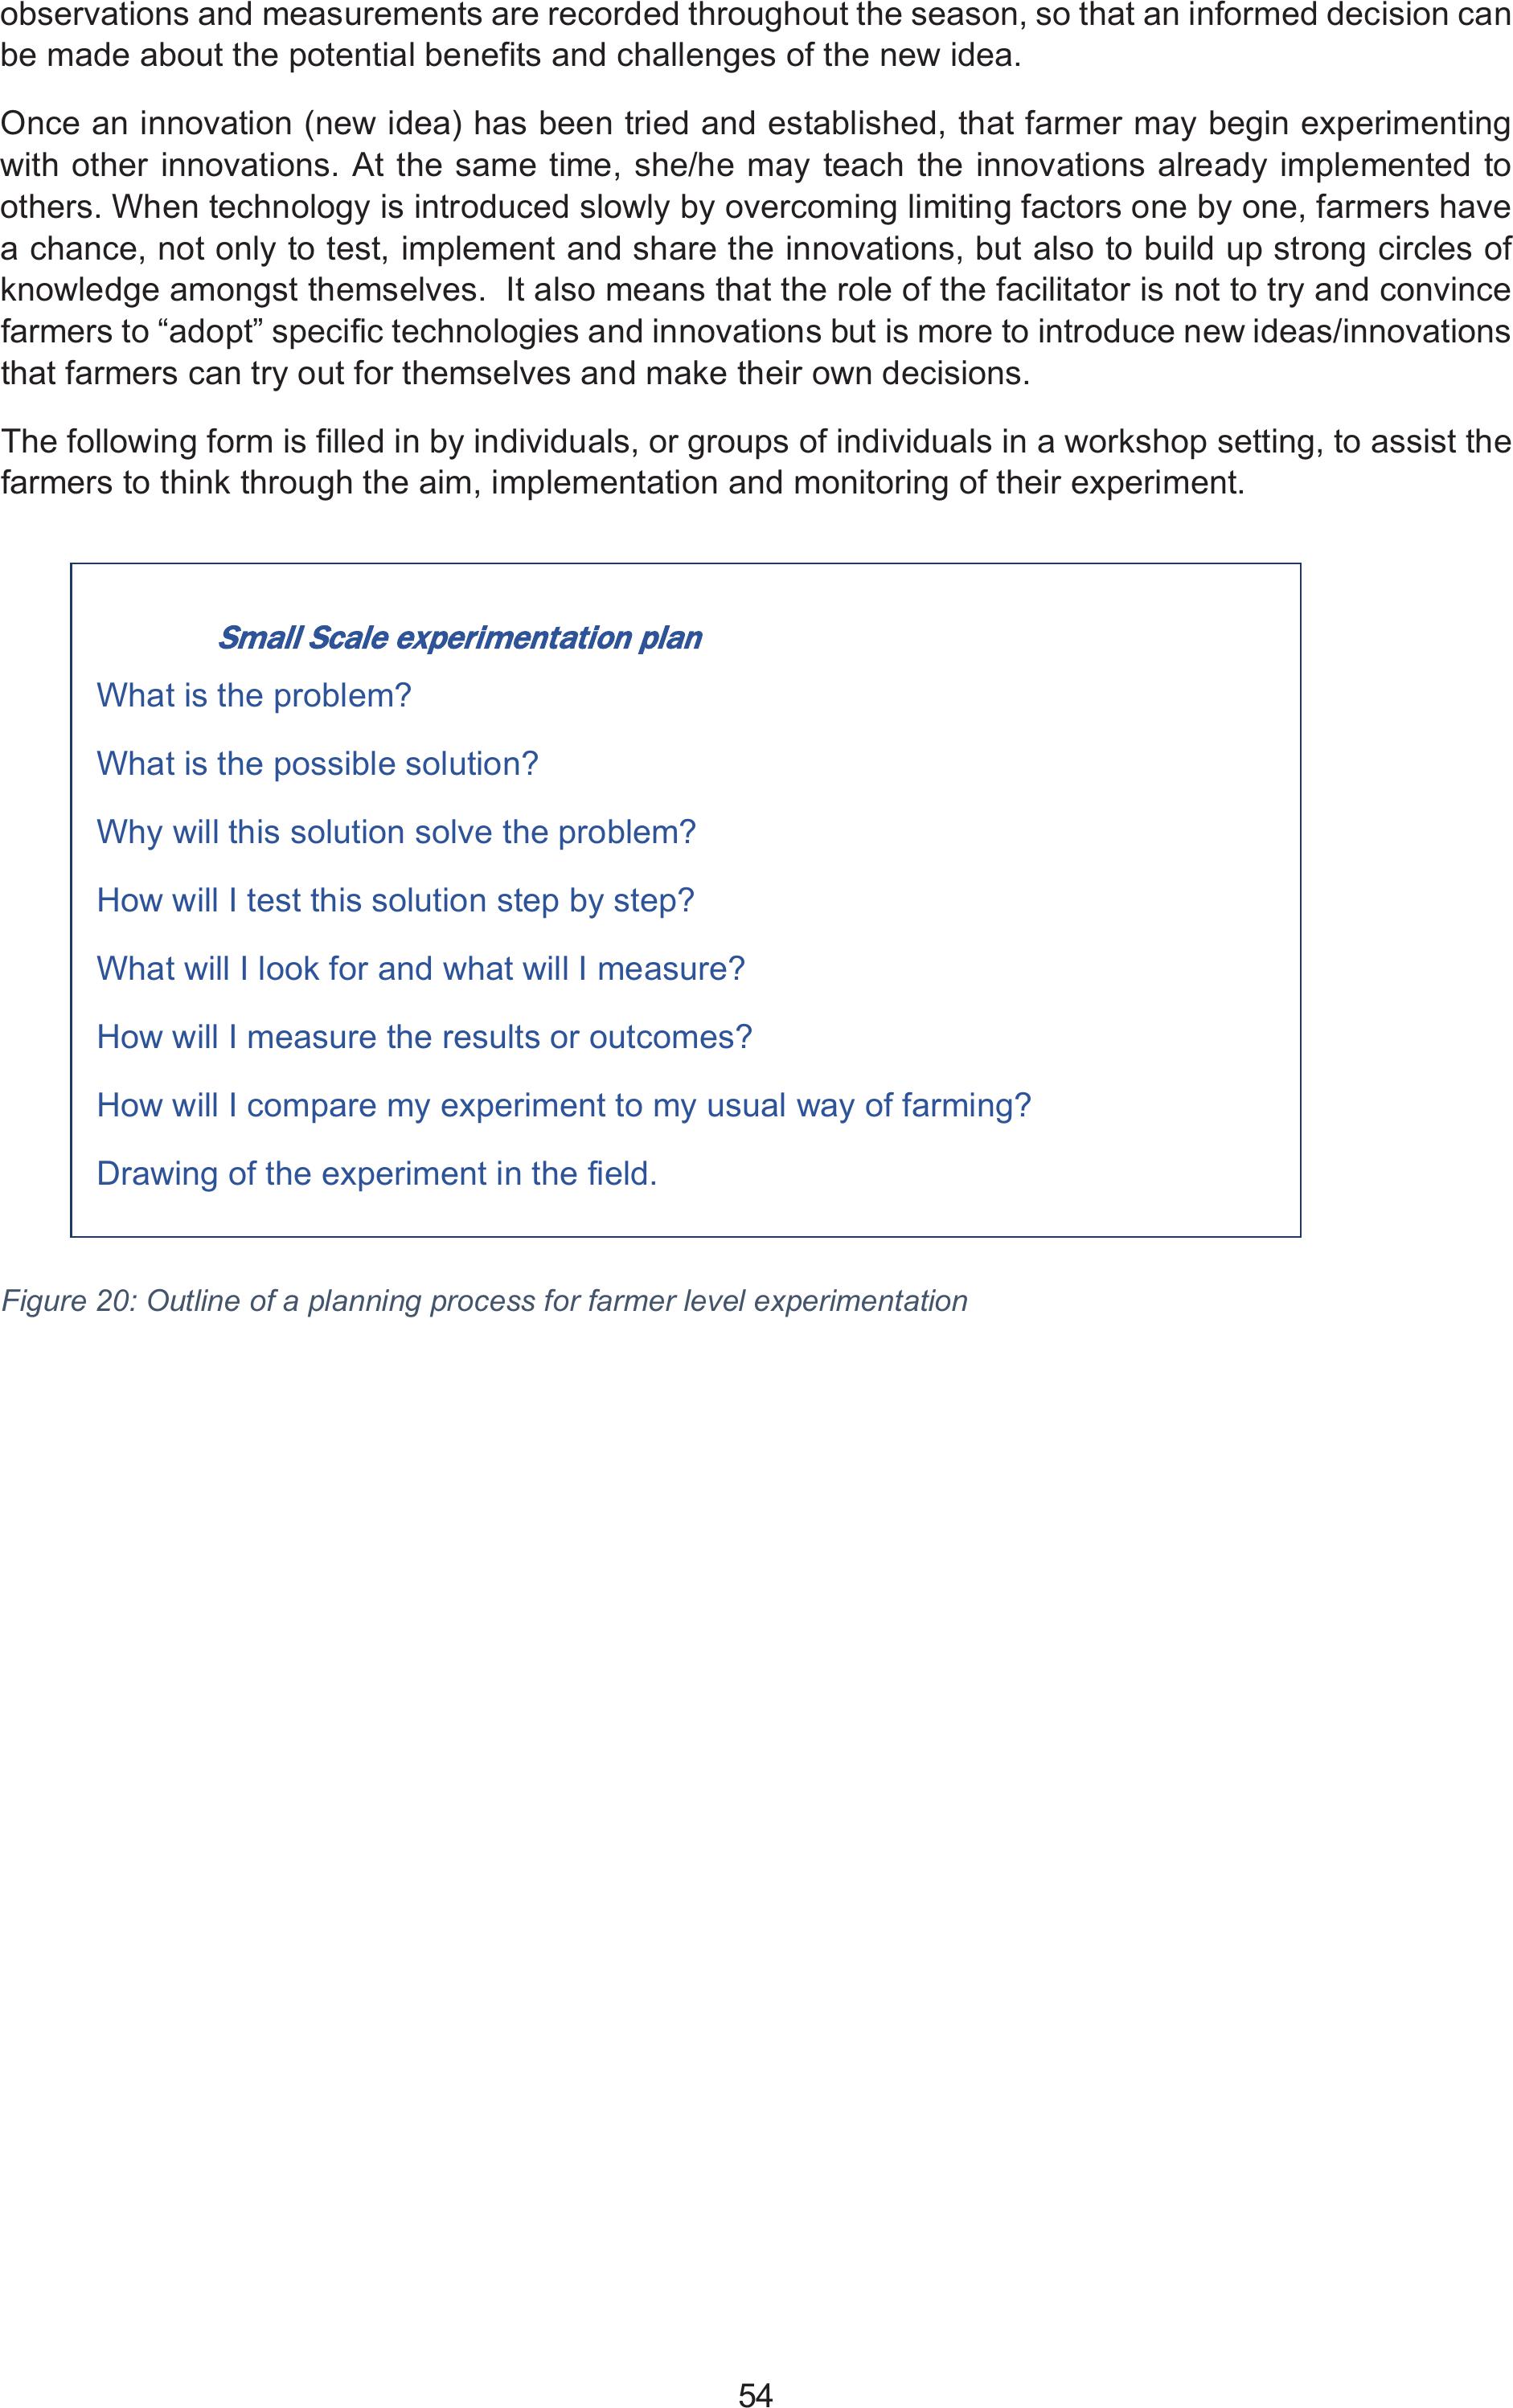
54
observations and measurements are recorded throughout the season, so that an informed decision can
be made about the potential benefits and challenges of the new idea.
Once an innovation (new idea) has been tried and established, that farmer may begin experimenting
with other innovations. At the same time, she/he may teach the innovations already implemented to
others. When technology is introduced slowly by overcoming limiting factors one by one, farmers have
a chance, not only to test, implement and share the innovations, but also to build up strong circles of
knowledge amongst themselves. It also means that the role of the facilitator is not to try and convince
farmers to “adopt” specific technologies and innovations but is more to introduce new ideas/innovations
that farmers can try out for themselves and make their own decisions.
The following form is filled in by individuals, or groups of individuals in a workshop setting, to assist the
farmers to think through the aim, implementation and monitoring of their experiment.
Figure 20: Outline of a planning process for farmer level experimentation
Small Scale experimentation plan
What is the problem?
What is the possible solution?
Why will this solution solve the problem?
How will I test this solution step by step?
What will I look for and what will I measure?
How will I measure the results or outcomes?
How will I compare my experiment to my usual way of farming?
Drawing of the experiment in the field.
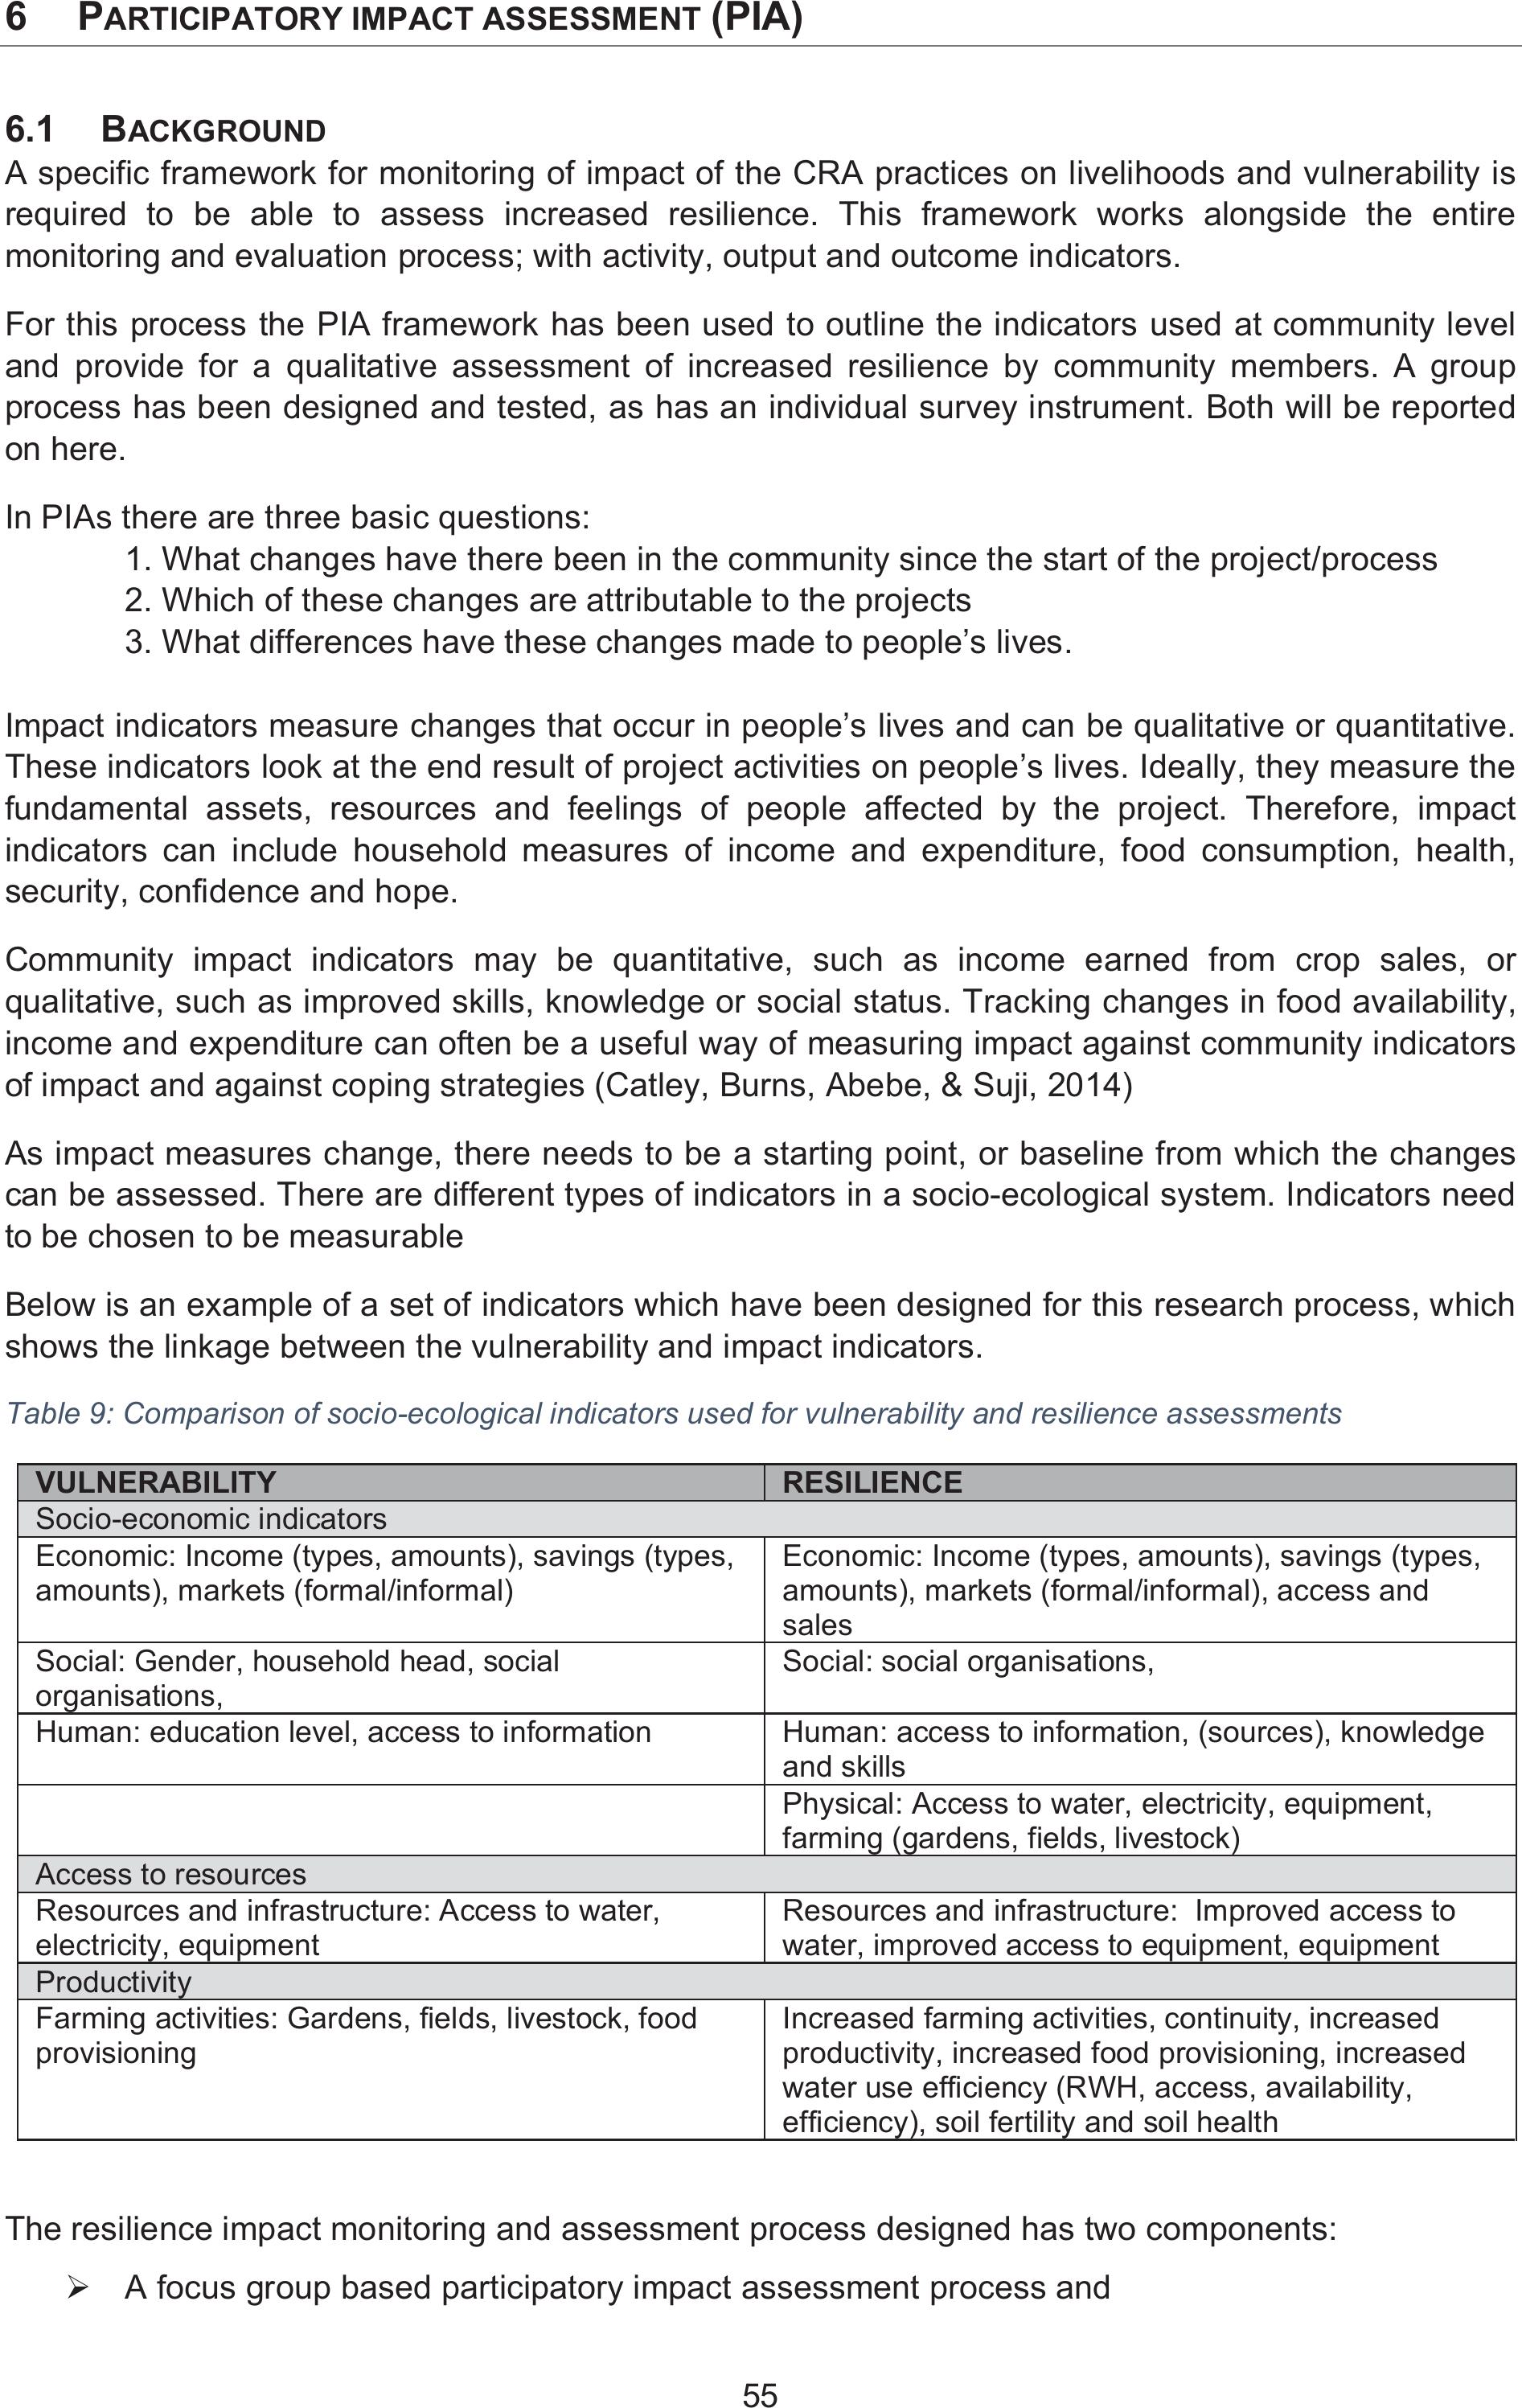
55
6 PARTICIPATORY IMPACT ASSESSMENT (PIA)
6.1 BACKGROUND
A specific framework for monitoring of impact of the CRA practices on livelihoods and vulnerability is
required to be able to assess increased resilience. This framework works alongside the entire
monitoring and evaluation process; with activity, output and outcome indicators.
For this process the PIA framework has been used to outline the indicators used at community level
and provide for a qualitative assessment of increased resilience by community members. A group
process has been designed and tested, as has an individual survey instrument. Both will be reported
on here.
In PIAs there are three basic questions:
1. What changes have there been in the community since the start of the project/process
2. Which of these changes are attributable to the projects
3. What differences have these changes made to people’s lives.
Impact indicators measure changes that occur in people’s lives and can be qualitative or quantitative.
These indicators look at the end result of project activities on people’s lives. Ideally, they measure the
fundamental assets, resources and feelings of people affected by the project. Therefore, impact
indicators can include household measures of income and expenditure, food consumption, health,
security, confidence and hope.
Community impact indicators may be quantitative, such as income earned from crop sales, or
qualitative, such as improved skills, knowledge or social status. Tracking changes in food availability,
income and expenditure can often be a useful way of measuring impact against community indicators
of impact and against coping strategies (Catley, Burns, Abebe, & Suji, 2014)
As impact measures change, there needs to be a starting point, or baseline from which the changes
can be assessed. There are different types of indicators in a socio-ecological system. Indicators need
to be chosen to be measurable
Below is an example of a set of indicators which have been designed for this research process, which
shows the linkage between the vulnerability and impact indicators.
Table 9: Comparison of socio-ecological indicators used for vulnerability and resilience assessments
VULNERABILITYRESILIENCE
Socio-economic indicators
Economic: Income (types, amounts), savings (types,
amounts), markets (formal/informal)
Economic: Income (types, amounts), savings (types,
amounts), markets (formal/informal), access and
sales
Social: Gender, household head, social
organisations,
Social: social organisations,
Human: education level, access to informationHuman: access to information, (sources), knowledge
and skills
Physical: Access to water, electricity, equipment,
farming (gardens, fields, livestock)
Access to resources
Resources and infrastructure: Access to water,
electricity, equipment
Resources and infrastructure: Improved access to
water, improved access to equipment, equipment
Productivity
Farming activities: Gardens, fields, livestock, food
provisioning
Increased farming activities, continuity, increased
productivity, increased food provisioning, increased
water use efficiency (RWH, access, availability,
efficiency), soil fertility and soil health
The resilience impact monitoring and assessment process designed has two components:
¾A focus group based participatory impact assessment process and
56
¾A questionnaire-based individual interview process. These are called Resilience Snapshots, as
they are considered a measurement of change at a certain point in time (e.g. seasonally,
annually), but are not considered an end-point as adaptation and building adaptive capacity is
an ongoing process.
These two processes are outlined below.
6.2 PIA WORKSHOP OUTLINE
These workshops are conducted with smallholder farmer participants who have been involved in farmer
level experimentation and implementation of CRA practices for a minimum of two to four seasons;
where a season is broadly defined as either winter or summer.
The intention is for the participants themselves to jointly develop the impact indicators that are
appropriate for them and then to use these indicators to analyse and assess the changes in their
system.
6
6.2.1
Recap climate change impacts
Explore what people have noticed around climate change impacts and make lists under headings:
natural, physical, economic, human and social.
Group level brainstorming of ideas; written on cards under the headings given, with arrows for increase
or decrease.
6.2.2
Recap adaptive strategies/ practices
¾What have people been doing to adapt to this, fix the problems, make things better?
¾What can be done? (first look at what has been done so far and then any further ideas of what
can be done)
¾Elucidate adaptations for each category: natural, physical, economic human, social
Group level brainstorming: Write on different cards (those done and those thought of) and place next
to the impact, indicate with a * which of these have been facilitated or introduced (and by whom) – this
can be other farmers, projects, extension officers, etc.
6.2.2.1The five fingers tool
In addition to monitoring being conducted by facilitators a local framework for self and peer assessment
and monitoring of progress is employed using the ‘five fingers’ principles, as developed by AWARD
(http://award.org.za/wp/wp-content/uploads/2020/05/AWARD-BROCHURE-Principles-of-Soil-Water-
Conservation-in-Agroecology-2019-v1.pdf). Local criteria for assessment of each ‘finger’ (things we
are doing and changing) are developed alongside an easy scoring progress to track changes and
progress.
This tool has been slightly adapted by MDF to accommodate for the five thematic focus areas of the
CRA experimentation and implementation process namely:
¾Soil management: Adopt practices that limit soil movement and build and maintain soil health
¾Water management: Practice good water management to enhance soil moisture and limit
water movement
¾Crop management: Manage crops for diversity, location and sustainability
¾Livestock management: Manage livestock for diversity, location and sustainability
¾Natural resource management: Protect and maintain indigenous plants as part of farming
practice and
¾People working together
The 6th category (the whole hand) has been added in MDF’s work to accommodate for the principle of
people working together (social agency and collaborative actions).

57
6
6.2.3
Practices: Recap five fingers and list all practices under each category
¾Re-introduce the 5 fingers concept and include a further category of the whole hand – which is
the social and personal
¾Which practices have been implemented (introduced and other)? Go around in the circle and
each person mentions what s/he has done (productive, economic, social, personal actions) and
what she would still like to try
¾Add these practices to the five fingers diagram. Make an A1 diagram of the five fingers and
then add practices on cards
¾Go through practices recommended through the DSS. Use cards with ranked practices from
the DSS – describe and show the ones that people are not familiar with.
¾Rank practices for next round of implementation. Rank the list of practices by a show of hands.
6.2.4
What have been the changes or benefits from each practice?
¾What changes have there been? Brainstorm changes and interrogate answers to get to the
more
¾How important are these changes to your lives? How do you decide? Which criteria would you
use to decide?
Do a matrix ranking: Changes (in columns), criteria (in rows) – Use proportional piling, working
down each column by asking “how important is this practice for the criteria” and comparing the
practices with each other (to an extent) as you go down the list. The exercise is done in small
groups of 5-8 participants
Below is an example of what the matrix could look like.
Food Income Soil, waterAccess, ease of
implementation
knowledge
Trench beds
Tunnels
CA
Cover crops
Legumes
Other crops; potatoes, sweet
potatoes
Savings
Subsidised inputs
Saving for inputs
Farmer centre
Small businesses
Learning group
Water committee
6.2.5
Expanding on practices
¾Introduce new practices for each of the ‘five fingers’
¾Participants assess each practice (after deciding on criteria for how you decide this practice is
useful)
Eventually the whole exercise can be summarised in the matrix below.
Natural Physical EconomicHuman Social
CC impacts
Adaptive
strategies
Actions/
practices
Changes due
to practices
Importance of
these changes
to your
livelihood
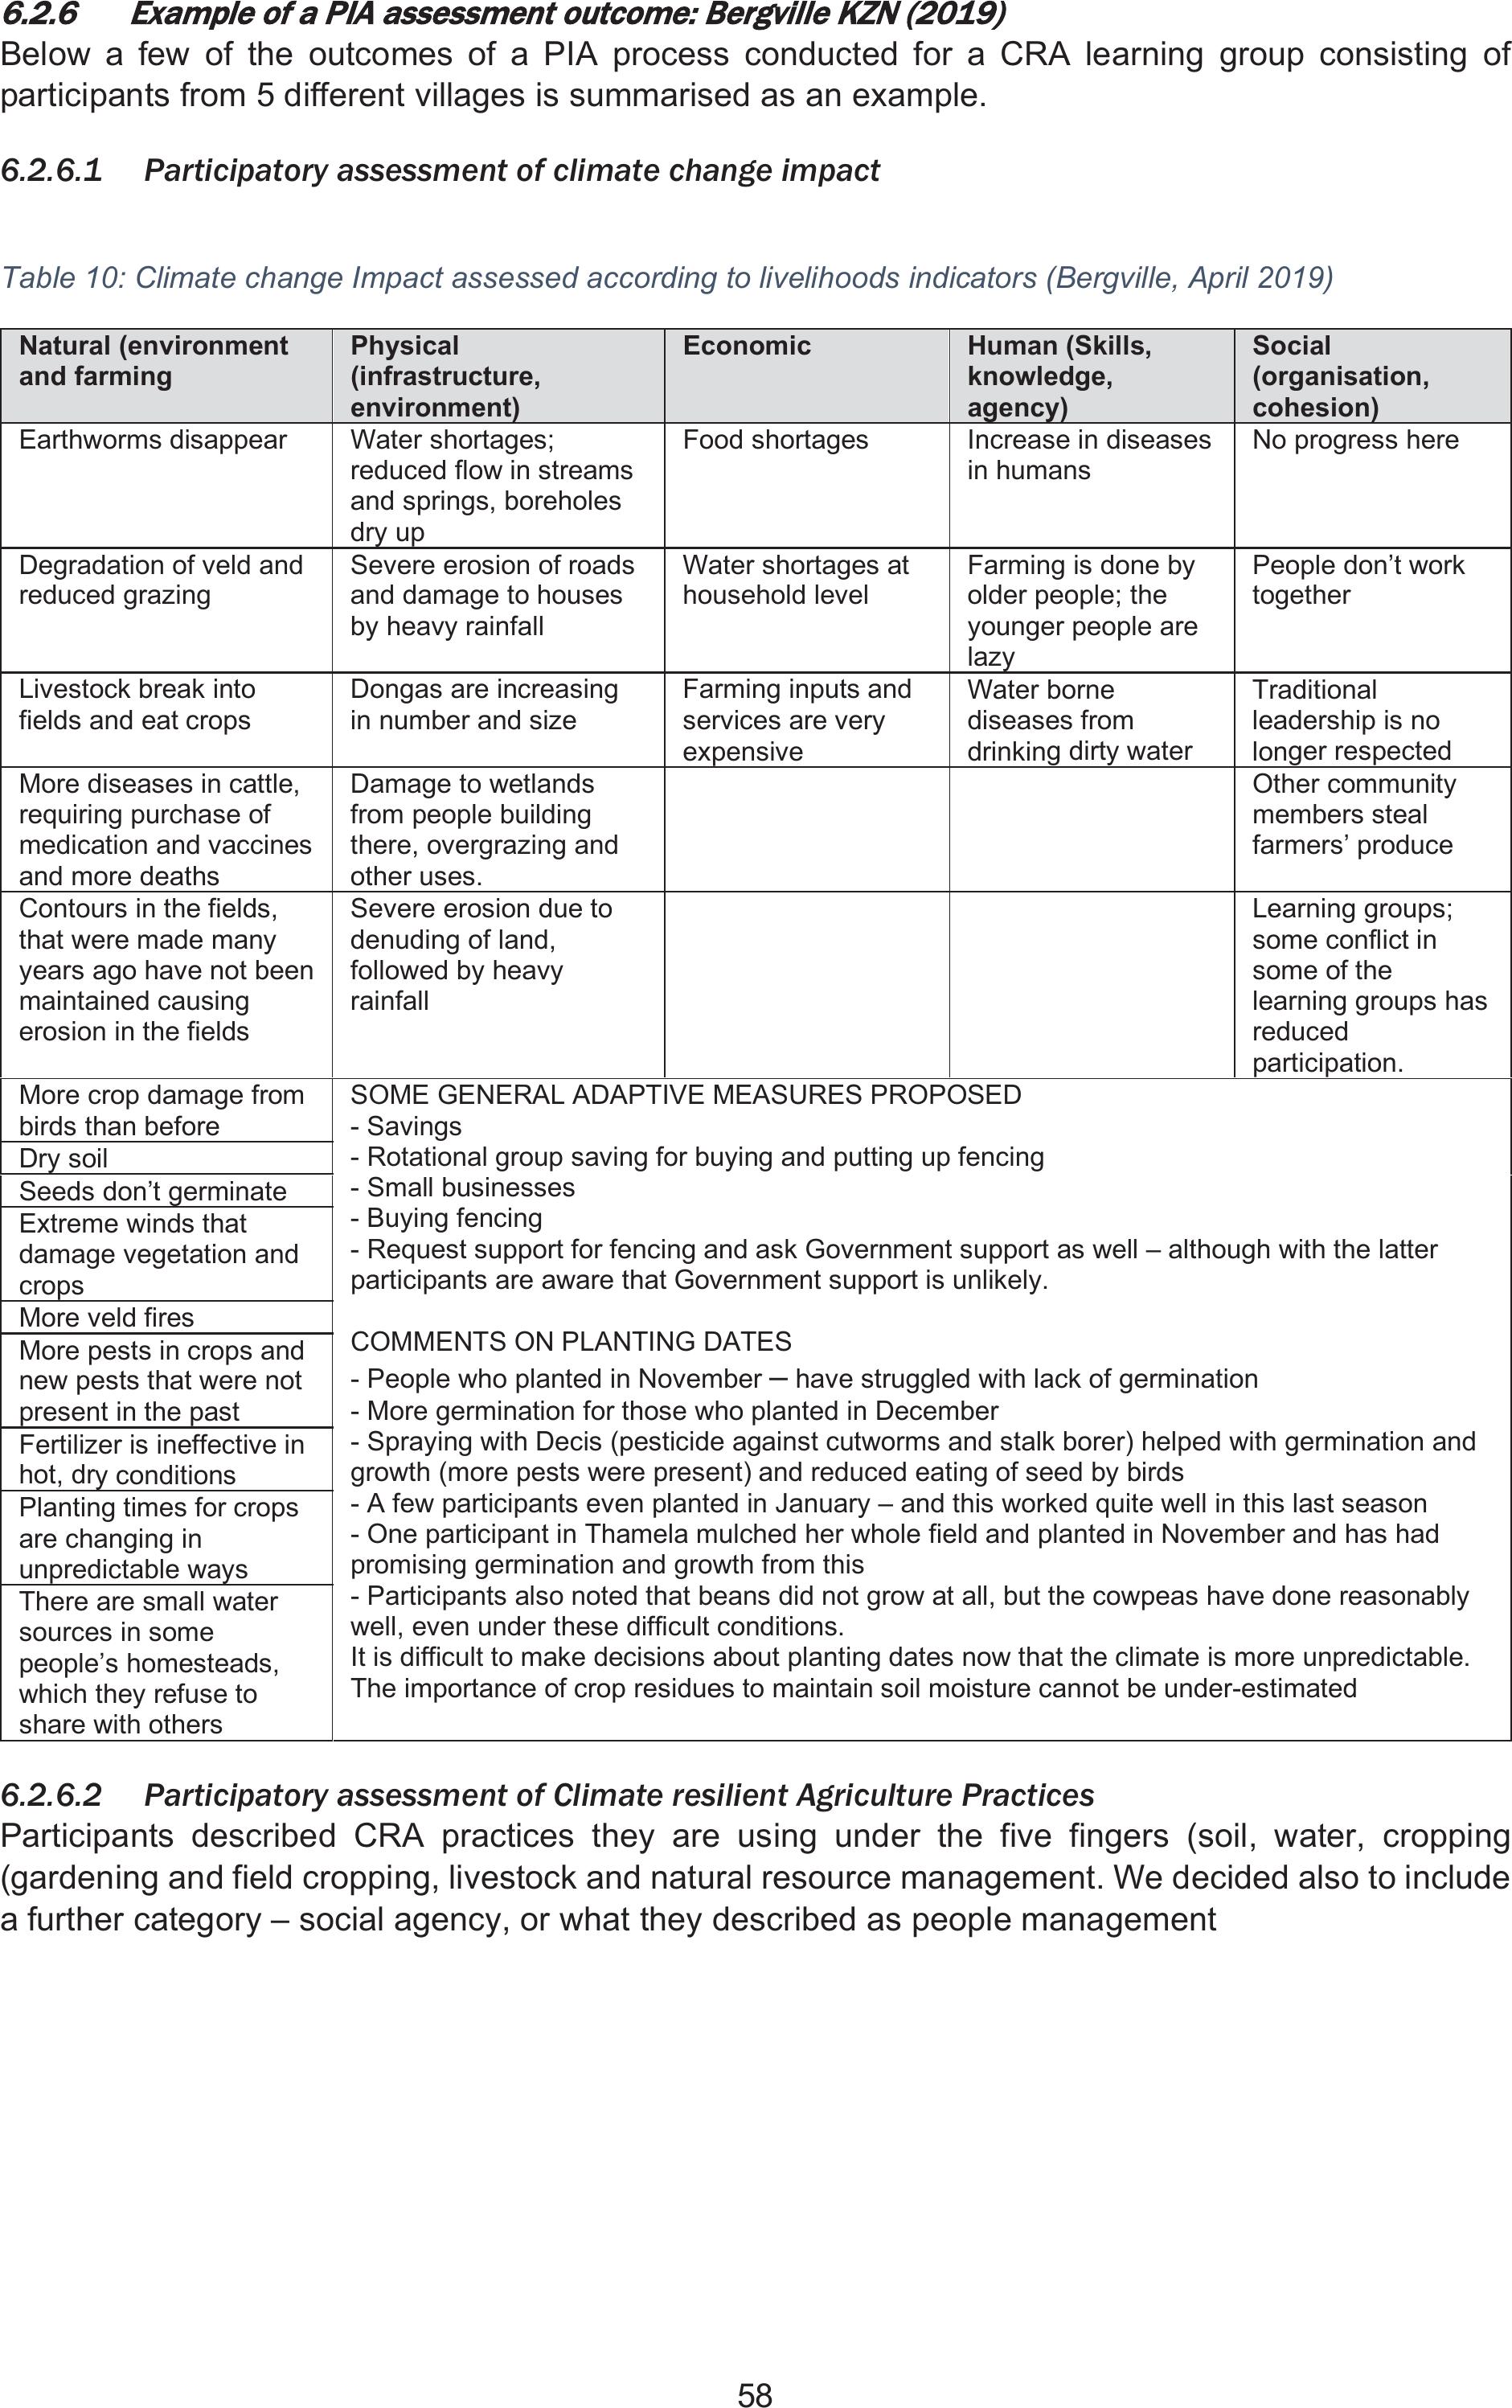
58
6
6.2.6
Example of a PIA assessment outcome: Bergville KZN (2019)
Below a few of the outcomes of a PIA process conducted for a CRA learning group consisting of
participants from 5 different villages is summarised as an example.
6.2.6.1Participatory assessment of climate change impact
Table 10: Climate change Impact assessed according to livelihoods indicators (Bergville, April 2019)
Natural (environment
and farming
Physical
(infrastructure,
environment
)
Economic Human (Skills,
knowledge,
a
g
enc
y)
Social
(organisation,
cohesion
)
Earthworms disappear Water shortages;
reduced flow in streams
and springs, boreholes
dr
y
up
Food shortages Increase in diseases
in humans
No progress here
Degradation of veld and
reduced grazing
Severe erosion of roads
and damage to houses
by heavy rainfall
Water shortages at
household level
Farming is done by
older people; the
younger people are
laz
y
People don’t work
together
Livestock break into
fields and eat crops
Dongas are increasing
in number and size
Farming inputs and
services are very
expensive
Water borne
diseases from
drinkin
g
dirt
y
water
Traditional
leadership is no
lon
g
er respected
More diseases in cattle,
requiring purchase of
medication and vaccines
and more deaths
Damage to wetlands
from people building
there, overgrazing and
other uses.
Other community
members steal
farmers’ produce
Contours in the fields,
that were made many
years ago have not been
maintained causing
erosion in the fields
Severe erosion due to
denuding of land,
followed by heavy
rainfall
Learning groups;
some conflict in
some of the
learning groups has
reduced
participation.
More crop damage from
birds than before
SOME GENERAL ADAPTIVE MEASURES PROPOSED
- Savings
- Rotational group saving for buying and putting up fencing
- Small businesses
- Buying fencing
- Request support for fencing and ask Government support as well – although with the latter
participants are aware that Government support is unlikely.
COMMENTS ON PLANTING DATES
- People who planted in November – have struggled with lack of germination
- More germination for those who planted in December
- Spraying with Decis (pesticide against cutworms and stalk borer) helped with germination and
growth (more pests were present) and reduced eating of seed by birds
- A few participants even planted in January – and this worked quite well in this last season
- One participant in Thamela mulched her whole field and planted in November and has had
promising germination and growth from this
- Participants also noted that beans did not grow at all, but the cowpeas have done reasonably
well, even under these difficult conditions.
It is difficult to make decisions about planting dates now that the climate is more unpredictable.
The importance of crop residues to maintain soil moisture cannot be under-estimated
Dr
y
soil
Seeds don’t
g
erminate
Extreme winds that
damage vegetation and
crops
More veld fires
More pests in crops and
new pests that were not
present in the past
Fertilizer is ineffective in
hot, dr
y
conditions
Planting times for crops
are changing in
unpredictable wa
y
s
There are small water
sources in some
people’s homesteads,
which they refuse to
share with others
6.2.6.2Participatory assessment of Climate resilient Agriculture Practices
Participants described CRA practices they are using under the five fingers (soil, water, cropping
(gardening and field cropping, livestock and natural resource management. We decided also to include
a further category – social agency, or what they described as people management

59
Table 11: CRA practices implemented in the Bergville area 2017-2019
Soil Water Crop (garden and field) Livestock Natural
Resources
People
Making compost Drip irrigation Diversified crops in
gardens; beetroot,
Chinese cabbage, carrots,
parsle
y
, th
y
me,
Vaccinations Savings
Use of goat and
cattle manure
Mulching Shade cloth tunnels Dipping Small
businesses
Canopy cover and
legumes (Lab-Lab)
Infiltration pits Beds: raised beds, trench
beds, eco-circles
Proper feed;
including from
fodder produced
Farmer centres
Diversified crops to
hold soil and prevent
erosion
Garden layout with
shallow furrows for
water harvesting
and retention
Tower gardens – fertility
and greywater
management
Addition of
supplements
Selling chickens
Greywater
management
Conservation agriculture;
including management of
residues
Limiting burning of
veld
Improved irrigation
practices
Inter cropping and crop
rotation
Planting grass:
ungwengwe and
kiku
y
u
Rainwater storage
in JoJo tanks and
drums
Diversified crops in fields;
different varieties of
maize, sorghum, millet,
legumes (e.g. cowpeas,
beans, Lab-lab), cover
crops
Spring protection Use of Decis Forte,
(Pyrethrins) for pest
control in fields
Buying JoJo tanks–
and negotiating with
water trucks to fill
these
Liquid manure
Mixed croppin
g
in
g
ardens
6.2.6.3Participatory assessment of Changes and benefits from CRA practices
This exercise consisted of doing a matrix ranking of practices farmers have used in the past year;
incorporating gardening, field cropping, livestock management, soil and water conservation and water
issues (access, availability). Impact indicators for this exercise were developed in 2 small groups by
asking participants to outline how they make decisions about which practices to use and what changes
they would observe.
Below is a summary of the Matrix for each of the 2 small groups. A process of proportional piling was
used for the scoring of each practice and indicator – where 100 counters were provided for each
indicator and the small group decided how these would be placed proportionally for each practice. In
this way participants can comment on; more or less, and how much more or less. The outcome of the
exercise is quantifiable in terms of gauging percentages.
For this matrix the practices were conflated to encompass all specific practices within that category:
¾Conservation agriculture; minimal tillage, soil cover, crop diversification
¾Savings: Village saving and loan associations, rotational saving in small groups towards
specific infrastructural needs, personal savings
¾Livestock; fodder production, vaccinations, dipping, supplementation
¾Gardening; bed design (trench beds, eco-circles, raised beds, tower gardens, tunnels,
mulching, mixed cropping, crop diversification, inclusion of herbs, infiltration pits and water
conservation furrows
¾Crop rotation; 3-4 crop rotations in field cropping
¾Intercropping: grain-legume and grain-cover crop intercropping options in field cropping and
¾Small businesses; including agricultural and non-agricultural businesses; sale of snacks in
schools, sewing, baking, poultry production, maize milling, etc.

60
The impact indicators developed by this group are of particular interest as they are multi-dimensional
talking at least two different aspects for each indicator. Additionally, the exercise was run so that each
practice is compared with the other practices when considering one of the indicators or criteria. This
greatly increases the value and reliability of the scores provided by the group.
The overall impact on livelihoods (which is seen as the combination of the indicators chosen by the
group) is shown under the ‘total” column. From this, the participants clearly consider the Conservation
Agriculture (CA) process as the most significant, followed by gardening, small businesses, savings and
livestock – in decreasing order.
6.3 RESILIENCE SNAPSHOTS
The resilience snapshots are individual questionnaires that provide an in-depth assessment of the
impact of the implementation of CRA practices on a person’s livelihood. Proxy indicators for resilience
are built up from the interview.
Below is an outline of the questionnaire
6
6.3.1
The individual climate change resilience questionnaire
RESILIENCE SNAPSHOT
Date
Province
Village
Increased
farming (Size)
Before
(Size in
sqm
)
Now (Size in
sqm)
Comment: Percentage increase
Gardening
Field cropping
Livestock
Trees, natural
resources
Increased
diversity in
farming
Y/N beforeY/N now Comment:
Gardening
Field cropping
Soil;
health
and
fertility
Money;
income
and
savings
Productivity;
acceptance
of practice,
saving in
farming –
equipment,
labour
Knowledge;
increased
knowledge
and ability
to use
Food; how
much
produced
and how
healthy
Water;
use
and
access
Social
agency;
Support,
empowerment
Total
Conservation
Agriculture
22 21 26 28 18 23 18 156
Savings 6 15 14 1512 11 15 88
Livestock 19 11 187 5 12 11 83
Gardening 14 15 1213 15 17 21 107
Crop rotation 16 12 13 12 12 15 10 90
Intercropping 12 13 1512 11 11 9 83
Small
businesses
11 17 15 10 20 11 9 93
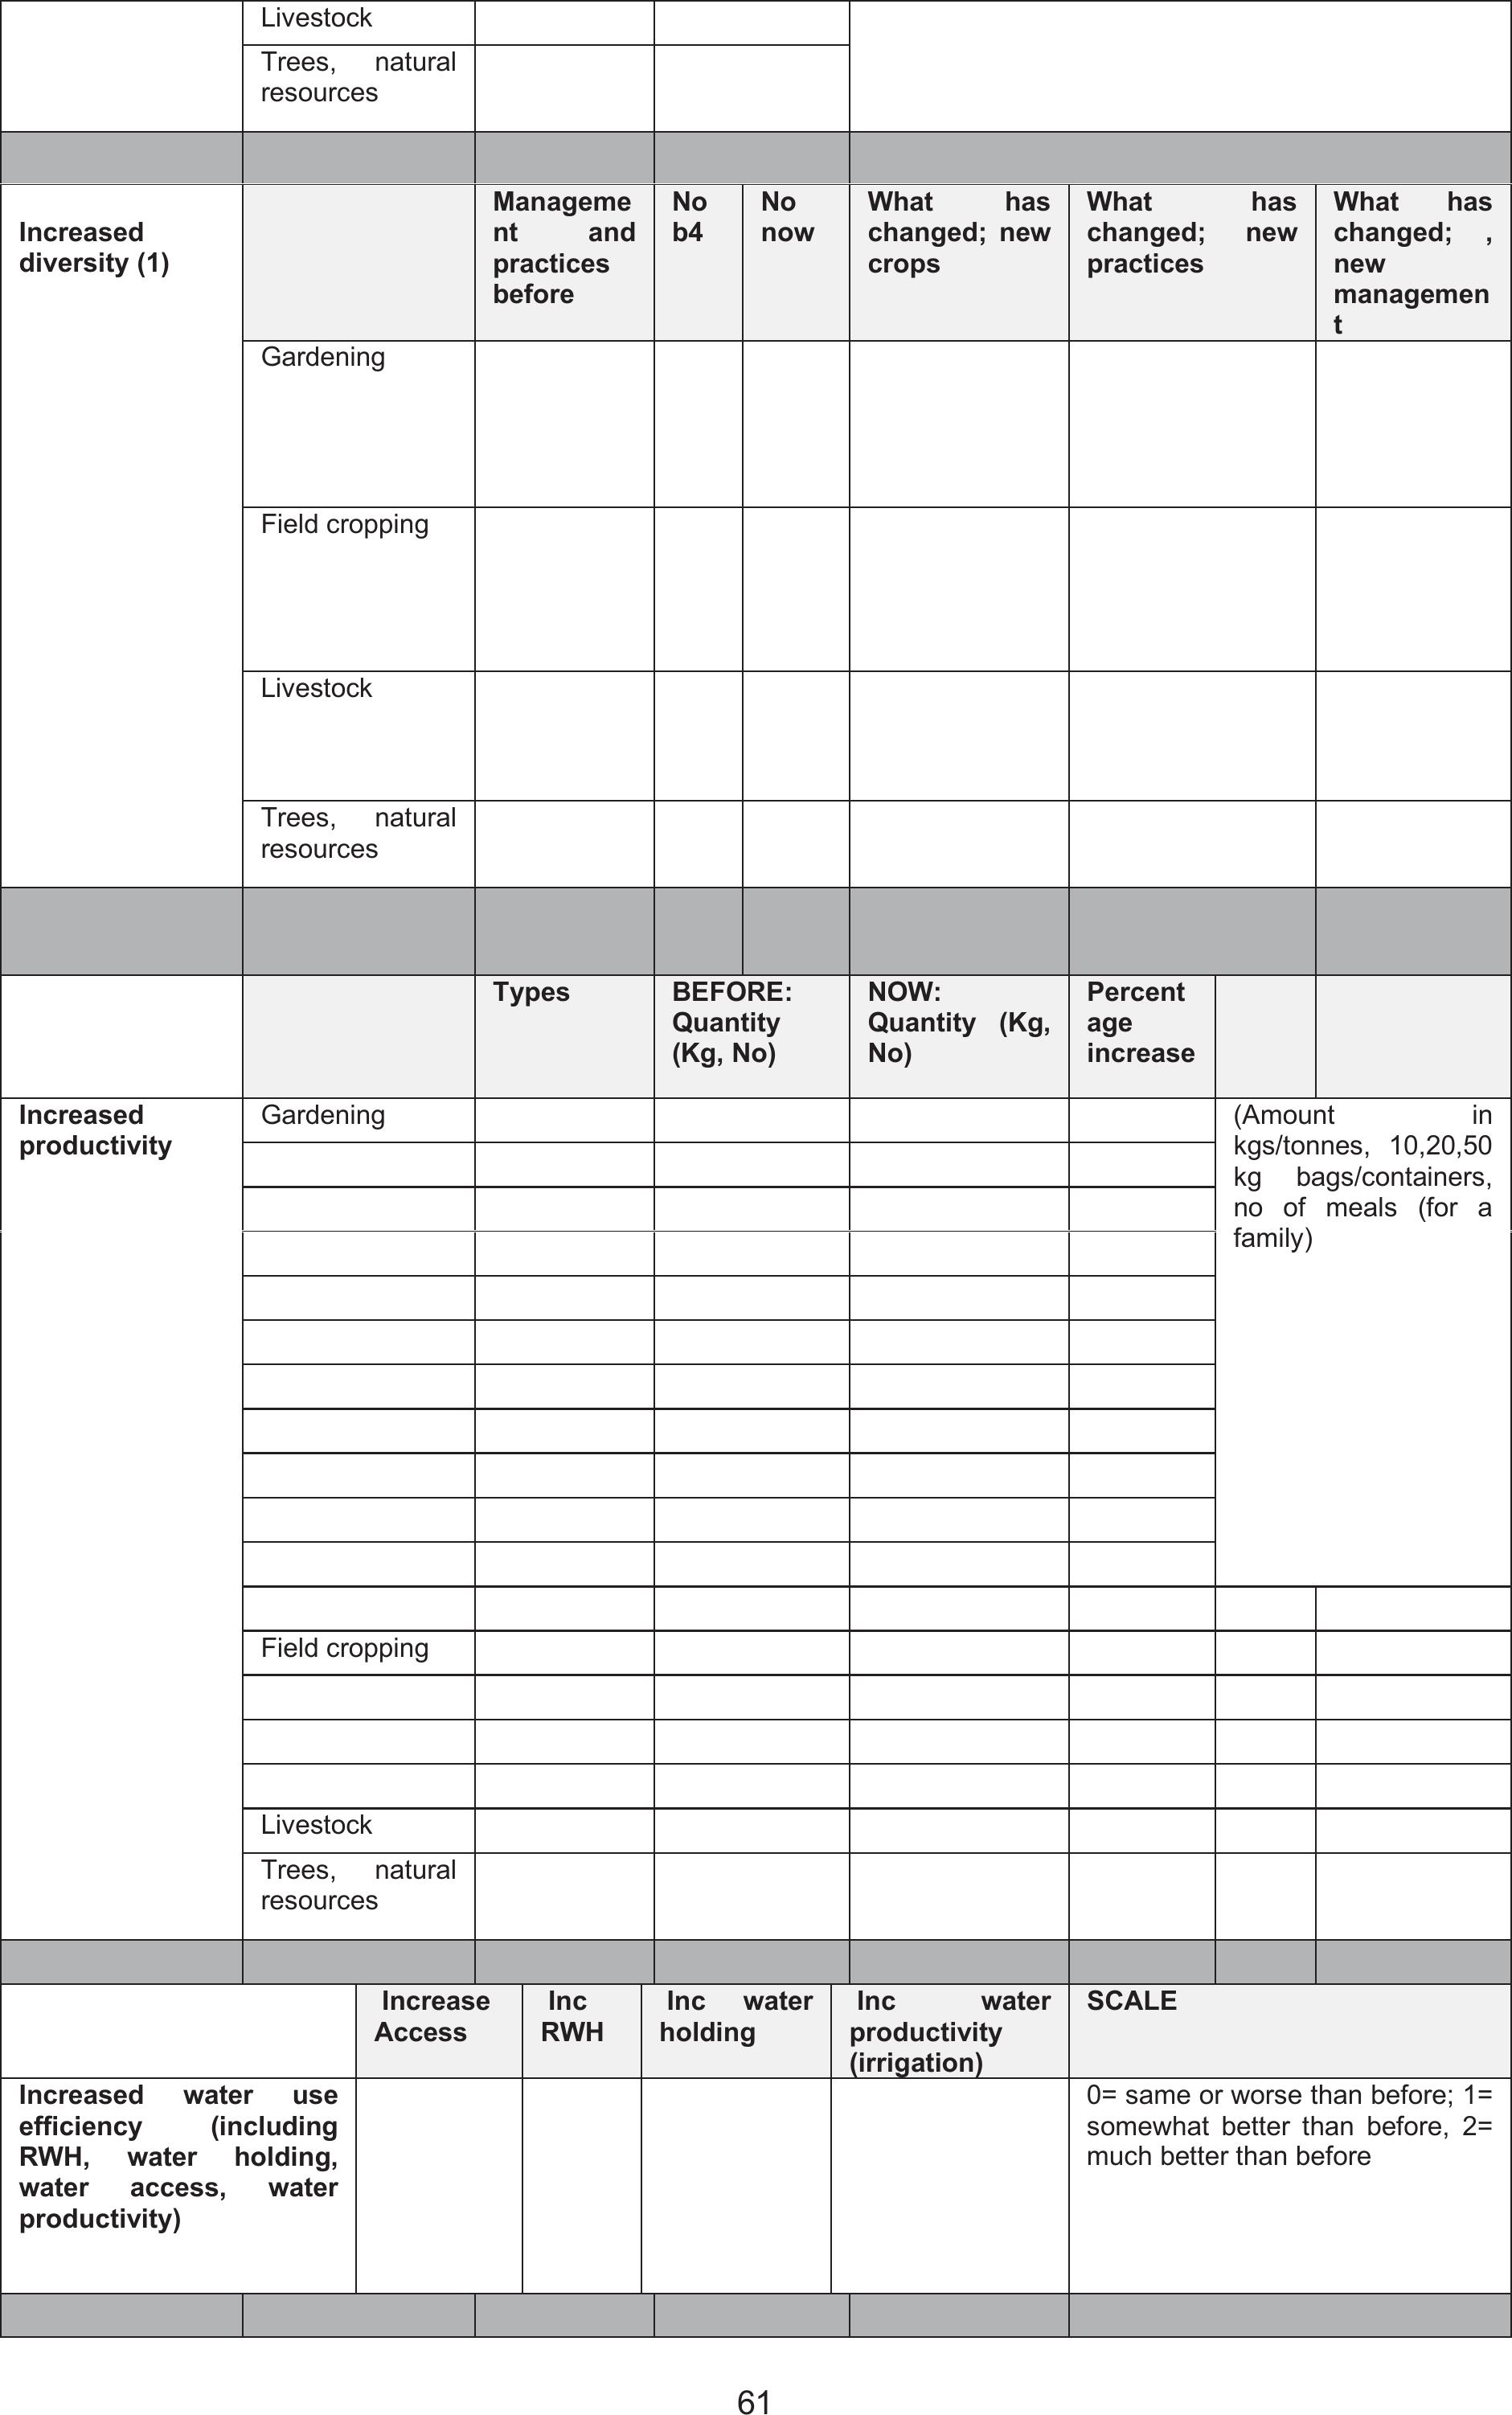
61
Livestock
Trees, natural
resources
Increased
diversity (1)
Manageme
nt and
practices
before
No
b4
No
now
What has
changed; new
crops
What has
changed; new
practices
What has
changed; ,
new
managemen
t
Gardening
Field cropping
Livestock
Trees, natural
resources
Types BEFORE:
Quantity
(Kg, No)
NOW:
Quantity (Kg,
No)
Percent
age
increase
Increased
productivity
Gardening (Amount in
kgs/tonnes, 10,20,50
kg bags/containers,
no of meals (for a
family)
Field cropping
Livestock
Trees, natural
resources
Increase
Access
Inc
RWH
Inc water
holding
Inc water
productivity
(
irri
g
ation
)
SCALE
Increased water use
efficiency (including
RWH, water holding,
water access, water
productivity)
0= same or worse than before; 1=
somewhat better than before, 2=
much better than before
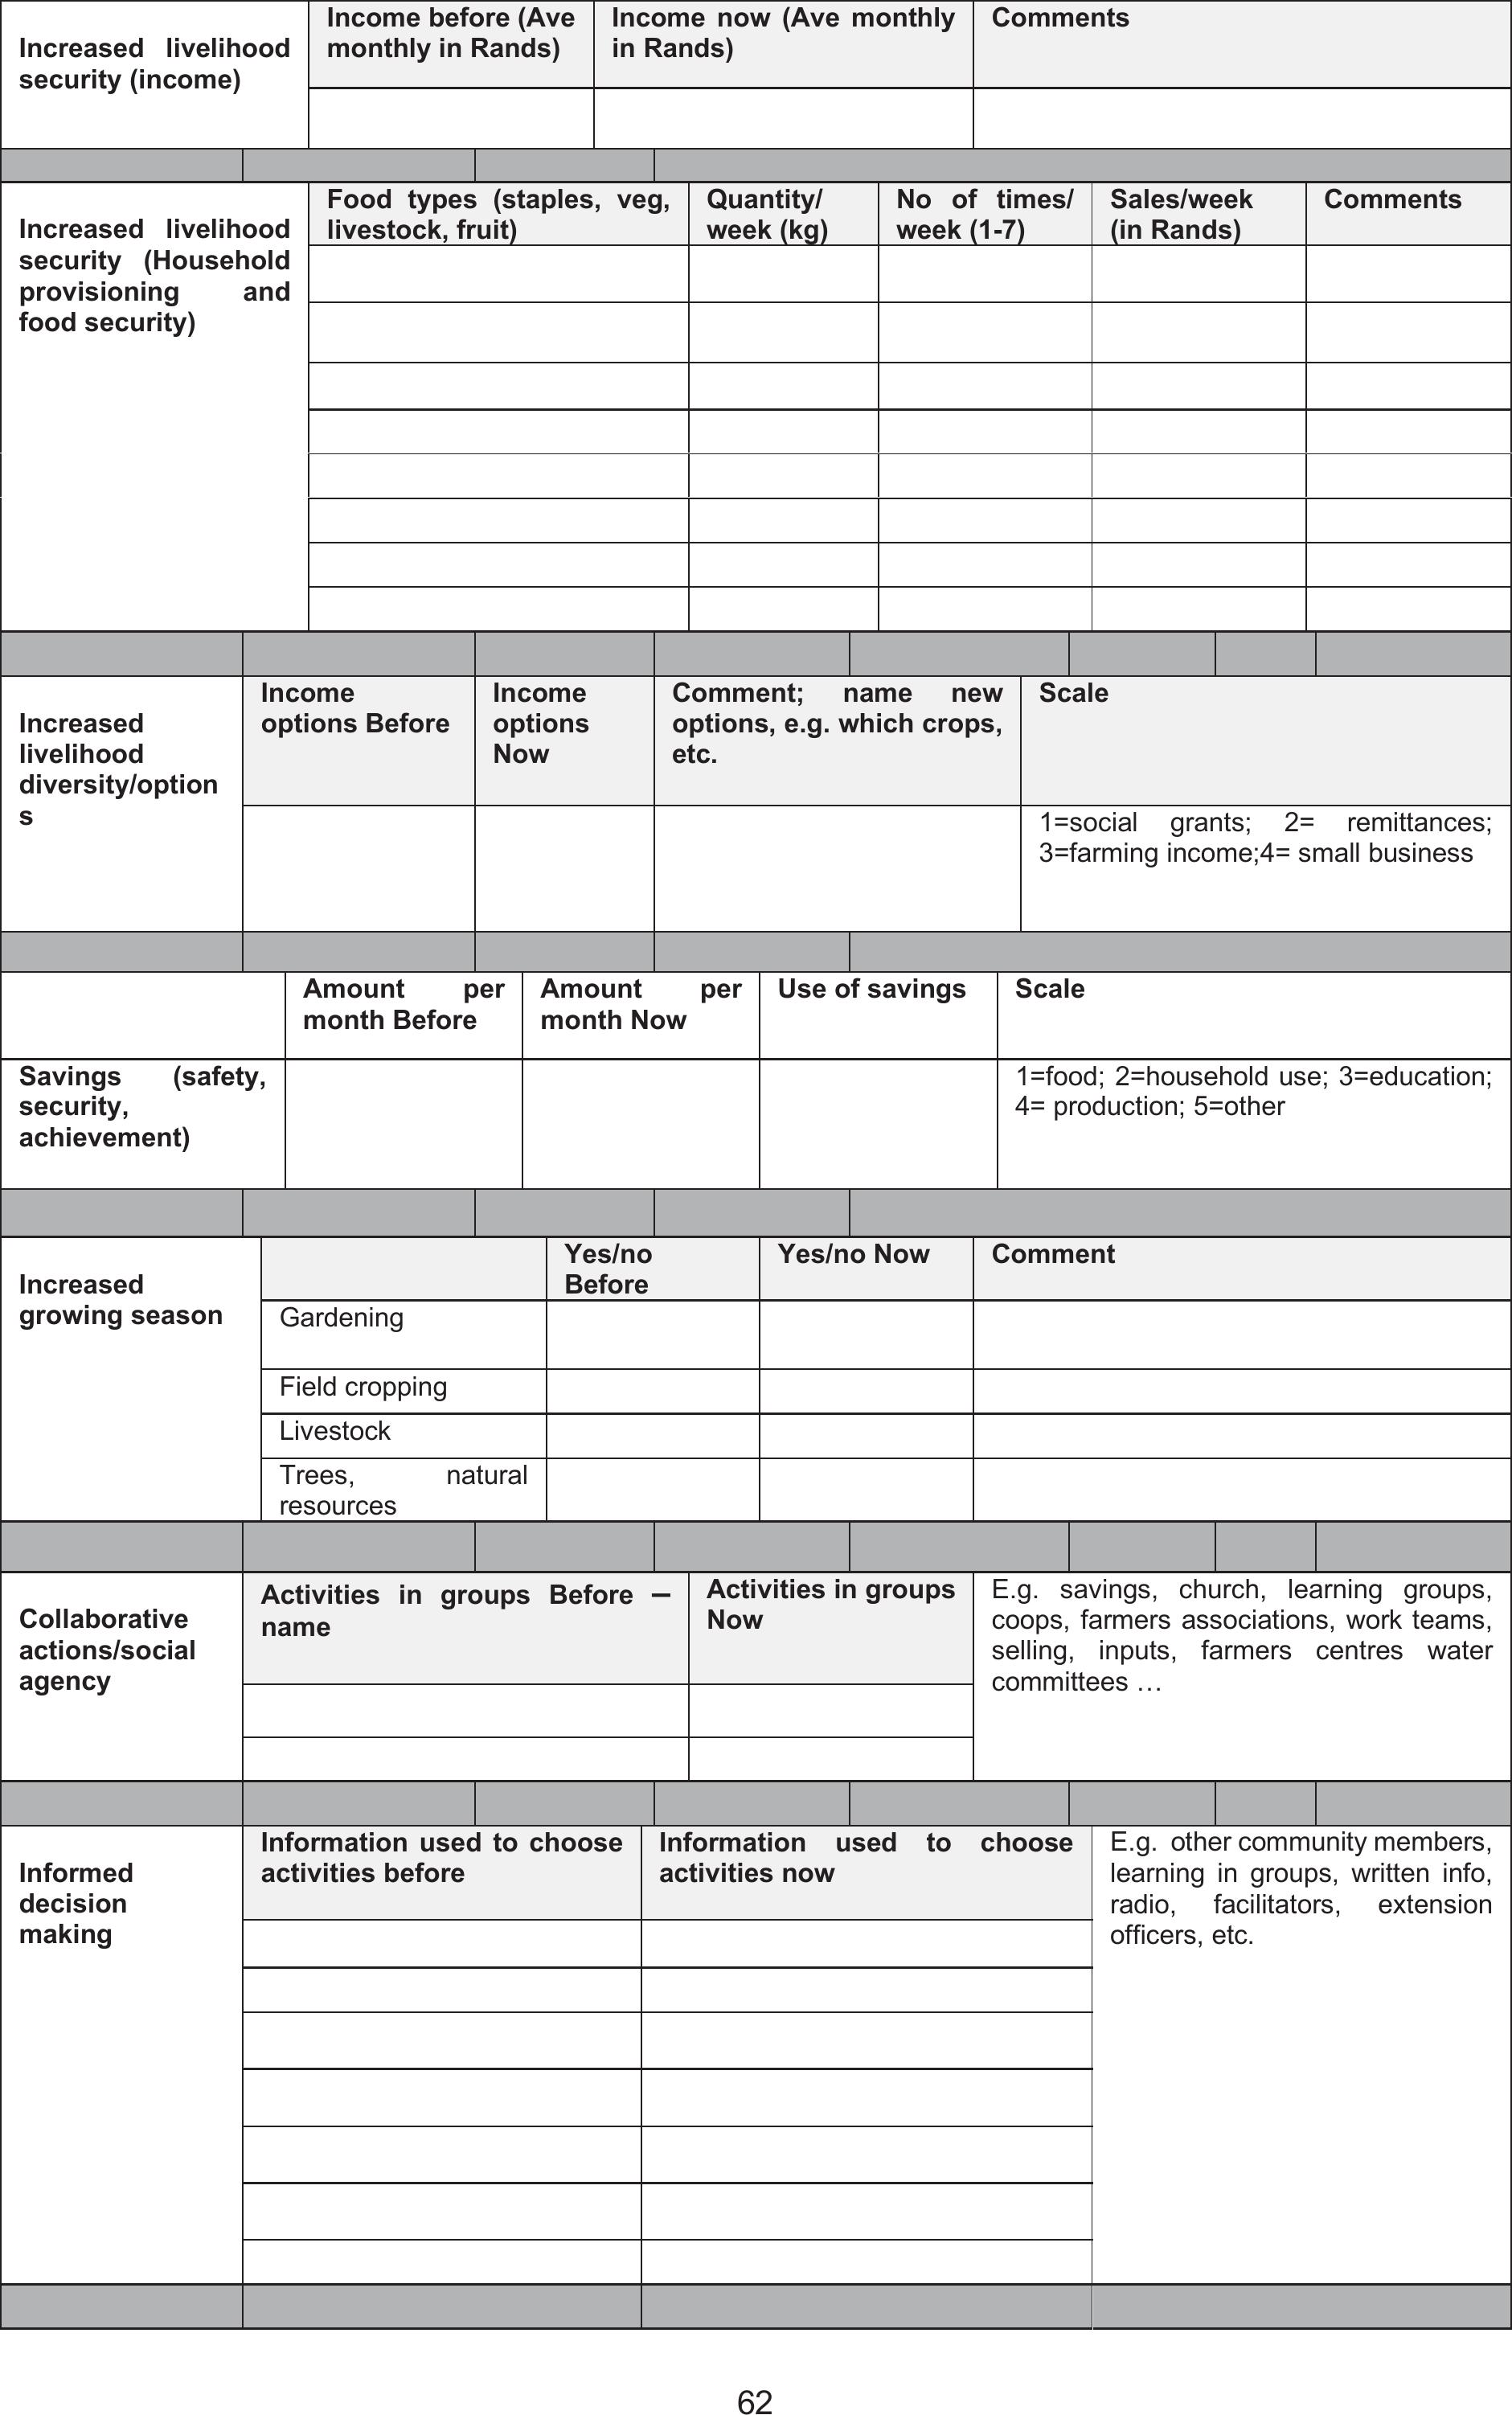
62
Increased livelihood
security (income)
Income before (Ave
monthly in Rands)
Income now (Ave monthly
in Rands)
Comments
Increased livelihood
security (Household
provisioning and
food security)
Food types (staples, veg,
livestock, fruit
)
Quantity/
week
(
k
g)
No of times/
week
(
1-7
)
Sales/week
(
in Rands
)
Comments
Increased
livelihood
diversity/option
s
Income
options Before
Income
options
Now
Comment; name new
options, e.g. which crops,
etc.
Scale
1=social grants; 2= remittances;
3=farming income;4= small business
Amount per
month Before
Amount per
month Now
Use of savings Scale
Savings (safety,
security,
achievement)
1=food; 2=household use; 3=education;
4= production; 5=other
Increased
growing season
Yes/no
Before
Yes/no Now Comment
Gardening
Field cropping
Livestock
Trees, natural
resources
Collaborative
actions/social
agency
Activities in groups Before –
name
Activities in groups
Now
E.g. savings, church, learning groups,
coops, farmers associations, work teams,
selling, inputs, farmers centres water
committees …
Informed
decision
making
Information used to choose
activities before
Information used to choose
activities now
E.g. other community members,
learning in groups, written info,
radio, facilitators, extension
officers, etc.

63
Positive
mindsets
Rate your
mindset Before
Rate your
mindset
now
SCALE: 0=less positive about the future, 1=the same, 2=more
positive about the future, 3=much more positive
6
6.3.2
Example of a resilience snapshot assessment for 12 participants in Bergville, KZN April 2019
Here the individual resilience assessments for 12 participants have been combined and summarised.
Summaries of the responses to specific questions are summarised in bullet points and tables.
6.3.2.1Learning and change
What have you learnt about dealing with CC and climatic extremes?
¾I have learnt that practices such as trench beds and CA provide good growth and yields, despite
difficult weather conditions. Also, these practices are cheap. We get more food than we did
before and will now be able to continue farming
¾Adaptive practices like mulching help to deal with increased heat and water stress
¾Practices such as trench beds, eco-circles, mulching and mixed cropping enables the soil to
hold moisture for longer and withstand the heat and dry spells.
What is your experience regarding the impact of CC on your life?
¾This season we had drought; the beans did not grow and maize is stunted. I fear we will not
have enough food
¾Cattle have been negatively impacted – more disease and deaths as grazing diminishes
¾The climate is changing: Low rainfall during the planting season and high temperatures are
affecting farming activities
¾I have not experienced climate change – I do not have water issues (participant in Midlands of
KZN)
¾Climate change has destabilised our planting patterns and has created a lot of uncertainty about
planting dates for both summer and winter crops
Do you share your knowledge and experiences with the learning group or community
members?
¾Yes, I talk to my neighbours about the gardening practices, so that they can also try and
revive their gardens
¾Yes, I have talked to neighbours, some come and visit to see the garden and experiments
and some have even taken pictures.
¾Yes, I talk to my neighbours and friends and invite them to the learning group sessions if
they are not members yet.
How do you share the knowledge gained with other members of your community?
¾Discussions at savings meetings, at the springs when we collect water
¾When people visit, I show them my garden
What helps you to learn more about new innovations and information?
No
(N=6)
Comments
Listening to other farmers experiences
and experiments
6 I get motivated by other farmers’ work, get new ideas such as
planting potatoes in bags
By doing and experimenting in own
garden
4 This helps me to know how good the practices are. have tried
a no of experiments and included my own ideas
Motivated by other farmers work and
experiences
5 Learnt about raised beds in Msinga
Learning workshops 5 I find them useful because I always hear new information and
experiences from the facilitator and farmers
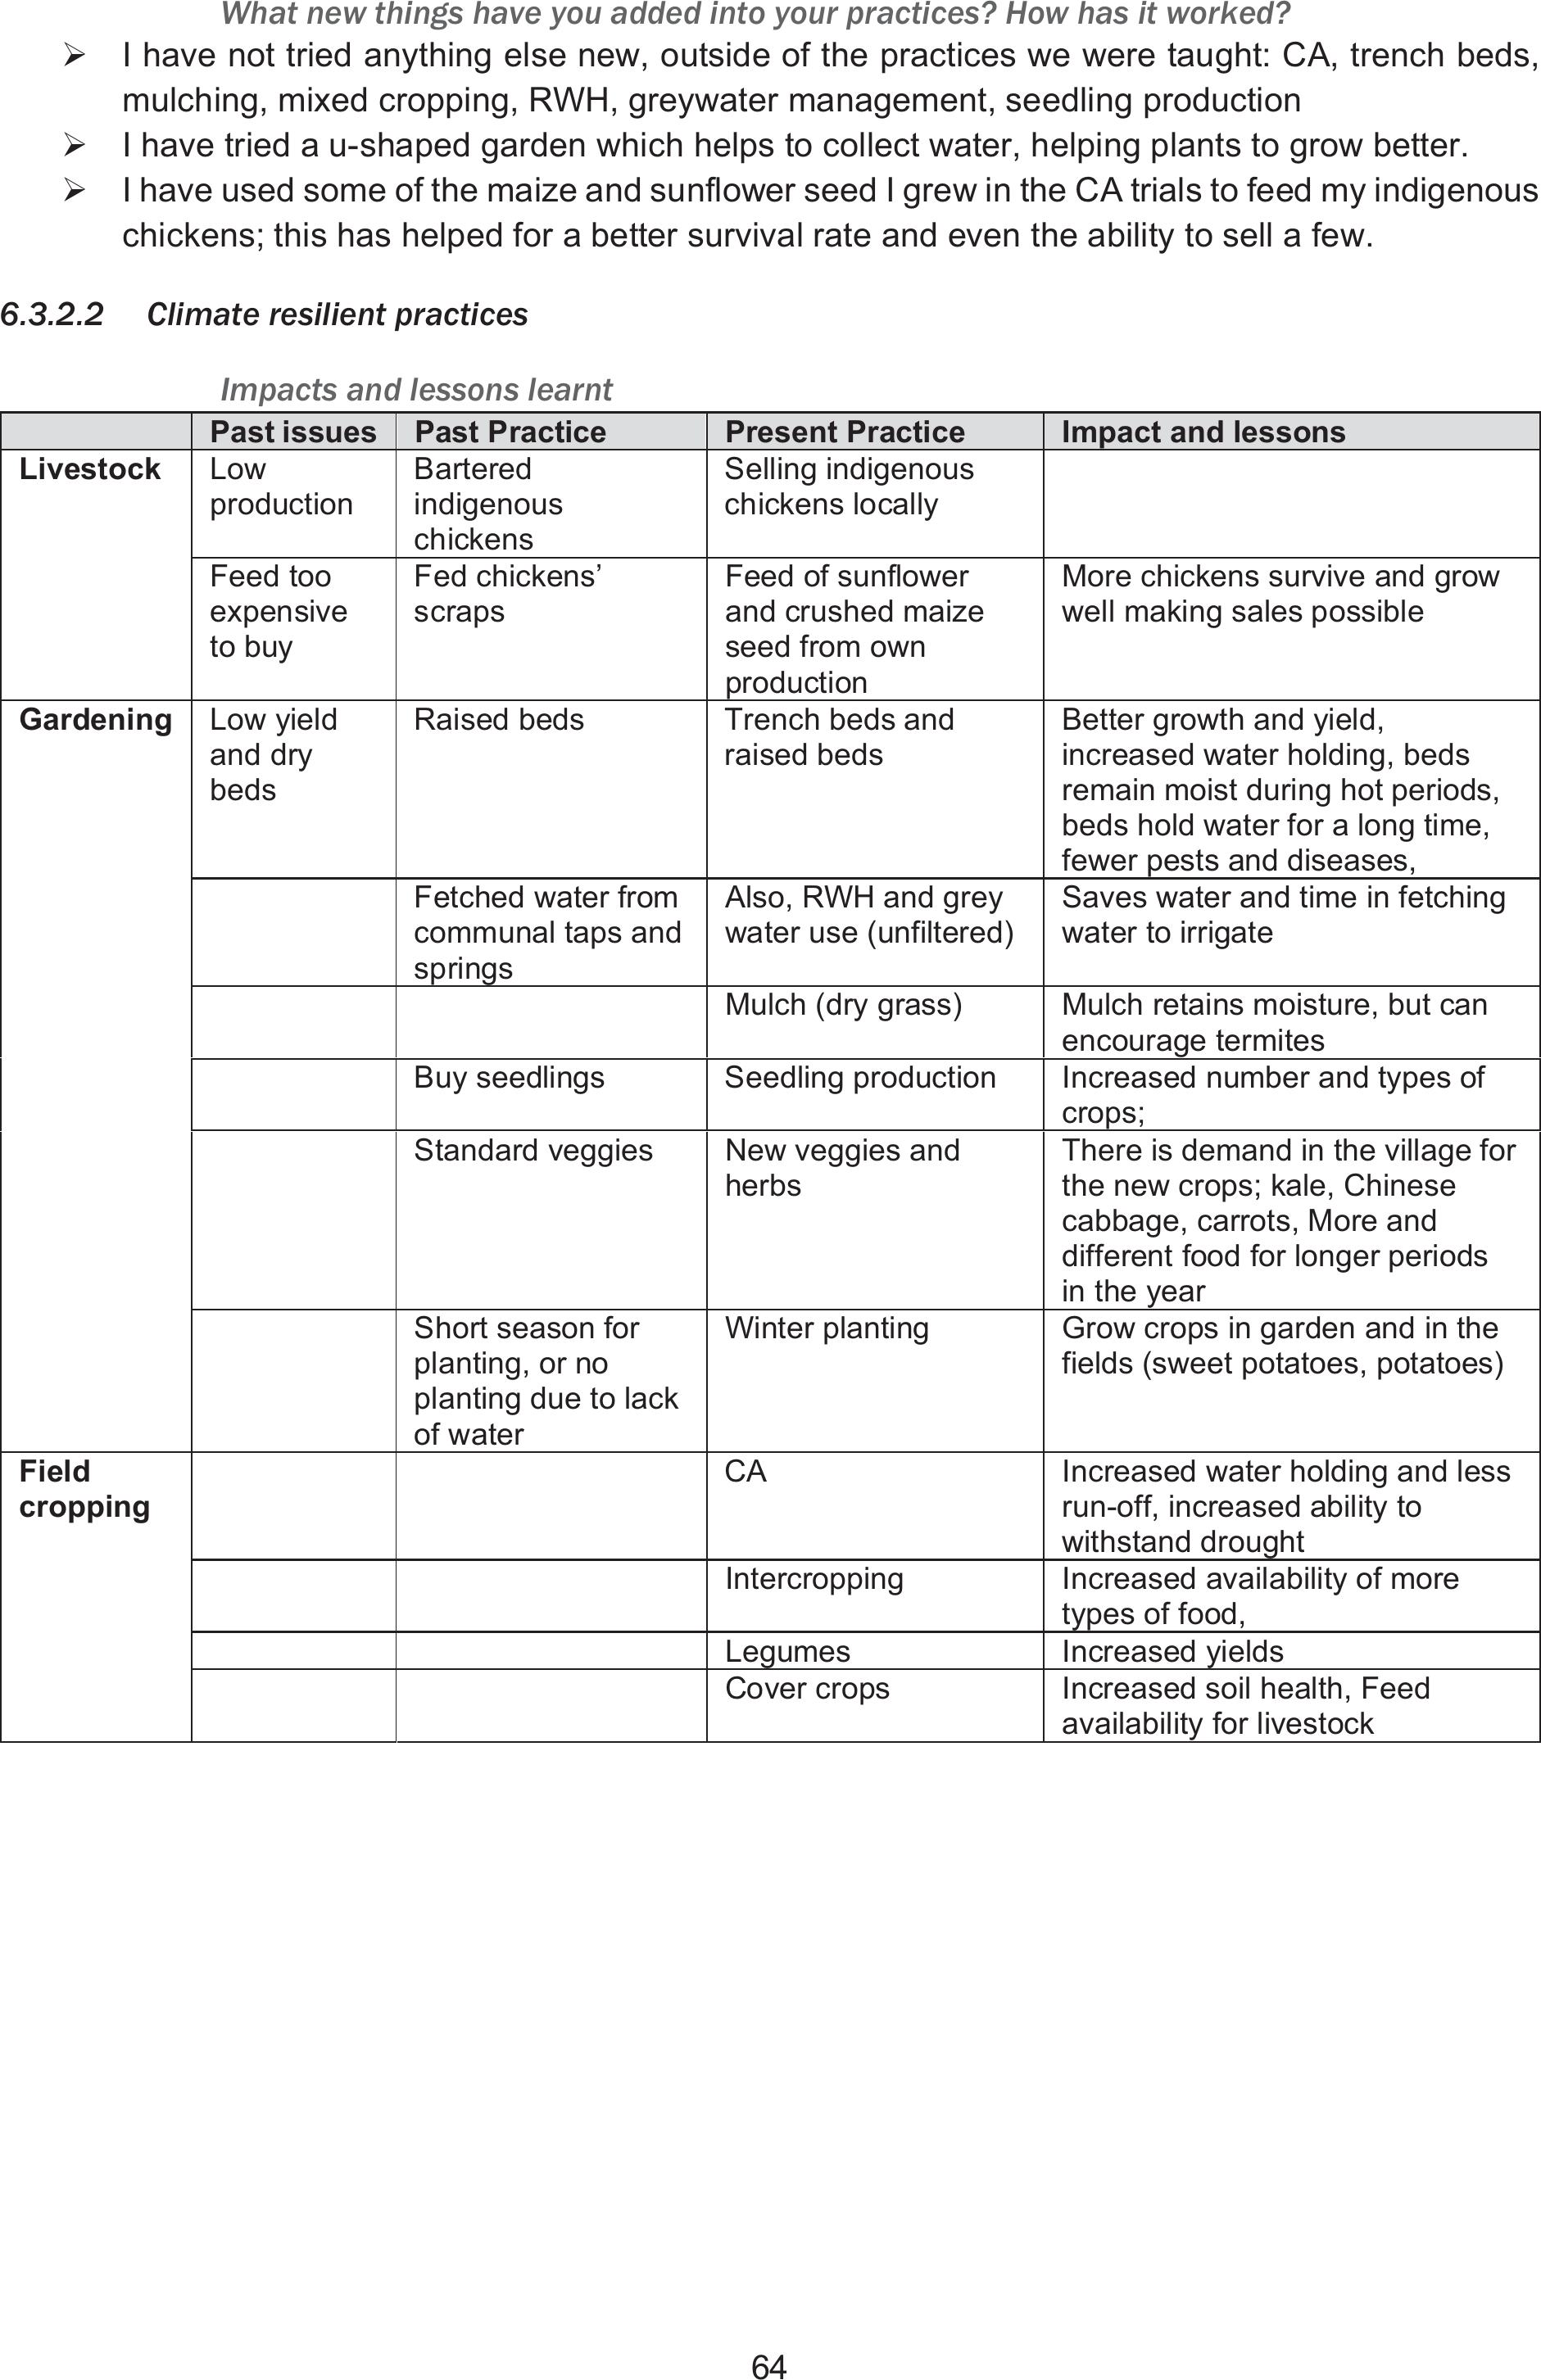
64
What new things have you added into your practices? How has it worked?
¾I have not tried anything else new, outside of the practices we were taught: CA, trench beds,
mulching, mixed cropping, RWH, greywater management, seedling production
¾I have tried a u-shaped garden which helps to collect water, helping plants to grow better.
¾I have used some of the maize and sunflower seed I grew in the CA trials to feed my indigenous
chickens; this has helped for a better survival rate and even the ability to sell a few.
6.3.2.2Climate resilient practices
Impacts and lessons learnt
Past issues Past Practice Present Practice Impact and lessons
Livestock Low
production
Bartered
indigenous
chickens
Selling indigenous
chickens locally
Feed too
expensive
to buy
Fed chickens’
scraps
Feed of sunflower
and crushed maize
seed from own
production
More chickens survive and grow
well making sales possible
Gardening Low yield
and dry
beds
Raised beds Trench beds and
raised beds
Better growth and yield,
increased water holding, beds
remain moist during hot periods,
beds hold water for a long time,
fewer pests and diseases,
Fetched water from
communal taps and
springs
Also, RWH and grey
water use (unfiltered)
Saves water and time in fetching
water to irrigate
Mulch (dry grass) Mulch retains moisture, but can
encourage termites
Buy seedlings Seedling production Increased number and types of
crops;
Standard veggies New veggies and
herbs
There is demand in the village for
the new crops; kale, Chinese
cabbage, carrots, More and
different food for longer periods
in the year
Short season for
planting, or no
planting due to lack
of water
Winter planting Grow crops in garden and in the
fields (sweet potatoes, potatoes)
Field
cropping
CA Increased water holding and less
run-off, increased ability to
withstand drought
Intercropping Increased availability of more
types of food,
Legumes Increased yields
Cover crops Increased soil health, Feed
availability for livestock

65
Assessment of impact for CRA practices tried out using local indicators
Note: Scoring: -1 = worse than normal practice; 0 = no change; 1 = some positive change; 2 = medium positive change; 3 = highly
positive change
Name of practice
Soil
Water
Productivity
Labour
Pest and
disease
control
Cost and
maintenance
Livelihoods
Adaptation
1 Trench beds 2 2 3 -1 2 0 2 3
2 RWH 0 3 1 -1 0 -1 1 3
3 Mulching2 2 3 0 3 0 1 2
4 Tower garden2 3 3 2 0 0 2 2
5 Planting basins 0 2 2 0 0 1 1 1
6 Raised beds, with mulch1 2 2 1 0 1 0 1
7 eco-circle2 3 2 -1 1 0 1 1
8 CA; w intercropping, legumes,
cover crops 3 2 3 1 1 0 2 2
9 Using goat manure
(composted in a kraal)3 1 2 0 1 0 1 1
Resilience snapshot
This table is a summary of the overall questionnaire (in this case for 12 participants combined).
Resilience indicators Rating for increase Comment
Increase in size of farming
activities
Gardening – 18%
Field cropping – 63%
Livestock – 31%
Cropping areas measured, no of livestock
assessed
Increased farming activities No Most participants involved in gardening, field
cropping and livestock management
Increased season YesFor field cropping and gardening – autumn
and winter options
Increased crop diversity Crops: 12 new crops
Practices: 8 new practices
Management options include; drip irrigation,
tunnels, no-till planters, JoJo tanks, RWH
drums,
Increased productivity Gardening – 72%
Field cropping – 79%
Livestock – 25%
Based on increase in yields
Increased water use
efficiency
25% Access, RWH, water holding capacity and
irrigation efficiency rated
Increased income 13% Based on average monthly incomes
Increased household food
provisioning
Maize – 20 kg/week
Vegetables – 7 kg/week
Food produced and consumed in the
household
Increased savings R150.00/monthAverage of savings now undertaken
Increased social agency
(collaborative actions)
2 Villages savings and loan associations and
learning groups
Increased informed decision
making
5 Own experience, local facilitators, other
farmers, facilitators, extension officers
Positive mindsets2-3 More to much more positive about the future:
Much improved household food security and
food availability
66
7 REFERENCES
Africheck, 2018. FACTSHEET: South Africa’s official poverty numbers. URL:
https://africacheck.org/factsheets/factsheet-south-africas-official-poverty-numbers/ Accessed
2019/04/05
Arslan, A. (2014).Climate Smart Agriculture. Climate change, agriculture and food security. EPIC,
FAO. Centre for Development Innovation, WUR. September 17, 2017. Powerpoint.
AWARD. (2017). Progress Report. Quarter 2. 2016-2017 FY. Resilience in the Limpopo – Olifants.
Association for Water and Rural Development. Available: www.award.org.za/project/resilience-in-the-
limpopo-basin
Batty, C. (2017). The New Face of Governance: How to Coactively Manage the New Sourcing
Relationship. ISG White Paper. Information Services Group, Inc.
Brock, K. and Pettit, J. (2007). Springs of Participation: Creating and Evolving Methods for Participatory
Development. Warwickshire, UK: Practical Action
Catley, A., Burns, J., Abebe, D. and Suji, M. (2014). Participatory Impact Assessment: A Design Guide.
Somerville USA. Feinstein International Centre, TUFTS University.
Cousins, B. (2016). Why South Africa needs fresh ideas to make land reform a reality. The
Conversation: May 31, 2016. http://theconversation.com/why-south-africa-needs-fresh-ideas-to-make-
land-reform-a-reality-60076
Dale, E. (1969) Audio visual methods in teaching, third edition. New York: The Dryden Press; Holt,
Rinehart and Winston.
DEA (Department of Environmental Affairs). 2013. Long-Term Adaptation Scenarios Flagship Research
Programme (LTAS) for South Africa. Summary for Policy-Makers. Pretoria, South Africa.
DEA (Department of Environmental Affairs). 2017. National Climate Change Adaptation Strategy
Republic of South Africa. Pretoria. South Africa.
Denison, J. and Manona, S. (2007).Principles, Approaches and Guidelines for the Participatory
Revitalization of Smallholder Irrigation Schemes. Volume 2 of 2. WRC, Pretoria, South Africa.
Emirbayer, M. and Mische, A. (1998). What Is Agency? American Journal of Sociology, Vol. 103, No. 4
(pp. 962-1023). Published by: The University of Chicago Press Stable. URL:
http://www.jstor.org/stable/10.1086/231294 Accessed 2019/03/26
FAO (2013). Climate Smart Agriculture Sourcebook. Food and Agriculture Organization of the United
Nations. 2013.
Fenton, A., Reid, H. and Wright, H. (2015). Ten principles to help assess funding for local climate
change adaptation. IIED Briefing, pp. 1-4.
Hansford, B. (2010). Adaptation-protecting natural resources. Footsteps No 82, pp. 12-13.
Poggenpohl, S. (2015). Communities of Practice in Design Research. She Ji: The Journal of Design,
Economics and Innovation, Vol 1, Issue1, pp. 44-57.
Hartmann, M. (2009). Participatory Innovation Development and Extension in Ethiopia: A Case Study.
Proceedings of the 25th Annual Meeting, InterContinental San Juan Resort. Puerto Rico: AIAEE.
IPCC (2014). Summary for Policymakers. In: Climate Change 2014: Mitigation of Climate Change.
Contribution of Working Group III to the Fifth Assessment Report of the Intergovernmental Panel on
Climate Change [Edenhofer, O., R. Pichs-Madruga, Y. Sokona, E. Farahani, S. Kadner, K. Seyboth, A.
Adler, I. Baum, S. Brunner, P. Eickemeier, B. Kriemann, J. Savolainen, S. Schlömer, C. von Stechow,
T. Zwickel and J.C. Minx (eds.)]. Cambridge University Press, Cambridge, United Kingdom and New
York, NY, USA.
67
Kruger, E. and Gilles, J. (2014). A Review of Participatory Agricultural Research and Development in
South Africa and KwaZulu-Natal.www.mahlathini.org.
Kruger, E. and Selala, S. (2017). AWARD. Resilience in the Limpopo-Olifants Programme. Agricultural
Support Initiative. Joint community-based review of learnings to date and local facilitator training.
Sedawa_20170424 -Internal report.
Lave, J. and Wenger, E. (1991).Situated Learning: Legitimate Peripheral Participation. Cambridge:
Cambridge University Press. ISBN 0-521-42374-0.
Lotz-Sisitka, H. and Pesanayi, T. (2019). Mediation Processes to support systems approaches to
knowledge flow in Water for Food Social Learning Networks. Rhodes University, South Africa. WRC
Project No K5/2713/4. Project Title: Amanzi [water] for Food': Developing a social learning network
approach to knowledge dissemination and uptake in the agricultural learning system, focusing on the
management, use and conservation of water for small scale farming and household food production.
Manderson, A., Kubayi, N. and Drimie, S. (2016). The impact of the South African drought as
experienced by smallholder farmers over the June 2015-February 2016 period in the Mopani District of
Limpopo, South Africa. (pp. 1-8). Stellenbosch: Agroecology Awareness Project, South African Food
Lab.
McCarthy, N. and Brubaker, J. (2014). Climate-smart agriculture & resource tenure in Sub-Saharan
Africa: a conceptual framework, Rome, FAO.
National Learning Infrastructure Initiative (2002). Retrieved from Community of Practice Design Guide:
a step by step guide for designing and cultivating communities of practice in higher education.
http://net.educause.edu/ir/library/pdf/nli0531.pdf
Nay, J., Chu, E., Gallagher, D. and Wright, H. (2014). A review of decision-support models for
adaptation to climate change in the context. Climate and Development (6:4, DOI:
10.1080/17565529.2014.912196), 357-367.
New, C. (2007). Structure, Agency and Social Transformation. Journal for the Theory of Social
Behaviour. 24(3) (pp. 187-205). DOI 10.1111/j.1468-5914.1994.tb00252.x
Rai, S. and Shrestha, P. (2006). Guidelines to participatory innovation development. Accessed 4 April
2019. http://www.eldis.org/documents/A45474
SARVA (2013). South African Risk and Vulnerability Atlas (Department of Science and Technology,
Pretoria 2013)
Shaxson, L., Bielak, A., Ahmed, I., Brien, D., Conant, B., Fisher, C., Gwyn, E., Klerkx, L., Middleton, A.,
Morton, S., Pant, L. and Phipps, D. (2012). Expanding Our Understanding of K*. In UNU-INWEH. K*
2012 Conference, Hamilton, ON, Canada, April, 2012.
StatsSA (2017). Key findings: 03-00-14 – Food Security in South Africa, 2017. URL:
http://www.statssa.gov.za/?page_id=1856&PPN=03-00-14&SCH=7665 Accessed 2019/04/05
Thompson, K. (2012). The five major theories of how people "learn": a synopsis. In Think Differently.
URL: http://www.bioteams.com/2012/11/05/the_five_major.html. Accessed 2019/03/26
Ulrichs, M., Cannon, T., Newsham, A., Naess, L. and Marshall, M. (2015). Working Paper 108: Climate
Change & Food Security Vulnerability Assessment Toolkit for assessing community-led adaptation.
Biodiversity International & Institute of Development Studies, CGIAR/CCAFS.
Wettasinha, C., Wongtschowski, M. and Waters-Bayer, A. (2009). Recognising local innovation:
Experience of PROLINNOVA partners. Silang, Cavite, the Philippines: International Institute of Rural
Reconstruction / Leusden: PROLINNOVA International Secretariat, ETC EcoCulture. 66pp.
