The Water Wheel September/October 20191


3
CONTENTS
THE WATER WHEEL is a two-monthly
magazine on water and water research
published by the South African Water
Research Commission (WRC), a statutory
organisation established in 1971 by
Act of Parliament. Subscription is
free. Material in this publication does
not necessarily reflect the considered
opinions of the members of the WRC,
and may be copied with acknow-
ledgement of source.
Editorial Committee:
Dr Sylvester Mpandeli (Chair), Ms Khosi
Jonas, Ms Manjusha Sunil, Mr Bonani
Madikizela, Dr Mamohloding Tlhagale
and Sudhir Pillay.
Editorial offices:
Water Research Commission, Private
Bag X03, Gezina, 0031, Republic of
South Africa.
Tel (012) 761 9300. Fax (012) 331-2565.
WRC Internet address:
http://www.wrc.org.za
Follow us on Twitter:
@WaterWheelmag
Editor: Lani van Vuuren,
E-mail: laniv@wrc.org.za;
Editorial Secretary: Dikeledi Molutsi,
E-mail: dikeledidk@wrc.org.za;
Layout: Anja van der Merwe,
E-mail: anjavdm@wrc.org.za
The Fourth Industrial Revolution
is set to bring about a host of
technological advances to the
water sector. See the article on
page 12.
UPFRONT
WATER SECTOR
Fourth Industrial Revolution - Moving South Africa towards
‘Digital Water’
DOMESTIC WATER USE
Changing behaviour, saving water – helping Capetonians to
help themselves
WATER AND HEALTH
Your daily dose – How SA is handling the threat of microbial
resistance
RESILIENT CITIES
Copenhagen – A city that banks on the blue gold below the
surface
ECOLOGICAL INFRASTRUCTURE
Protecting our water-related ecological infrastructure by
building an investment case
WATER AND SOCIETY
Exploring the socio-hydrological assessment of two small
municipalities in the Western Cape
WETLANDS
Extinguishing subsurface fires in peatlands with the sprouting
water pressure method
SMALLHOLDER FARMING
Creating climate change resilient communities Part 1:
Community climate change adaptation process design
CAPACITY BUILDING
South Africa’s journey to development via science, technology
and innovation
AT A GLANCE
100-year-old wastewater treatment plant still serving the capital
city
04
12
16
20
24
34
The Water Wheel September/October 2019
29
38
46
42
50

The Water Wheel September/October 2019
4
FLUID THOUGHTS
Empowering water and sanitation
industrialisation as a route to economic
recovery
South Africa’s economy is being tossed like a cork in the
stormy waters of an unprecedented and violent recalibration
of the global economy. Some argue that this is a natural
reaction to the adjustment from a unipolar single superpower
world of twenty years ago to the one of multiple centres of
power – economic, political and military – as we have today.
This is especially severe as the old mitigation mechanisms of
robust multilateral instruments, such as the United Nations
and the World Trade Organisation are diluted as twenty-
first century nationalism has become the overwhelmingly
dominant paradigm.
But, South Africa, on most indices, appears to be wealthy. The
rankings of the World Bank and the International Monetary
Fund have South Africa as the 31st largest economy in the
world based on the size of GDP. That puts South Africa in the
top 15% globally in terms of the size of its economy. And yet,
we will have a reasonable consensus that the average South
African does not have the quality of life that corresponds
with this wealth status. This was emphasised in August with
the revelation that the National Credit Amendment Act is
directed at providing relief to an astounding 10 million heavily
indebted South Africans. This may be close to fifty percent of
the economically active population.
This is backed up by a series of global indicators. Let us
begin with the Global Competitiveness Index (GCI) 2018,
which ranks South Africa at 67th out of 137 countries. The
impressive 31st place when considering the country’s market
sophistication is balanced out by the dismal 114th place with
respect to Human Capital in the GCI.
A key driver of a successful economy in the twenty-first
century is innovation. This is the key competence to both
navigate the risks of a highly competitive global economy
while taking advantage of the all too few opportunities in a
depressed international economic environment. The Global
Innovation Index 2017 ranks South Africa at 58th out of 127
participating countries, again acknowledging a very high
market sophistication, this time at 23rd in the world, and this is
weighed down by an infrastructure ranking of 84th. This talks
to the very difficult story of the ‘Innovation Chasm’ where the
country continues to be a top twenty producer of knowledge
globally through academic publications, but fails to derive the
industrialisation dividend of that knowledge base because, as
South African President, Cyril Ramaphosa, puts it in his address
to the 25 Years of Democracy Conference on 23 July, “ over the
last 25 years, .., we have been less successful in addressing the
structural faults in our economy.”
One of those structural faults has to be the very weak
industrialisation ecosystem that is punitive to potential
Sunrise Industries. We continue to produce an impressive list
of innovations and inventions produced by super-talented
South Africans who have been forced to industrialise and
produce elsewhere in the world. We then lose out on an
opportunity to reverse the patterns on our technology
balance of payments and, in turn, our export deficit. Why
are we in this predicament more than ten years after the
launch of the National Science and Innovation Decadal Plan
2008-2018, and the establishment of institutions to address
the market failures of the Innovation Chasm, notably the
Technology Innovation Agency?
The state of human capital is the primary concern, however.
The WEF Global Human Capital Report (2017) puts the
country at 87th in the world out of 130 participating counties
where we are ranked 65th on capacity – read educational
levels – and 90th on our track record in the development of
the next generation. Given the high emphasis that the 4th
Industrial Revolution is given, one would expect this to be
higher. The most alarming component is that of deployment.
This is the category that judges skills application in a
system. The unemployment numbers, together with that
special category of unemployed graduates and diplomates,
contributes to our global ranking in this category of 109th in
the world.
Upfront
WRC CEO, Dhesigen Naidoo
BACK TO TOP
The Water Wheel September/October 20195
Upfront
How can it be that the 31st largest economy in the world,
the country that has the 21st highest average salary in the
world (between, Spain and Italy and higher than Korea
and Portugal) on purchasing power parity (ppp) have such
low performance indicators.? The reason why we sit at the
event horizon of a black hole rather than riding the wave
of global competitiveness is South Africa’s gross inequality.
This is substantiated by such parameters such as the Gini
Co-efficient or Gini ratio that measures the differential share
of wealth distribution. At present, South Africa has the worst
wealth distribution of the countries measured in the world.
The social and political cost of South Africa’s inequality is well
known, but the economic cost needs higher emphasis and
deeper examination.
The solution tree is promising, but needs some catalytic
actions. The water and sanitation research and innovation
sector has developed a series of possibilities, both in
the form of innovations and products as well as model
strategies for industrialisation and business development
that deserve a second look. South Africa as a top twenty
producer of new knowledge in the water domain globally,
unsurprisingly produces new solutions with a regularity that
is almost clockwork. Many of these solutions, inventions
and technologies have the potential not only to solve South
African problems, but also have the potential to position
South Africa as a major global manufacturing hub for these
products.
Let me offer just three examples beginning with acid mine-
water and its very close cousin, saline water (including
seawater). Traditional desalination technology based on the
gold standard reverse osmosis is highly effective, but with
two fatal flaws. The first is that the processing has a very high
energy budget, and, secondly, both the technology and the
membranes are very expensive, both in terms of direct cost
and maintenance.
The South African water research community, led by the
Water Research Commission, is working on six lower energy,
lower cost options that have been proven at laboratory scale
and now need investment to complete the journey through
pilots and demonstration before they can be used at scale
as long-term solutions. These have the potential to deal with
acid mine-water in the hotspots of Gauteng, Mpumalanga
and KwaZulu-Natal as well as provide reasonable options for
desalination in the coastal regions.
In addition to being a very effective means to deal with a
very difficult pollution problem countrywide; it is also a very
viable part of a diversified water supply strategy, and no-one
needs reminding of the high scarcity risk in South Africa.
Star among these is the homegrown technology of eutectic
freeze developed by Allison Lewis and her team at the
University of Cape Town.
Another suite is Fourth Industrial Revolution (4IR) water
efficiency tools. These are a range of tools, devices and
computer-based management tools to increase water
and process optimisation to enable every drop to stretch
further. There are tools available for most industry sectors
and the research indicates no drop in productivity and even
better, a potential increase in global market share as the
world’s markets become much more sensitive to water and
other resource costs as part of their buying decisions. As an
example, a computer-based intelligent irrigation scheduling
system has been shown to save 80 million litres of water
annually in just one irrigation scheme. These technologies,
together with wastewater reuse on-farm, rolled out at scale,
will have a huge impact on agricultural water use, and very
importantly, make billions of litres of water available for new
agricultural entrants and other users.
The third example is even more exciting. We have, like many
places in the developing world, the crippling challenge
of meeting the sanitation targets of the Sustainable
Development Goals – the goal of universal access to
improved – safe and dignified – sanitation in just over ten
years. This is a daunting task in the current global economic
climate as well as increasing water scarcity worldwide.
We have as benefit South African ingenuity, as well as the
partnership with the Bill and Melinda Gates Foundation
Reinvent the Toilet programme, whic provides access to a
range of revolutionary products under the banner of ‘New
Sanitation’.
New Sanitation products are sanitation solutions that share
the following characteristics – they use either no or very
little water on the one hand, which is already a very big plus.
The top-end solutions are innovative in their engineering in
that they operate without the costly sewerage infrastructure
with waste treatment on site. This, in itself, addresses both
issues of financial and water budgets. The genius does not
stop there, however. South Africa is a key player in the global
sanitation research and innovation network within which
the exploration of beneficiated products from human waste
treated locally is very advanced. The products include energy
all the way from first stage processing as bio-char to bio-gas
capture to liquid fuel and high calorie product extraction.
This, combined with high-value lipids, proteins and specialist
chemicals, will make us look at human waste is a completely
different light in the near future.
These solutions will not only deal with the many service
delivery backlogs and mitigating our pollution risks – if
industrialised innovatively have the real possibility of
turning South Africa’s economic fortunes around swiftly and
sustainably.
BACK TO TOP
The Water Wheel September/October 2019
6
NEWS
Upfront
SA, Japan collaborate to address pollution
by the Japanese government and will
be implemented by the United Nations
Industrial Development Organisation
(UNIDO) in partnership with the CSIR.
The project includes the assessment of
new alternative materials, such as home-
compostable bio-degradable plastic to
substitute single-use plastic products,
and the demonstration of the feasibility
of such alternatives in collaboration with
industry. It will also focus on opportunities
for local manufacturing and economic
development. UNIDO’s international
expertise in investment promotion in
technology and innovation will be a
catalytic element in the implementation,
while the CSIR will bring to the project its
extensive expertise in the assessment of
possible new materials from a materials
function and polymer science point
of view. The CSIR will also ensure that
applying new alternative materials to the
South African context does not create
new environmental challenges.
“I am delighted to take part in this
groundbreaking ceremony between
Japan and South Africa in an attempt to
reduce marine plastics pollution through
renewable means. The Department of
Trade and Industry (dti) welcomes the
support by the Japanese government and
the partnership between UNIDO and CSIR,
since biodegradable plastics locally are
just being introduced,” noted Gina.
Multimillion Rand commitment towards safeguarding SA’s water source
areas
most of South Africa’s freshwater, with just
10% of the country’s land area delivering
50% of its river flows. In order to protect
South Africa’s water security, WWF-SA
has been working with key institutions
to define, understand and improve the
safeguarding and functioning of these
areas.
The Eastern Cape is significant as South
Africa’s second-largest province, with
an estimated population of 7 million
people. It is also home to some of the
country’s most critical water source areas
– delivering close to 20% of South Africa’s
water – and key biodiversity hotspots
(including the Grasslands biome) and
in urgent need of developing sustained
rural livelihoods and employment for the
youth.
Justin Smith, WWF-SA’s Business
Development Unit Head, said the
organisation was focused on scaling-up
numerous sector-specific interventions
across multiple land use sectors. “We want
to mobilise collaborative efforts through
community-public-private-partnerships
and coordinating the various components
of our work within integrated landscape
hubs, to work collectively at landscape
level to balance competing demands and
affect change.
“The landscape level is often the most
appropriate level of action between
national and local, allowing stakeholders
to understand their own impacts and
explore their shared risk and joint
opportunities while being able to shape
and influence the future they wish to see
in the region.”
Nedbank has committed R25 million
towards safeguarding critical water source
areas, biodiversity hotspots and rural
livelihoods, with a strong focus on the
Eastern Cape. The money will be spent in
partnership with WWF South Africa, which
has a long working relationship with the
bank.
For the past eight years, Nedbank
and WWF have partnered to support
sustainable farming across South Africa.
The next five-year phase of this work
will now be scaled up to secure water
source areas, strengthen sustainable local
economies and improve rural livelihoods
to see people living in harmony with
nature.
A recent study by WWF and CSIR revealed
that 22 critical water source areas deliver
Trade and Industry Deputy Minister,
Nomalungelo Gina, has welcomed
the R25 million Japan-South Africa
collaboration project aimed at combating
plastic pollution.
The three-year project, which was
launched in Pretoria in July, is funded
BACK TO TOP

The Water Wheel September/October 20197
Upfront
Environment department growing information on SA mangroves
The Department of Environment, Forestry
and Fisheries (DEFF) has embarked on
a process to improve knowledge and
management of South Africa’s mangrove
systems.
In South Africa, mangroves’ distribution
range is limited to the eastern part of
the country’s 3 200 km coastline, from
Kosi Bay estuary in KwaZulu-Natal and
reach their Southern distributional limit at
Tyolomnqa Estuary near East London, in
the Eastern Cape. Generally, mangroves
occur in sheltered estuaries that have a
permanent connection to the sea; and
occur in 31 estuaries along the East coast
of the country.
There’s a total of eight mangrove species
occurring along the South African
coastline. The three dominant species are
the white mangrove (Avicennia marina),
black mangrove (Bruguiera gymnorhiza)
and the red mangrove (Rhizophora
mucronata). With an additional three
species (Ceriops tagal, Lumnitzera
racemosa and Xylocarpus granatum)
found in the Kosi Estuary that has recently
been classified as occurring in the tropical
biogeographic zone.
The area covered by mangroves in South
Africa is small compared to other East
African countries (total mangrove cover is
currently estimated at 1 631 ha), and the
largest mangrove forests are found in the
subtropical areas (iSimangaliso Wetland
Park and Richards Bay estuary).
Mangroves are incredibly important
ecosystems. They serve as biodiversity
hotspots, provide for livelihoods (e.g.
fishing), serve as a buffer against storm
surge, erosion and flooding, as well
serving as carbon storage.
Mangroves are also one of the few forest
types that have been listed as threatened
ecosystems under the National
Environment Management: Biodiversity
Act, and are protected under the National
Forests Act of 1998. Since mangroves form
part of the estuary, they are managed
through municipal Estuary Management
Plans (EMPs), for example in the case of
Durban Bay, uMnganzana, Ntafufu and
Nahoon EMPs.
Source: DEFF
Millions earmarked to secure water resources in Mpumalanga
The Department of Water and Sanitation
(DWS) has announced that it has set
aside millions of Rands to mitigate water
scarcity in regions in Mpumalanga that are
experiencing dry conditions.
According to a statement, the department
is planning to spend R28 million to
revamp dwindling water resources in
Bushbuckridge in this financial year.
“The protest-plagued area relies almost
exclusively on Inyaka Dam to serve about
20 villages with 90 000 people from Mariti
up to Dwarsloop.”
DWS also noted that due to drought
conditions, the Mkhombo Dam level,
which serves as the main source of
raw water for the large semi-rural
communities of Dr JS Moroka Local
Municipality, Thembisile Hani Local
Municipality and Sekhukhune Local
Municipality, has dropped to an alarming
1.6%.
An amount of R18 million has been
allocated to Dr JS Moroka Local
Municipality to augment water supply
through groundwater development.
“Through the intervention, 11 boreholes
are undergoing refurbishment, while 15
new boreholes have been drilled,” the
department said.
BACK TO TOP
The Water Wheel September/October 2019
8
GLOBAL
Upfront
Green business gets a boost with new knowledge platforms
The need for practical and targeted
knowledge to support the transition to
inclusive green economies is more urgent
than ever, with recent reports showing
the global decline of nature and calling
for unprecedented action to reach climate
targets as set out in the Paris agreement.
The Green Growth Knowledge Platform
(GGKP) hosts a wealth of existing
knowledge to support greener business,
finance, and policy, from the return
on investment on renewable energy
investments to green bonds, sustainable
infrastructure, green standards and
regulations. The platforms offer everything
from global-scale assessments on flows of
sustainable finance to highly specialised
guidance notes on ‘turning waste into
gold’ in the bio-energy sector in Africa.
Ban Ki-moon, former Secretary-General of
the United Nations and current President
and Chair of the Global Green Growth
Institute welcomed the launch of the
two new platforms: “These are especially
exciting times for the GGKP, already the
world’s largest dedicated repository of
green growth resources, case studies, and
national documents.”
The Green Industry Platform and the
Green Finance Platform will build on
the existing Green Growth Knowledge
Platform, which offers the latest know-
how to support green policymaking at
the national level. Users can browse by
sector, country, region, or cross-cutting
theme, including gender, jobs, climate
change, circular economy and natural
capital.
For more information,
Visit: https://www.greenindustryplatform.
org/ or https://greenfinanceplatform.org/
A global partnership of some of the
world’s largest organisations has seen the
launch of two new knowledge platforms
– the Green Industry Platform and the
Green Finance Platform.
The launch took place at the High-
level Political Forum for Sustainable
Development in New York in July. These
platforms provide the financial and private
sectors with the latest research data,
guidance and tools from leading experts
and institutions to help green their
operations.
One in four people live at high risk of running out of water
To gauge countries’ risk – or ‘water stress’-
WRI updated its online calculator, called
the Aqueduct Water Risk Atlas, with
data from 1961 to 2014 on water use by
households, industry and agriculture, as
well as water-supply data from surface
sources and aquifers.
“People immediately link [water woes]
to climate change,” notes Hofste, who is
based in Amsterdam. “But economic and
population growth are the biggest drivers.”
Water use has increased by 250%, from
1 888.7 km3 in 1961 to 4 720.8 km3 in 2014,
the analysis found.
Population and economic growth is
straining global water supplies. Data
released by the World Resources Institute
show that 17 countries — mostly in the
Middle East, Northern Africa and South
Asia — are under ‘extremely high’ water
stress. That means they are using at least
80% of their yearly supplies. Another 27
countries in the ‘high’ stress category are
using 40 – 80% of supplies. Less stressed
countries, those using less than 40% of
their water supplies, are ranked ‘medium
high’ to ‘low’.
Twelve of the 17 countries facing
extremely high risk are in the Middle East
and North Africa. Also in this category are
Pakistan and India, where aquifer levels
are among the fastest falling in the world.
Fore more information,
Visit: www.aqueduct/wri.org
The world is facing a water scarcity crisis,
with 17 countries, including India, Israel
and Eritrea using more than 80% of their
available water supplies each, a study has
found.
Those countries are home to a quarter
of the world’s 7.7 billion people. Further
population rise or dwindling water
supplies could cause critical water
shortages, the researchers warn.
“As soon as a drought hits or something
unexpected happens, major cities can find
themselves in very dire situations,” says
Rutger Hofste, a data scientist at the World
Resources Institute (WRI), which released
the data in August. “That’s something that
we expect to see more and more.”
BACK TO TOP
The Water Wheel September/October 20199
Upfront
CLIMATE
Climate now biggest driver of migration – study
study, published earlier this year in the
journal, Global and Planetary Change,
also found that this migration happens in
stages.
Dennis Wesselbaum, the lead researcher
and an economist at the Otago Business
School, explains that migration actually
decreased for around five years after a
temperature anomaly, before increasing
for the next 20 years. “One explanation
is that people move to places further
away and have to save more money to
finance migration cost, [or] that it takes
time to identify the temperature shock,”
Wesselbaum said.
Raya Muttarak, senior lecturer
of geography and international
development at the UK’s University of
East Anglia, believes anther reason for
the apparent delay is that people at first
try “in-situ adaptation”. “If you experience
climatic shocks in the first year, you try
different ways to cope, such as planting
different crops, changing jobs, borrowing
money. You’re probably not trying to
move straight away.”
The researchers found that global
temperatures increased by an average of
0.8 OC in the study period. They counted
100 weather-related disasters in 1980, but
by 2015 this number had risen to 300 a
year. Around 244 million people – 2.8% of
the world’s population – were classed as
migrants in 2015 by the UN. However, the
UN has said that it will not define climate
migrants as refugees, a status that comes
with more international support, citing
concerns about watering down support
programmes for those fleeing violent
conflict.
A report by the UNFCC, the UN’s climate
change body, found last year that,
globally, countries are failing to deal
with climate migration adequately.
“Recognising the causal factors behind
this forced migration would require
governments to apportion responsibility,
both for the initial migration and for the
solutions to it,” said Steve Trent, Director
of the Environmental Justice Foundation,
which lobbies on environmental issues
in the Global South. “In many countries
this is politically toxic and, without
international agreement on shared and
coordinated action, proves politically very
hard to deal with.”
Wesselbaum is confident, however, that
this problem will be recognised “sooner or
later”, adding that the results of his study
offer a more nuanced understanding of
how people respond to climate shocks.
The climate migration model showed that
migration remained stable after storms
and drought, but increased significantly
after floods and extreme temperature
events. “Both developed and at-risk
countries need more planning and
policy to prepare for what is likely to be
a growing trend of people wanting to
move.”
To view the journal article, Visit: https://
doi.org/10.1016/j.gloplacha.2019.04.008
Source: SciDev.Net
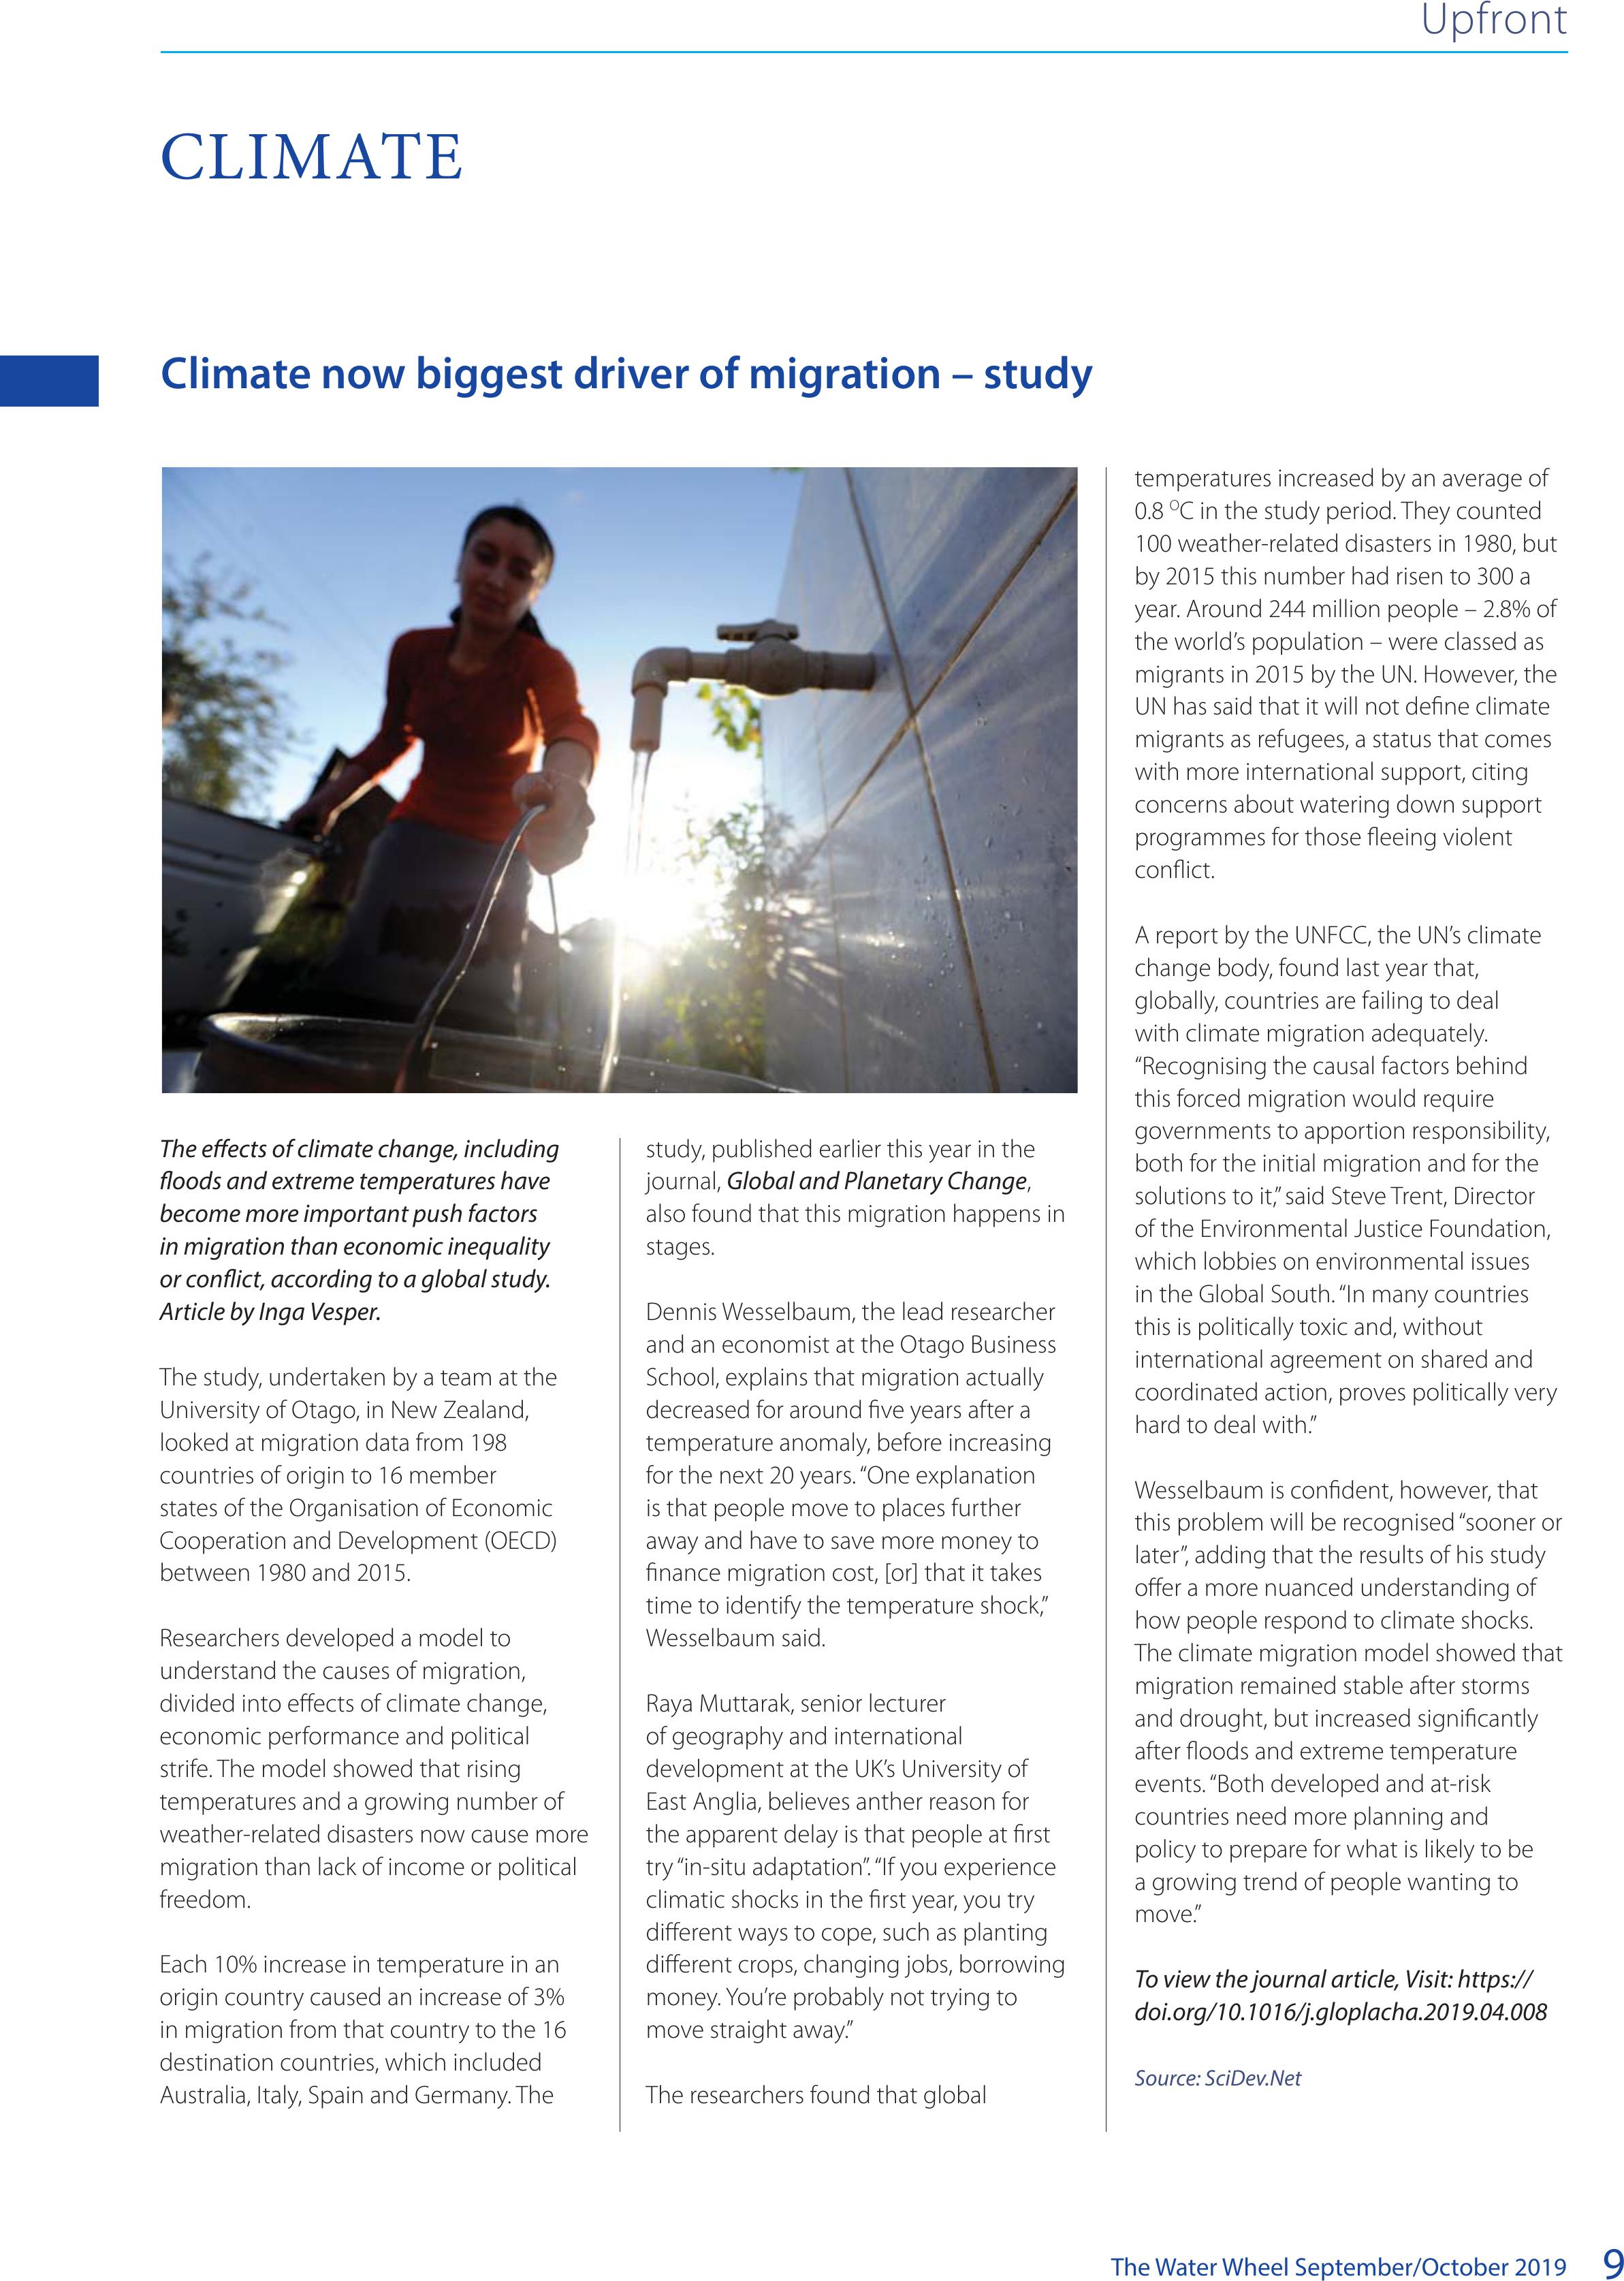
The eects of climate change, including
oods and extreme temperatures have
become more important push factors
in migration than economic inequality
or conict, according to a global study.
Article by Inga Vesper.
The study, undertaken by a team at the
University of Otago, in New Zealand,
looked at migration data from 198
countries of origin to 16 member
states of the Organisation of Economic
Cooperation and Development (OECD)
between 1980 and 2015.
Researchers developed a model to
understand the causes of migration,
divided into effects of climate change,
economic performance and political
strife. The model showed that rising
temperatures and a growing number of
weather-related disasters now cause more
migration than lack of income or political
freedom.
Each 10% increase in temperature in an
origin country caused an increase of 3%
in migration from that country to the 16
destination countries, which included
Australia, Italy, Spain and Germany. The
BACK TO TOP
The Water Wheel September/October 2019
10
Book review
Katko, T. Finnish water services: Experiences in global perspective
(Mustasaari: Finnish Water Utilities Association, 2016)
Prof Tapio Katko, the UNESCO Chair in Sustainable Water Services
at Tampere University of Technology in Finland, is an engineer
and water historian who has been active in the international
water research sector since the mid-1980s. For a significant
part of his professional career he spent time overseas. Working
in Africa and engaging with peers in Europe, especially after
Finland in 1995 joined the European Union, Katko has built up
a wealth of global insight into water resources and services. For
almost four decades his acquired knowledge and insight has fed
into Finland’s water sector.
It is therefore of interest to take note of his latest publication,
Finnish water services. While his focus is on Finland’s water sector
history, there is evidence of a global water sector gaze and
how Finland has managed to remain abreast of international
developments.
Since gaining its independence from Russia in 1919, Finland,
with a current population of about 5.2 million inhabitants,
has excelled in a number of fields. The country’s water sector
is currently considered to be amongst the top 10 operations
globally. The World guide to Corporate Sustainability and
Responsibility (2017) singles Finland out as one of the world’s top
‘honest’ countries. On Transparency International’s 2018 global
assessment list, Finland is the third least corrupt country (after
Denmark and New Zealand) in the world.
The country’s water sector is an outstanding example of a
well-run state with a strong social democratic ethic, where a
significant part of the population relies on state employment.
Since the country’s shift to a post-industrial society in the 1970s,
Finland’s economy has focused on developing a service society.
The country’s private sector has become an influential role player
in generating wealth and development.
Apart from strong international ties, Katko remained a water-
sector insider in Finland. He shares his comprehensive historical
insight into the manner in which Finnish water sector services
have evolved since the 19th century. The country and its
people, more than often function in either the shadow of the
neighbouring Scandinavian countries of Sweden, Norway and
Denmark, as well as Russia in the east. Yet Finland has excelled
in the fields of: ethical consumption; awareness of environment
and climate change; its ability to embrace cultural adaptation;
the country has maintained a good level of competitiveness; and
its society nurtures sustainability. These environmentally-friendly
traits feature prominently in Finlandfs water sector.
Of particular importance is Katko’s exposition of the way
in which Finnish water sector professionals and research
community have maintained a strong engagement with
developments in the water sectors of the most advanced, as well
as developing countries of the world.
With more than 190 000 lakes with a diameter of more than
500 m2, Finland’s water ‘problems’ are primarily seated in dealing
with wastewater and securing outstanding potable water for its
users. Katko deals with both surface and groundwater resources
and sheds light on progress in the field of water recharge
systems – a field in which the country has made significant
progress in recent times.
Of particular interest is the evolution of Finland’s water sector
and the manner in which education, research and development
have played a pivotal role in the development of an outstanding
water sector.
Part 4 of the study is a comparative survey of how Finland has
managed to seamlessly adapt to global trends. In the field of
services, the country is clearly at the cutting edge – thanks
to the knowledge of its water sector being up to date with
knowledge on exogenous trends. In planning for future water
supplies, Finland is safely ensconced at the same level as Brazil,
but potentially with the benefit of more insight on regional
European trends and developments.
For the reader interested in gaining an insight into the
development of water services in a modern European state
there is a lot of food for thought. International partnerships,
using international organisations to promote the interests of a
national water sector, is a winning recipe. The proviso is a spirit
of reciprocal engagement – a diplomatic skill that has been fine-
tuned by Finnish water sector colleagues working in many parts
of the world.
Katko, in the final chapter joins forces with Jorma Tainen to
make a poetic statement on the importance of water services.
Culturally it is a courageous statement, for the Finns who are
traditionally known for their inwardly reserved characteristics.
One verse provides a clue for the contemplative reader as a
recipe for success in the contemporary social democratic state’s
water sector. It reads:
Keep services rolling!
A USEFUL VIEW OF FINNISH WATER
RESOURCES AND SERVICES IN A GLOBAL
CONTEXT
BACK TO TOP
The Water Wheel September/October 201911
Obituary
WATER COMMUNITY MOURNS THE
PASSING OF FEMALE ICON
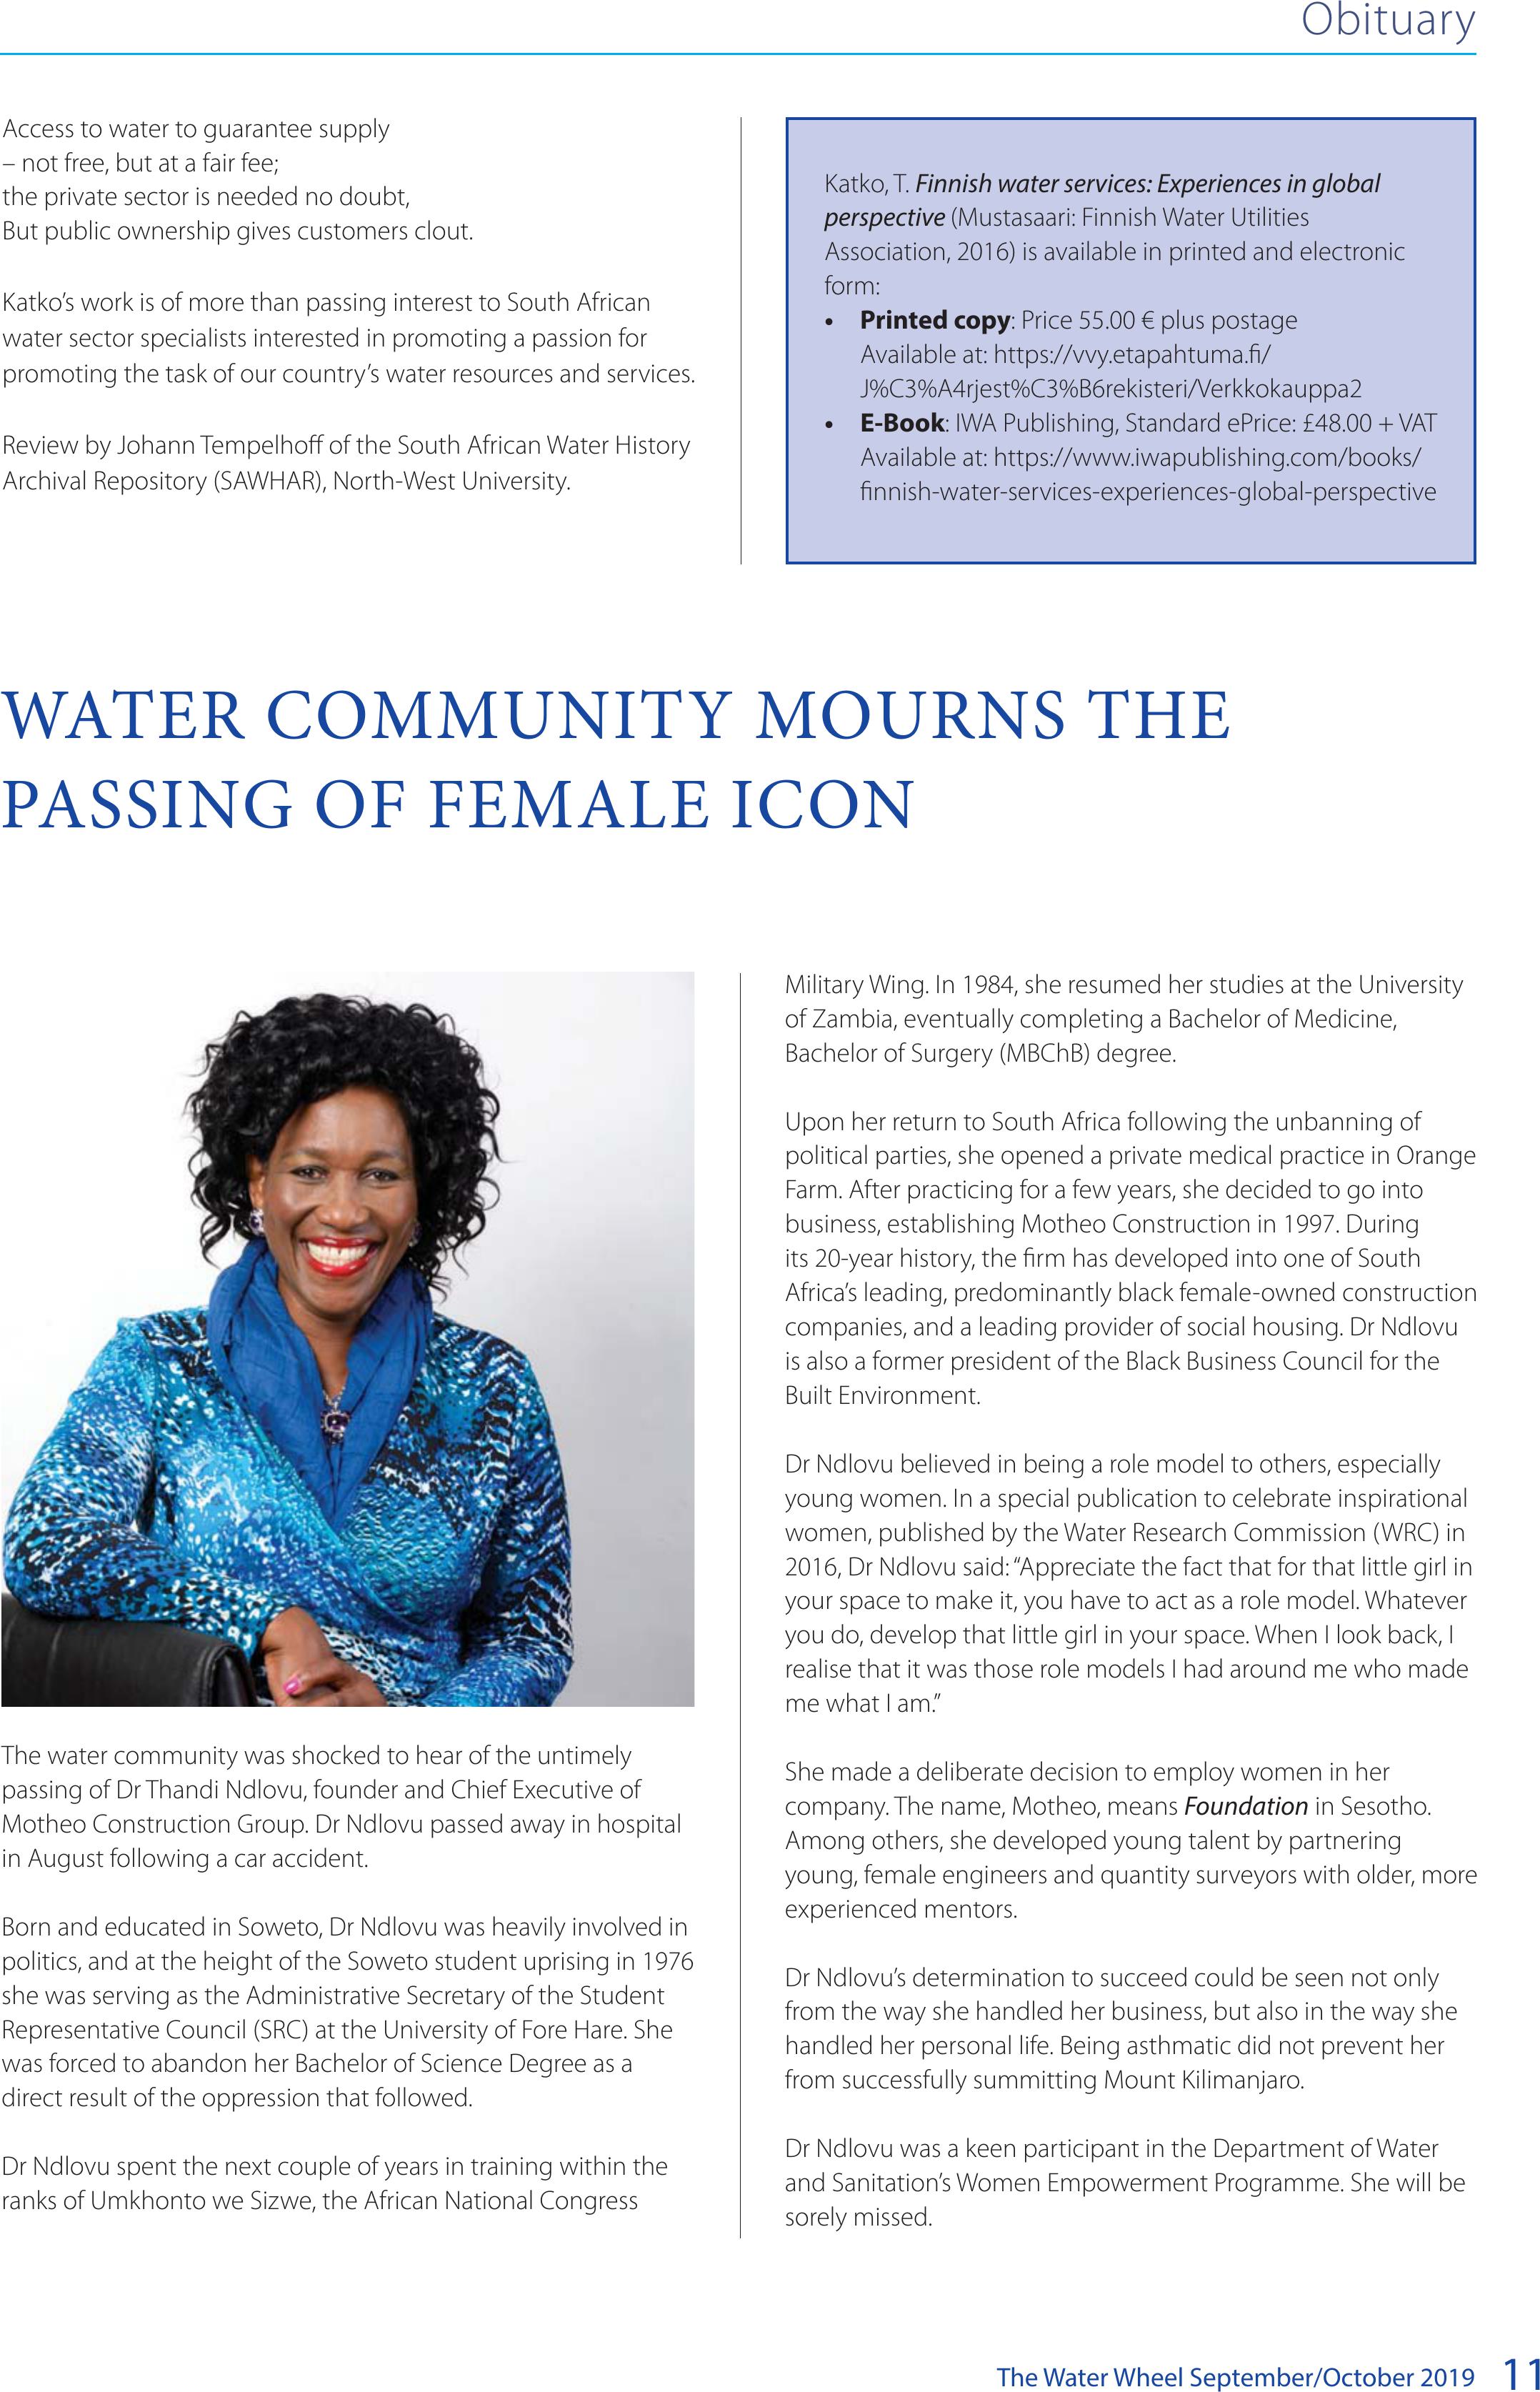
The water community was shocked to hear of the untimely
passing of Dr Thandi Ndlovu, founder and Chief Executive of
Motheo Construction Group. Dr Ndlovu passed away in hospital
in August following a car accident.
Born and educated in Soweto, Dr Ndlovu was heavily involved in
politics, and at the height of the Soweto student uprising in 1976
she was serving as the Administrative Secretary of the Student
Representative Council (SRC) at the University of Fore Hare. She
was forced to abandon her Bachelor of Science Degree as a
direct result of the oppression that followed.
Dr Ndlovu spent the next couple of years in training within the
ranks of Umkhonto we Sizwe, the African National Congress
Military Wing. In 1984, she resumed her studies at the University
of Zambia, eventually completing a Bachelor of Medicine,
Bachelor of Surgery (MBChB) degree.
Upon her return to South Africa following the unbanning of
political parties, she opened a private medical practice in Orange
Farm. After practicing for a few years, she decided to go into
business, establishing Motheo Construction in 1997. During
its 20-year history, the firm has developed into one of South
Africa’s leading, predominantly black female-owned construction
companies, and a leading provider of social housing. Dr Ndlovu
is also a former president of the Black Business Council for the
Built Environment.
Dr Ndlovu believed in being a role model to others, especially
young women. In a special publication to celebrate inspirational
women, published by the Water Research Commission (WRC) in
2016, Dr Ndlovu said: “Appreciate the fact that for that little girl in
your space to make it, you have to act as a role model. Whatever
you do, develop that little girl in your space. When I look back, I
realise that it was those role models I had around me who made
me what I am.”
She made a deliberate decision to employ women in her
company. The name, Motheo, means Foundation in Sesotho.
Among others, she developed young talent by partnering
young, female engineers and quantity surveyors with older, more
experienced mentors.
Dr Ndlovu’s determination to succeed could be seen not only
from the way she handled her business, but also in the way she
handled her personal life. Being asthmatic did not prevent her
from successfully summitting Mount Kilimanjaro.
Dr Ndlovu was a keen participant in the Department of Water
and Sanitation’s Women Empowerment Programme. She will be
sorely missed.
Access to water to guarantee supply
– not free, but at a fair fee;
the private sector is needed no doubt,
But public ownership gives customers clout.
Katko’s work is of more than passing interest to South African
water sector specialists interested in promoting a passion for
promoting the task of our country’s water resources and services.
Review by Johann Tempelhoff of the South African Water History
Archival Repository (SAWHAR), North-West University.
Katko, T. Finnish water services: Experiences in global
perspective (Mustasaari: Finnish Water Utilities
Association, 2016) is available in printed and electronic
form:
• Printed copy: Price 55.00 € plus postage
Available at: https://vvy.etapahtuma.fi/
J%C3%A4rjest%C3%B6rekisteri/Verkkokauppa2
• E-Book: IWA Publishing, Standard ePrice: £48.00 + VAT
Available at: https://www.iwapublishing.com/books/
finnish-water-services-experiences-global-perspective
BACK TO TOP
The Water Wheel September/October 2019
12
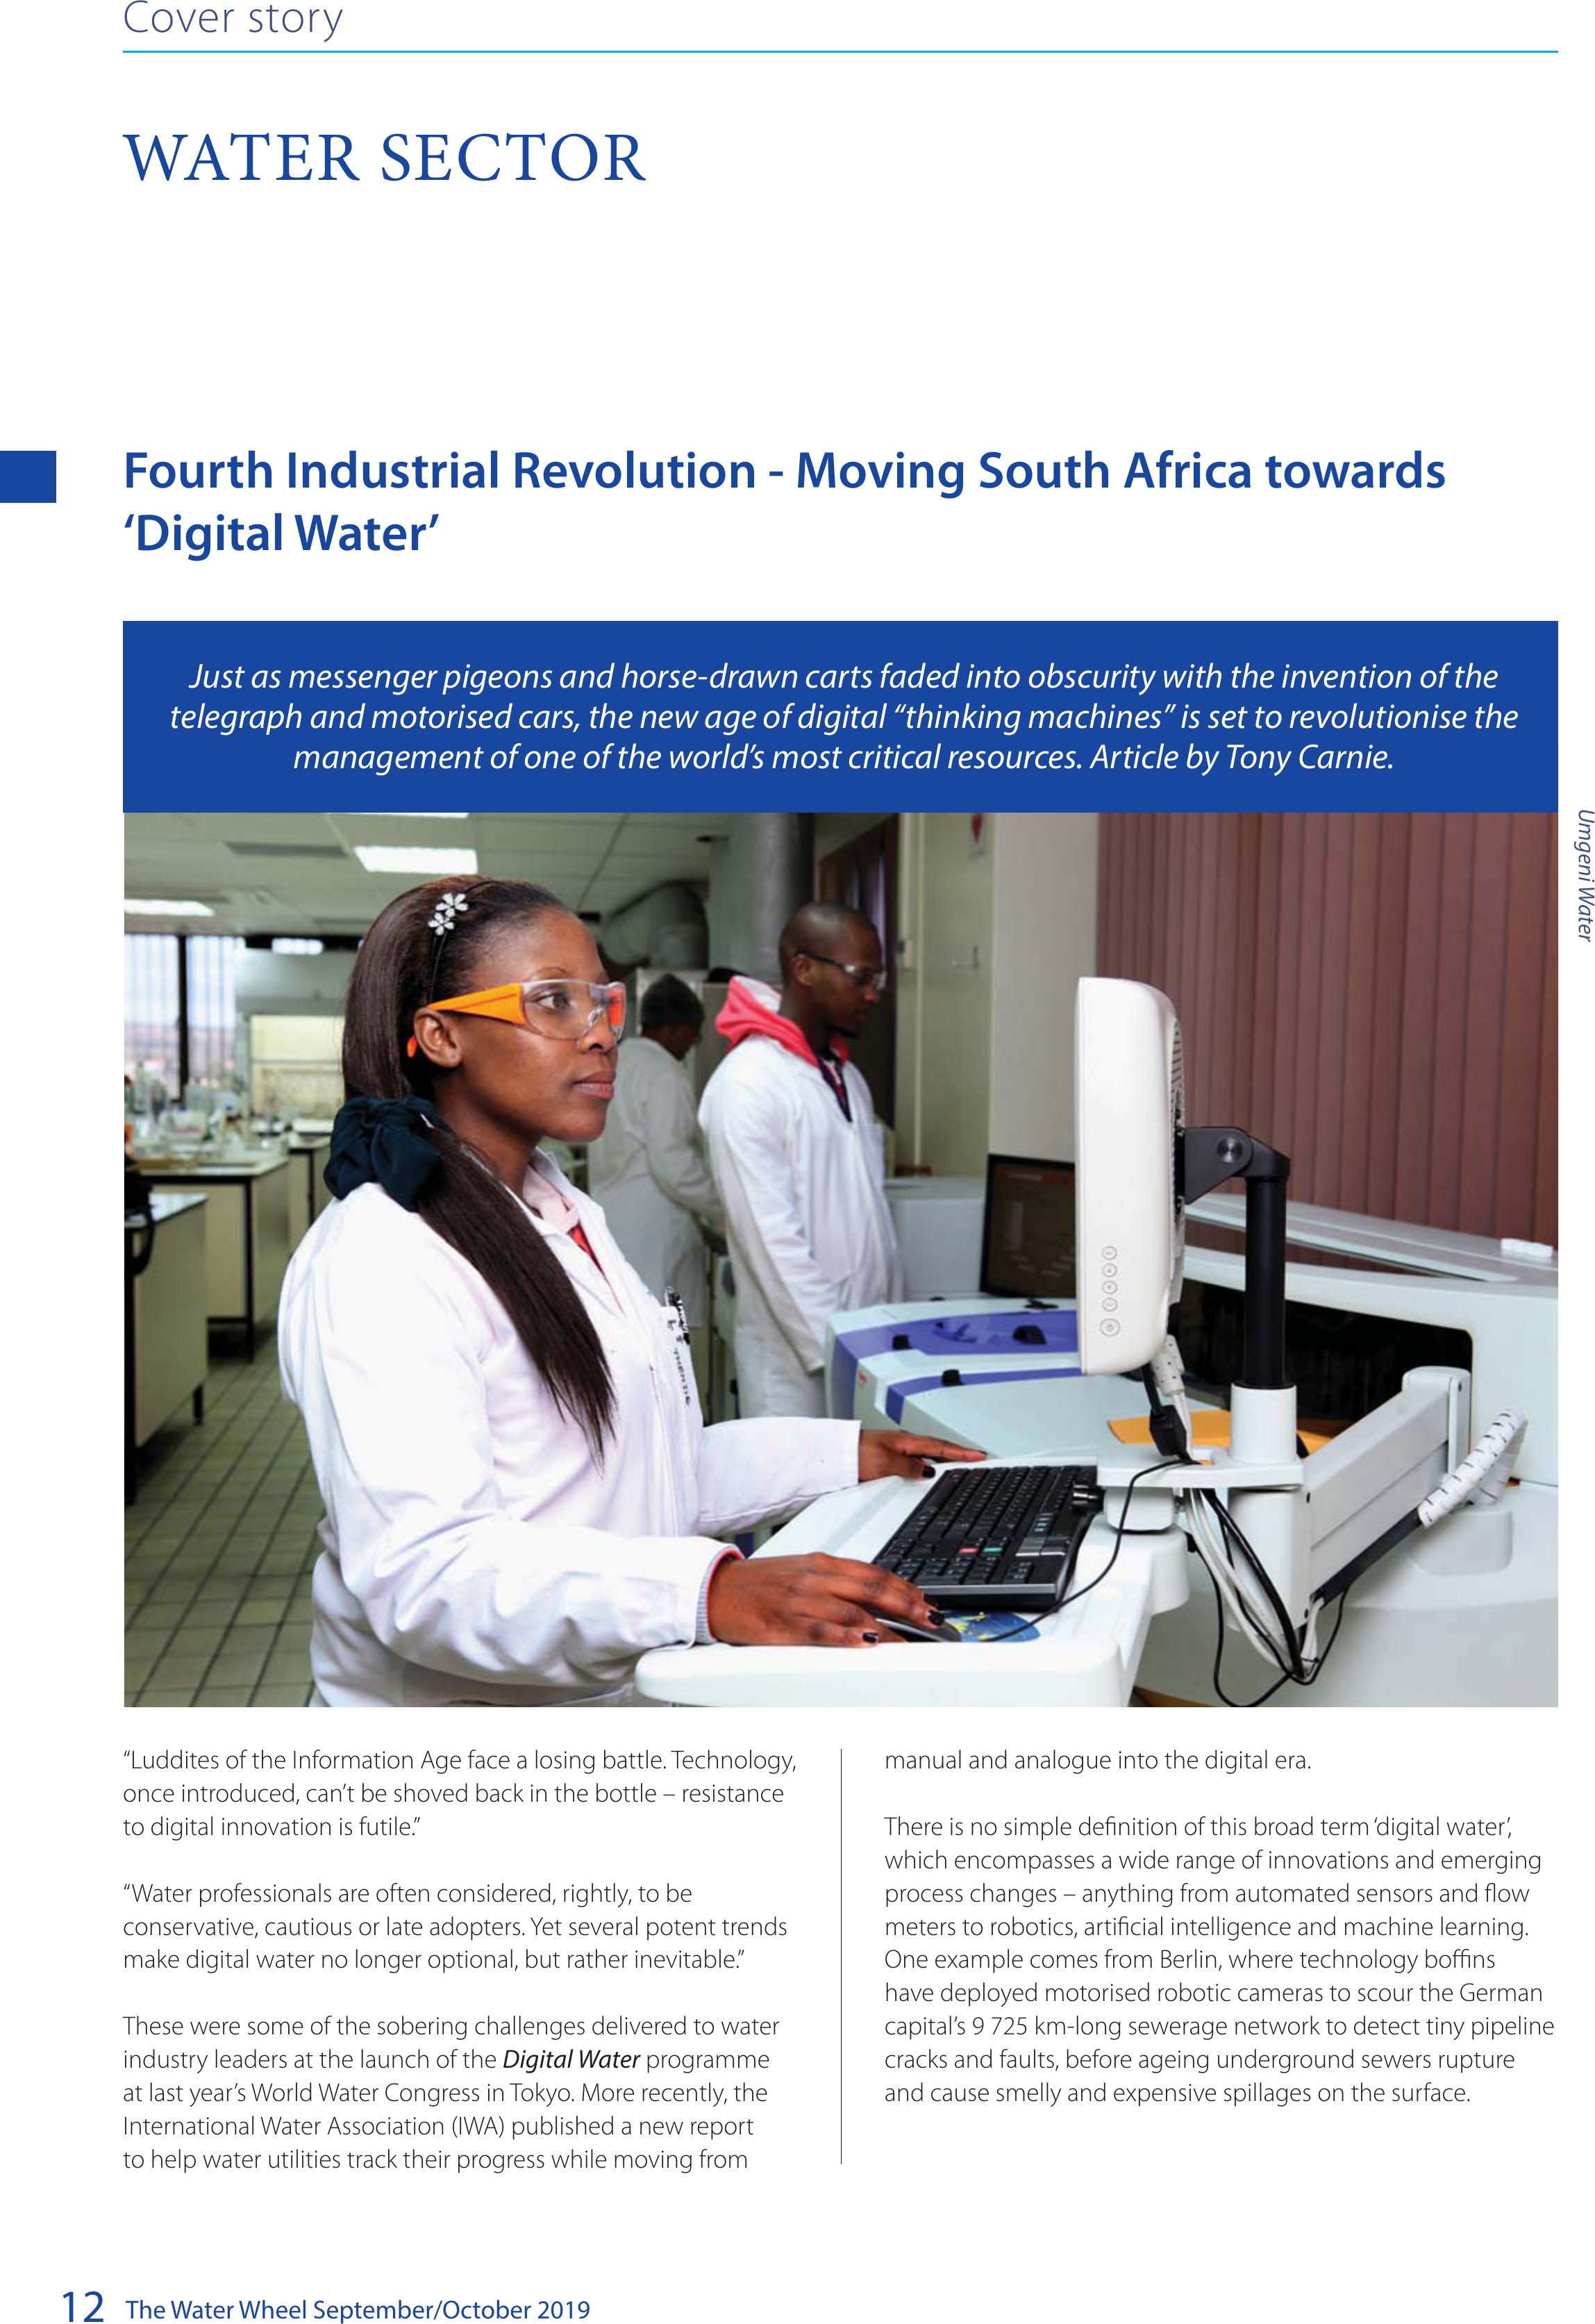
Fourth Industrial Revolution - Moving South Africa towards
‘Digital Water’
“Luddites of the Information Age face a losing battle. Technology,
once introduced, can’t be shoved back in the bottle – resistance
to digital innovation is futile.”
“Water professionals are often considered, rightly, to be
conservative, cautious or late adopters. Yet several potent trends
make digital water no longer optional, but rather inevitable.”
These were some of the sobering challenges delivered to water
industry leaders at the launch of the Digital Water programme
at last year’s World Water Congress in Tokyo. More recently, the
International Water Association (IWA) published a new report
to help water utilities track their progress while moving from
manual and analogue into the digital era.
There is no simple definition of this broad term ‘digital water’,
which encompasses a wide range of innovations and emerging
process changes – anything from automated sensors and flow
meters to robotics, artificial intelligence and machine learning.
One example comes from Berlin, where technology boffins
have deployed motorised robotic cameras to scour the German
capital’s 9 725 km-long sewerage network to detect tiny pipeline
cracks and faults, before ageing underground sewers rupture
and cause smelly and expensive spillages on the surface.
Just as messenger pigeons and horse-drawn carts faded into obscurity with the invention of the
telegraph and motorised cars, the new age of digital “thinking machines” is set to revolutionise the
management of one of the world’s most critical resources. Article by Tony Carnie.
WATER SECTOR
Cover story
Umgeni Water
BACK TO TOP
The Water Wheel September/October 201913
Another example comes from KwaZulu-Natal, where
hydrologists from Umgeni Water were able to gaze into a digital
crystal ball of sorts – and then make some adjustments to dam
levels to ward off a potential Day Zero crisis for Durban and
Pietermaritzburg during the recent drought.
The new IWA report (Digital Water: Industry leaders chart the
transformation journey) notes that growing cities of the future
have some tough times ahead in managing scarcer and less
reliable water resources. The report also provides a gateway for
water utilities to access knowledge on research, technology and
innovation in the digital water space.
IWA hopes to inspire the international water sector to adopt
a ‘smarter’ approach to water management, including the
development of new off-grid schemes; projects to reuse or make
better use of wastewater, and the installation of data-driven
systems that help to integrate and optimise smart pumps, valves,
sensors and actuators. This includes the concept of getting
devices to ‘talk’ to each other and making use of smartphones to
send real-time information to customers and colleagues.
One of the first developments in this area was the introduction
of the Supervisory Control and Data Acquisition (SCADA) system
that combined computers, networked data communications
and graphics for water treatment and distribution, as well as in
other areas such as power generation and manufacturing.
The authors of IWA’s new report believe that emerging
digital developments will allow water utility companies to
implement “radically different system configurations” which
can help to reduce sewer overflows, cut non-revenue water
losses dramatically, and introduce cost efficiencies that were
unimaginable a decade ago.
The report is largely based on interviews and inputs from nearly
50 utility executives, including case studies involving Umgeni
Water and Rand Water in South Africa. Recalling the story of
Cape Town’s countdown to the ‘Day Zero’ crisis as one example
of many other large modern cities struggling to address current
and future water shortages, it states:
“Umgeni Water has used digital technology to better manage its
water resources and protect its customers from the same fate as
Cape Town residents. Hydrologic models paired with monitoring
devices have allowed (Umgeni) to optimise storage levels in
dams and reservoirs.”
In a separate interview with The Water Wheel, Umgeni Water
Senior Manager, Dan Naidoo, said the utility was still around the
half-way mark in its digital transformation journey. “We started
about 10- 15 years ago with more advanced computer systems
and by starting to measure better,” he said, recalling that during
the early 1990s, several operations – from process control to data
collection - were done manually by operators and recorded on
paper.
The early adoption of hardwired meter counters to a central
control room and the ability to remotely open and close valves
were among some of the initial changes to enable remote
operation via telemetry, electronics and computers.
“Over time, the biggest change was in the adoption of online
instrumentation to measure water quality parameters in real
time, thus reducing much manual lab testing and improving
process control of the treatment process.”
This eventually led to fully-automated processes for a number
of operations such as filtration plants, backwashing cycles and
chemical dosing. “We are moving towards more digital systems,
but we favour an organic process rather than an overnight step
change.”
Naidoo believes the key is respond timeously, noting that costs
for other advanced technologies, such as solar power, had
dropped rapidly in recent years.
During the recent drought – when dam water levels receded
after three successive years of below- average rainfall – Umgeni
Water was able to use computerised hydrology models to
balance water levels more effectively and to simulate drought
scenarios as they developed.
To buffer water levels in the four critical Umgeni system dams
(Midmar, Albert Falls, Nagle and Inanda) which supply Durban
and Pietermaritzburg, water was pumped across from the
Water sector
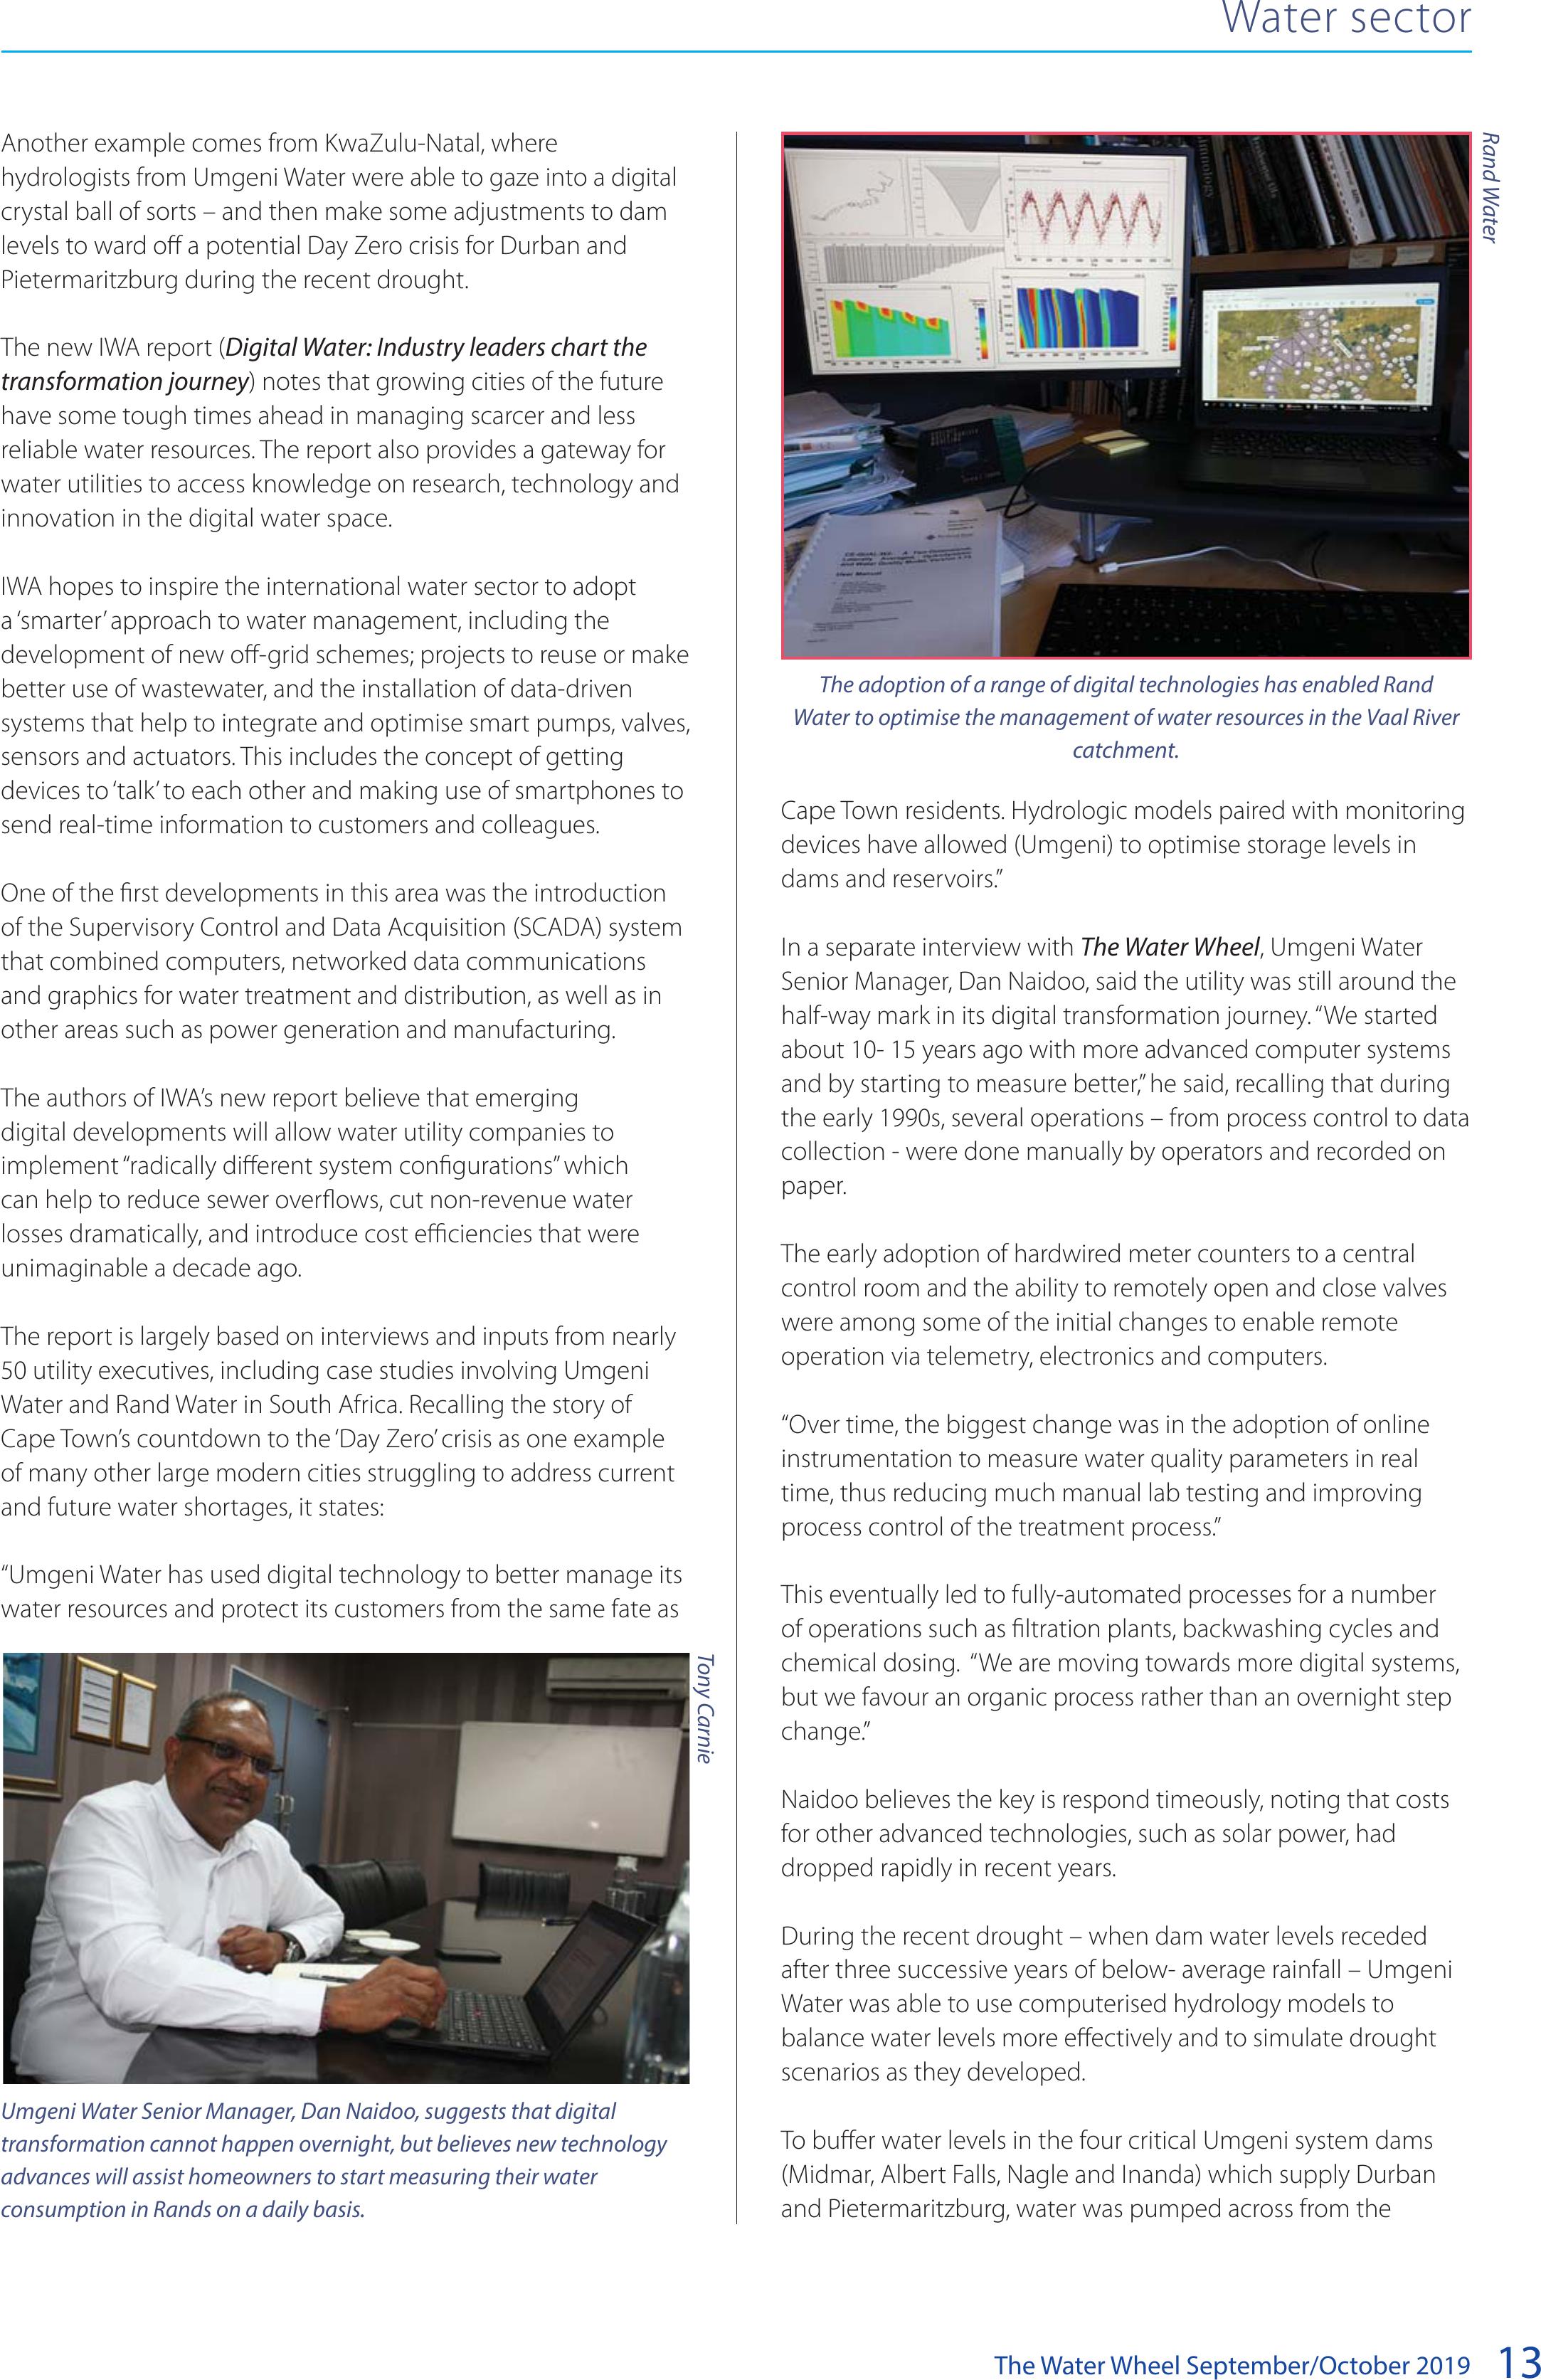
The adoption of a range of digital technologies has enabled Rand
Water to optimise the management of water resources in the Vaal River
catchment.
Rand Water
Umgeni Water Senior Manager, Dan Naidoo, suggests that digital
transformation cannot happen overnight, but believes new technology
advances will assist homeowners to start measuring their water
consumption in Rands on a daily basis.
Tony Carnie
BACK TO TOP
The Water Wheel September/October 2019
14
Water sector
comparatively wetter Mooi River system into the rapidly drying
Umgeni catchment. As water was drawn down from the two
lower dams (Nagle and Inanda) more water was pumped across
via the Mooi River transfer scheme to replenish the upper dams
(Midmar and Albert Falls)
Naidoo said Umgeni Water also acted swiftly to reduce water
demand by calling for voluntary reductions by urban water
users. However, when this call for voluntary curbs led to only
negligible reductions, Umgeni Water and other water sector
officials approached Cabinet to approve mandatory cuts before
a crisis developed.
“Don’t forget that we also lose revenue when there are water
restrictions – so we don’t take such decisions lightly,” he noted.
Naidoo said the benefits of digital transformation cannot occur
overnight. For example, large volumes of historic data will still
have to be converted into digital format. Umgeni Water has also
conducted audits to ascertain how staff may need to be reskilled
as digitisation continues.
Naidoo believes that rapid advances in technology will reduce
the time taken to complete microbiology tests, and also lead to
new branches, such as nano-biology, to detect microplastics and
a wider range of other contaminants.
Writing in the Journal of Clinical Microbiology, researchers
Paul Bourbeau and Nathan Ledeboer have suggested that the
winds of change are moving quickly towards the automation of
microbiology laboratories.
While there was a perception that humans could perform tasks
faster than machines, and that machines did not have the critical
decision-making skills to process microbiology specimens, they
cautioned that microbiology laboratories had entered an age of
“monumental change”
Changes are also underway in Gauteng, according to Prof
Hamanth Kasan, General Manager of Rand Water’s Scientific
Services Division. Rand Water’s application of digital technology
now includes PLC/SCADA systems for water treatment
operations and control, as well online water quality monitoring,
catchment modelling, telemetry systems for management of
reservoirs and automatic meter reading.
Prof Kasan said that “culture is important” and utilities had
to “overcome fear of data and transparency”. As younger
engineers entered the workforce, the willingness to explore
digital technologies was growing. According to Prof Kasan,
the migration to digital technology in the water sector was
not simply about saving money and was expected to result in
several benefits, such as improved customer services, improved
and consistent water quality, reductions in wastage and better
public health and environmental protection.
Other benefits would include transparent monitoring and
management for optimisation across the water value chain.
“With application of technical change there are risks and
benefits. Risks include cybersecurity and the need for enhanced
skills, relevance and the sustainability of technologies.”
It would also require an organisational culture change to
embrace new ways of working, as well as measures to control
vandalism to ensure the security of installations. “But, with proper
planning, selection of appropriate technologies and thorough
execution, these risks can be mitigated,” he maintained.
Prof Kasan believes that, in the longer term, the digital revolution
could lead to more widespread use of robotics and automation
for conducting complex water analyses, as well as real-time
monitoring of the condition of pipelines and the use of drones
for sampling and to monitor catchments and pipelines. Other
new innovations were expected to include new digital apps for
customer management and optimisation of water consumption.
Elsewhere in the global water sector, the city of Taipei has
also been moving towards digital solutions following a severe
drought in 2002. The IWA report notes that partly by introducing
new sensors, smart meters and pressure control systems the
greater Taipei area had not experienced a water shortage in
17 years.
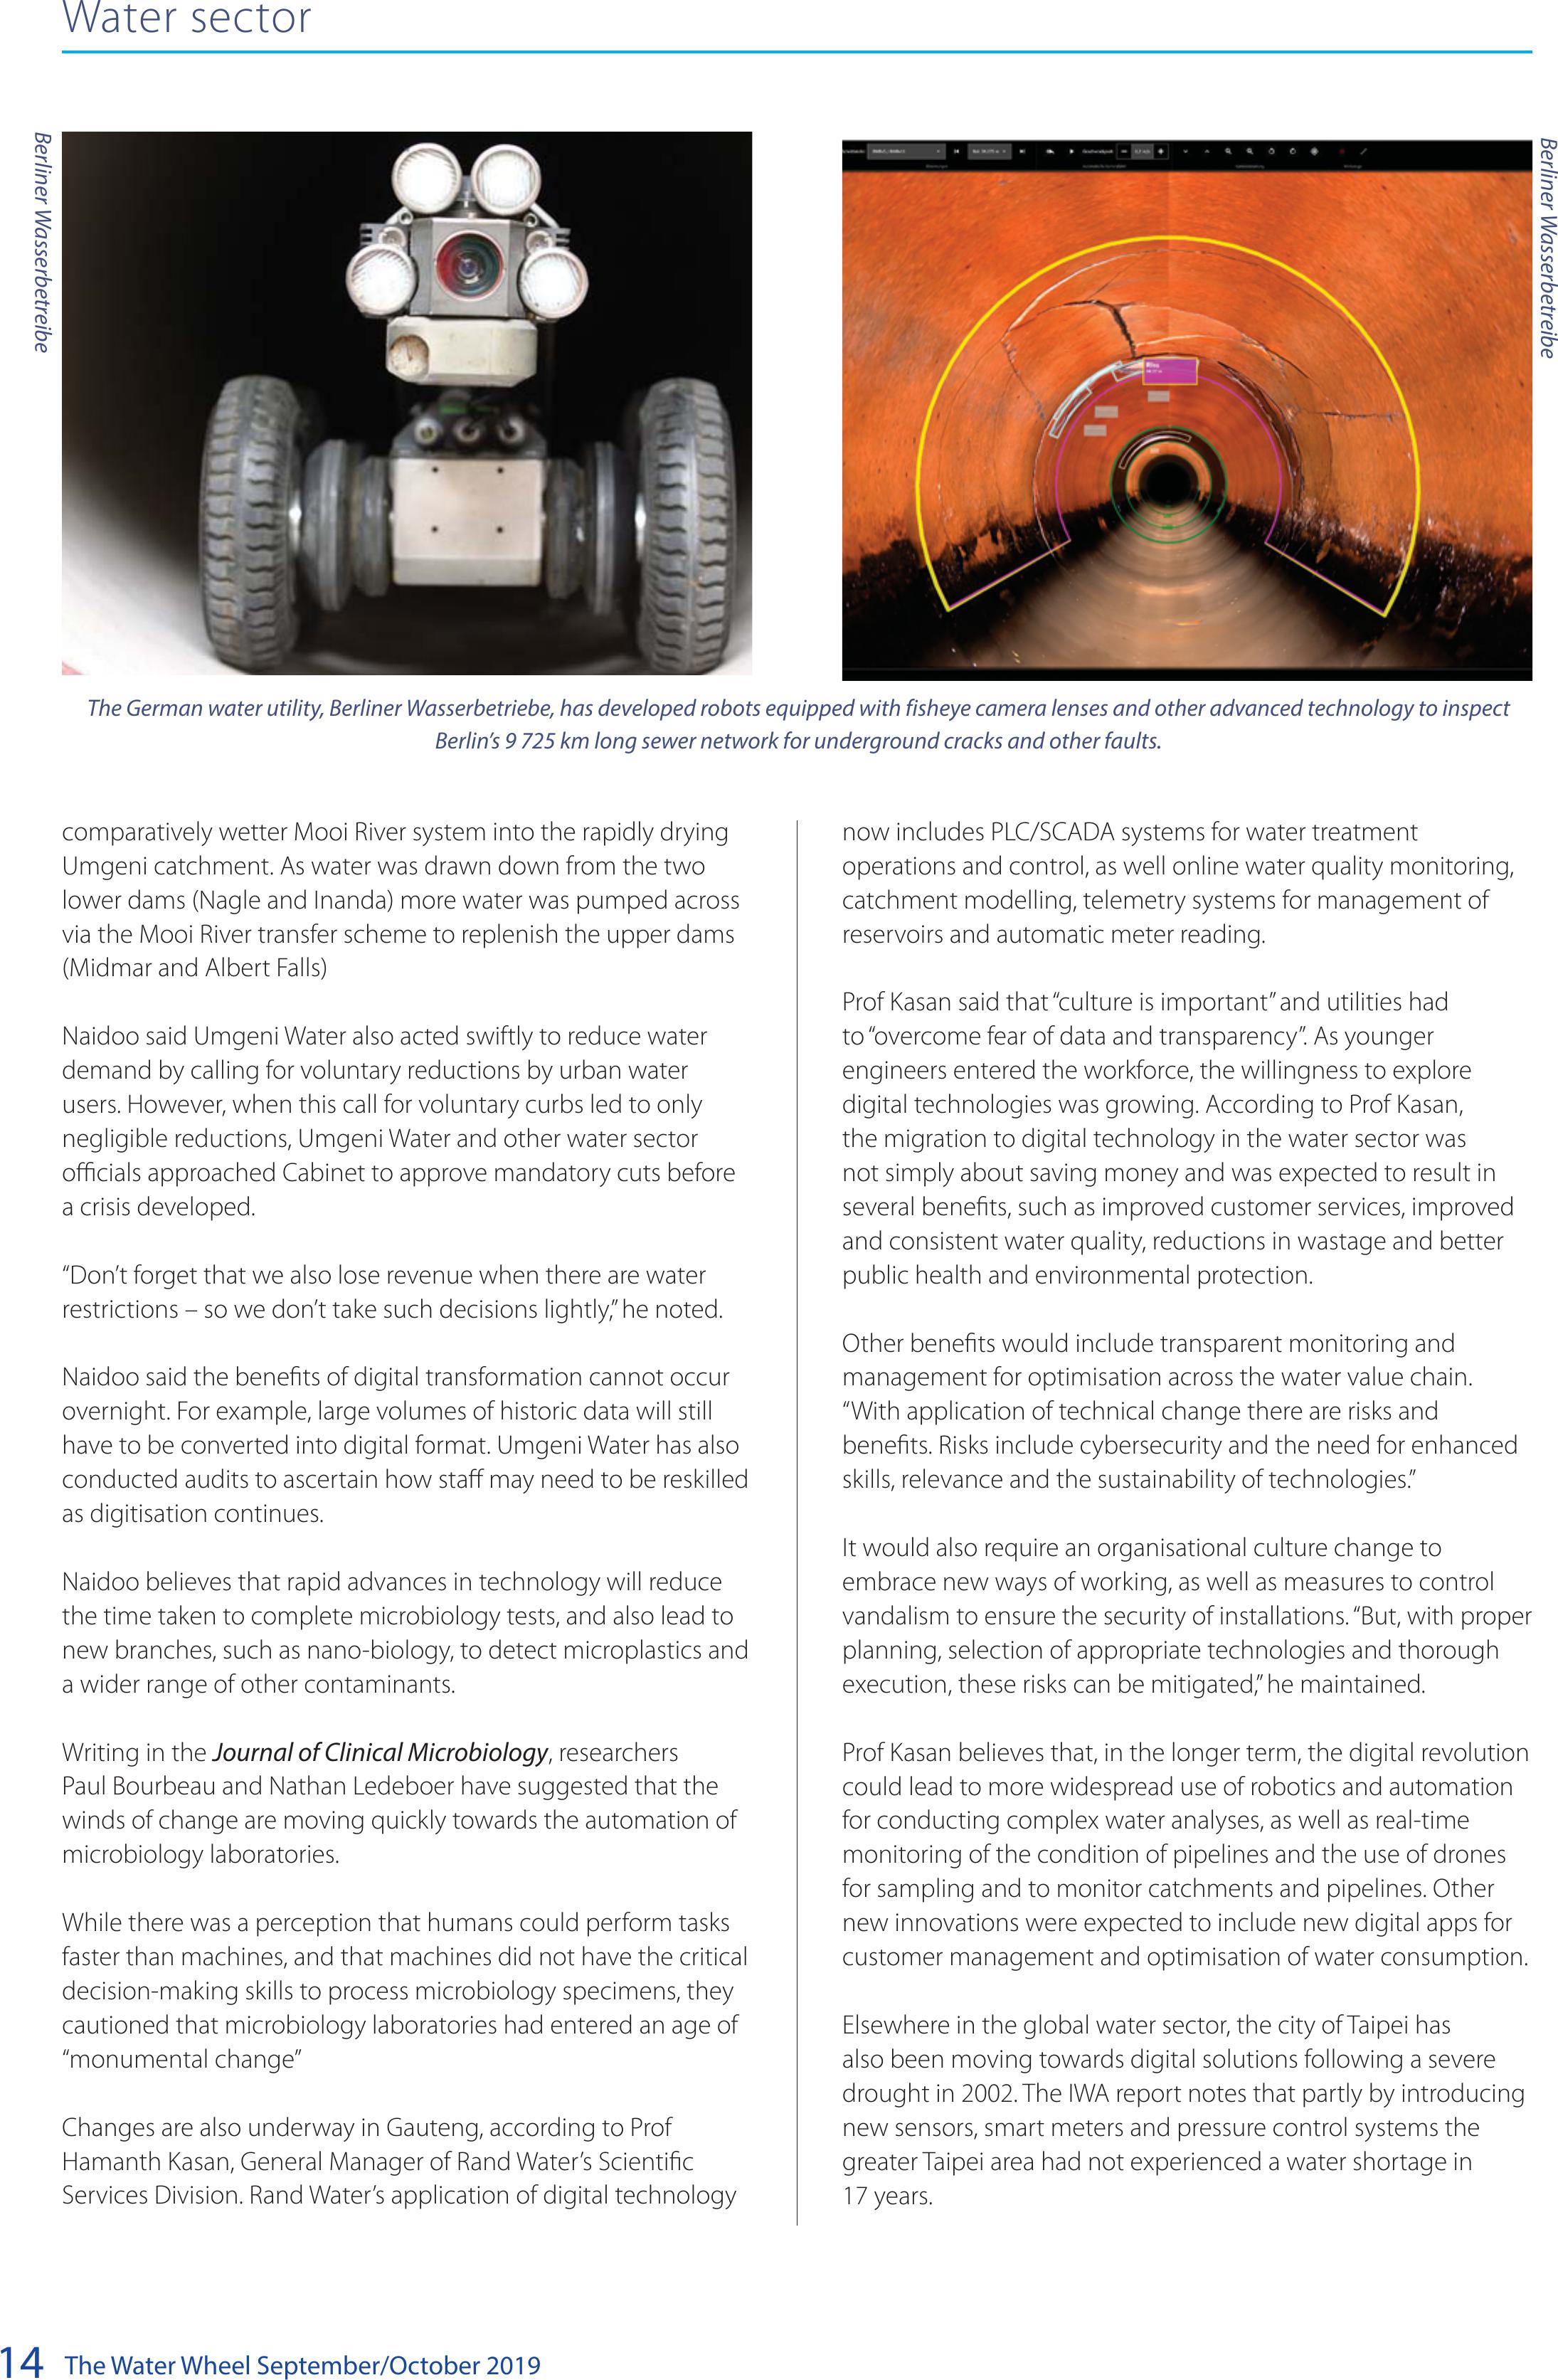
The German water utility, Berliner Wasserbetriebe, has developed robots equipped with fisheye camera lenses and other advanced technology to inspect
Berlin’s 9 725 km long sewer network for underground cracks and other faults.
Berliner Wasserbetreibe
Berliner Wasserbetreibe
BACK TO TOP

The Water Wheel September/October 201915
Water sector
Augmented and virtual reality (AR and VR) technologies had
potential to support decision making in the field by providing
holographic representation of pipes, cables and other assets.
IWA Executive Director, Kala Vairavamoorthy, cautions that global
water utilities are next in line to experience the disruptive force
of innovative technologies. “Ready or not, digital tools have
quite literally shifted power to the people,” he said, noting that
disruptive ventures such as Uber and Airbnbhad not requested
permission from regulatory agencies, elected officials or trade
associations.
“Unfortunately, all too often the large entrenched interests
have tried not to adapt, but rather to restrain the tide of digital
technology . . . The water sector must learn from other sectors to
instead embrace the potential changes already underway.”
During the recent drought - when dam water levels in KwaZulu-Natal
receded after three successive years of below-average rainfall, Umgeni
was able to use advanced hydrology models to balance water levels more
effectively and to simulate drought scenarios as they developed.
The full IWA report is available at: https://iwa-network.org/
publications/digital-water/
“In the longer term, the digital revolution
could lead to more widespread use of
robotics and automation for conducting
complex water analyses, as well as
real-time monitoring of the condition
of pipelines and the use of drones for
sampling and to monitor catchments
and pipelines.”
Ghana Water’s Chief Technology Officer, Richard Otoo, said
the utility had experienced a 14% increase in revenue after
digital technologies increased water bill collection efficiency
and provided customers with a menu of payment options that
included mobile money payments and direct debit through
banks.
In India, digital technologies have modified the profile of
the workforce at the water utility company VA Tech Wabag.
Company Vice President, Gyanendra Saxena, said projects once
needing 10-15 operators now require only 3-4 operators, “freeing
up personnel for other, more demanding tasks (e.g., tasks
requiring human interaction, emotion, decision making, and
complex skill sets).”
Another example comes from Florida, where the local water
utility installed sensors on several lakes that are prone to
flooding during hurricanes. The new sensors and software
help to detect downpours in advance, allowing the system to
automatically drain down the storage volume ahead of a major
storm.
In an era of climate change and declining water quality, the
use of satellite remote sensing, GIS technologies and other
visualisation tools can also help water managers to prepare for
heavier stormwater flows during severe floods, to ration water
ahead of droughts and to monitor algal blooms.
IWA says sensors can be dispersed to optimise resource use (e.g.,
chemical use for water treatment), and to detect, diagnose and
proactively prevent pipe bursts, water discoloration events, or
sewer failures.
Thinking machines and the power of data processing
Dragan Savic, CE of the Netherlands-based KWR Water Cycle
Research Institute, notes that there has been an explosive
growth of digital data technology over the past decade.
This includes machine learning and artificial intelligence (AI)
systems that can recognise patterns in data and “learn” over time,
updating algorithms as new information is presented.
When paired with software sensors and communication
networks, AI allows for the strategic and cost-effective operation
of utilities, including better planning and execution of projects,
better tracking and understanding of resource-loss in real
time, more efficient collection and distribution networks, and
maximum revenue capture and customer satisfaction.
Umgeni Water
BACK TO TOP
The Water Wheel September/October 2019
16
Feature
DOMESTIC WATER USE
Cape Town survived a historic three-year drought that
threatened to shut down the city’s water supply at the height of
the crisis in January 2018.
During the course of the drought, a team of behavioural
economists from the University of Cape Town (UCT) worked
with the City of Cape Town to test how green ‘nudging’ tools —
interventions to encourage behavioural changes that could aid
the meeting of environmental/conservation goals — could get
Capetonians to adopt more water-wise behaviour.
Prof Martine Visser, lead researcher on this project and Director
of UCT’s Environmental Policy Research Unit (EPRU), was recently
awarded a prestigious National Science and Technology Forum
(NSTF) award for her research in this field. She is a professor
of economics at UCT’s School of Economics and the research
chair of the African Climate Development Initiative (ACDI), an
interdisciplinary research hub at UCT.
The NSTF-Water Research Commission (WRC) Award that Prof
Visser received recognises research, conducted over the last
five to 10 years, that was aimed at achieving sustainable water
management and generating knowledge and solutions.
Prof Visser’s research was supported by the EPRU’s team of
behavioural economists (including Kerri Brick, Johanna Brühl,
Samantha De Martino, Megan McLaren and Kenneth Berger)
as well as electrical engineer, Prof Thinus Booysen, from
Stellenbosch University. The researchers explored how nudging
tools and clear communication messages can influence society’s
water usage.
Changing behaviour, saving water – helping Capetonians to
help themselves
Green ‘nudging’
tools can play
a key role in
ensuring city
water security
during periods of
extreme drought.
Jorisna Bonthuys
reports on some
of the research
conducted by
behavioural
economists in
Cape Town during
the recent drought.
BACK TO TOP
The Water Wheel September/October 201917
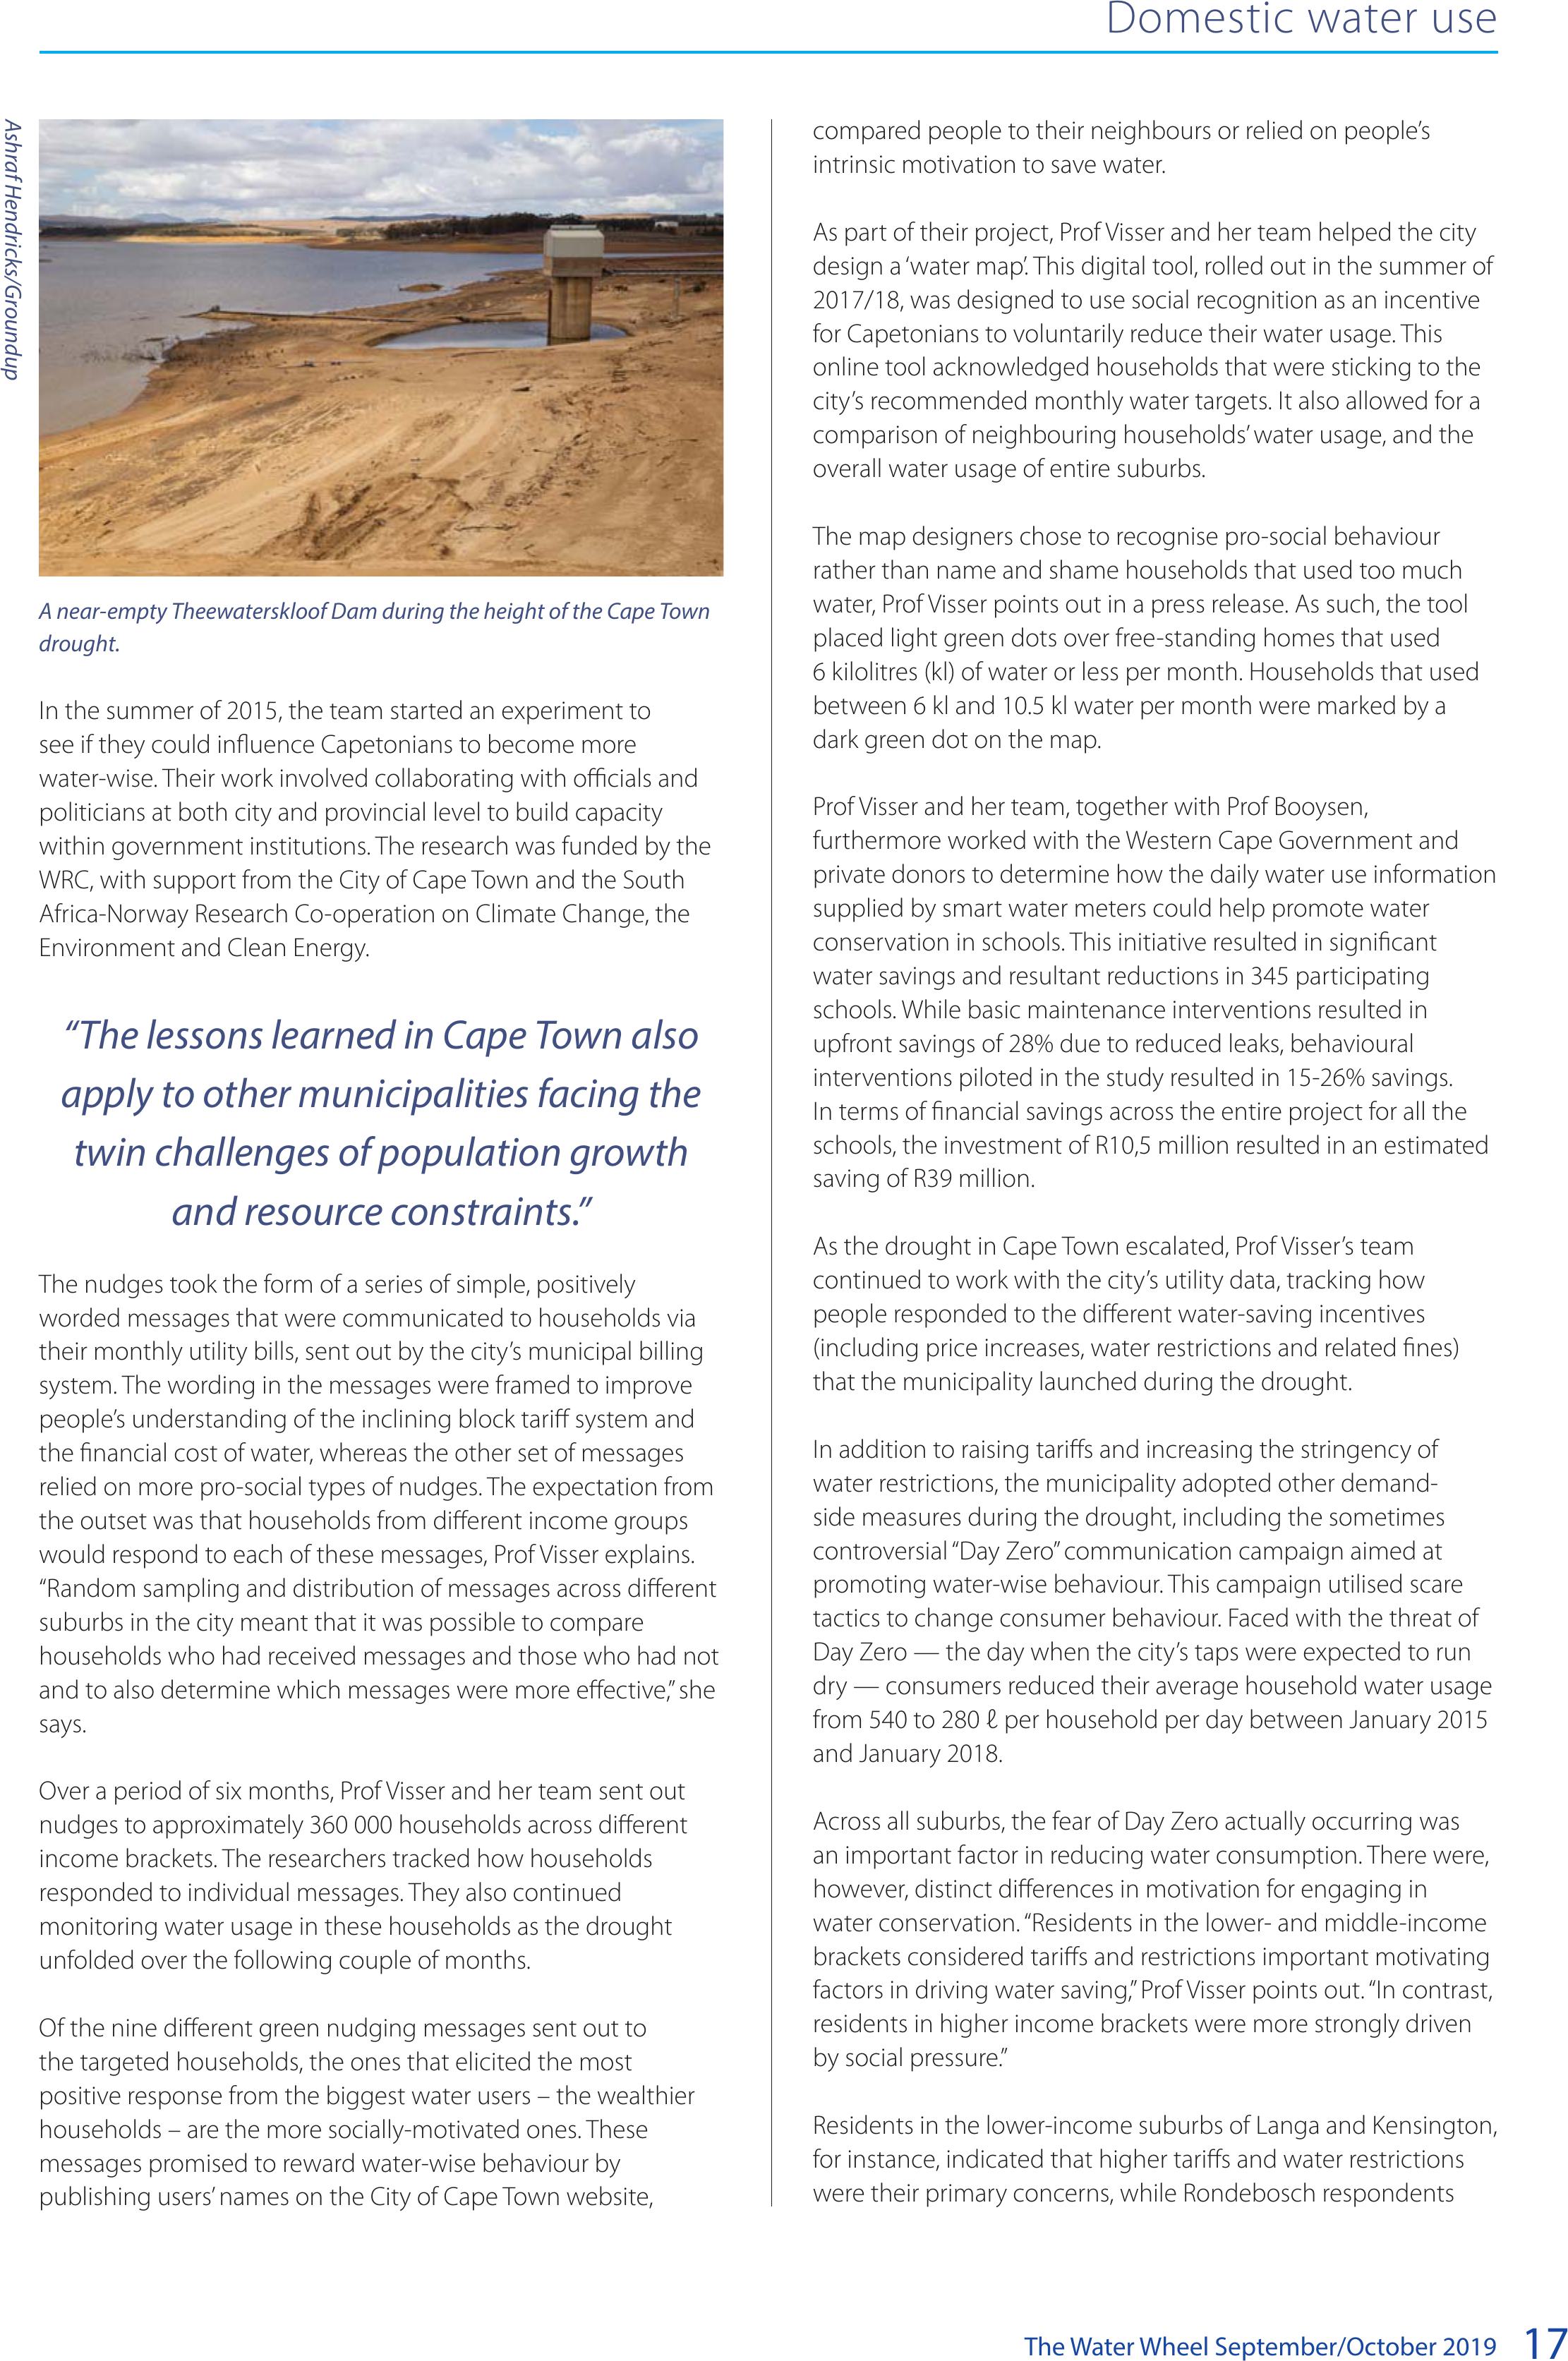
A near-empty Theewaterskloof Dam during the height of the Cape Town
drought.
In the summer of 2015, the team started an experiment to
see if they could influence Capetonians to become more
water-wise. Their work involved collaborating with officials and
politicians at both city and provincial level to build capacity
within government institutions. The research was funded by the
WRC, with support from the City of Cape Town and the South
Africa-Norway Research Co-operation on Climate Change, the
Environment and Clean Energy.
“The lessons learned in Cape Town also
apply to other municipalities facing the
twin challenges of population growth
and resource constraints.”
The nudges took the form of a series of simple, positively
worded messages that were communicated to households via
their monthly utility bills, sent out by the city’s municipal billing
system. The wording in the messages were framed to improve
people’s understanding of the inclining block tariff system and
the financial cost of water, whereas the other set of messages
relied on more pro-social types of nudges. The expectation from
the outset was that households from different income groups
would respond to each of these messages, Prof Visser explains.
“Random sampling and distribution of messages across different
suburbs in the city meant that it was possible to compare
households who had received messages and those who had not
and to also determine which messages were more effective,” she
says.
Over a period of six months, Prof Visser and her team sent out
nudges to approximately 360 000 households across different
income brackets. The researchers tracked how households
responded to individual messages. They also continued
monitoring water usage in these households as the drought
unfolded over the following couple of months.
Of the nine different green nudging messages sent out to
the targeted households, the ones that elicited the most
positive response from the biggest water users – the wealthier
households – are the more socially-motivated ones. These
messages promised to reward water-wise behaviour by
publishing users’ names on the City of Cape Town website,
compared people to their neighbours or relied on people’s
intrinsic motivation to save water.
As part of their project, Prof Visser and her team helped the city
design a ‘water map’. This digital tool, rolled out in the summer of
2017/18, was designed to use social recognition as an incentive
for Capetonians to voluntarily reduce their water usage. This
online tool acknowledged households that were sticking to the
city’s recommended monthly water targets. It also allowed for a
comparison of neighbouring households’ water usage, and the
overall water usage of entire suburbs.
The map designers chose to recognise pro-social behaviour
rather than name and shame households that used too much
water, Prof Visser points out in a press release. As such, the tool
placed light green dots over free-standing homes that used
6 kilolitres (kl) of water or less per month. Households that used
between 6 kl and 10.5 kl water per month were marked by a
dark green dot on the map.
Prof Visser and her team, together with Prof Booysen,
furthermore worked with the Western Cape Government and
private donors to determine how the daily water use information
supplied by smart water meters could help promote water
conservation in schools. This initiative resulted in significant
water savings and resultant reductions in 345 participating
schools. While basic maintenance interventions resulted in
upfront savings of 28% due to reduced leaks, behavioural
interventions piloted in the study resulted in 15-26% savings.
In terms of financial savings across the entire project for all the
schools, the investment of R10,5 million resulted in an estimated
saving of R39 million.
As the drought in Cape Town escalated, Prof Visser’s team
continued to work with the city’s utility data, tracking how
people responded to the different water-saving incentives
(including price increases, water restrictions and related fines)
that the municipality launched during the drought.
In addition to raising tariffs and increasing the stringency of
water restrictions, the municipality adopted other demand-
side measures during the drought, including the sometimes
controversial “Day Zero” communication campaign aimed at
promoting water-wise behaviour. This campaign utilised scare
tactics to change consumer behaviour. Faced with the threat of
Day Zero — the day when the city’s taps were expected to run
dry — consumers reduced their average household water usage
from 540 to 280 ℓ per household per day between January 2015
and January 2018.
Across all suburbs, the fear of Day Zero actually occurring was
an important factor in reducing water consumption. There were,
however, distinct differences in motivation for engaging in
water conservation. “Residents in the lower- and middle-income
brackets considered tariffs and restrictions important motivating
factors in driving water saving,” Prof Visser points out. “In contrast,
residents in higher income brackets were more strongly driven
by social pressure.”
Residents in the lower-income suburbs of Langa and Kensington,
for instance, indicated that higher tariffs and water restrictions
were their primary concerns, while Rondebosch respondents
Domestic water use
Ashraf Hendricks/Groundup
BACK TO TOP
The Water Wheel September/October 2019
18
Domestic water use
listed civil duty and social pressure as the key drivers behind
their efforts to save water. The behaviour of middle- and higher-
income households did not change much in response to water
price increases or the behavioural nudges.
“Inequality remains a significant challenge within the city and
its surrounds, and was identified as a critical factor to consider
when planning responses to the recent water crisis,” Prof Visser
says.
Cape Town provides a prime example of how a municipality
can use nudges to reinforce government policy, Prof Visser
believes. “Green nudging can be utilised by both small and
large municipalities to ease pressure on overstretched water
supplies,” she says. “This tactic may benefit the many other cities
and towns impacted by water stress during extreme drought.”
In recent years, other metros such as Nelson Mandela Bay as
well as smaller municipalities in the Western Cape have, for
instance, been under significant stress with regards to their
water resources. Of the eight metros in South Africa, seven
implemented water restrictions in the summer of 2016/17 due
to low dam levels.
Spotlight on the drought
The 2015—2017 drought in the Western Cape (the worst in a
century) has served as the backdrop for innovative research
performed at the ACDI. This research has already yielded
valuable new insights about the drought and changing water
risk in the region.
Evidence suggests that a significant part of the drought may be
attributed to climate change and that more events of this nature
can be expected. Events like the recent multi-year drought are
becoming the “new normal” in southern Africa due to unfolding
climate change. Not only the likelihood, but also the severity
of extreme climate events are expected to increase in the near
future.
Extreme weather is becoming more common in the region,
ranging from heat waves and severe droughts in Cape Town and
Gaborone to record floods in Johannesburg and Maputo.
What this translates to is a need to be better prepared for
extremes and to continuously drive and plan for resource
efficiency, Prof Mark New, director of the ACDI, indicated
in a recent interview. “Climate change means that climate
patterns, including rainfall amounts and timing, are shifting,
thereby impacting on water resource planning,” he points out.
“Municipalities and water resource managers in southern Africa
should brace themselves for impending extreme weather and its
impact on humans, nature and infrastructure.”
Prof New is driving efforts at UCT to understand changes in
climate risk on the continent, and how humans are contributing
to them. His particular area of expertise is termed ‘climate
attribution science’. This field of science involves attributing
human-related causes to extreme weather events associated
with climate change, as well as measuring the impact these
events have on related loss and damage. This impact will be felt
across society, especially in urban areas that are experiencing
rapid growth largely through informal and poorly planned peri-
urban expansion.
Until recently, most climate attribution studies were performed
in the Global North. New, however, collaborated with leading
experts to determine the anthropogenic influence on the
drivers of the recent Western Cape drought. Their research,
based on historical rainfall and dam inflow data, shows that
human-induced climate change and its effect on rainfall patterns
rendered the drought roughly three times more likely to occur
than would have been the case in a world without human
impact.
The research also highlights how the frequency of a drought of
this degree has changed over time because of human influence
in the province. Events like this one, which almost had Cape
Town’s taps running dry, are now no longer likely to happen
every 50 years, but every 15. “Both the frequency and severity
of climate-induced disasters are increasing. At the same time,
the extent, duration and seasonal distribution of rainfall are
changing. Along with higher temperature levels and increased
evaporation, the implications of drought and climate change
for run-off and long-term assurance of water supply are serious,”
New emphasises.
In theory, the Western Cape’s water resource system should
be reliable 49 out of every 50 years, but its designers did not
consider changing climate risk profiles. The risk of water resource
systems failing is increasing as the climate changes.
New believes climate attribution research is vital to inform the
planning of water management systems within the context of
drier and hotter regional conditions.
One of Cape Town’s water-saving campaign posters.
Water-saving tips:
The more you save, the less you pay – and more water remains in our dams.
SHARE THIS with others, and visit www.capetown.gov.za/thinkwater
for more information and guidelines.
ToiletŴushing and sanitation
Let
the ‘yellow mellow’ at home, work, school,
gym, shops, etc. Don't use it as a dustbin.
Place a full glass bottle in your cistern to
(if you have no choice but to use municipal
drinking water).
Flush with greywater only (laundry, bath
and shower water) or with rain, borehole
or well-point water.
Use less toilet paper to minimise the risk
of sewer blockages and do not use your
toilet as a dustbin.
Close toilet stopcock (angle valve).
You will save municipal drinking water.
Use bleach or disinfectant to regularly
sanitise toilets and surrounding areas
and keep hands sanitised to prevent
health risks.
Please note: The use of water from alternative sources has some health and hygiene risks you must avoid.
Keep hands and surface areas sanitised and disinfected. Don't keep greywater for longer than 24 hours.
Keep water containers in a safe place as children can drown in them.
Body washing and personal hygiene
Take short, stop-start showers.
Wet your body. Turn off the tap. Soap.
Rinse quickly.
Don’t let taps run for too long or at full
Use a cup for shaving, brushing
teeth, etc.
No shower? Take a sponge bath.
Use minimal water in a basin, bowl
or washtub (‘waskom’).
Use waterless hand sanitiser instead
of washing your hands.
Collect as much washing water as possible
as a priority.
Excess greywater can be used for plants
or washing vehicles.
Don’t let water run while you wait for
it to heat. If possible, use cold water
or heat your water for a sponge bath,
in a kettle or on the stove.
BACK TO TOP

The Water Wheel September/October 201919
“Residents in the lower- and
middle-income brackets considered taris
and restrictions important motivating
factors in driving water saving. In
contrast, residents in higher income
brackets were more strongly driven by
social pressure.”
Building adaptive capacity
Many lessons regarding the management of water risks and
security issues during times of drought have been learned, Prof
Visser points out. “The lessons learned in Cape Town also apply
to other municipalities facing the twin challenges of population
growth and resource constraints,” she says.
One such lesson is that household-based tariff blocks place a
disproportionate burden on poorer households where backyard
dwellers are present. Sharing clear, relevant information with
members of the public during times of crisis is also key to driving
behavioural change, according to the research.
Although rapid-onset disasters often have devastating effects,
slow-onset climate events such as drought can also detrimental.
Cities must build their adaptive capacity to effectively respond
to extreme events, Prof Gina Ziervogel states. Ziervogel, based in
UCT’s Department of Environmental and Geographical Science,
is a research chair at the ACDI.
As climate variability increases and the impact of climate
change becomes more acute, cities need to take a critical look
at their preparedness, Ziervogel indicated in a recent report
titled Unpacking the Cape Town Drought. This report, compiled
for the National Treasury’s Cities Support Programme, aims to
ensure that lessons learned from Cape Town will inform other
municipalities when they adapt to drought and water insecurity.
The drought illustrated how important it is to be prepared for
extreme events, be they climate-related or other, as well as the
need to build community resilience. Local governments, Prof
Ziervogel’s research indicates, must focus on several areas to
successfully strengthen urban water resilience and better adapt
to climate change. These areas include improving data collection
and communication, strengthening governance, improving
collaboration within municipal departments, engaging with
experts, and enabling flexible and adaptive decision-making.
Climate change is a concern that should be better integrated
into water planning, Prof Ziervogel points out. Many of the
problems related to water quality and quantity and to extreme
events like flooding in urban areas could be aggravated by the
impacts of climate change.
To build adaptive, water-wise cities, municipalities need a vision
and plan for implementation — a more nuanced and holistic
response that recognises the role of people, partnerships,
leadership and the overall water system.
Prof Ziervogel concludes that increased support across different
spheres of government is needed to promote awareness of the
importance of accounting for climate change in planning efforts
and to ensure buy-in from municipalities in this regard.
For more information, visit www.acdi.uct.ac.za and https://
efdinitiative.org.
Domestic water use
WATER AND SANITATION
THE SERVICE CHARGE
WATER COSTS
SANITATION COSTS
MUNICIPAL WATER BOTTLED WATER
for infrastructure to supply water to your home
AS PER LEVEL 6 RESTRICTIONS
>Ãi`iÛiÈÌ>ÀvvÃvÀwÀÃÌÈ>`>£xViVÌ°
4c
per litre
R12
per litre
TARIFFS EXPLAINED
WHAT WATER TARIFFS ARE USED FOR
YOUR WATER TARIFFS
CONSIST OF THREE PARTS
GREAT WATER SAVINGS
HAVE RESULTED IN SIGNIFICANT LOSS OF INCOME FOR THE
CITY OF CAPE TOWN
THE DR UGHT
HAS COMPELLED US TO RELOOK TARIFFS
1
2
3
vs
vÀ,ÓnÇxÕ«Ì,ÓxnÇx
More than 100 mm
15 mm R64,40
20 mmR115
25 mmR179
40 mmR460
50 mm R718,75
80 mm R1 840
These costs include the safe removal of waste
Ü>ÌiÀ>`ÃiÜ>}ivÀÞÕÀ«À«iÀÌÞ°
,i}ÃÌiÀi``}iÌÕÃi`Ã}iÌÌiÀwÀÃÌÇ]ÎxvÀvÀii°
Registered
indigent
households
}iÌÌiÀwÀÃÌ
£ä]xvÀvÀii
0 - 4,2 kl = R24,72 per kl
4,2 - 7,35 kl = R39 per kl
7,35 - 24,5 kl = R108,07 per kl
24,5 - 35 kl = R108,07 per kl
Maintenance and
infrastructure 87%
13%
New water
programme
MORE INFO: CAPETOWN.GOV.ZA /THINKWATER
THE CITY
DOESN’T MAKE
ANY PROFIT FROM
WATER AND
SANITATION
TARIFFS
These prices include VAT
,i}ÃÌiÀi``}iÌÕÃi`ÃÜÌ>ÛiÌ«>ÞÌÃÃiÀÛViV>À}i°
of households
will be charged
,££xÀiÃÃ
per month
}
7KHVHSULFHVH[FOXGH9$7
These prices include VAT
The City services a pipe network of close to 11 000 km
(the distance from Cape Town to Australia)
Cape Town only loses about 16% of its water due
to leaks, compared to the national average of 36%.
11 000 km of pipeline
16% leak rate
95%
SA AUS
čwÝi`À>ÌiÜLiV>À}i`]`i«i`}ÌiÃâi
vÌiViVÌÌÞÕÀ«À«iÀÌÞ°/Ãy>ÌÀ>Ìi
i«ÃVÀi>Ìi>Ài`ÀÕ}ÌÀiÃiÌVÌÞ°
0 - 6 kl = R28,90 per kl
10,5 - 35 kl = R120,27 per kl
6 - 10,5 kl = R46 per kl
MORE THAN 35 kl = R1 000per kl
THE COST OF WATER IS LINKED
TO WATER RESTRICTIONS; AS
DAM LEVELS RISE, RESTRICTONS
AND COSTS MAY BE REDUCED
ACCORDINGLY.
An inforgraphic released by the City of Cape Town during the drought.
BACK TO TOP
The Water Wheel September/October 2019
20
Your daily dose – How SA is handling the threat of microbial
resistance
By now many of us have heard of somebody in our circles
who has fallen victim to drug-resistant infection or disease.
Antibiotic resistance is the most pressing problem, to the extent
that hospitals are now widely feared as a place to ‘pick up a
superbug’, such as methicillin-resistant Staphylococcus aureus
(MRSE), rather than being viewed as a safe place to recuperate
from operations and illness. But the problem extends to other
antimicrobials, such as antivirals and antimalarials too, so the
term ‘antimicrobial resistance’, or AMR, is more commonly used
nowadays.
In April, the United Nations Ad hoc Interagency Coordinating
Group on Antimicrobial Resistance released a report warning
that drug-resistant diseases could cause 10 million deaths each
year by 2050 – an alarming increase from the current estimate
of at least 700 000 deaths annually, including 230 000 due to
multidrug-resistant tuberculosis. The report, entitled No Time to
Wait: Securing the future from drug-resistant infections, noted
that more and more common diseases such as respiratory tract
infections, sexually transmitted infections and urinary tract
infections are untreatable, that lifesaving medical procedures
are becoming much riskier, and that our food systems are
increasingly precarious.
About a month after that report was released, the topic was in
the news again, with headlines like ‘World’s rivers awash with
Low levels of antibiotics in our drinking water may contribute to the growing threat of
antimicrobial resistance. Article by Sue Matthews.
WATER AND HEALTH
Feature
BACK TO TOP
The Water Wheel September/October 201921
dangerous levels of antibiotics’ (The Guardian) and ‘Superbug
threat grows as rivers contaminated with antibiotics’ (Eyewitness
News). This was a result of a press release issued by the University
of York in the United Kingdom, reporting key findings of a global
study that sampled rivers in 72 countries and found antibiotics at
65% of the sampling sites.
“The results are quite eye-opening and worrying, demonstrating
the widespread contamination of river systems around the
world with antibiotic compounds,” one of the project leaders,
Prof Alistair Boxall, was quoted as saying. “Many scientists and
policymakers now recognise the role of the natural environment
in the antimicrobial resistance problem. Our data show that
antibiotic contamination of rivers could be an important
contributor.”
The most prevalent of the 14 commonly used antibiotics tested
for was trimethoprim, detected at 307 of the 711 sites. Although
mainly used to treat urinary tract infections, it is also used to
treat Pneumocystis pneumonia in HIV-infected patients. The
research team compared concentrations of all the antibiotics
with ‘safe’ levels – the Predicted No Effect Concentration (PNEC)
established by the AMR Industry Alliance – and found that
these limits were most frequently exceeded in Asia and Africa.
Likewise, sites where antibiotics exceeded the limits by the
greatest degree were in Bangladesh, Kenya, Ghana, Pakistan and
Nigeria.
South Africa was included in the study, but more detailed,
country-specific results have not yet been released. The study
involved sending sampling kits across the world to partners
who were asked to take samples along their local river system,
freeze them and courier them back to the University of York for
analysis. In South Africa, the CSIR’s research group leader for
source-directed scientific measures, Dr Melusi Thwala, acted as
the local partner. Pending publication of the report, he was at
liberty to say only that the sampling was a once-off screening
exercise along the Pienaars River to the east of Pretoria, with five
sampling sites between Boschkop Road and the R513, just below
the Baviaanspoort Wastewater Treatment Works to the north of
Mamelodi.
We already know, however, that antibiotics are detectable
not only in our rivers, but also in our drinking water, thanks to
two Water Research Commission-funded projects led by Prof
Carlos Bezuidenhout of North-West University. The first of these,
completed in 2016, was entitled ‘A scoping study on the levels
of antimicrobials and presence of antibiotic resistant bacteria
in drinking water’ (WRC Report No. KV 360/16). Samples
were collected from raw water and final treated water at three
drinking water production facilities in Gauteng and the North
West Province, and tested for a variety of antimicrobials. These
included antibiotics (ampicillin; chloramphenicol; erythromycin;
neomycin; oxytetracycline; streptomycin and trimethoprim),
fungicides (amphotericin B and tolnaftate), pharmaceutical
and personal care products (triclosan; 3,4-methylbenzylidene
and DEET) and agrochemicals (BenfuraCarb; carbofuran;
2-chlorophenol; 2,4-dichlorophenol and chlorpyriphos). The
results showed that a cocktail of these substances enter drinking
water production facilities in the raw water, although the levels
were very low. Generally, the levels were further reduced by the
drinking water production processes, in some cases to below
detection limits in the final treated water.
Antibiotic resistant bacteria (ARB) were also detected in raw
water at all three facilities, and results indicated that these were
not completely removed by the drinking water production
processes. Based on these findings, the research team
recommended that further research be conducted to investigate
the relationship between antibiotics, ARB and physico-chemical
parameters. Furthermore, they suggested that the presence of
antibiotic resistance genes or other genetic materials in both
ARB and in bulk water be investigated.
This follow-up work was done in the second research project
entitled ‘Antibiotic resistant bacteria and genes in drinking
water: Implications for drinking water production and quality
monitoring’. Sample collection was expanded to eight drinking
water production facilities of various sizes (between 2.5 and
4 000 Ml/day), the largest of which supplies water to a
population of 12 million people. All the facilities achieved high
Blue Drop scores for microbiological and chemical quality in
2012, and have at least one filtration step before chlorination.
The results confirmed that the quality of drinking water was
affected by upstream land-use and human activities, which are
a source of antibiotics, ARB and associated genes that could be
reduced but not completely removed by the current drinking
water production systems. In addition, genes potentially
Water and health
A poster from the World Health Organisation warning against the
misuse of antibiotics.
BACK TO TOP
The Water Wheel September/October 2019
22
responsible for antibiotic resistance phenotypes could be
detected in isolated and purified bacteria that were resistant
to multiple antibiotics. “This is an indication that the genes are
functional and dissemination of such genes could potentially
have detrimental consequences should they be transferred to
infective pathogenic species,” the research team note in the
conclusions of the report. “Such multiple antibiotic resistant
pathogens will be difficult and very costly to treat.”
A large percentage of the bacteria isolated from both raw
and drinking water had virulence features in the form of
extracellular enzymes that could allow for the invasion of host
tissue. The research team therefore suggested that a further
investigative study be done on the health-related impacts of
the identified bacterial species and their virulence. They also
gave a number of other recommendations, including the use of
rapid enzyme-linked immunosorbent assays (ELISAs) at drinking
water production facilities as part of their water safety plans,
which would allow antibiotic residues in water samples to be
quantified and provide trends over time. “The cost for setting up
the equipment and analysis is not prohibitively high,” they note.
Importantly, though, the levels of antibiotics most frequently
detected in the raw and drinking water –trimethoprim, colistin,
beta-lactams and in some cases ciprofloxacin – were between
10 and 1 000 times below the PNEC. For example, the PNEC for
trimethoprim is 500 ng/ℓ and this drug accounts for about a
quarter of all antimicrobial use in South Africa, which has the
world’s largest anti-retroviral programme. Only five of the eight
Water and health
Taking antibiotics when they are not needed accelerates emergence
of antibiotic resistance, one of the biggest threats to global health.
drinking water production facilities were screened for antibiotics,
but in raw water trimethoprim was below the level of detection
at one of these, between 0.4 and 1.1 ng/ℓ at three of the facilities
and just under 39 ng/ℓ at the remaining one – yet even this fell
to 0.5 ng/ℓ in the treated water and 0.2 ng/ℓ in the distribution
network.
It would, therefore, not make economic sense at this stage to
introduce advanced treatment processes, such as ozonation,
distillation, reverse osmosis and advanced oxidation, at all
drinking water production facilities. These methods, typically
only used where the available source water is of low quality, or
for water reclamation from industrial or domestic wastewater,
and for seawater desalination, have very high initial setup and
start-up costs. They also have high ongoing expenses in terms
of energy consumption, replacement of filters and membranes,
and employment of skilled staff to operate and maintain the
systems. So what should be done?
“Addressing the antibiotic resistance crisis requires a
collaborative, multisectoral, and transdisciplinary approach,
taking into consideration the linkages between human health,
animal health and the environment – the One Health approach
– as well as the contributing bacterial interactions both in
clinical and non-clinical settings,” says WRC Research Manager
for the project, Dr Nonhlanhla Kalebaila. “From a water quality
management point of view, more effort needs to be dedicated
towards environmental antibiotic resistance surveillance, as well
as water safety planning and risk management.”
Indeed, the One Health approach is what is advocated by the UN
No Time to Wait report, which also recommends that countries:
• prioritise national action plans to scale-up financing and
capacity-building efforts
• put in place stronger regulatory systems and support
awareness programmes for responsible and prudent use of
antimicrobials by professionals in human, animal and plant
health
• invest in ambitious research and development for new
technologies to combat antimicrobial resistance
• urgently phase out the use of critically important
antimicrobials as growth promoters in agriculture.
South Africa’s Department of Health originally launched
its Antimicrobial Resistance National Strategy Framework
2014–2024 in October 2014 in response to the World Health
Organisation (WHO) resolution on ‘Combating antimicrobial
resistance including antibiotic resistance’, which was adopted
by the World Health Assembly in May 2014, and was followed
by the development of the WHO Global Action Plan for
Antimicrobial Resistance in 2015.
More recently, the document has been revised in conjunction
with the Department of Agriculture, Forestry and Fisheries
(DAFF) now called the Department of Agriculture, Land Reform
and Rural Development, and re-released as the South African
Antimicrobial Resistance National Strategy Framework: A
One Health Approach 2018–2024, although it is listed on the
Department of Health’s website as the AMR National Action Plan.
It contains the following five strategic objectives:
WHO
BACK TO TOP
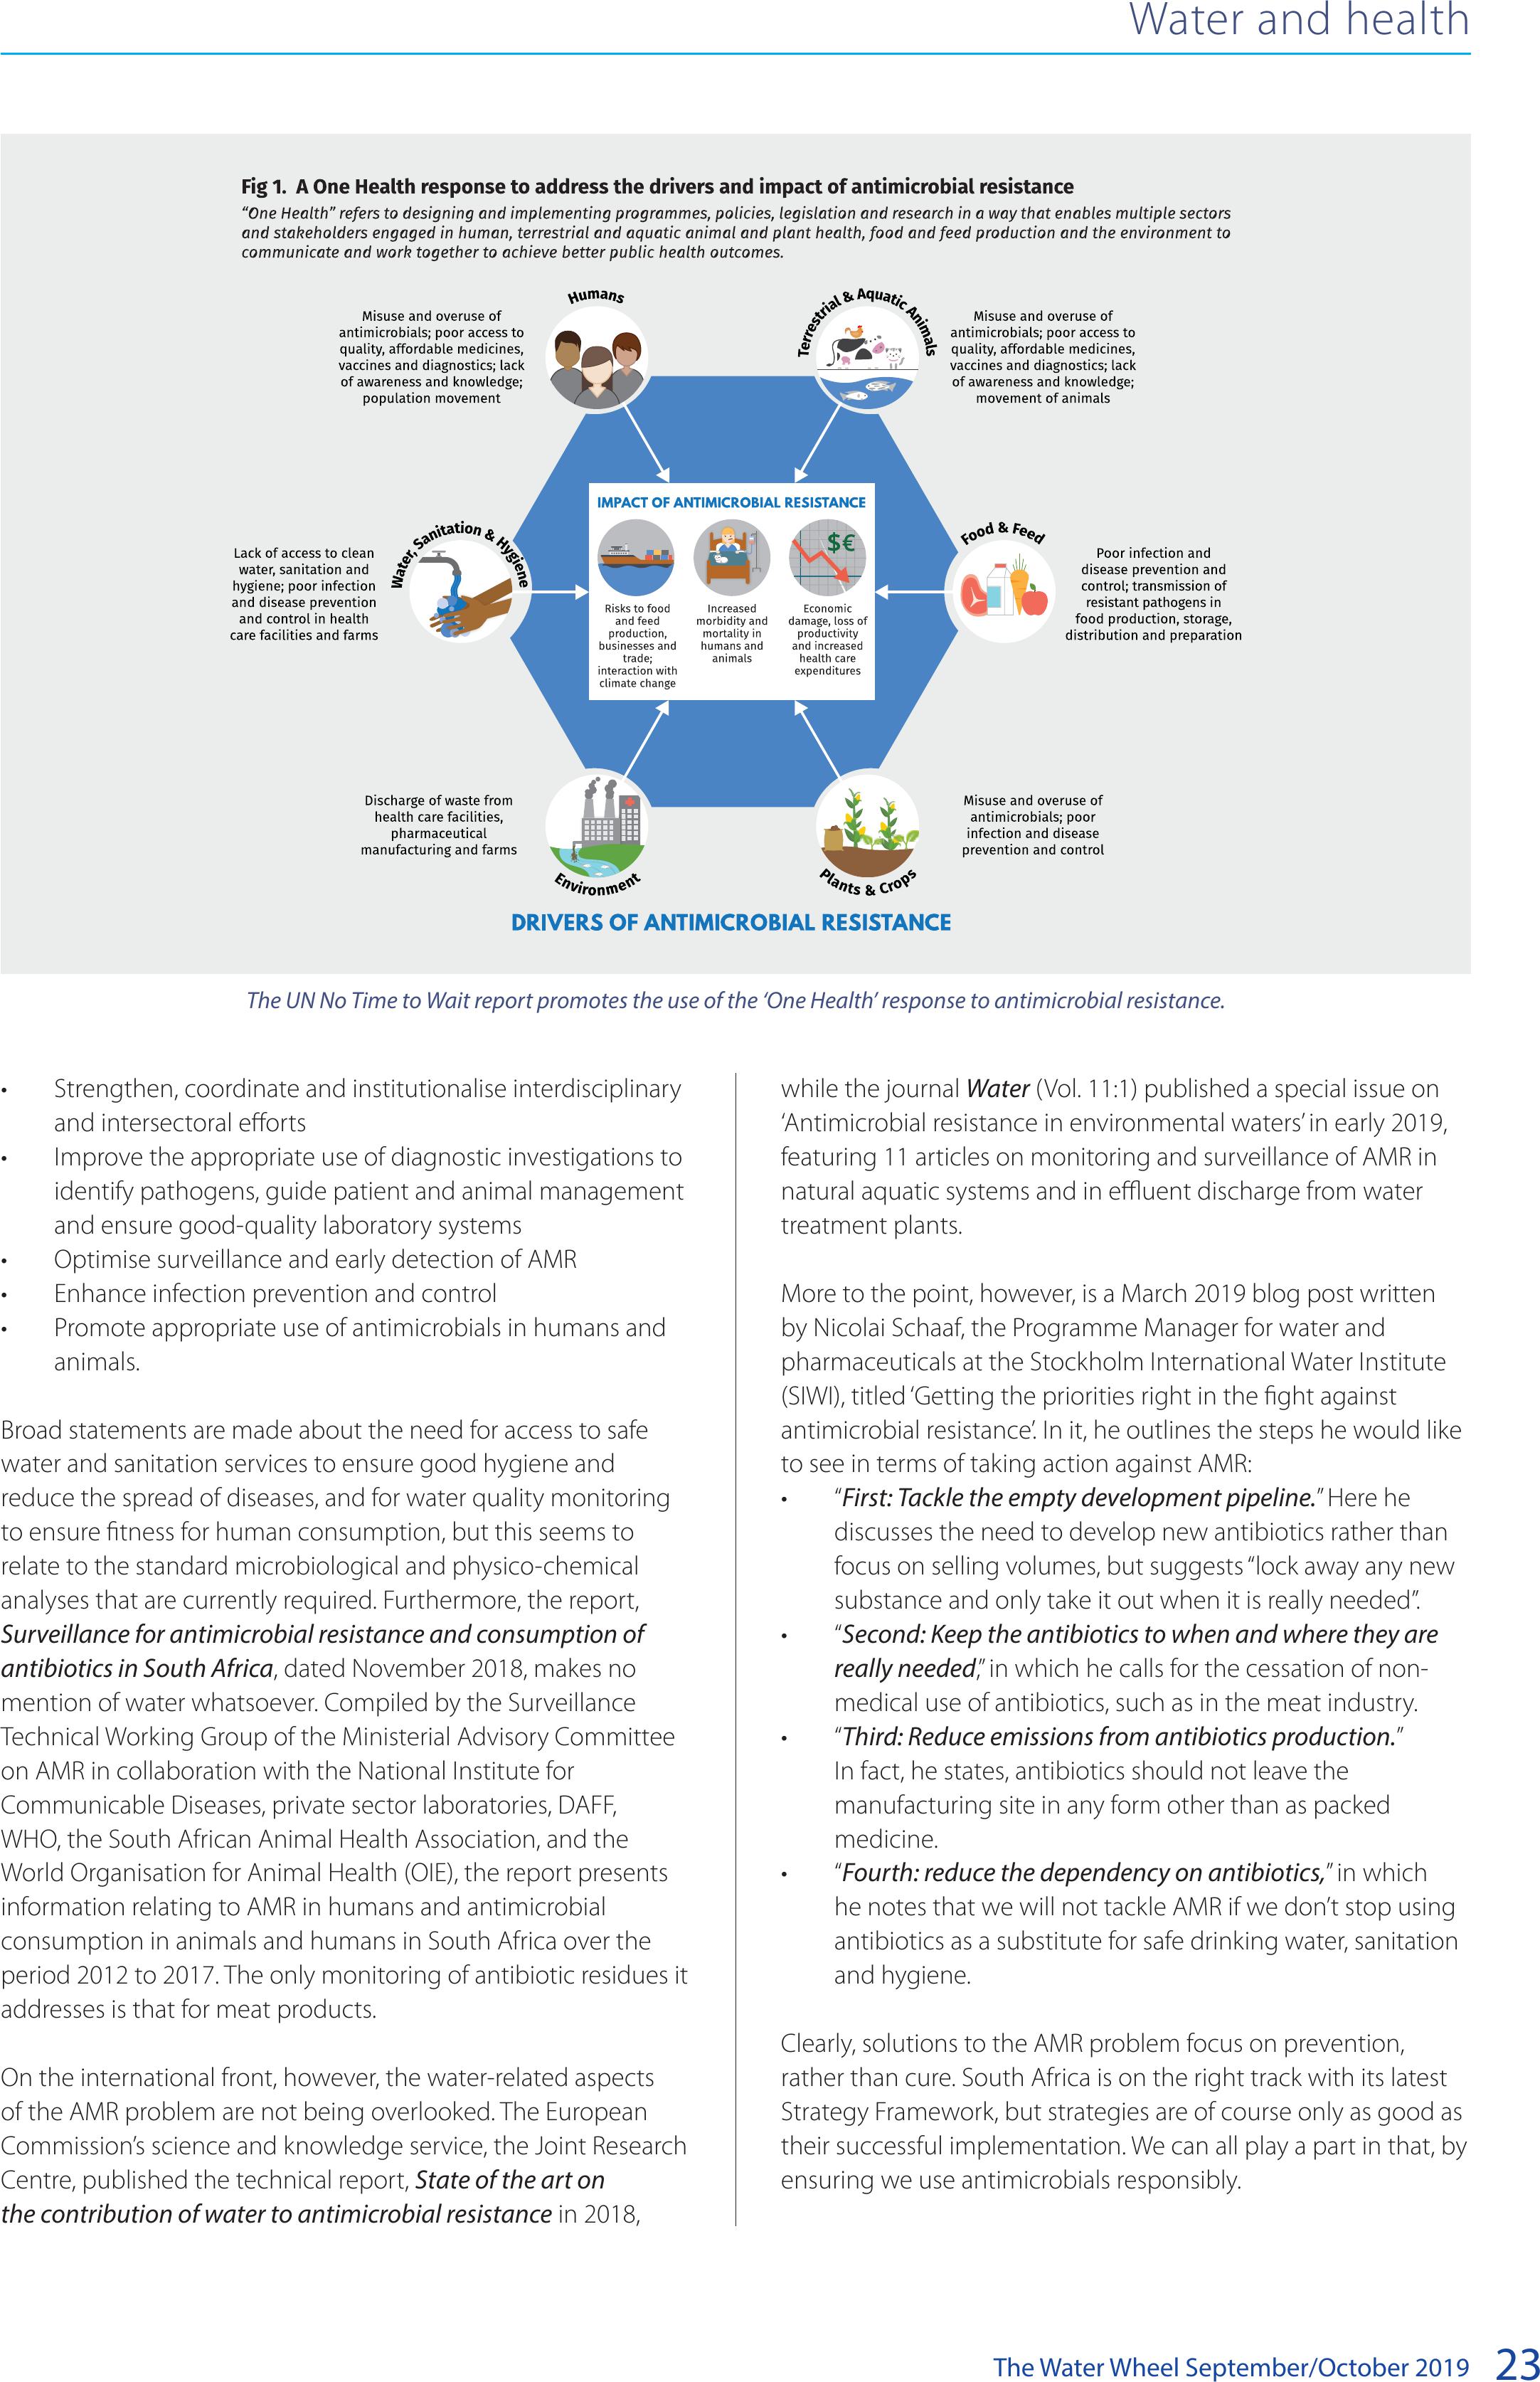
The Water Wheel September/October 201923
• Strengthen, coordinate and institutionalise interdisciplinary
and intersectoral efforts
• Improve the appropriate use of diagnostic investigations to
identify pathogens, guide patient and animal management
and ensure good-quality laboratory systems
• Optimise surveillance and early detection of AMR
• Enhance infection prevention and control
• Promote appropriate use of antimicrobials in humans and
animals.
Broad statements are made about the need for access to safe
water and sanitation services to ensure good hygiene and
reduce the spread of diseases, and for water quality monitoring
to ensure fitness for human consumption, but this seems to
relate to the standard microbiological and physico-chemical
analyses that are currently required. Furthermore, the report,
Surveillance for antimicrobial resistance and consumption of
antibiotics in South Africa, dated November 2018, makes no
mention of water whatsoever. Compiled by the Surveillance
Technical Working Group of the Ministerial Advisory Committee
on AMR in collaboration with the National Institute for
Communicable Diseases, private sector laboratories, DAFF,
WHO, the South African Animal Health Association, and the
World Organisation for Animal Health (OIE), the report presents
information relating to AMR in humans and antimicrobial
consumption in animals and humans in South Africa over the
period 2012 to 2017. The only monitoring of antibiotic residues it
addresses is that for meat products.
On the international front, however, the water-related aspects
of the AMR problem are not being overlooked. The European
Commission’s science and knowledge service, the Joint Research
Centre, published the technical report, State of the art on
the contribution of water to antimicrobial resistance in 2018,
while the journal Water (Vol. 11:1) published a special issue on
‘Antimicrobial resistance in environmental waters’ in early 2019,
featuring 11 articles on monitoring and surveillance of AMR in
natural aquatic systems and in effluent discharge from water
treatment plants.
More to the point, however, is a March 2019 blog post written
by Nicolai Schaaf, the Programme Manager for water and
pharmaceuticals at the Stockholm International Water Institute
(SIWI), titled ‘Getting the priorities right in the fight against
antimicrobial resistance’. In it, he outlines the steps he would like
to see in terms of taking action against AMR:
• “First: Tackle the empty development pipeline.” Here he
discusses the need to develop new antibiotics rather than
focus on selling volumes, but suggests “lock away any new
substance and only take it out when it is really needed”.
• “Second: Keep the antibiotics to when and where they are
really needed,” in which he calls for the cessation of non-
medical use of antibiotics, such as in the meat industry.
• “Third: Reduce emissions from antibiotics production.”
In fact, he states, antibiotics should not leave the
manufacturing site in any form other than as packed
medicine.
• “Fourth: reduce the dependency on antibiotics,” in which
he notes that we will not tackle AMR if we don’t stop using
antibiotics as a substitute for safe drinking water, sanitation
and hygiene.
Clearly, solutions to the AMR problem focus on prevention,
rather than cure. South Africa is on the right track with its latest
Strategy Framework, but strategies are of course only as good as
their successful implementation. We can all play a part in that, by
ensuring we use antimicrobials responsibly.
Water and health
The UN No Time to Wait report promotes the use of the ‘One Health’ response to antimicrobial resistance.
BACK TO TOP
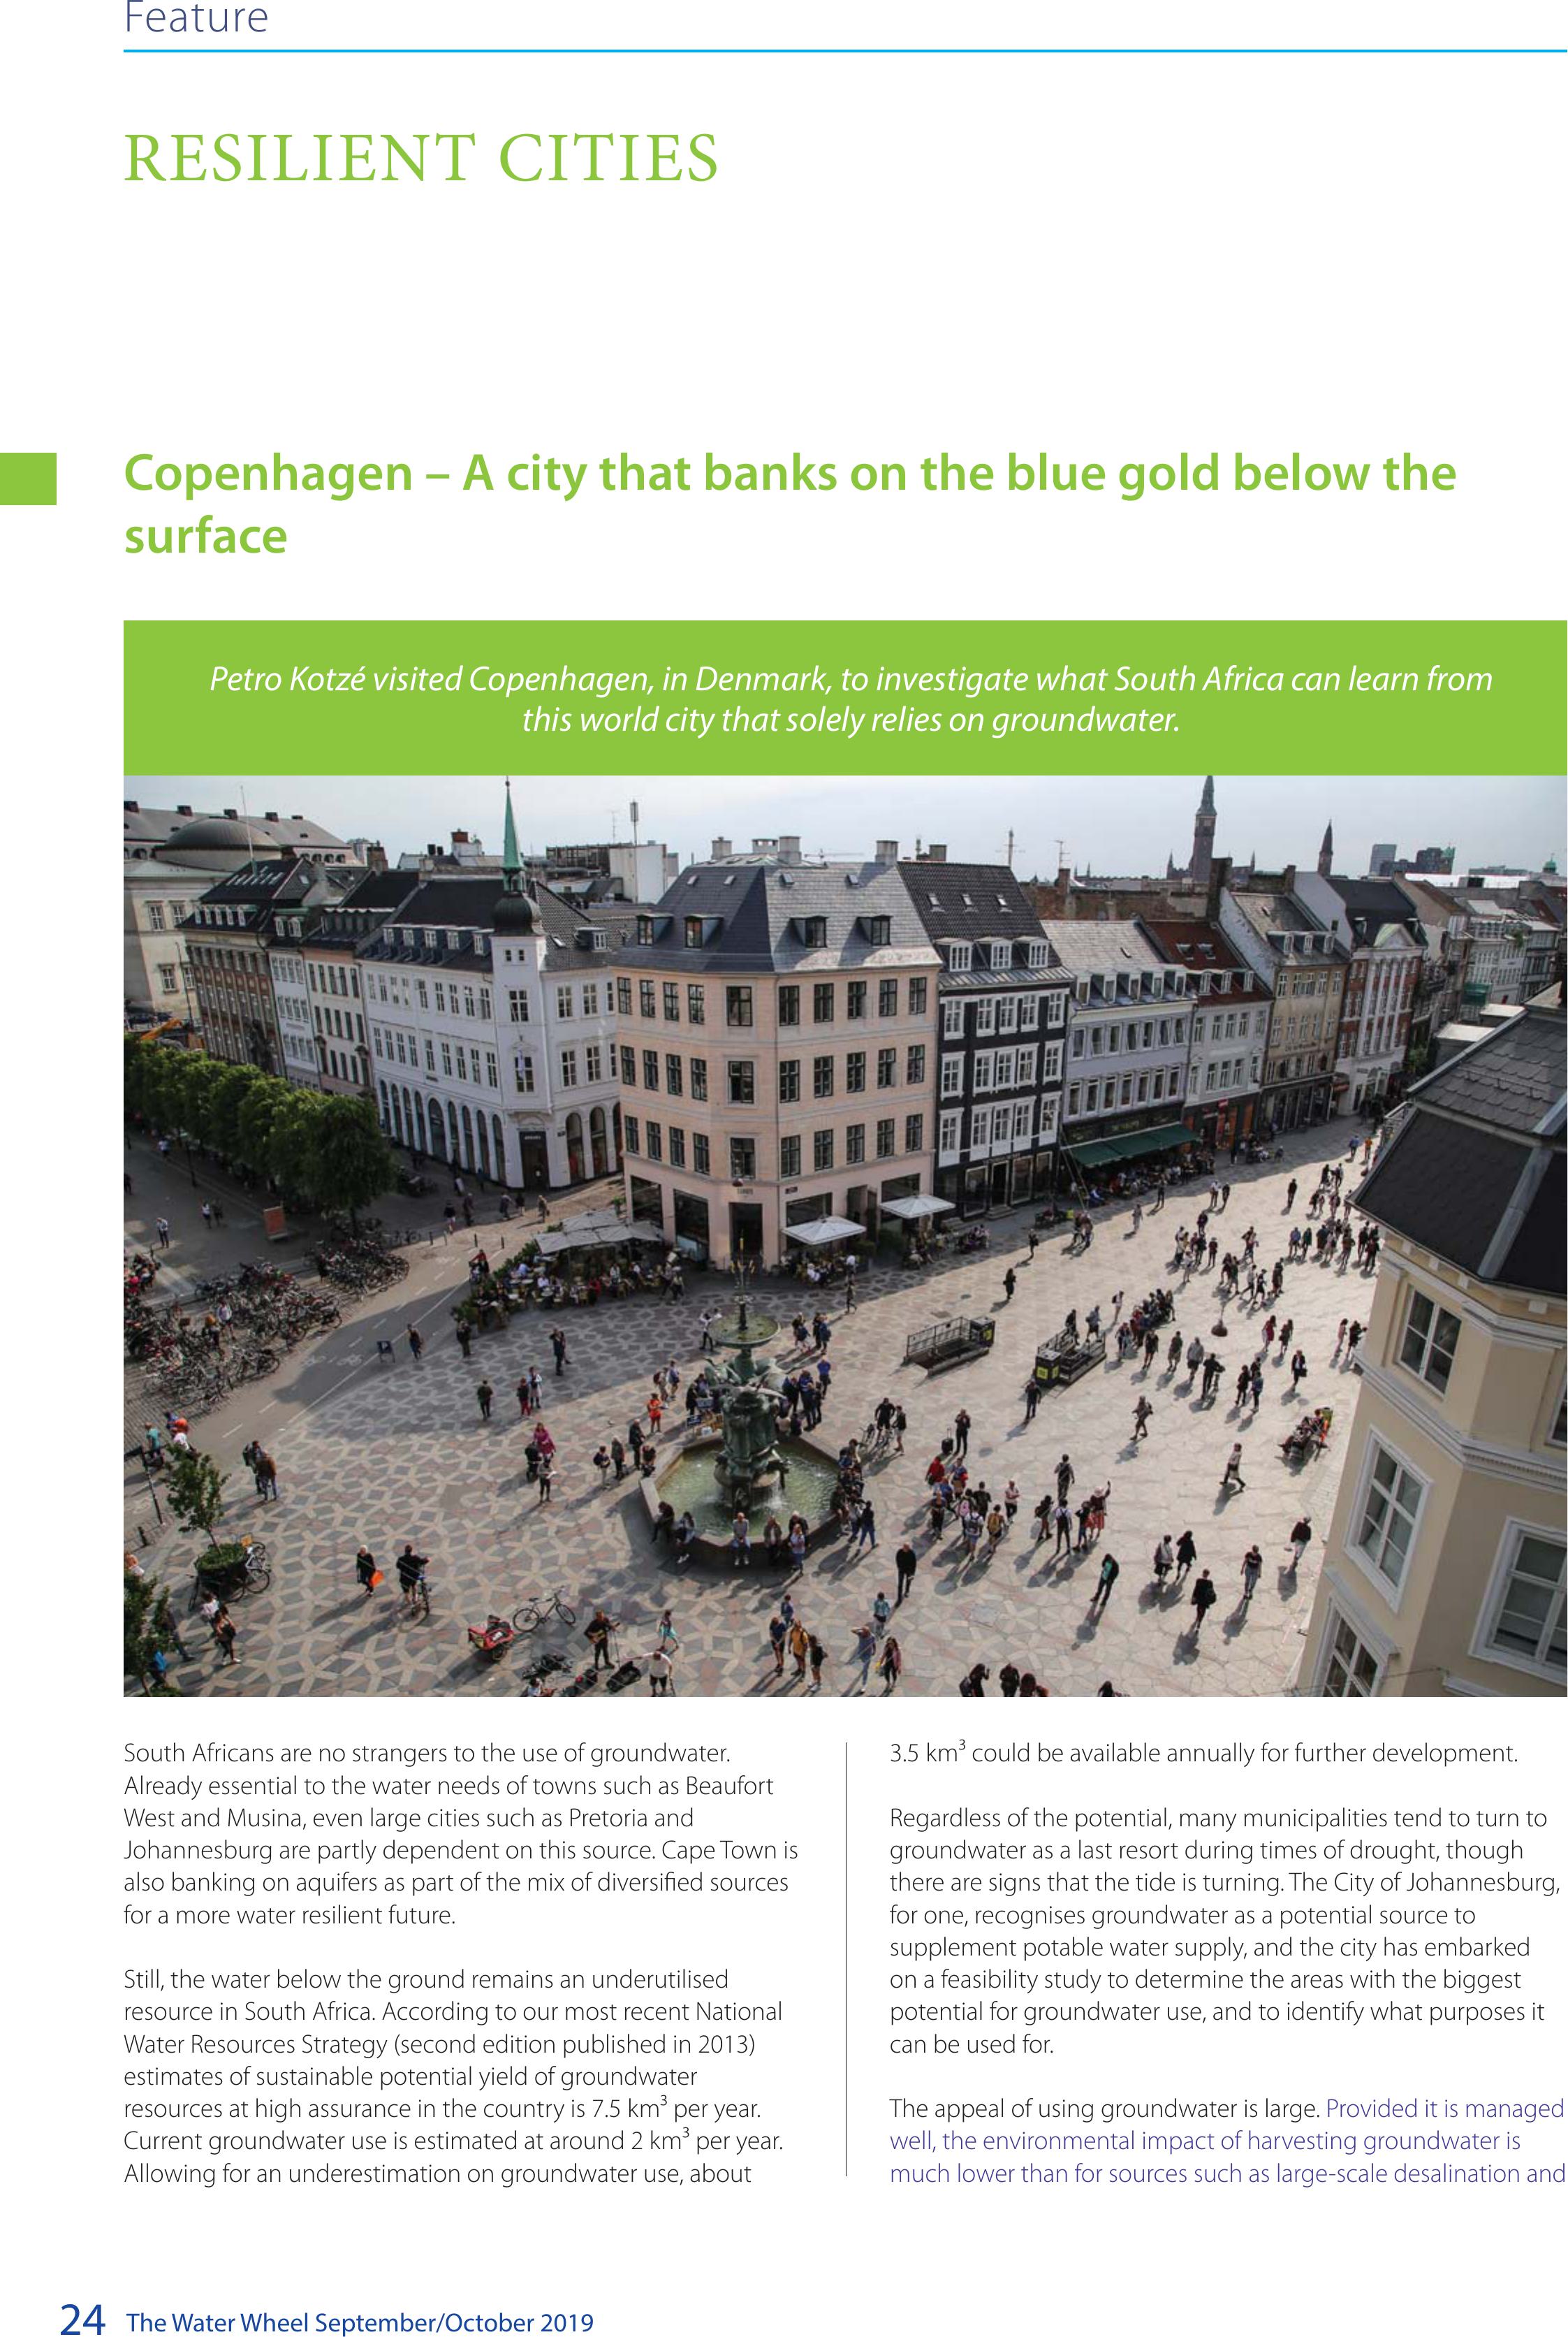
The Water Wheel September/October 2019
24
Feature
RESILIENT CITIES
South Africans are no strangers to the use of groundwater.
Already essential to the water needs of towns such as Beaufort
West and Musina, even large cities such as Pretoria and
Johannesburg are partly dependent on this source. Cape Town is
also banking on aquifers as part of the mix of diversified sources
for a more water resilient future.
Still, the water below the ground remains an underutilised
resource in South Africa. According to our most recent National
Water Resources Strategy (second edition published in 2013)
estimates of sustainable potential yield of groundwater
resources at high assurance in the country is 7.5 km³ per year.
Current groundwater use is estimated at around 2 km³ per year.
Allowing for an underestimation on groundwater use, about
3.5 km³ could be available annually for further development.
Regardless of the potential, many municipalities tend to turn to
groundwater as a last resort during times of drought, though
there are signs that the tide is turning. The City of Johannesburg,
for one, recognises groundwater as a potential source to
supplement potable water supply, and the city has embarked
on a feasibility study to determine the areas with the biggest
potential for groundwater use, and to identify what purposes it
can be used for.
The appeal of using groundwater is large. Provided it is managed
well, the environmental impact of harvesting groundwater is
much lower than for sources such as large-scale desalination and
Copenhagen – A city that banks on the blue gold below the
surface
Petro Kotzé visited Copenhagen, in Denmark, to investigate what South Africa can learn from
this world city that solely relies on groundwater.
BACK TO TOP
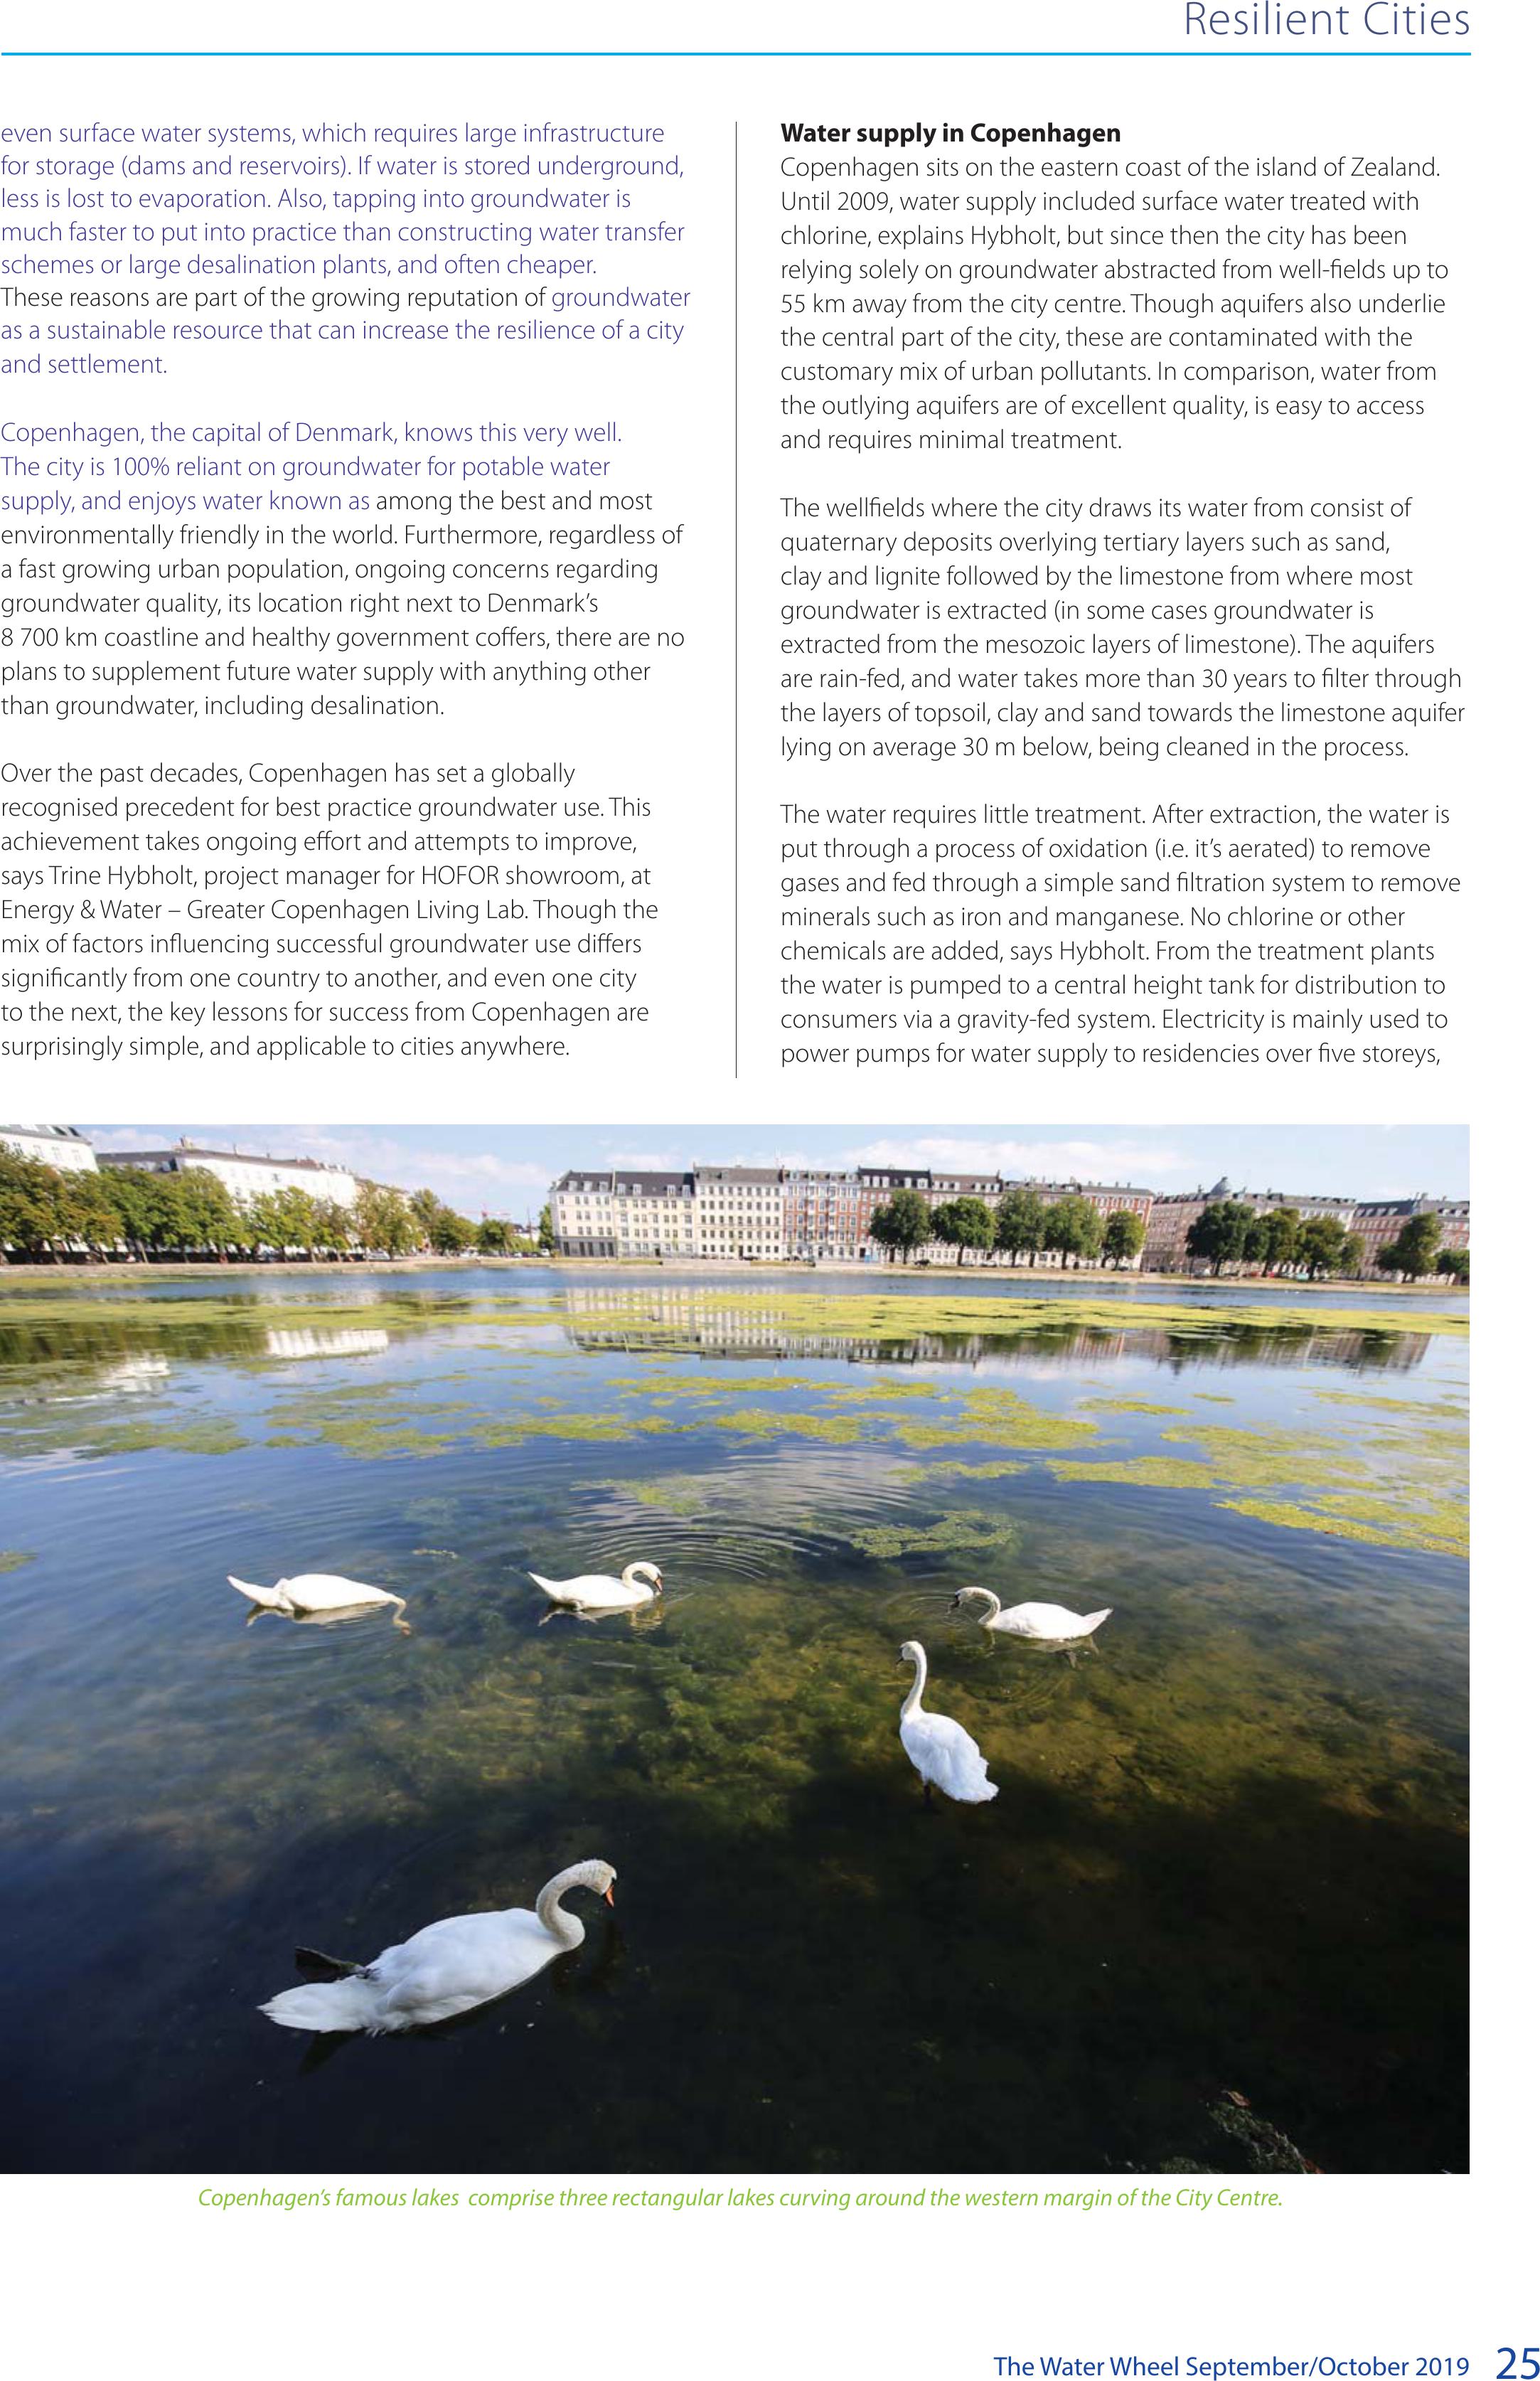
The Water Wheel September/October 201925
even surface water systems, which requires large infrastructure
for storage (dams and reservoirs). If water is stored underground,
less is lost to evaporation. Also, tapping into groundwater is
much faster to put into practice than constructing water transfer
schemes or large desalination plants, and often cheaper.
These reasons are part of the growing reputation of groundwater
as a sustainable resource that can increase the resilience of a city
and settlement.
Copenhagen, the capital of Denmark, knows this very well.
The city is 100% reliant on groundwater for potable water
supply, and enjoys water known as among the best and most
environmentally friendly in the world. Furthermore, regardless of
a fast growing urban population, ongoing concerns regarding
groundwater quality, its location right next to Denmark’s
8 700 km coastline and healthy government coffers, there are no
plans to supplement future water supply with anything other
than groundwater, including desalination.
Over the past decades, Copenhagen has set a globally
recognised precedent for best practice groundwater use. This
achievement takes ongoing effort and attempts to improve,
says Trine Hybholt, project manager for HOFOR showroom, at
Energy & Water – Greater Copenhagen Living Lab. Though the
mix of factors influencing successful groundwater use differs
significantly from one country to another, and even one city
to the next, the key lessons for success from Copenhagen are
surprisingly simple, and applicable to cities anywhere.
Water supply in Copenhagen
Copenhagen sits on the eastern coast of the island of Zealand.
Until 2009, water supply included surface water treated with
chlorine, explains Hybholt, but since then the city has been
relying solely on groundwater abstracted from well-fields up to
55 km away from the city centre. Though aquifers also underlie
the central part of the city, these are contaminated with the
customary mix of urban pollutants. In comparison, water from
the outlying aquifers are of excellent quality, is easy to access
and requires minimal treatment.
The wellfields where the city draws its water from consist of
quaternary deposits overlying tertiary layers such as sand,
clay and lignite followed by the limestone from where most
groundwater is extracted (in some cases groundwater is
extracted from the mesozoic layers of limestone). The aquifers
are rain-fed, and water takes more than 30 years to filter through
the layers of topsoil, clay and sand towards the limestone aquifer
lying on average 30 m below, being cleaned in the process.
The water requires little treatment. After extraction, the water is
put through a process of oxidation (i.e. it’s aerated) to remove
gases and fed through a simple sand filtration system to remove
minerals such as iron and manganese. No chlorine or other
chemicals are added, says Hybholt. From the treatment plants
the water is pumped to a central height tank for distribution to
consumers via a gravity-fed system. Electricity is mainly used to
power pumps for water supply to residencies over five storeys,
Resilient Cities
Copenhagen’s famous lakes comprise three rectangular lakes curving around the western margin of the City Centre.
BACK TO TOP
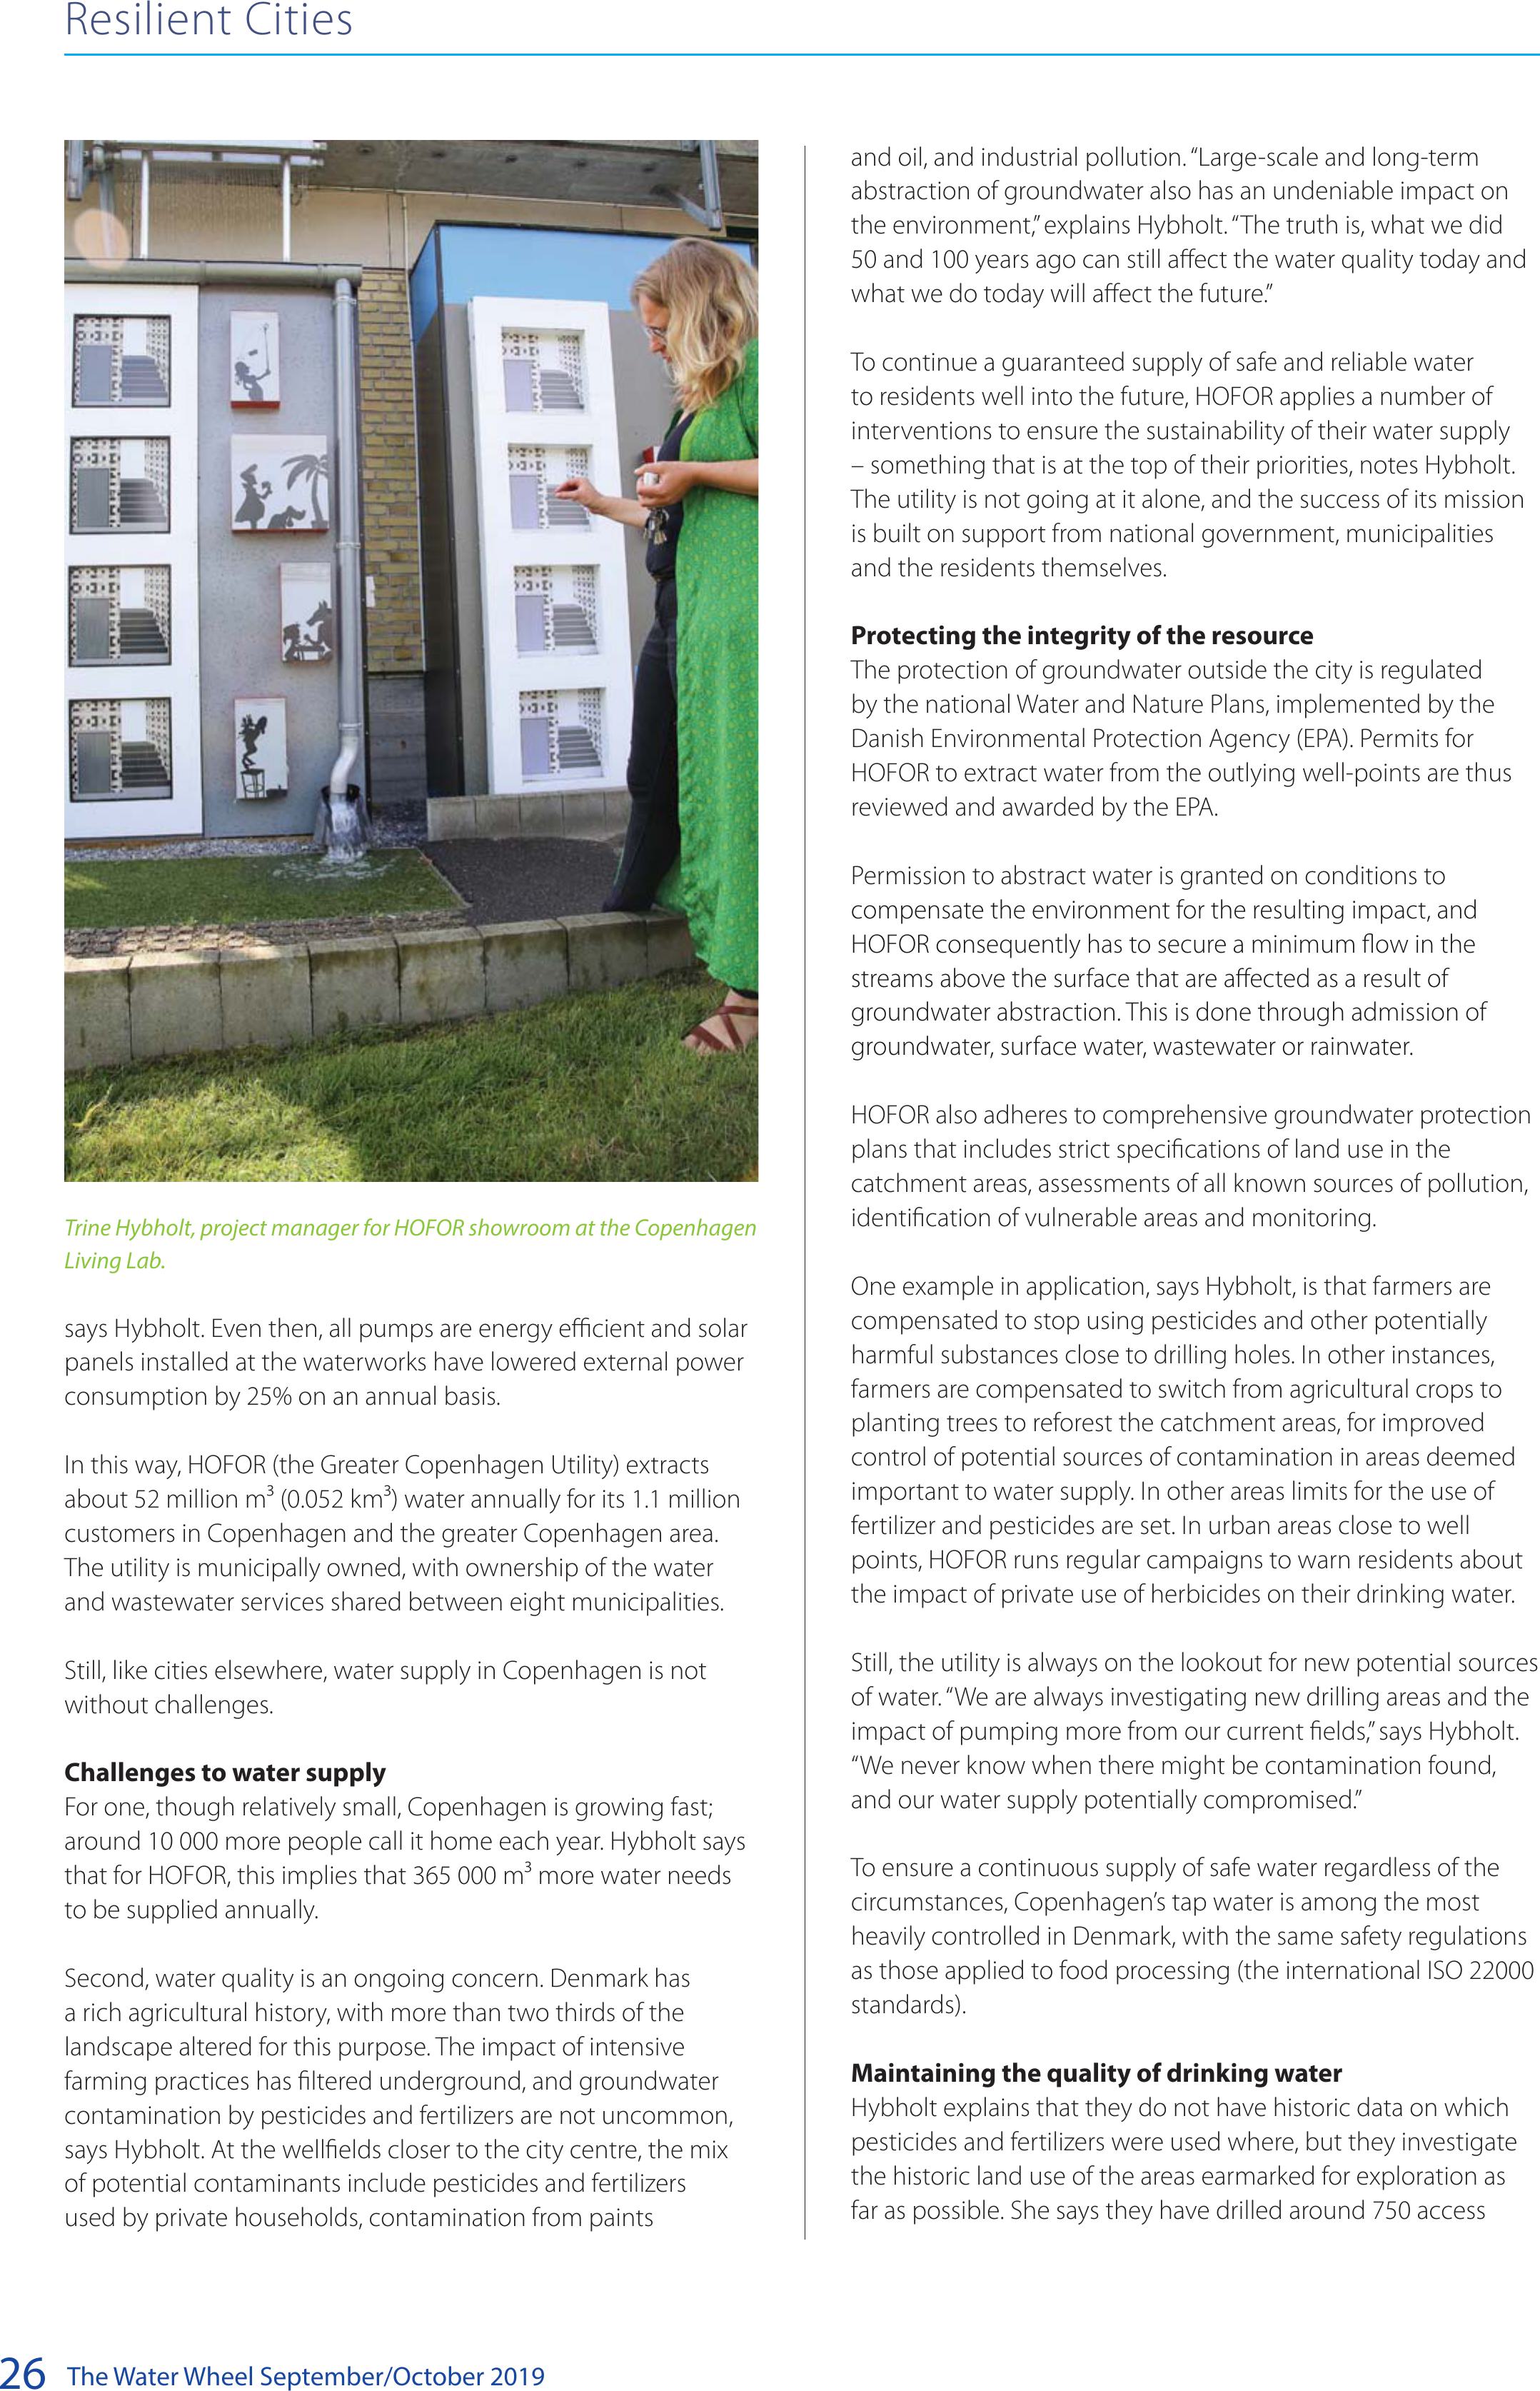
The Water Wheel September/October 2019
26
and oil, and industrial pollution. “Large-scale and long-term
abstraction of groundwater also has an undeniable impact on
the environment,” explains Hybholt. “The truth is, what we did
50 and 100 years ago can still affect the water quality today and
what we do today will affect the future.”
To continue a guaranteed supply of safe and reliable water
to residents well into the future, HOFOR applies a number of
interventions to ensure the sustainability of their water supply
– something that is at the top of their priorities, notes Hybholt.
The utility is not going at it alone, and the success of its mission
is built on support from national government, municipalities
and the residents themselves.
Protecting the integrity of the resource
The protection of groundwater outside the city is regulated
by the national Water and Nature Plans, implemented by the
Danish Environmental Protection Agency (EPA). Permits for
HOFOR to extract water from the outlying well-points are thus
reviewed and awarded by the EPA.
Permission to abstract water is granted on conditions to
compensate the environment for the resulting impact, and
HOFOR consequently has to secure a minimum flow in the
streams above the surface that are affected as a result of
groundwater abstraction. This is done through admission of
groundwater, surface water, wastewater or rainwater.
HOFOR also adheres to comprehensive groundwater protection
plans that includes strict specifications of land use in the
catchment areas, assessments of all known sources of pollution,
identification of vulnerable areas and monitoring.
One example in application, says Hybholt, is that farmers are
compensated to stop using pesticides and other potentially
harmful substances close to drilling holes. In other instances,
farmers are compensated to switch from agricultural crops to
planting trees to reforest the catchment areas, for improved
control of potential sources of contamination in areas deemed
important to water supply. In other areas limits for the use of
fertilizer and pesticides are set. In urban areas close to well
points, HOFOR runs regular campaigns to warn residents about
the impact of private use of herbicides on their drinking water.
Still, the utility is always on the lookout for new potential sources
of water. “We are always investigating new drilling areas and the
impact of pumping more from our current fields,” says Hybholt.
“We never know when there might be contamination found,
and our water supply potentially compromised.”
To ensure a continuous supply of safe water regardless of the
circumstances, Copenhagen’s tap water is among the most
heavily controlled in Denmark, with the same safety regulations
as those applied to food processing (the international ISO 22000
standards).
Maintaining the quality of drinking water
Hybholt explains that they do not have historic data on which
pesticides and fertilizers were used where, but they investigate
the historic land use of the areas earmarked for exploration as
far as possible. She says they have drilled around 750 access
Trine Hybholt, project manager for HOFOR showroom at the Copenhagen
Living Lab.
says Hybholt. Even then, all pumps are energy efficient and solar
panels installed at the waterworks have lowered external power
consumption by 25% on an annual basis.
In this way, HOFOR (the Greater Copenhagen Utility) extracts
about 52 million m³ (0.052 km³) water annually for its 1.1 million
customers in Copenhagen and the greater Copenhagen area.
The utility is municipally owned, with ownership of the water
and wastewater services shared between eight municipalities.
Still, like cities elsewhere, water supply in Copenhagen is not
without challenges.
Challenges to water supply
For one, though relatively small, Copenhagen is growing fast;
around 10 000 more people call it home each year. Hybholt says
that for HOFOR, this implies that 365 000 m³ more water needs
to be supplied annually.
Second, water quality is an ongoing concern. Denmark has
a rich agricultural history, with more than two thirds of the
landscape altered for this purpose. The impact of intensive
farming practices has filtered underground, and groundwater
contamination by pesticides and fertilizers are not uncommon,
says Hybholt. At the wellfields closer to the city centre, the mix
of potential contaminants include pesticides and fertilizers
used by private households, contamination from paints
Resilient Cities
BACK TO TOP

The Water Wheel September/October 201927
points – some of which were shut down when the groundwater
was found to be contaminated. Once part of the water supply
system, HOFOR applies a comprehensive control programme,
which entails testing for bacterial contamination daily at several
points along the water-supply system, from the waterworks,
along the pipe network and at the final distribution point.
Should there be a case of contamination, a control system kicks
in during which the affected residents are notified and water
supplied by trucks in the interim period until the problem is
fixed.
A large part of their work to keep the water resource safe, is also
to use it as efficiently as possible.
Water consumption and loss
Reducing residential demand for water is key to relieve any
pressure on the resource, as the domestic sector is by far
the largest water consumer in Denmark. The average water
consumption in households in Copenhagen peaked in the 1960s
at approximately 235 ℓ per citizen per day, but the figure has
been decreasing steadily since. Then HOFOR set the optimistic
target of reaching 100 ℓ per person per day by 2020 – a target
that was unexpectedly reached ahead of schedule in 2017.
Hybholt says these results were won through sustained efforts
maintained at various levels. Households were motivated to
switch to water efficient appliances such as toilets, washing
machines and showers, and the utility runs ongoing campaigns
and education programmes on various public platforms and at
schools to motivate people to use less water.
Some of the largest cuts in water use were obtained by the
installation of private water meters at households, usually
resulting in a decrease of about 25% of household water use, she
says. Now, under Danish legislation, all properties connected to
common waterworks must have water meters installed, though
old buildings with several flats are only required to install one
water meter at property level new buildings must have one for
each flat.
Hybholt notes that there are more factors at play. Though
nothing in comparison to buying bottled water, water is
perceived to be expensive by consumers in Copenhagen, so
people are more inclined to use it sparingly. This is helped along
by a growing awareness of the importance of sustainable living
by the Danes, reinforced by constant education campaigns,
and large-scale success stories such the rehabilitation of the
Copenhagen harbor, to the extent that it is now a popular
public swimming facility. “The clean harbour has created a lot
of understanding of the concept of sustainable water use,” says
Hybholt.
Still, they are not done. “Now that we’ve reached our target of
100 ℓ per person, we’ve set ourselves a new one, and are aiming
for 90 ℓ of water per person by 2025”, she says.
The city is also setting the trend in curbing water loss in the
distribution system. In comparison to a worldwide average of
36.2% (and an average of 36.8% in South Africa, according to
research published by the Water Research Commission in 2013),
water losses for HOFOR amounts to 7%. This is achieved by
Resilient Cities
The Copenhagen Living Lab includes an exhibition of the city’s sewerage system.
BACK TO TOP
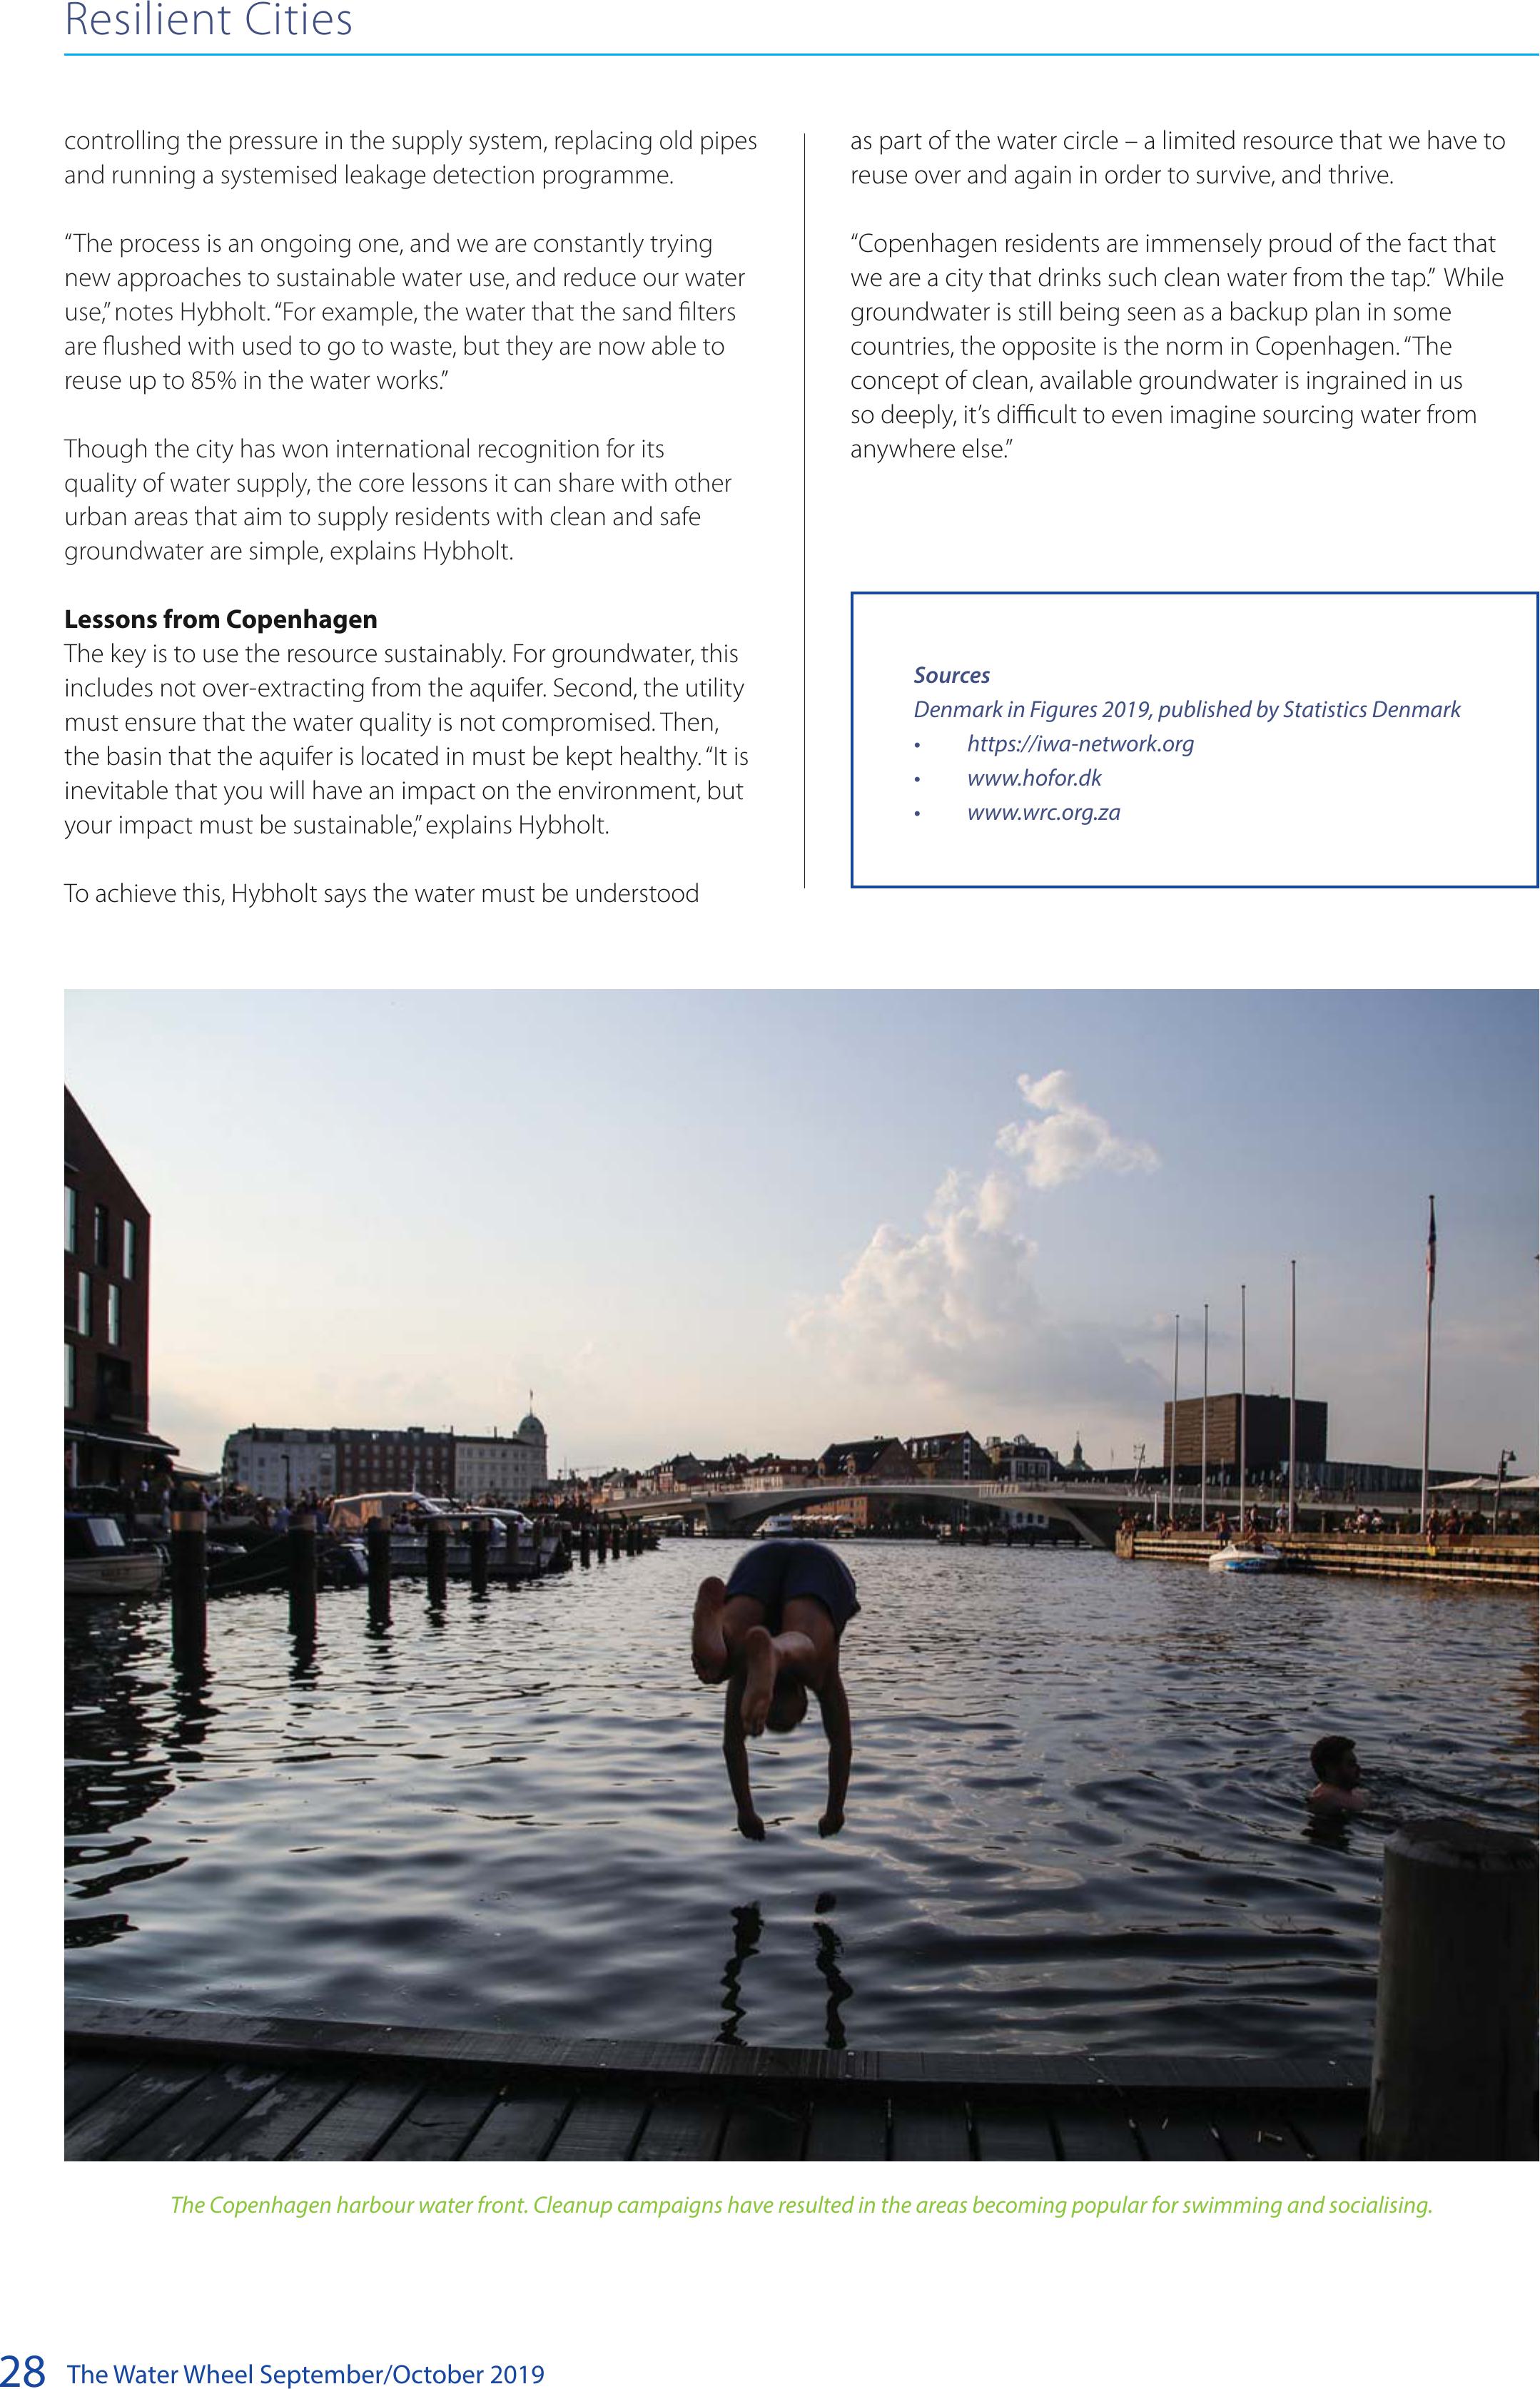
The Water Wheel September/October 2019
28
as part of the water circle – a limited resource that we have to
reuse over and again in order to survive, and thrive.
“Copenhagen residents are immensely proud of the fact that
we are a city that drinks such clean water from the tap.” While
groundwater is still being seen as a backup plan in some
countries, the opposite is the norm in Copenhagen. “The
concept of clean, available groundwater is ingrained in us
so deeply, it’s difficult to even imagine sourcing water from
anywhere else.”
controlling the pressure in the supply system, replacing old pipes
and running a systemised leakage detection programme.
“The process is an ongoing one, and we are constantly trying
new approaches to sustainable water use, and reduce our water
use,” notes Hybholt. “For example, the water that the sand filters
are flushed with used to go to waste, but they are now able to
reuse up to 85% in the water works.”
Though the city has won international recognition for its
quality of water supply, the core lessons it can share with other
urban areas that aim to supply residents with clean and safe
groundwater are simple, explains Hybholt.
Lessons from Copenhagen
The key is to use the resource sustainably. For groundwater, this
includes not over-extracting from the aquifer. Second, the utility
must ensure that the water quality is not compromised. Then,
the basin that the aquifer is located in must be kept healthy. “It is
inevitable that you will have an impact on the environment, but
your impact must be sustainable,” explains Hybholt.
To achieve this, Hybholt says the water must be understood
Resilient Cities
The Copenhagen harbour water front. Cleanup campaigns have resulted in the areas becoming popular for swimming and socialising.
Sources
Denmark in Figures 2019, published by Statistics Denmark
• https://iwa-network.org
• www.hofor.dk
• www.wrc.org.za
BACK TO TOP
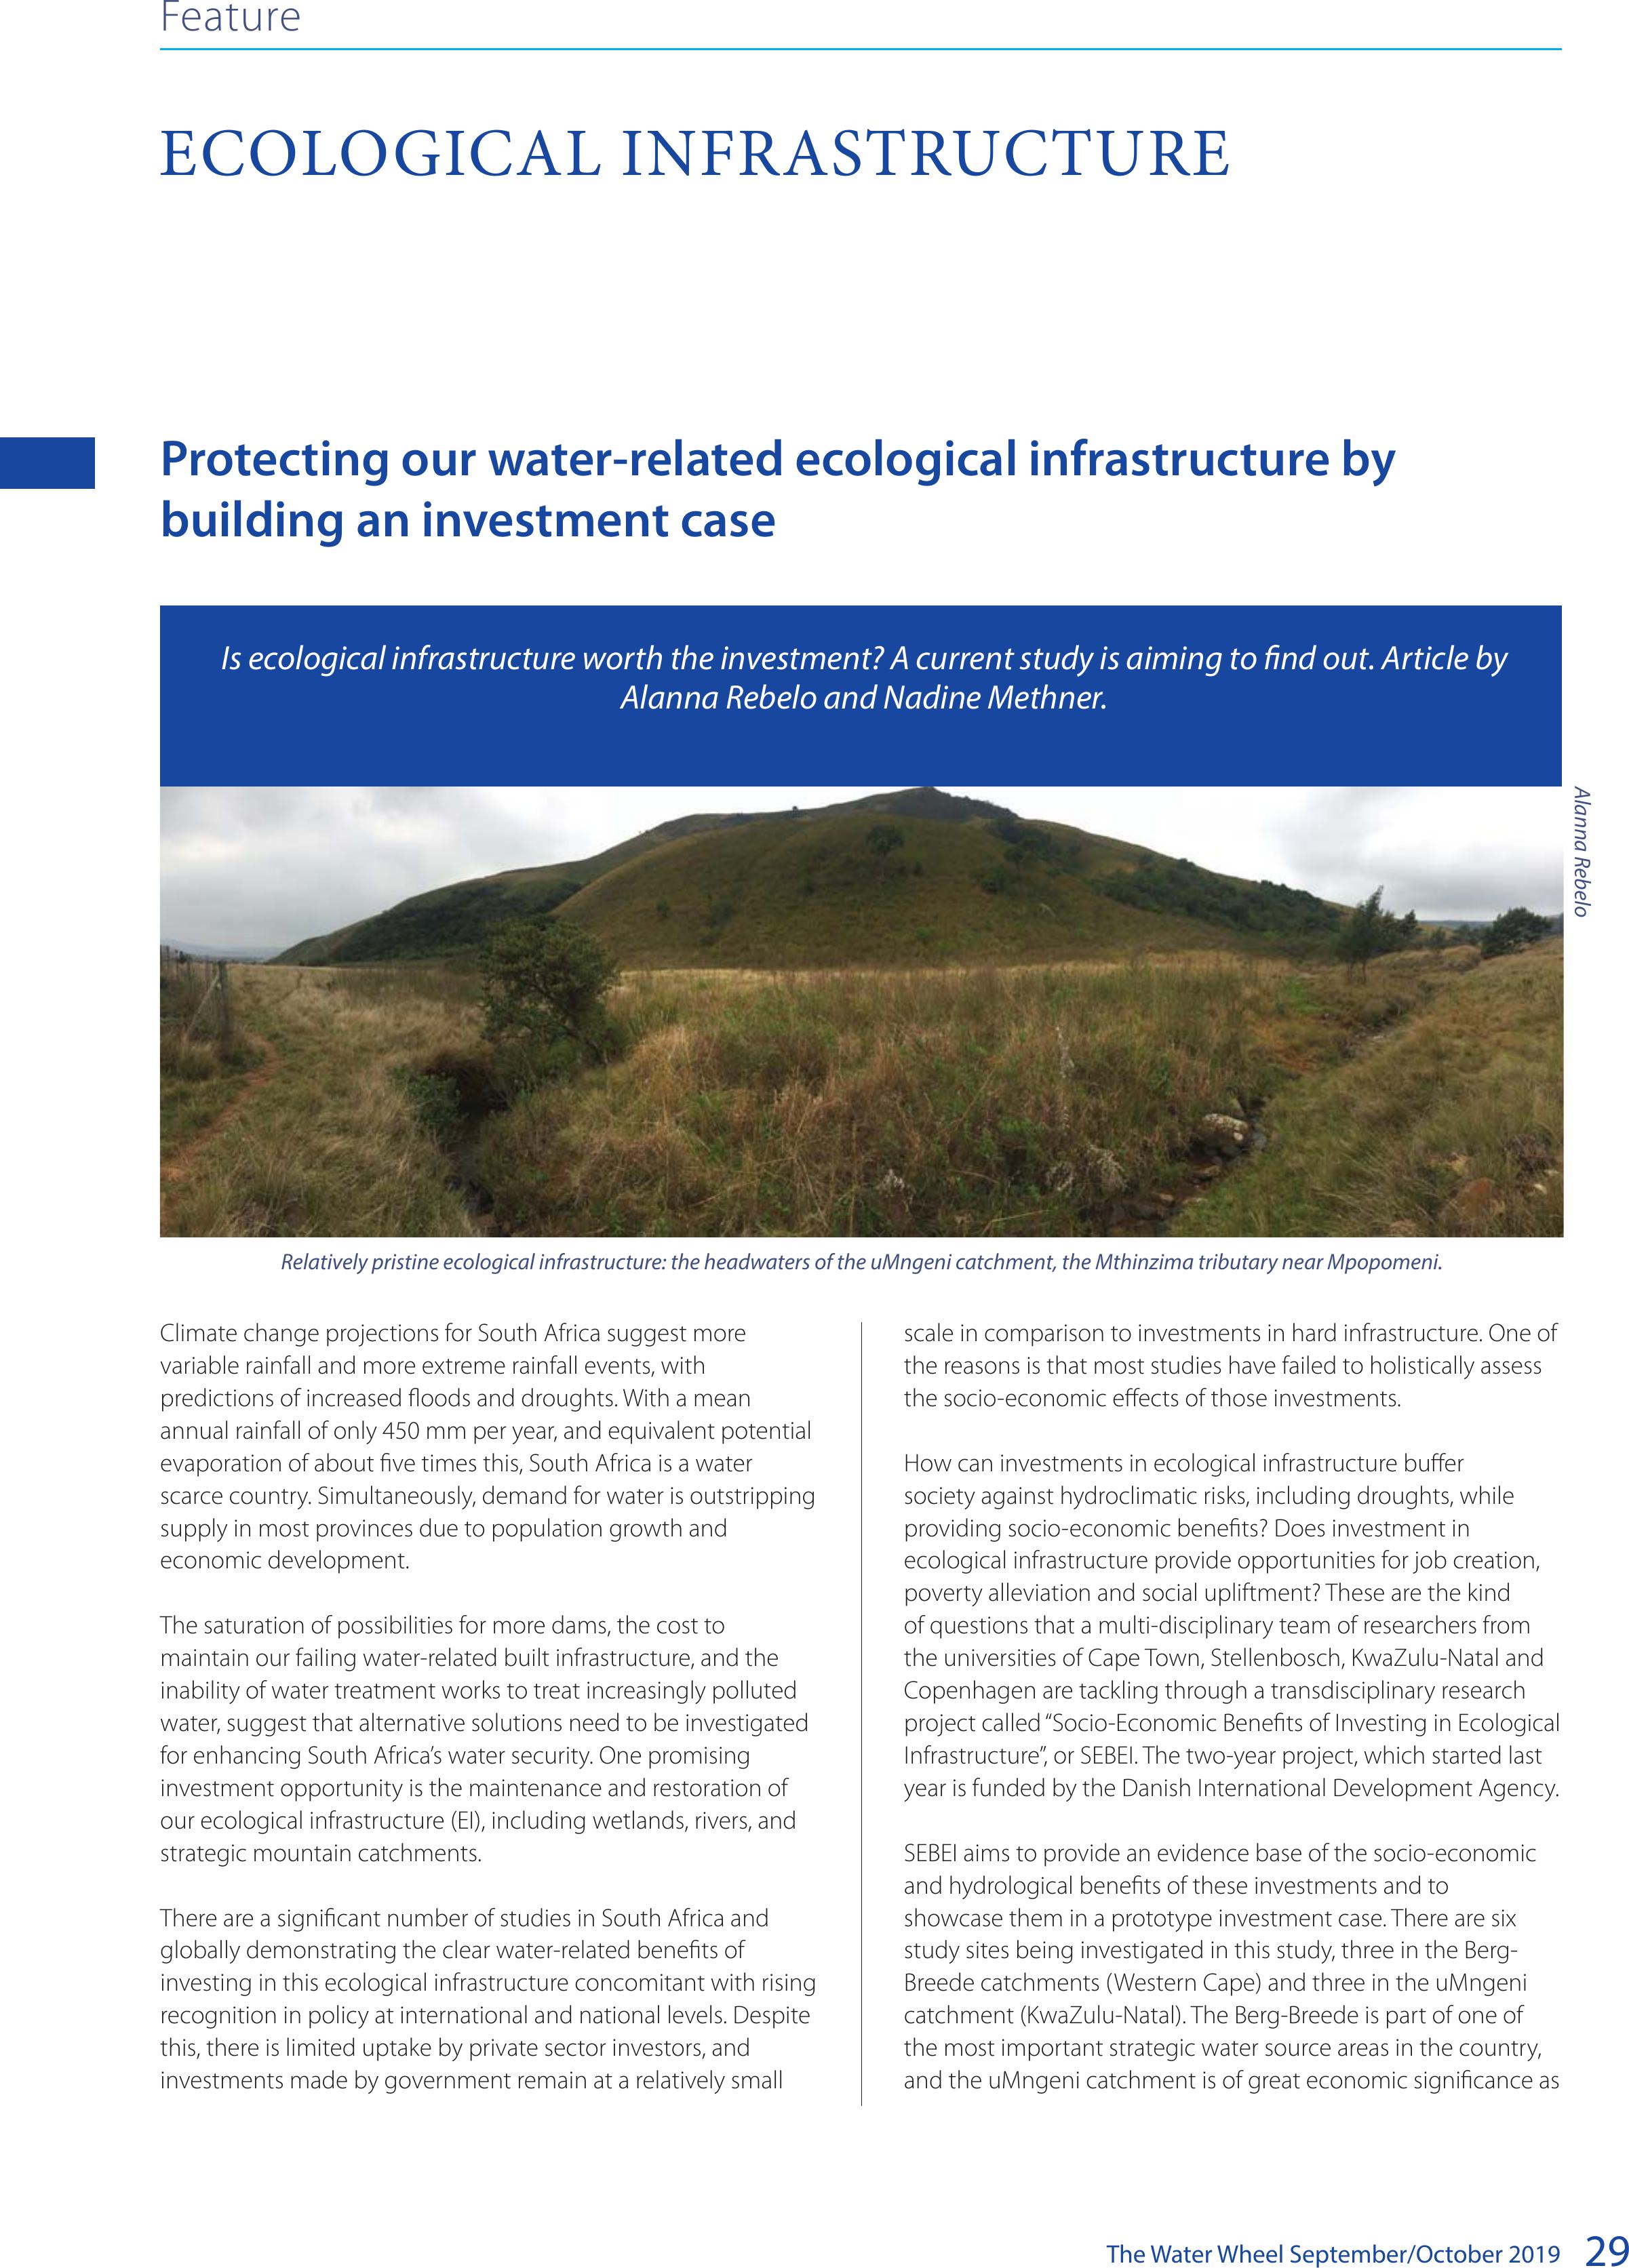
The Water Wheel September/October 201929
Protecting our water-related ecological infrastructure by
building an investment case
Climate change projections for South Africa suggest more
variable rainfall and more extreme rainfall events, with
predictions of increased floods and droughts. With a mean
annual rainfall of only 450 mm per year, and equivalent potential
evaporation of about five times this, South Africa is a water
scarce country. Simultaneously, demand for water is outstripping
supply in most provinces due to population growth and
economic development.
The saturation of possibilities for more dams, the cost to
maintain our failing water-related built infrastructure, and the
inability of water treatment works to treat increasingly polluted
water, suggest that alternative solutions need to be investigated
for enhancing South Africa’s water security. One promising
investment opportunity is the maintenance and restoration of
our ecological infrastructure (EI), including wetlands, rivers, and
strategic mountain catchments.
There are a significant number of studies in South Africa and
globally demonstrating the clear water-related benefits of
investing in this ecological infrastructure concomitant with rising
recognition in policy at international and national levels. Despite
this, there is limited uptake by private sector investors, and
investments made by government remain at a relatively small
scale in comparison to investments in hard infrastructure. One of
the reasons is that most studies have failed to holistically assess
the socio-economic effects of those investments.
How can investments in ecological infrastructure buffer
society against hydroclimatic risks, including droughts, while
providing socio-economic benefits? Does investment in
ecological infrastructure provide opportunities for job creation,
poverty alleviation and social upliftment? These are the kind
of questions that a multi-disciplinary team of researchers from
the universities of Cape Town, Stellenbosch, KwaZulu-Natal and
Copenhagen are tackling through a transdisciplinary research
project called “Socio-Economic Benefits of Investing in Ecological
Infrastructure”, or SEBEI. The two-year project, which started last
year is funded by the Danish International Development Agency.
SEBEI aims to provide an evidence base of the socio-economic
and hydrological benefits of these investments and to
showcase them in a prototype investment case. There are six
study sites being investigated in this study, three in the Berg-
Breede catchments (Western Cape) and three in the uMngeni
catchment (KwaZulu-Natal). The Berg-Breede is part of one of
the most important strategic water source areas in the country,
and the uMngeni catchment is of great economic significance as
Is ecological infrastructure worth the investment? A current study is aiming to nd out. Article by
Alanna Rebelo and Nadine Methner.
ECOLOGICAL INFRASTRUCTURE
Feature
Relatively pristine ecological infrastructure: the headwaters of the uMngeni catchment, the Mthinzima tributary near Mpopomeni.
Alanna Rebelo
BACK TO TOP
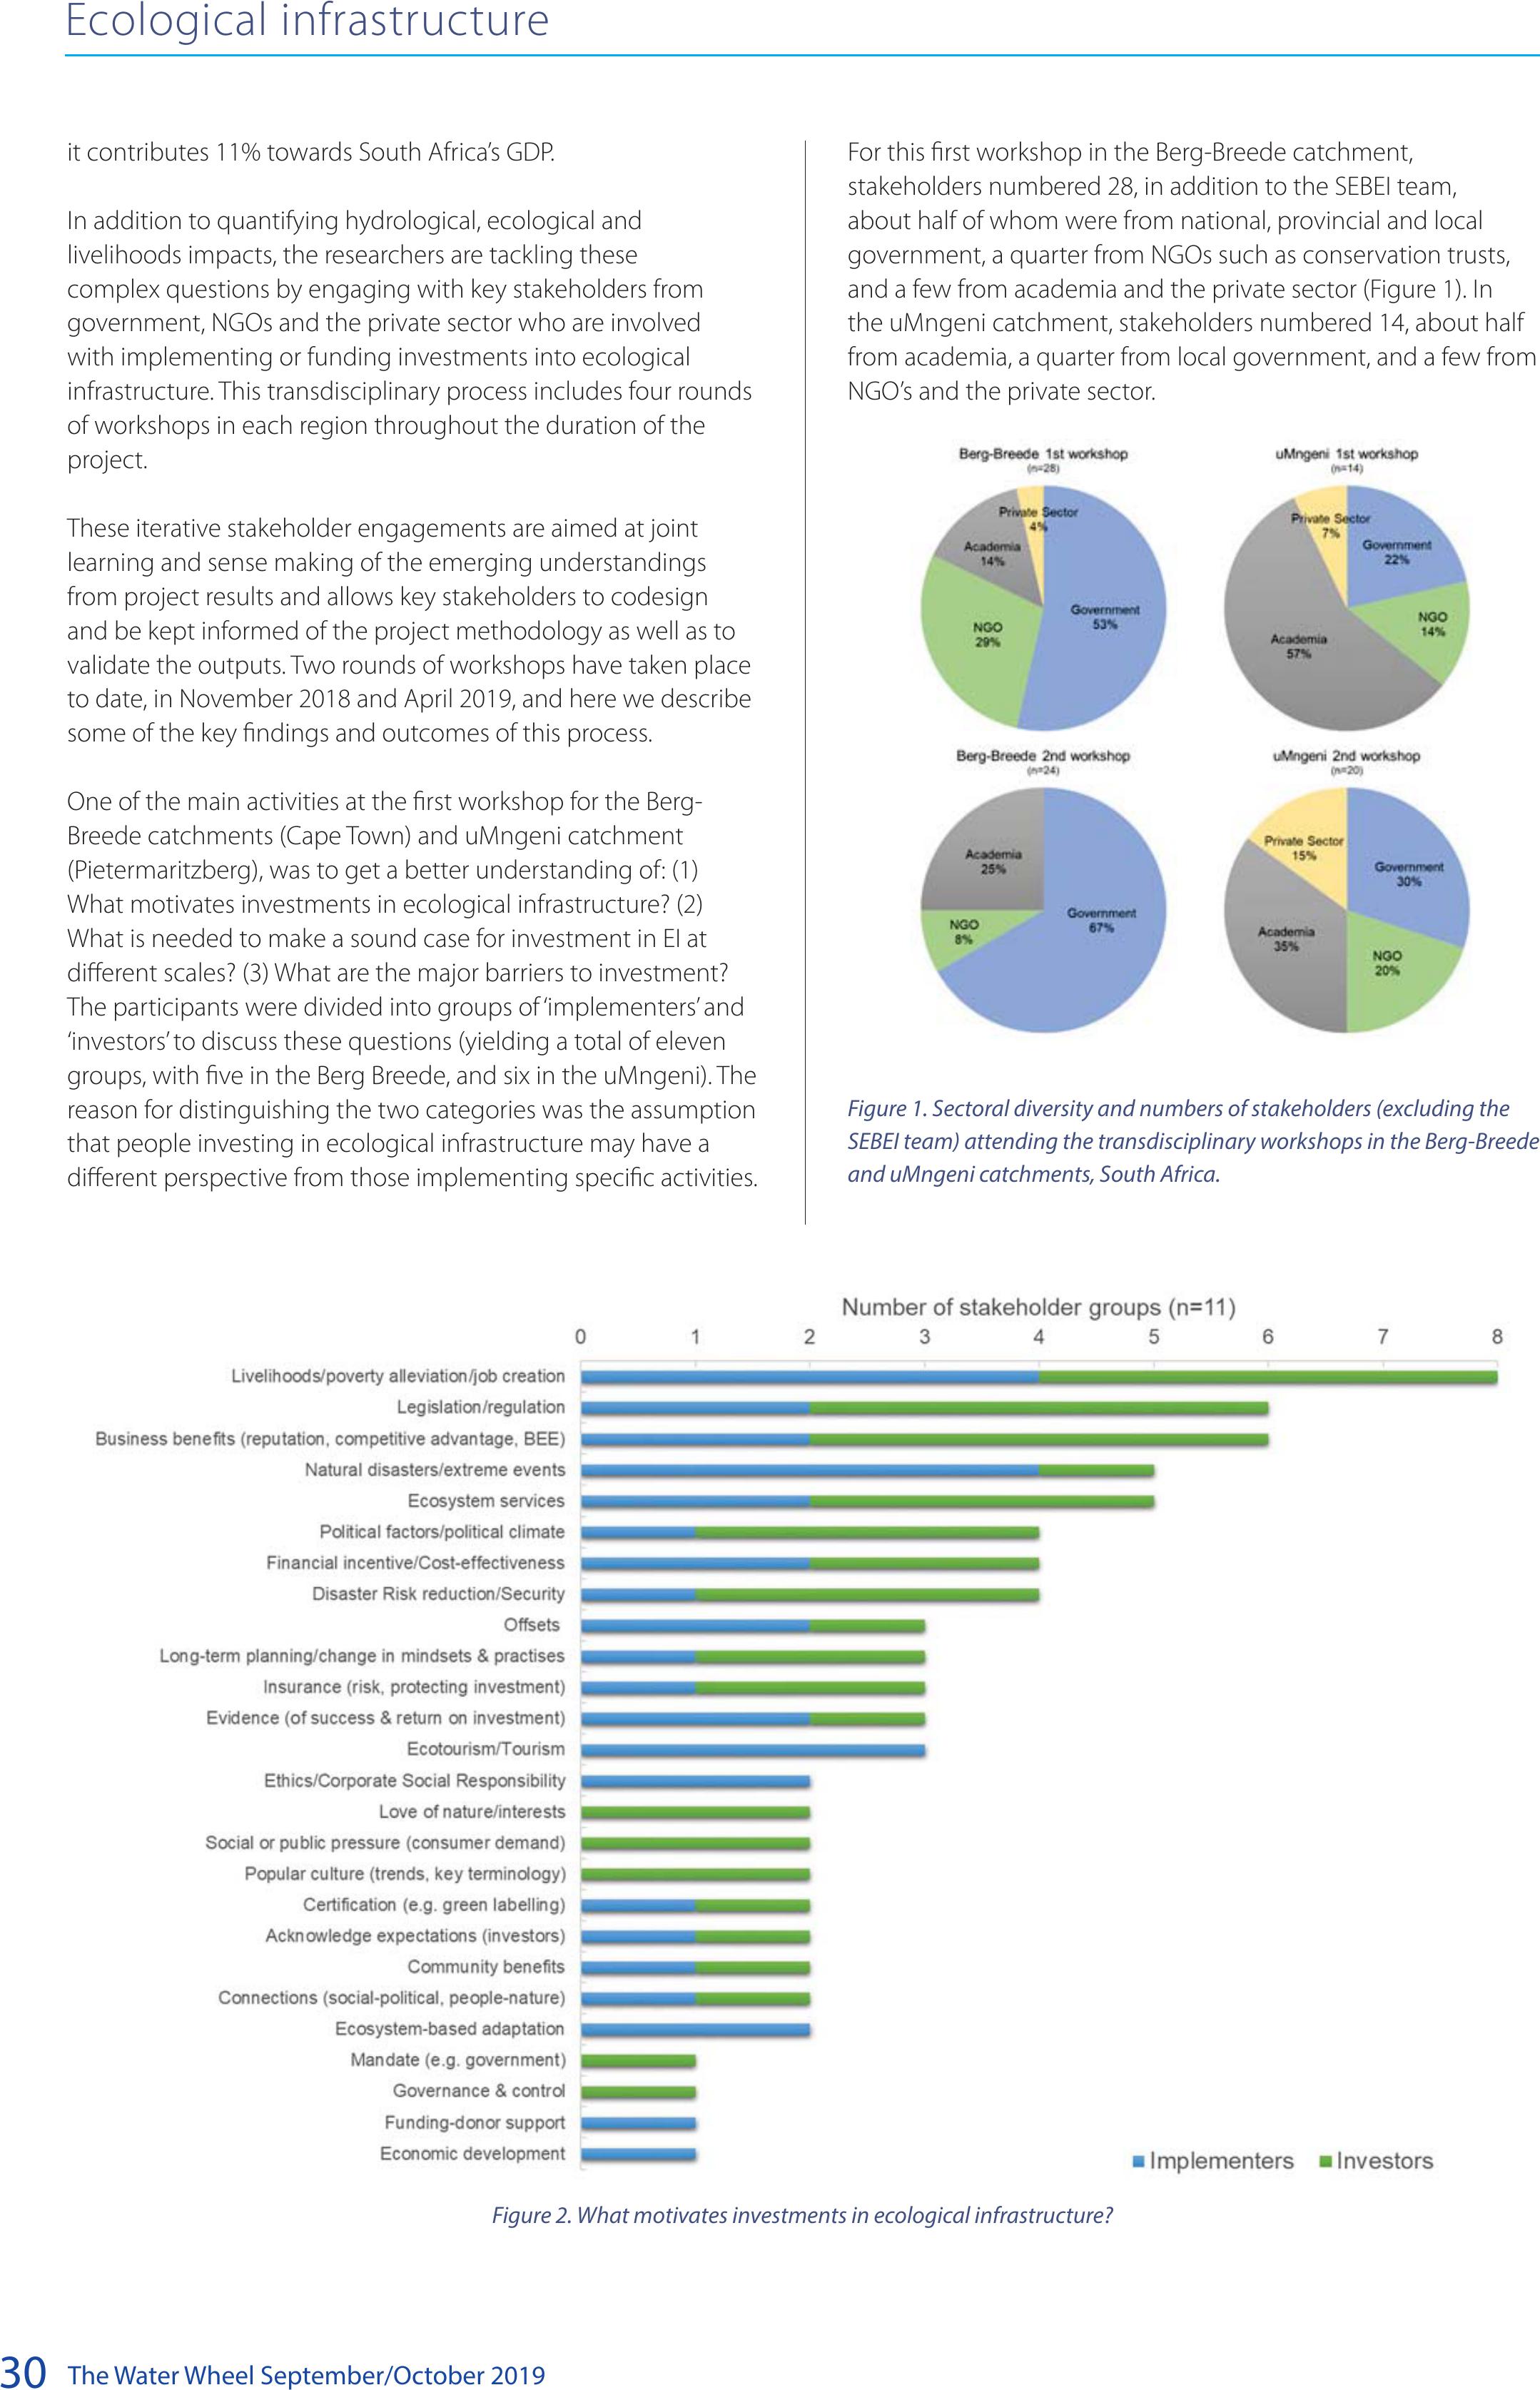
The Water Wheel September/October 2019
30
For this first workshop in the Berg-Breede catchment,
stakeholders numbered 28, in addition to the SEBEI team,
about half of whom were from national, provincial and local
government, a quarter from NGOs such as conservation trusts,
and a few from academia and the private sector (Figure 1). In
the uMngeni catchment, stakeholders numbered 14, about half
from academia, a quarter from local government, and a few from
NGO’s and the private sector.
Figure 1. Sectoral diversity and numbers of stakeholders (excluding the
SEBEI team) attending the transdisciplinary workshops in the Berg-Breede
and uMngeni catchments, South Africa.
it contributes 11% towards South Africa’s GDP.
In addition to quantifying hydrological, ecological and
livelihoods impacts, the researchers are tackling these
complex questions by engaging with key stakeholders from
government, NGOs and the private sector who are involved
with implementing or funding investments into ecological
infrastructure. This transdisciplinary process includes four rounds
of workshops in each region throughout the duration of the
project.
These iterative stakeholder engagements are aimed at joint
learning and sense making of the emerging understandings
from project results and allows key stakeholders to codesign
and be kept informed of the project methodology as well as to
validate the outputs. Two rounds of workshops have taken place
to date, in November 2018 and April 2019, and here we describe
some of the key findings and outcomes of this process.
One of the main activities at the first workshop for the Berg-
Breede catchments (Cape Town) and uMngeni catchment
(Pietermaritzberg), was to get a better understanding of: (1)
What motivates investments in ecological infrastructure? (2)
What is needed to make a sound case for investment in EI at
different scales? (3) What are the major barriers to investment?
The participants were divided into groups of ‘implementers’ and
‘investors’ to discuss these questions (yielding a total of eleven
groups, with five in the Berg Breede, and six in the uMngeni). The
reason for distinguishing the two categories was the assumption
that people investing in ecological infrastructure may have a
different perspective from those implementing specific activities.
Ecological infrastructure
Figure 2. What motivates investments in ecological infrastructure?
BACK TO TOP
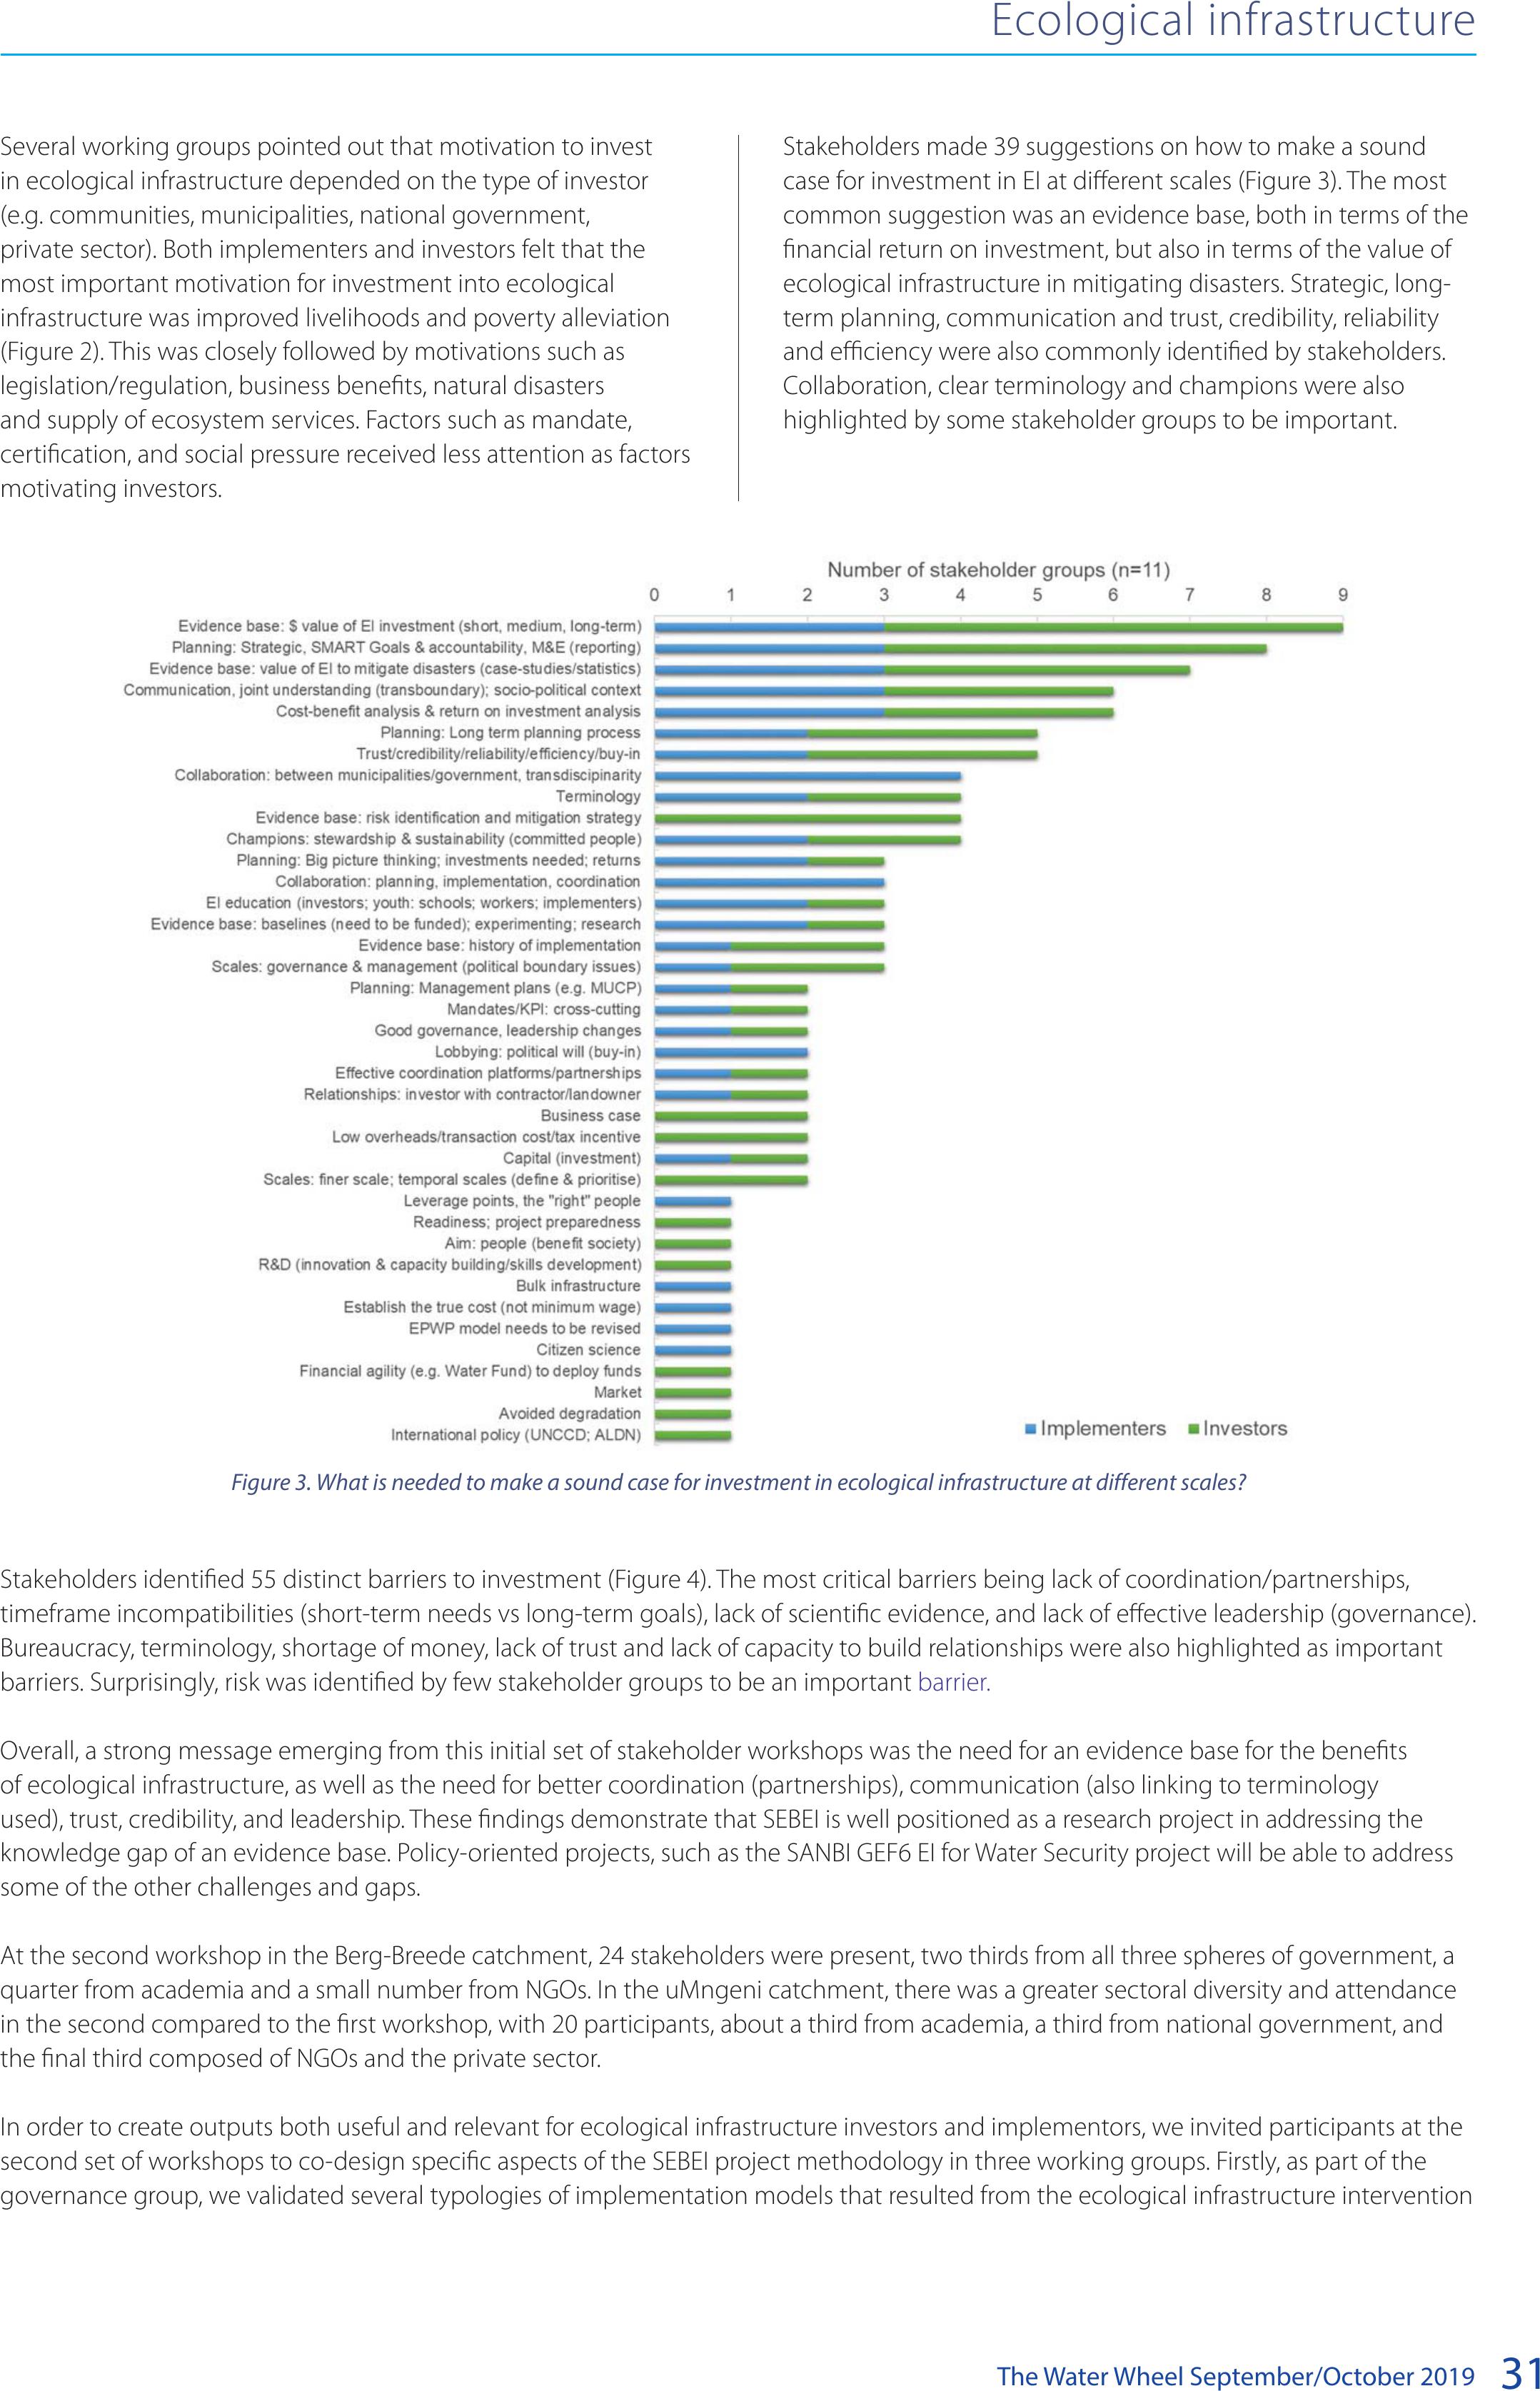
The Water Wheel September/October 201931
Several working groups pointed out that motivation to invest
in ecological infrastructure depended on the type of investor
(e.g. communities, municipalities, national government,
private sector). Both implementers and investors felt that the
most important motivation for investment into ecological
infrastructure was improved livelihoods and poverty alleviation
(Figure 2). This was closely followed by motivations such as
legislation/regulation, business benefits, natural disasters
and supply of ecosystem services. Factors such as mandate,
certification, and social pressure received less attention as factors
motivating investors.
Stakeholders made 39 suggestions on how to make a sound
case for investment in EI at different scales (Figure 3). The most
common suggestion was an evidence base, both in terms of the
financial return on investment, but also in terms of the value of
ecological infrastructure in mitigating disasters. Strategic, long-
term planning, communication and trust, credibility, reliability
and efficiency were also commonly identified by stakeholders.
Collaboration, clear terminology and champions were also
highlighted by some stakeholder groups to be important.
Ecological infrastructure
Figure 3. What is needed to make a sound case for investment in ecological infrastructure at different scales?
Stakeholders identified 55 distinct barriers to investment (Figure 4). The most critical barriers being lack of coordination/partnerships,
timeframe incompatibilities (short-term needs vs long-term goals), lack of scientific evidence, and lack of effective leadership (governance).
Bureaucracy, terminology, shortage of money, lack of trust and lack of capacity to build relationships were also highlighted as important
barriers. Surprisingly, risk was identified by few stakeholder groups to be an important barrier.
Overall, a strong message emerging from this initial set of stakeholder workshops was the need for an evidence base for the benefits
of ecological infrastructure, as well as the need for better coordination (partnerships), communication (also linking to terminology
used), trust, credibility, and leadership. These findings demonstrate that SEBEI is well positioned as a research project in addressing the
knowledge gap of an evidence base. Policy-oriented projects, such as the SANBI GEF6 EI for Water Security project will be able to address
some of the other challenges and gaps.
At the second workshop in the Berg-Breede catchment, 24 stakeholders were present, two thirds from all three spheres of government, a
quarter from academia and a small number from NGOs. In the uMngeni catchment, there was a greater sectoral diversity and attendance
in the second compared to the first workshop, with 20 participants, about a third from academia, a third from national government, and
the final third composed of NGOs and the private sector.
In order to create outputs both useful and relevant for ecological infrastructure investors and implementors, we invited participants at the
second set of workshops to co-design specific aspects of the SEBEI project methodology in three working groups. Firstly, as part of the
governance group, we validated several typologies of implementation models that resulted from the ecological infrastructure intervention
BACK TO TOP
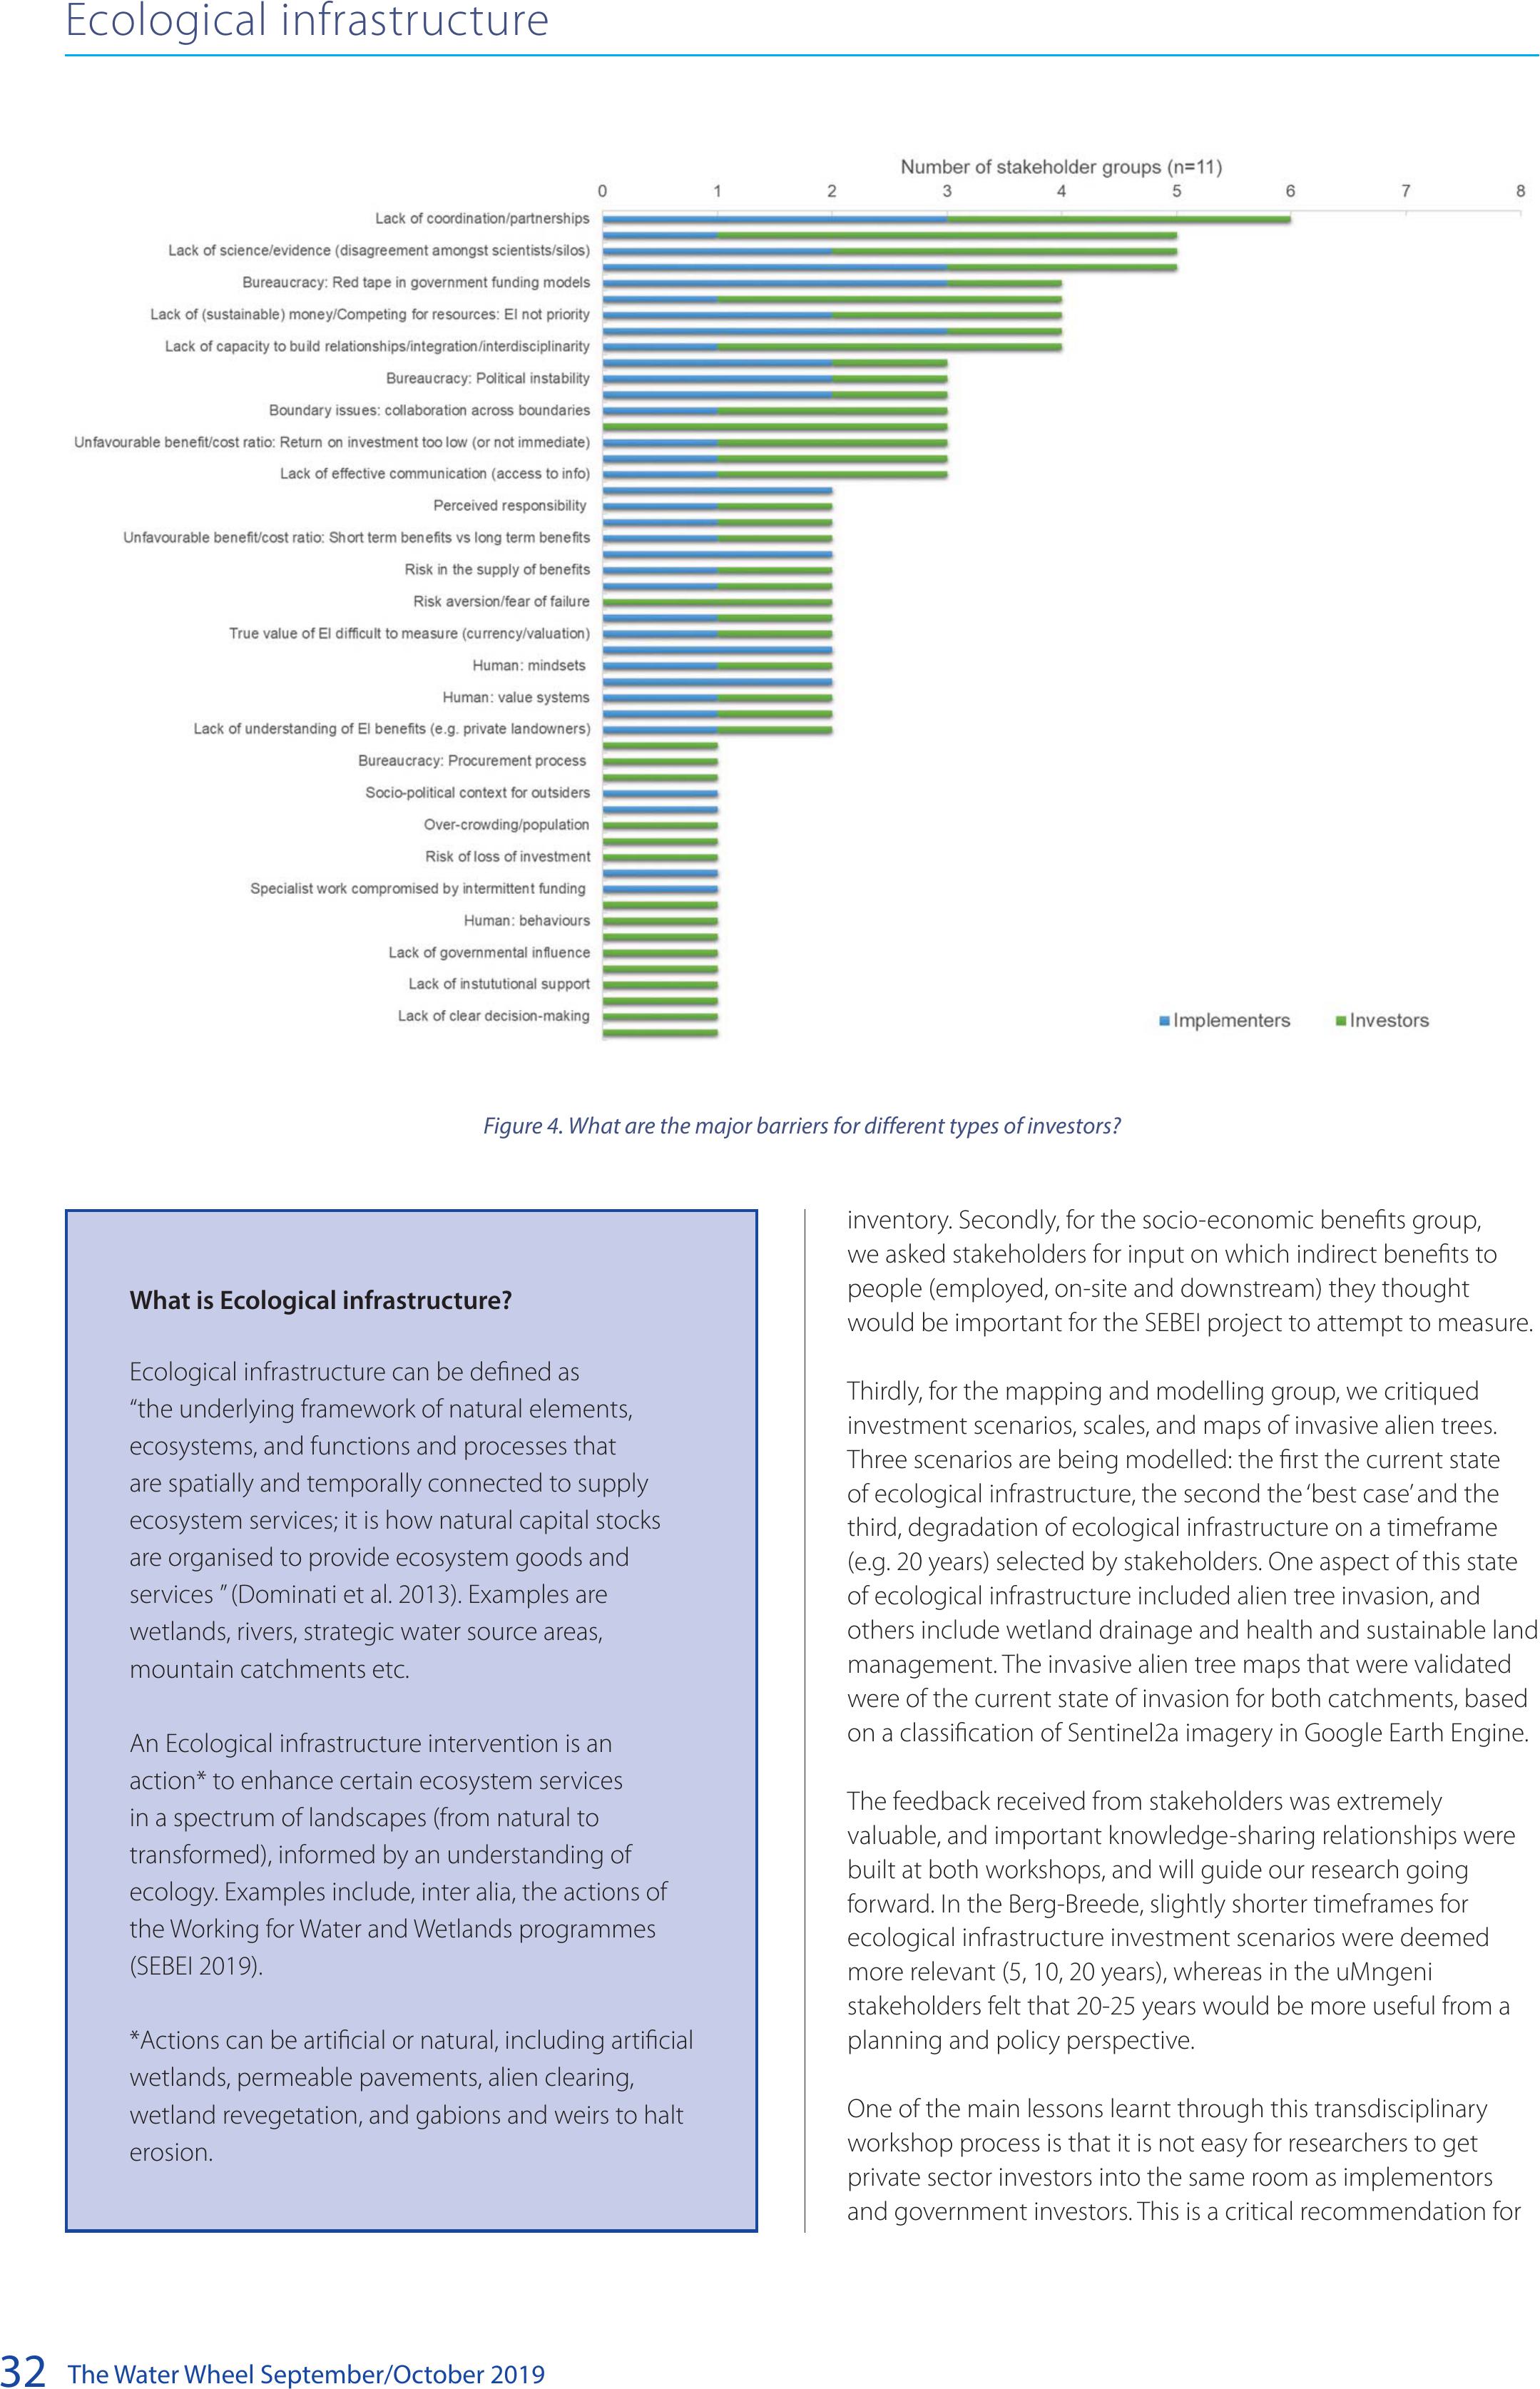
The Water Wheel September/October 2019
32
inventory. Secondly, for the socio-economic benefits group,
we asked stakeholders for input on which indirect benefits to
people (employed, on-site and downstream) they thought
would be important for the SEBEI project to attempt to measure.
Thirdly, for the mapping and modelling group, we critiqued
investment scenarios, scales, and maps of invasive alien trees.
Three scenarios are being modelled: the first the current state
of ecological infrastructure, the second the ‘best case’ and the
third, degradation of ecological infrastructure on a timeframe
(e.g. 20 years) selected by stakeholders. One aspect of this state
of ecological infrastructure included alien tree invasion, and
others include wetland drainage and health and sustainable land
management. The invasive alien tree maps that were validated
were of the current state of invasion for both catchments, based
on a classification of Sentinel2a imagery in Google Earth Engine.
The feedback received from stakeholders was extremely
valuable, and important knowledge-sharing relationships were
built at both workshops, and will guide our research going
forward. In the Berg-Breede, slightly shorter timeframes for
ecological infrastructure investment scenarios were deemed
more relevant (5, 10, 20 years), whereas in the uMngeni
stakeholders felt that 20-25 years would be more useful from a
planning and policy perspective.
One of the main lessons learnt through this transdisciplinary
workshop process is that it is not easy for researchers to get
private sector investors into the same room as implementors
and government investors. This is a critical recommendation for
Ecological infrastructure
Figure 4. What are the major barriers for different types of investors?
What is Ecological infrastructure?
Ecological infrastructure can be defined as
“the underlying framework of natural elements,
ecosystems, and functions and processes that
are spatially and temporally connected to supply
ecosystem services; it is how natural capital stocks
are organised to provide ecosystem goods and
services ” (Dominati et al. 2013). Examples are
wetlands, rivers, strategic water source areas,
mountain catchments etc.
An Ecological infrastructure intervention is an
action* to enhance certain ecosystem services
in a spectrum of landscapes (from natural to
transformed), informed by an understanding of
ecology. Examples include, inter alia, the actions of
the Working for Water and Wetlands programmes
(SEBEI 2019).
*Actions can be artificial or natural, including artificial
wetlands, permeable pavements, alien clearing,
wetland revegetation, and gabions and weirs to halt
erosion.
BACK TO TOP
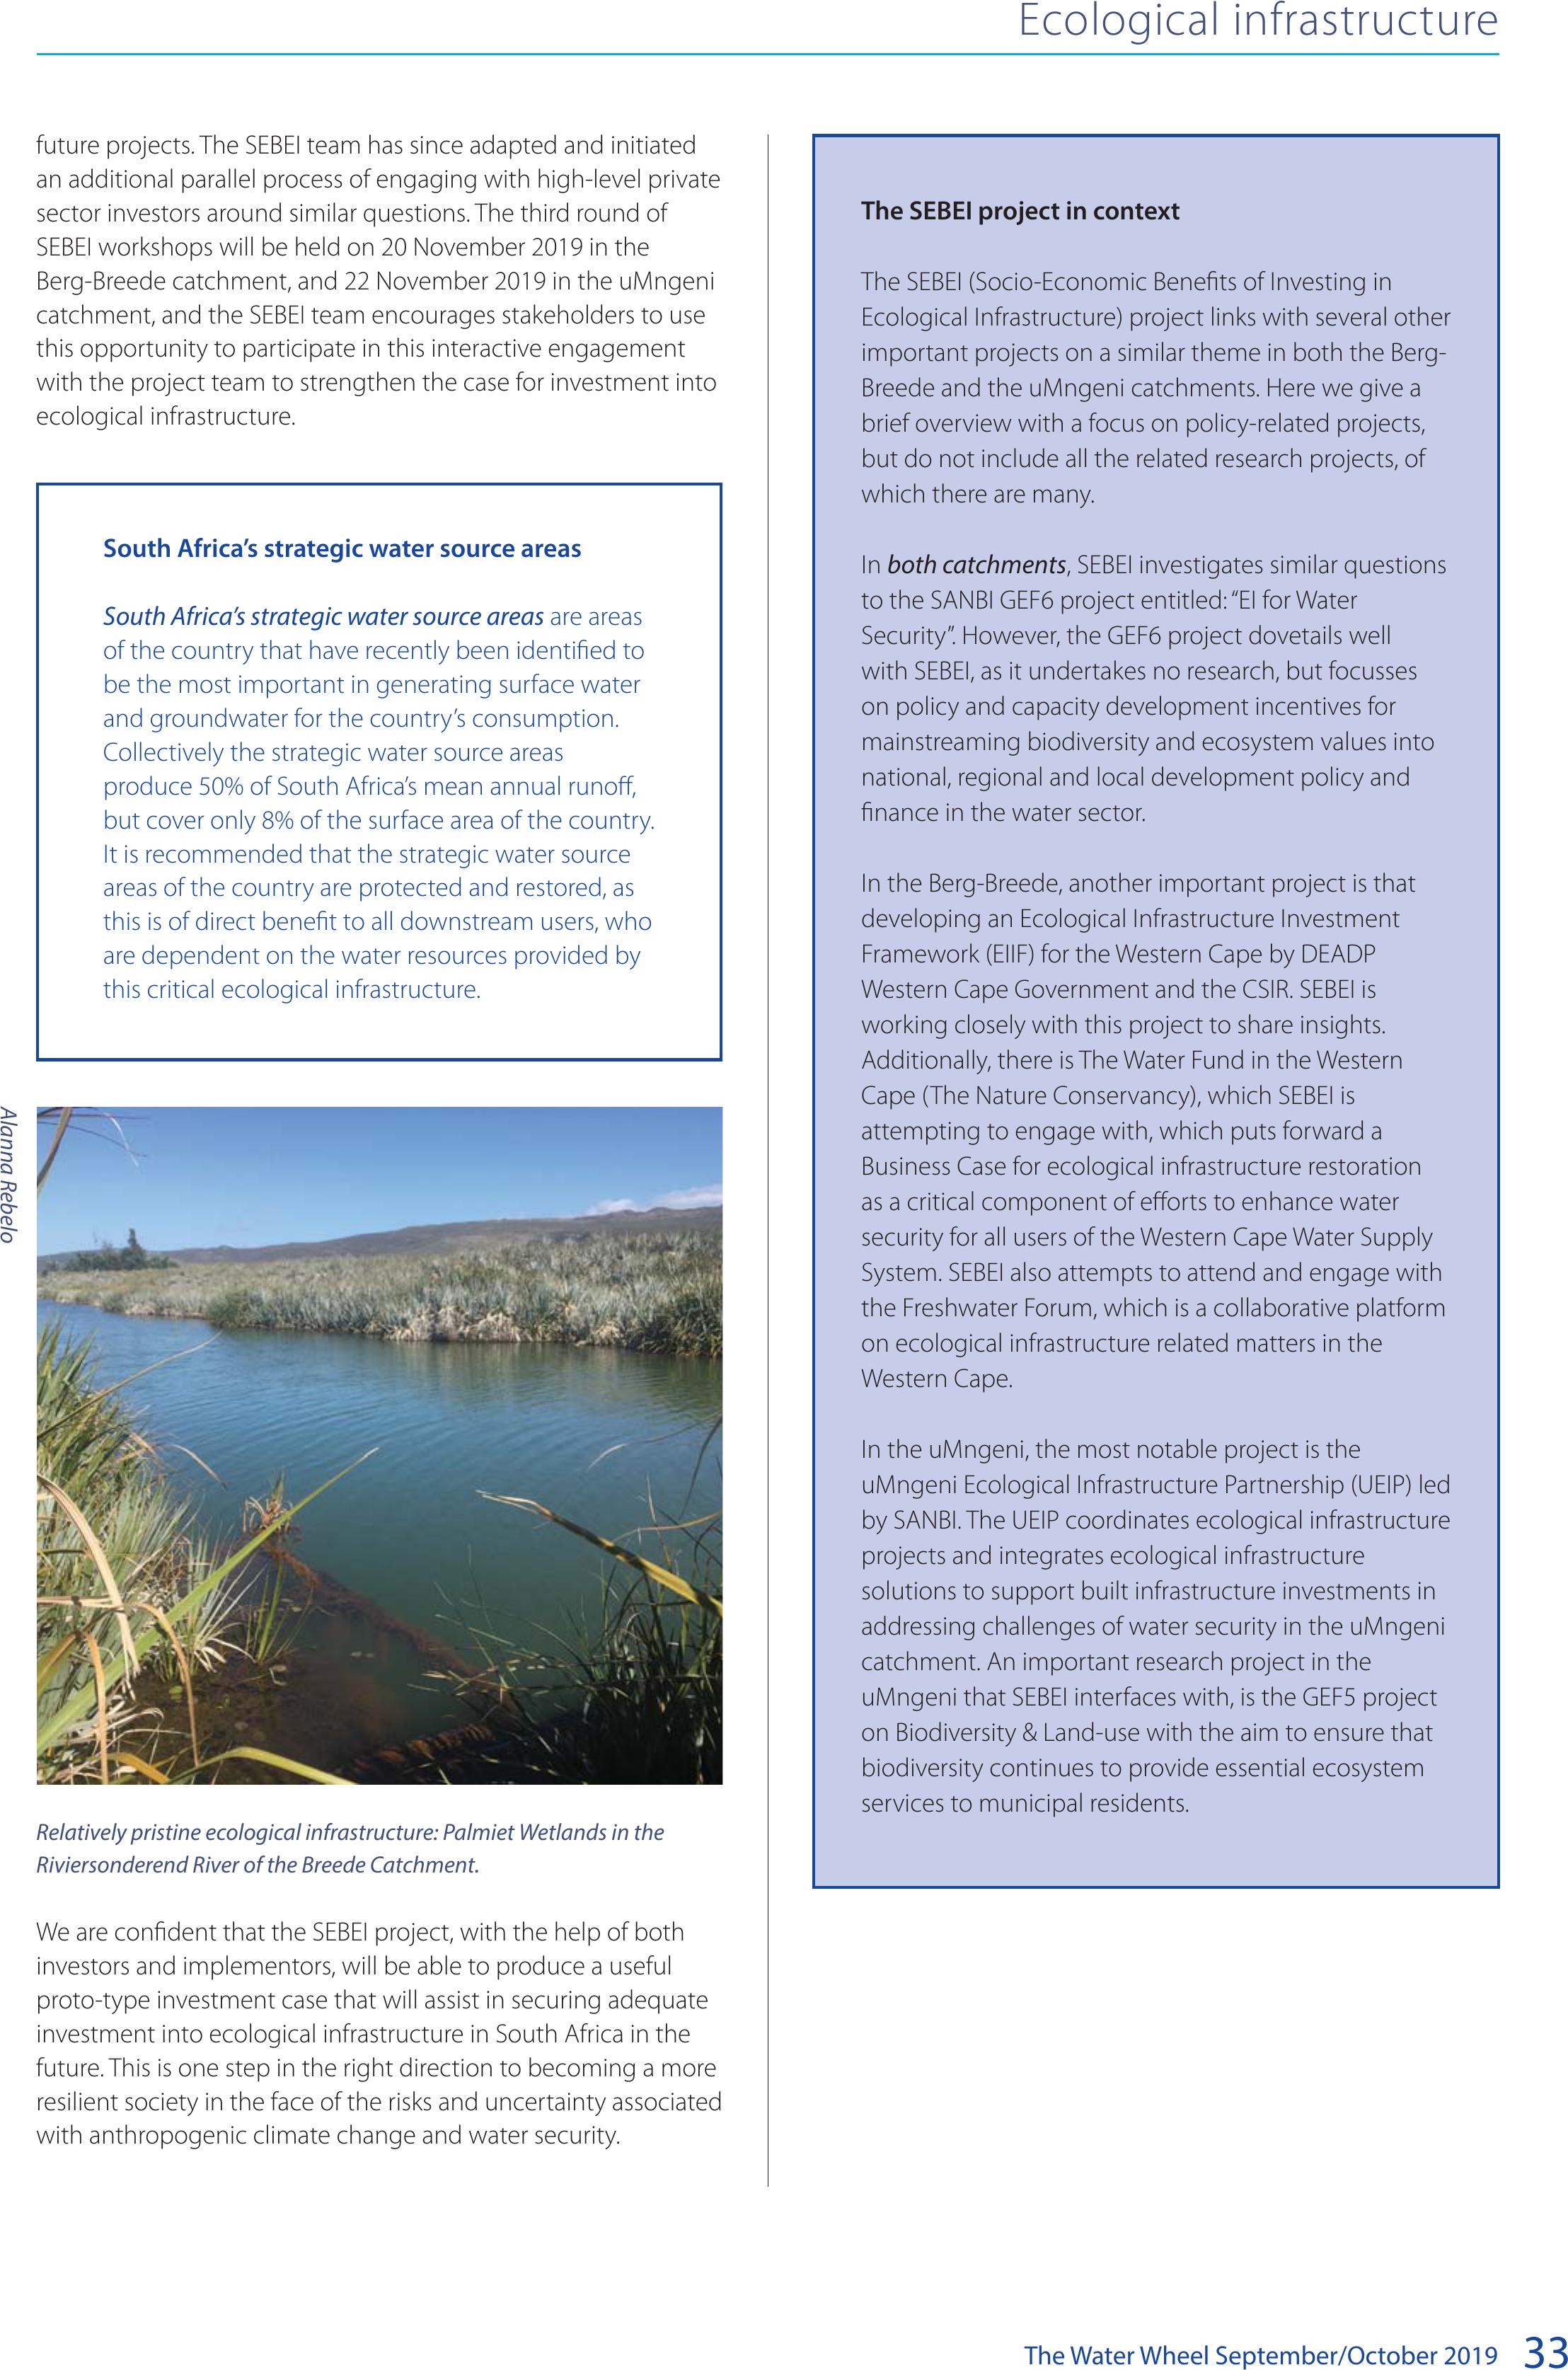
The Water Wheel September/October 201933
future projects. The SEBEI team has since adapted and initiated
an additional parallel process of engaging with high-level private
sector investors around similar questions. The third round of
SEBEI workshops will be held on 20 November 2019 in the
Berg-Breede catchment, and 22 November 2019 in the uMngeni
catchment, and the SEBEI team encourages stakeholders to use
this opportunity to participate in this interactive engagement
with the project team to strengthen the case for investment into
ecological infrastructure.
Relatively pristine ecological infrastructure: Palmiet Wetlands in the
Riviersonderend River of the Breede Catchment.
We are confident that the SEBEI project, with the help of both
investors and implementors, will be able to produce a useful
proto-type investment case that will assist in securing adequate
investment into ecological infrastructure in South Africa in the
future. This is one step in the right direction to becoming a more
resilient society in the face of the risks and uncertainty associated
with anthropogenic climate change and water security.
Ecological infrastructure
South Africa’s strategic water source areas
South Africa’s strategic water source areas are areas
of the country that have recently been identified to
be the most important in generating surface water
and groundwater for the country’s consumption.
Collectively the strategic water source areas
produce 50% of South Africa’s mean annual runoff,
but cover only 8% of the surface area of the country.
It is recommended that the strategic water source
areas of the country are protected and restored, as
this is of direct benefit to all downstream users, who
are dependent on the water resources provided by
this critical ecological infrastructure.
The SEBEI project in context
The SEBEI (Socio-Economic Benefits of Investing in
Ecological Infrastructure) project links with several other
important projects on a similar theme in both the Berg-
Breede and the uMngeni catchments. Here we give a
brief overview with a focus on policy-related projects,
but do not include all the related research projects, of
which there are many.
In both catchments, SEBEI investigates similar questions
to the SANBI GEF6 project entitled: “EI for Water
Security”. However, the GEF6 project dovetails well
with SEBEI, as it undertakes no research, but focusses
on policy and capacity development incentives for
mainstreaming biodiversity and ecosystem values into
national, regional and local development policy and
finance in the water sector.
In the Berg-Breede, another important project is that
developing an Ecological Infrastructure Investment
Framework (EIIF) for the Western Cape by DEADP
Western Cape Government and the CSIR. SEBEI is
working closely with this project to share insights.
Additionally, there is The Water Fund in the Western
Cape (The Nature Conservancy), which SEBEI is
attempting to engage with, which puts forward a
Business Case for ecological infrastructure restoration
as a critical component of efforts to enhance water
security for all users of the Western Cape Water Supply
System. SEBEI also attempts to attend and engage with
the Freshwater Forum, which is a collaborative platform
on ecological infrastructure related matters in the
Western Cape.
In the uMngeni, the most notable project is the
uMngeni Ecological Infrastructure Partnership (UEIP) led
by SANBI. The UEIP coordinates ecological infrastructure
projects and integrates ecological infrastructure
solutions to support built infrastructure investments in
addressing challenges of water security in the uMngeni
catchment. An important research project in the
uMngeni that SEBEI interfaces with, is the GEF5 project
on Biodiversity & Land-use with the aim to ensure that
biodiversity continues to provide essential ecosystem
services to municipal residents.
Alanna Rebelo
BACK TO TOP

The Water Wheel September/October 2019
34
Feature
WATER AND SOCIETY
Water scarcity is widespread globally, and is increasingly a major
concern in Southern Africa. The Western Cape is no exception;
its recent multi-year drought has sparked considerable reaction
and adaptation. The impact of water scarcity is influenced by
location, including both region and nature of settlement.
To develop our understanding of this at the scale of small
municipalities, and in collaboration with the South African
Local Government Association (SALGA), we conducted a socio-
hydrological assessment of water management in Prince Albert
and Swartland municipalities over the winter (May to July) of
2018. In addition to understanding how municipalities have
adapted to water crises, the study was also an exploration of
interdisciplinary research processes and methodologies in order
to understand different perspectives of a given context, and to
identify lessons for other interdisciplinary studies.
Following desktop reviews, two-day visits to each municipality
were carried out by a research team from the Future Water
research institute at the University of Cape Town. These visits
followed a mixed methods approach of focus group discussions,
transect walks, semi-structured interviews, and observations,
with target respondents from the municipality, nature
conservation, community groups and farmers, as well as the
education, media, tourism, and local business sectors.
Questions drew on different themes ranging from technical
aspects, such as water supply, wastewater and solid waste
infrastructure and management to the socio-relational aspects
of water scarcity, including drought impacts and emerging
Exploring the socio-hydrological assessment of two small
municipalities in the Western Cape
An interdisciplinary study is exploring how small municipalities are adapting to water scarcity,
and what lessons can be applied to other settings facing similar water crises. Article by
Germaine Owen, Amber Abrams, Kirsty Carden, Sue Harrison, Callies Selala & Bernelle Verster.
A roadsign warns of drought conditions in 2017 outside Malmesbury, one of the towns managed by the Swartland Municipality.
BACK TO TOP
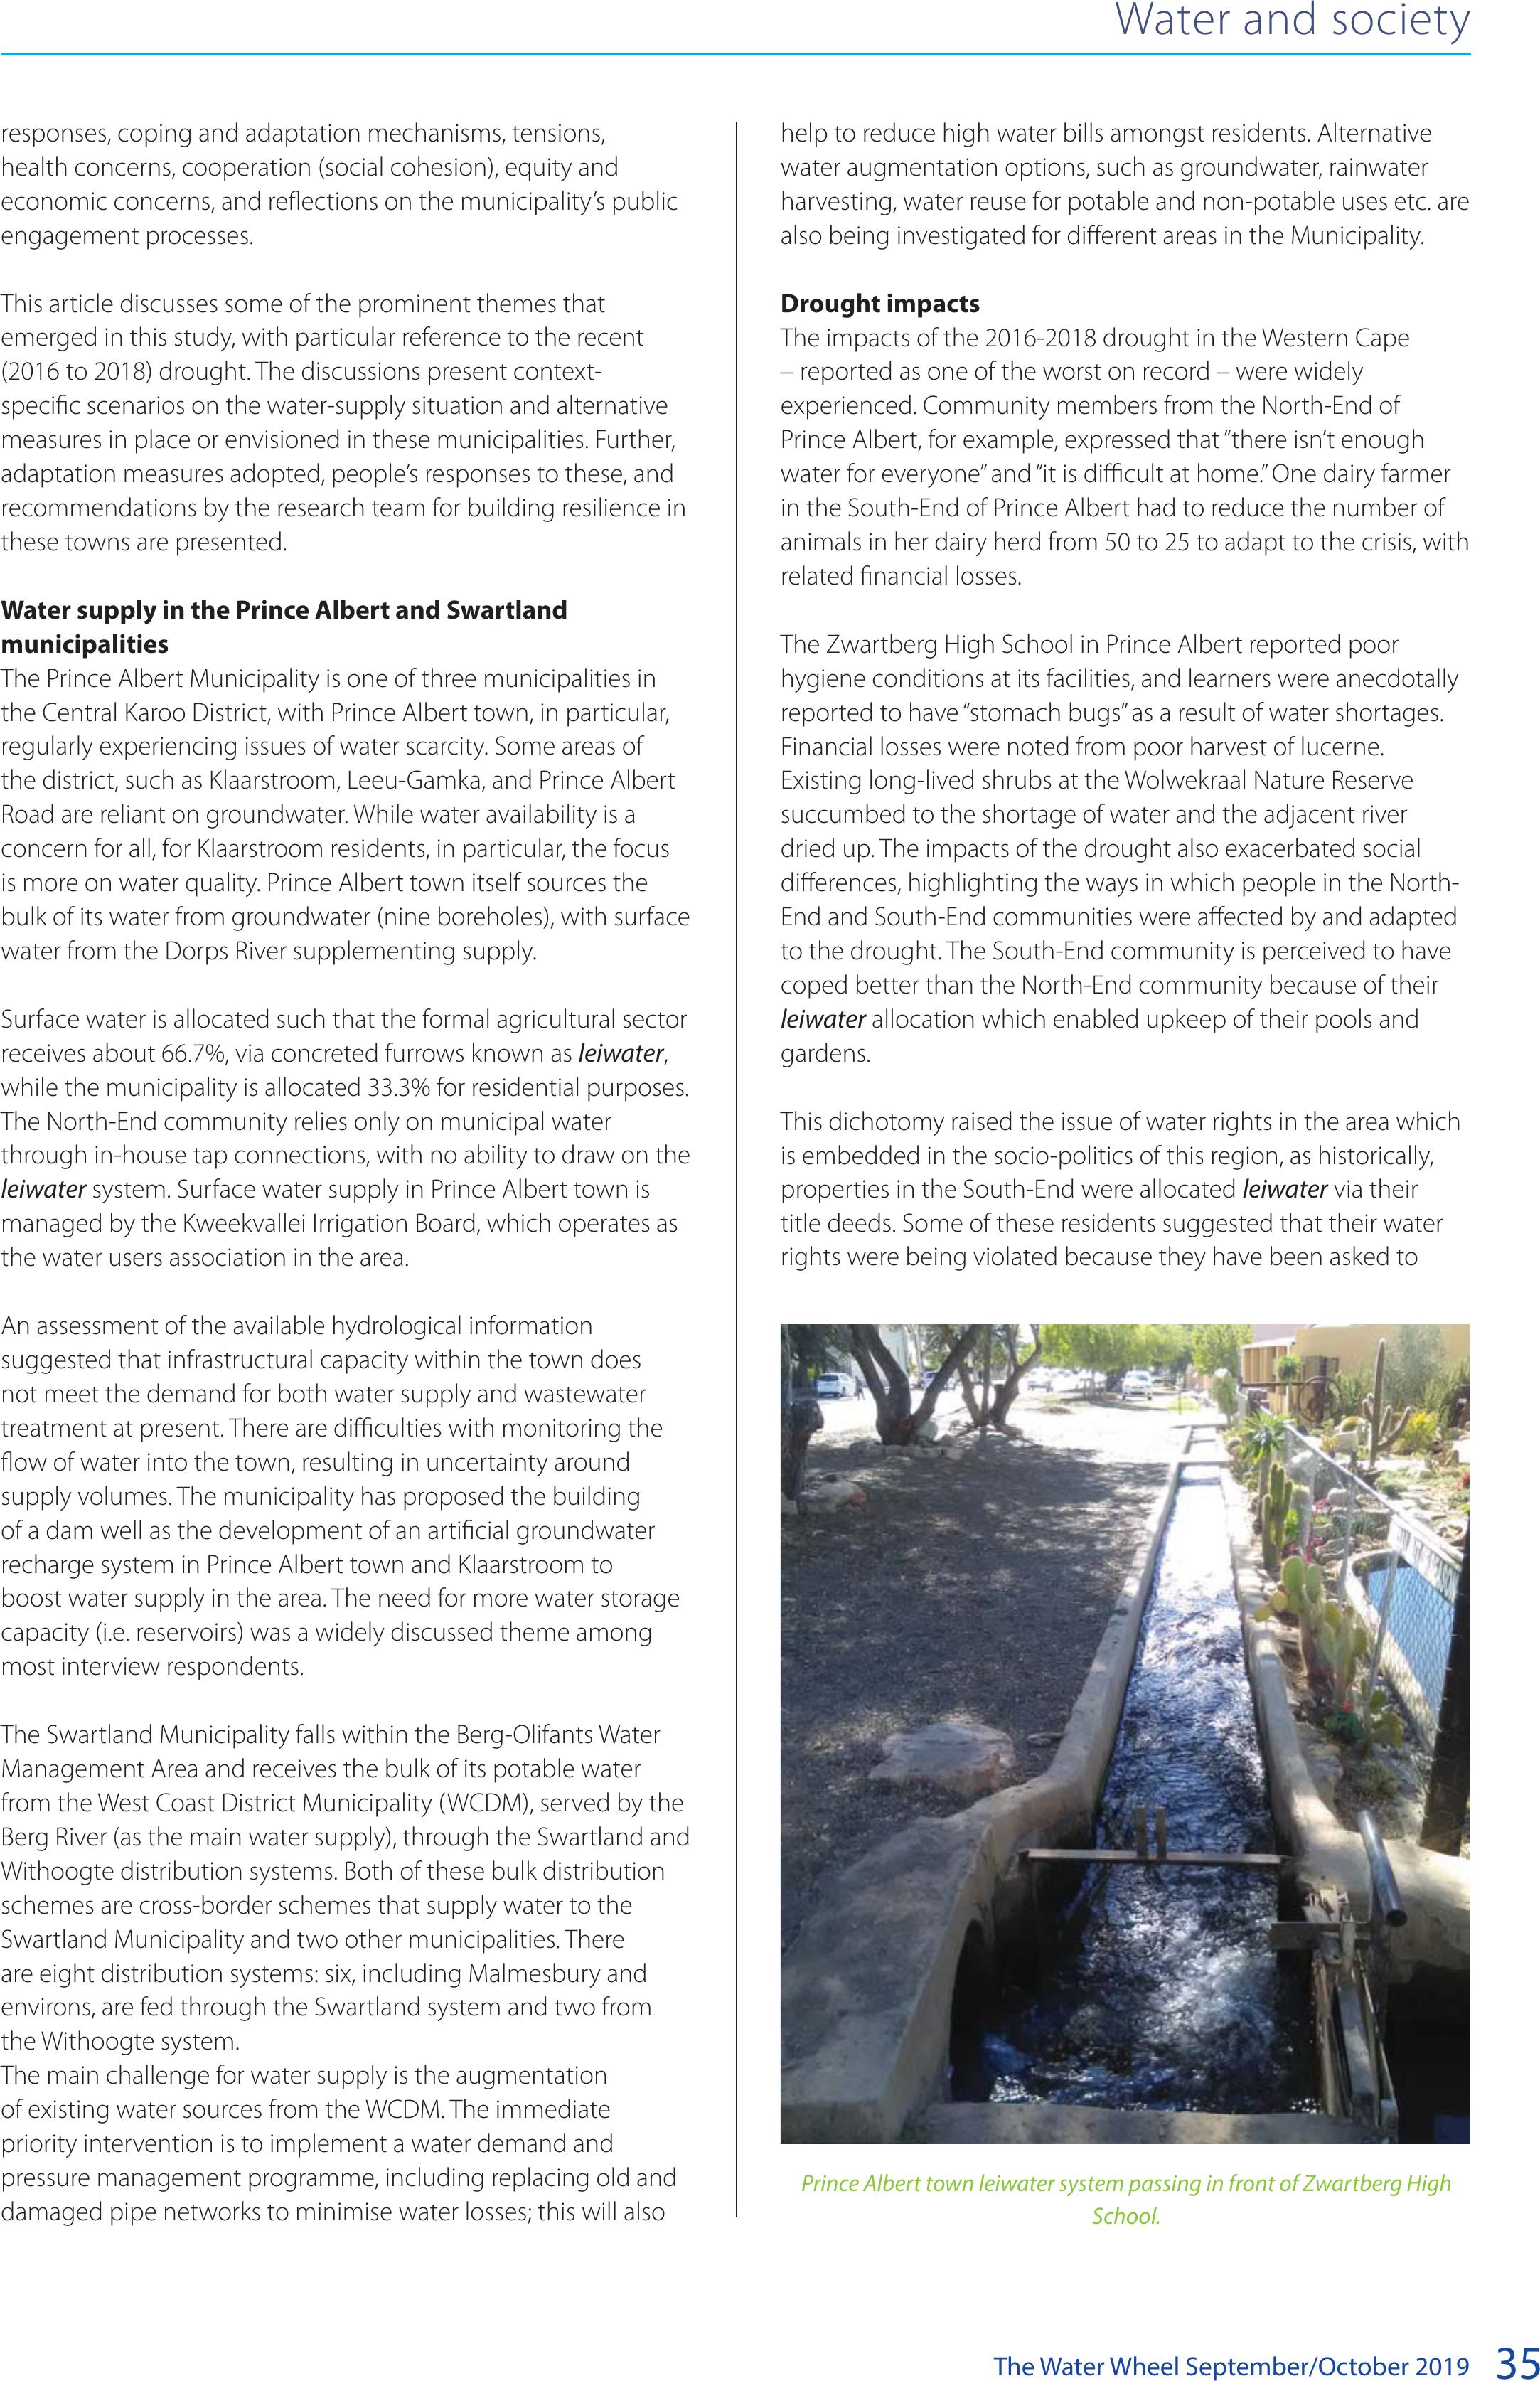
The Water Wheel September/October 201935
responses, coping and adaptation mechanisms, tensions,
health concerns, cooperation (social cohesion), equity and
economic concerns, and reflections on the municipality’s public
engagement processes.
This article discusses some of the prominent themes that
emerged in this study, with particular reference to the recent
(2016 to 2018) drought. The discussions present context-
specific scenarios on the water-supply situation and alternative
measures in place or envisioned in these municipalities. Further,
adaptation measures adopted, people’s responses to these, and
recommendations by the research team for building resilience in
these towns are presented.
Water supply in the Prince Albert and Swartland
municipalities
The Prince Albert Municipality is one of three municipalities in
the Central Karoo District, with Prince Albert town, in particular,
regularly experiencing issues of water scarcity. Some areas of
the district, such as Klaarstroom, Leeu-Gamka, and Prince Albert
Road are reliant on groundwater. While water availability is a
concern for all, for Klaarstroom residents, in particular, the focus
is more on water quality. Prince Albert town itself sources the
bulk of its water from groundwater (nine boreholes), with surface
water from the Dorps River supplementing supply.
Surface water is allocated such that the formal agricultural sector
receives about 66.7%, via concreted furrows known as leiwater,
while the municipality is allocated 33.3% for residential purposes.
The North-End community relies only on municipal water
through in-house tap connections, with no ability to draw on the
leiwater system. Surface water supply in Prince Albert town is
managed by the Kweekvallei Irrigation Board, which operates as
the water users association in the area.
An assessment of the available hydrological information
suggested that infrastructural capacity within the town does
not meet the demand for both water supply and wastewater
treatment at present. There are difficulties with monitoring the
flow of water into the town, resulting in uncertainty around
supply volumes. The municipality has proposed the building
of a dam well as the development of an artificial groundwater
recharge system in Prince Albert town and Klaarstroom to
boost water supply in the area. The need for more water storage
capacity (i.e. reservoirs) was a widely discussed theme among
most interview respondents.
The Swartland Municipality falls within the Berg-Olifants Water
Management Area and receives the bulk of its potable water
from the West Coast District Municipality (WCDM), served by the
Berg River (as the main water supply), through the Swartland and
Withoogte distribution systems. Both of these bulk distribution
schemes are cross-border schemes that supply water to the
Swartland Municipality and two other municipalities. There
are eight distribution systems: six, including Malmesbury and
environs, are fed through the Swartland system and two from
the Withoogte system.
The main challenge for water supply is the augmentation
of existing water sources from the WCDM. The immediate
priority intervention is to implement a water demand and
pressure management programme, including replacing old and
damaged pipe networks to minimise water losses; this will also
help to reduce high water bills amongst residents. Alternative
water augmentation options, such as groundwater, rainwater
harvesting, water reuse for potable and non-potable uses etc. are
also being investigated for different areas in the Municipality.
Drought impacts
The impacts of the 2016-2018 drought in the Western Cape
– reported as one of the worst on record – were widely
experienced. Community members from the North-End of
Prince Albert, for example, expressed that “there isn’t enough
water for everyone” and “it is difficult at home.” One dairy farmer
in the South-End of Prince Albert had to reduce the number of
animals in her dairy herd from 50 to 25 to adapt to the crisis, with
related financial losses.
The Zwartberg High School in Prince Albert reported poor
hygiene conditions at its facilities, and learners were anecdotally
reported to have “stomach bugs” as a result of water shortages.
Financial losses were noted from poor harvest of lucerne.
Existing long-lived shrubs at the Wolwekraal Nature Reserve
succumbed to the shortage of water and the adjacent river
dried up. The impacts of the drought also exacerbated social
differences, highlighting the ways in which people in the North-
End and South-End communities were affected by and adapted
to the drought. The South-End community is perceived to have
coped better than the North-End community because of their
leiwater allocation which enabled upkeep of their pools and
gardens.
This dichotomy raised the issue of water rights in the area which
is embedded in the socio-politics of this region, as historically,
properties in the South-End were allocated leiwater via their
title deeds. Some of these residents suggested that their water
rights were being violated because they have been asked to
Water and society
Prince Albert town leiwater system passing in front of Zwartberg High
School.
BACK TO TOP
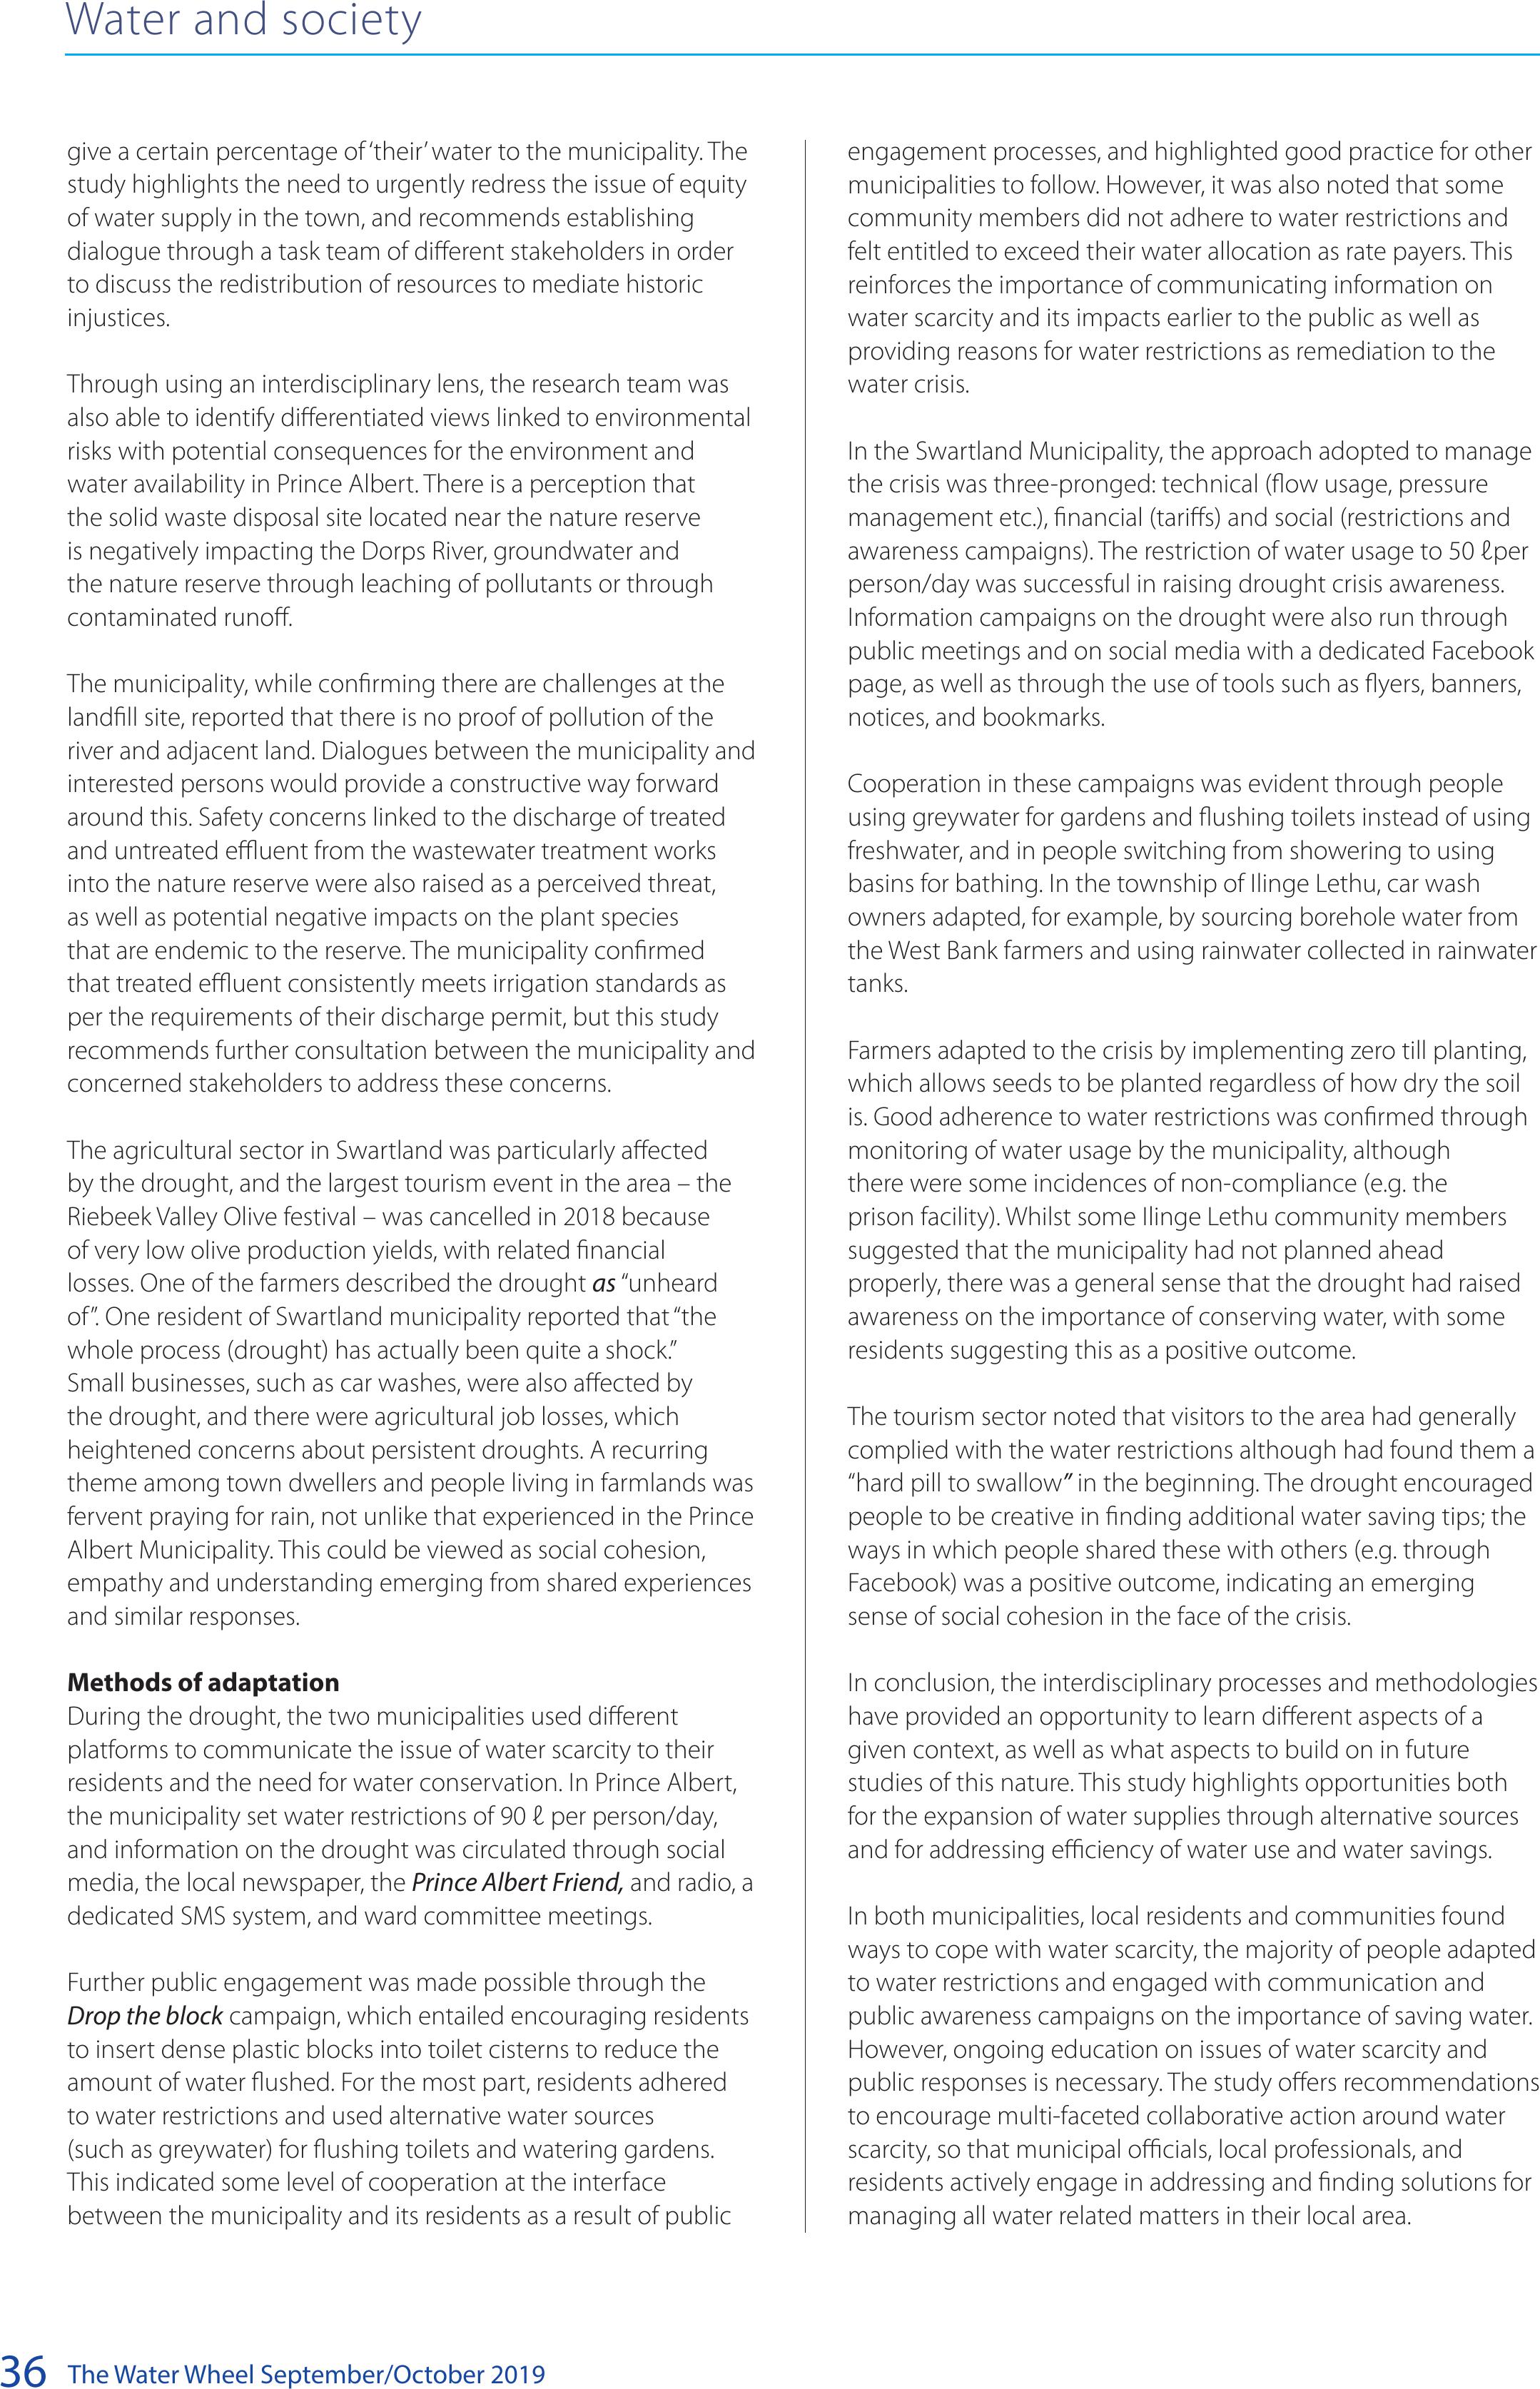
The Water Wheel September/October 2019
36
engagement processes, and highlighted good practice for other
municipalities to follow. However, it was also noted that some
community members did not adhere to water restrictions and
felt entitled to exceed their water allocation as rate payers. This
reinforces the importance of communicating information on
water scarcity and its impacts earlier to the public as well as
providing reasons for water restrictions as remediation to the
water crisis.
In the Swartland Municipality, the approach adopted to manage
the crisis was three-pronged: technical (flow usage, pressure
management etc.), financial (tariffs) and social (restrictions and
awareness campaigns). The restriction of water usage to 50 ℓper
person/day was successful in raising drought crisis awareness.
Information campaigns on the drought were also run through
public meetings and on social media with a dedicated Facebook
page, as well as through the use of tools such as flyers, banners,
notices, and bookmarks.
Cooperation in these campaigns was evident through people
using greywater for gardens and flushing toilets instead of using
freshwater, and in people switching from showering to using
basins for bathing. In the township of Ilinge Lethu, car wash
owners adapted, for example, by sourcing borehole water from
the West Bank farmers and using rainwater collected in rainwater
tanks.
Farmers adapted to the crisis by implementing zero till planting,
which allows seeds to be planted regardless of how dry the soil
is. Good adherence to water restrictions was confirmed through
monitoring of water usage by the municipality, although
there were some incidences of non-compliance (e.g. the
prison facility). Whilst some Ilinge Lethu community members
suggested that the municipality had not planned ahead
properly, there was a general sense that the drought had raised
awareness on the importance of conserving water, with some
residents suggesting this as a positive outcome.
The tourism sector noted that visitors to the area had generally
complied with the water restrictions although had found them a
“hard pill to swallow” in the beginning. The drought encouraged
people to be creative in finding additional water saving tips; the
ways in which people shared these with others (e.g. through
Facebook) was a positive outcome, indicating an emerging
sense of social cohesion in the face of the crisis.
In conclusion, the interdisciplinary processes and methodologies
have provided an opportunity to learn different aspects of a
given context, as well as what aspects to build on in future
studies of this nature. This study highlights opportunities both
for the expansion of water supplies through alternative sources
and for addressing efficiency of water use and water savings.
In both municipalities, local residents and communities found
ways to cope with water scarcity, the majority of people adapted
to water restrictions and engaged with communication and
public awareness campaigns on the importance of saving water.
However, ongoing education on issues of water scarcity and
public responses is necessary. The study offers recommendations
to encourage multi-faceted collaborative action around water
scarcity, so that municipal officials, local professionals, and
residents actively engage in addressing and finding solutions for
managing all water related matters in their local area.
give a certain percentage of ‘their’ water to the municipality. The
study highlights the need to urgently redress the issue of equity
of water supply in the town, and recommends establishing
dialogue through a task team of different stakeholders in order
to discuss the redistribution of resources to mediate historic
injustices.
Through using an interdisciplinary lens, the research team was
also able to identify differentiated views linked to environmental
risks with potential consequences for the environment and
water availability in Prince Albert. There is a perception that
the solid waste disposal site located near the nature reserve
is negatively impacting the Dorps River, groundwater and
the nature reserve through leaching of pollutants or through
contaminated runoff.
The municipality, while confirming there are challenges at the
landfill site, reported that there is no proof of pollution of the
river and adjacent land. Dialogues between the municipality and
interested persons would provide a constructive way forward
around this. Safety concerns linked to the discharge of treated
and untreated effluent from the wastewater treatment works
into the nature reserve were also raised as a perceived threat,
as well as potential negative impacts on the plant species
that are endemic to the reserve. The municipality confirmed
that treated effluent consistently meets irrigation standards as
per the requirements of their discharge permit, but this study
recommends further consultation between the municipality and
concerned stakeholders to address these concerns.
The agricultural sector in Swartland was particularly affected
by the drought, and the largest tourism event in the area – the
Riebeek Valley Olive festival – was cancelled in 2018 because
of very low olive production yields, with related financial
losses. One of the farmers described the drought as “unheard
of”. One resident of Swartland municipality reported that “the
whole process (drought) has actually been quite a shock.”
Small businesses, such as car washes, were also affected by
the drought, and there were agricultural job losses, which
heightened concerns about persistent droughts. A recurring
theme among town dwellers and people living in farmlands was
fervent praying for rain, not unlike that experienced in the Prince
Albert Municipality. This could be viewed as social cohesion,
empathy and understanding emerging from shared experiences
and similar responses.
Methods of adaptation
During the drought, the two municipalities used different
platforms to communicate the issue of water scarcity to their
residents and the need for water conservation. In Prince Albert,
the municipality set water restrictions of 90 ℓ per person/day,
and information on the drought was circulated through social
media, the local newspaper, the Prince Albert Friend, and radio, a
dedicated SMS system, and ward committee meetings.
Further public engagement was made possible through the
Drop the block campaign, which entailed encouraging residents
to insert dense plastic blocks into toilet cisterns to reduce the
amount of water flushed. For the most part, residents adhered
to water restrictions and used alternative water sources
(such as greywater) for flushing toilets and watering gardens.
This indicated some level of cooperation at the interface
between the municipality and its residents as a result of public
Water and society
BACK TO TOP
The Water Wheel September/October 201937
Water and society
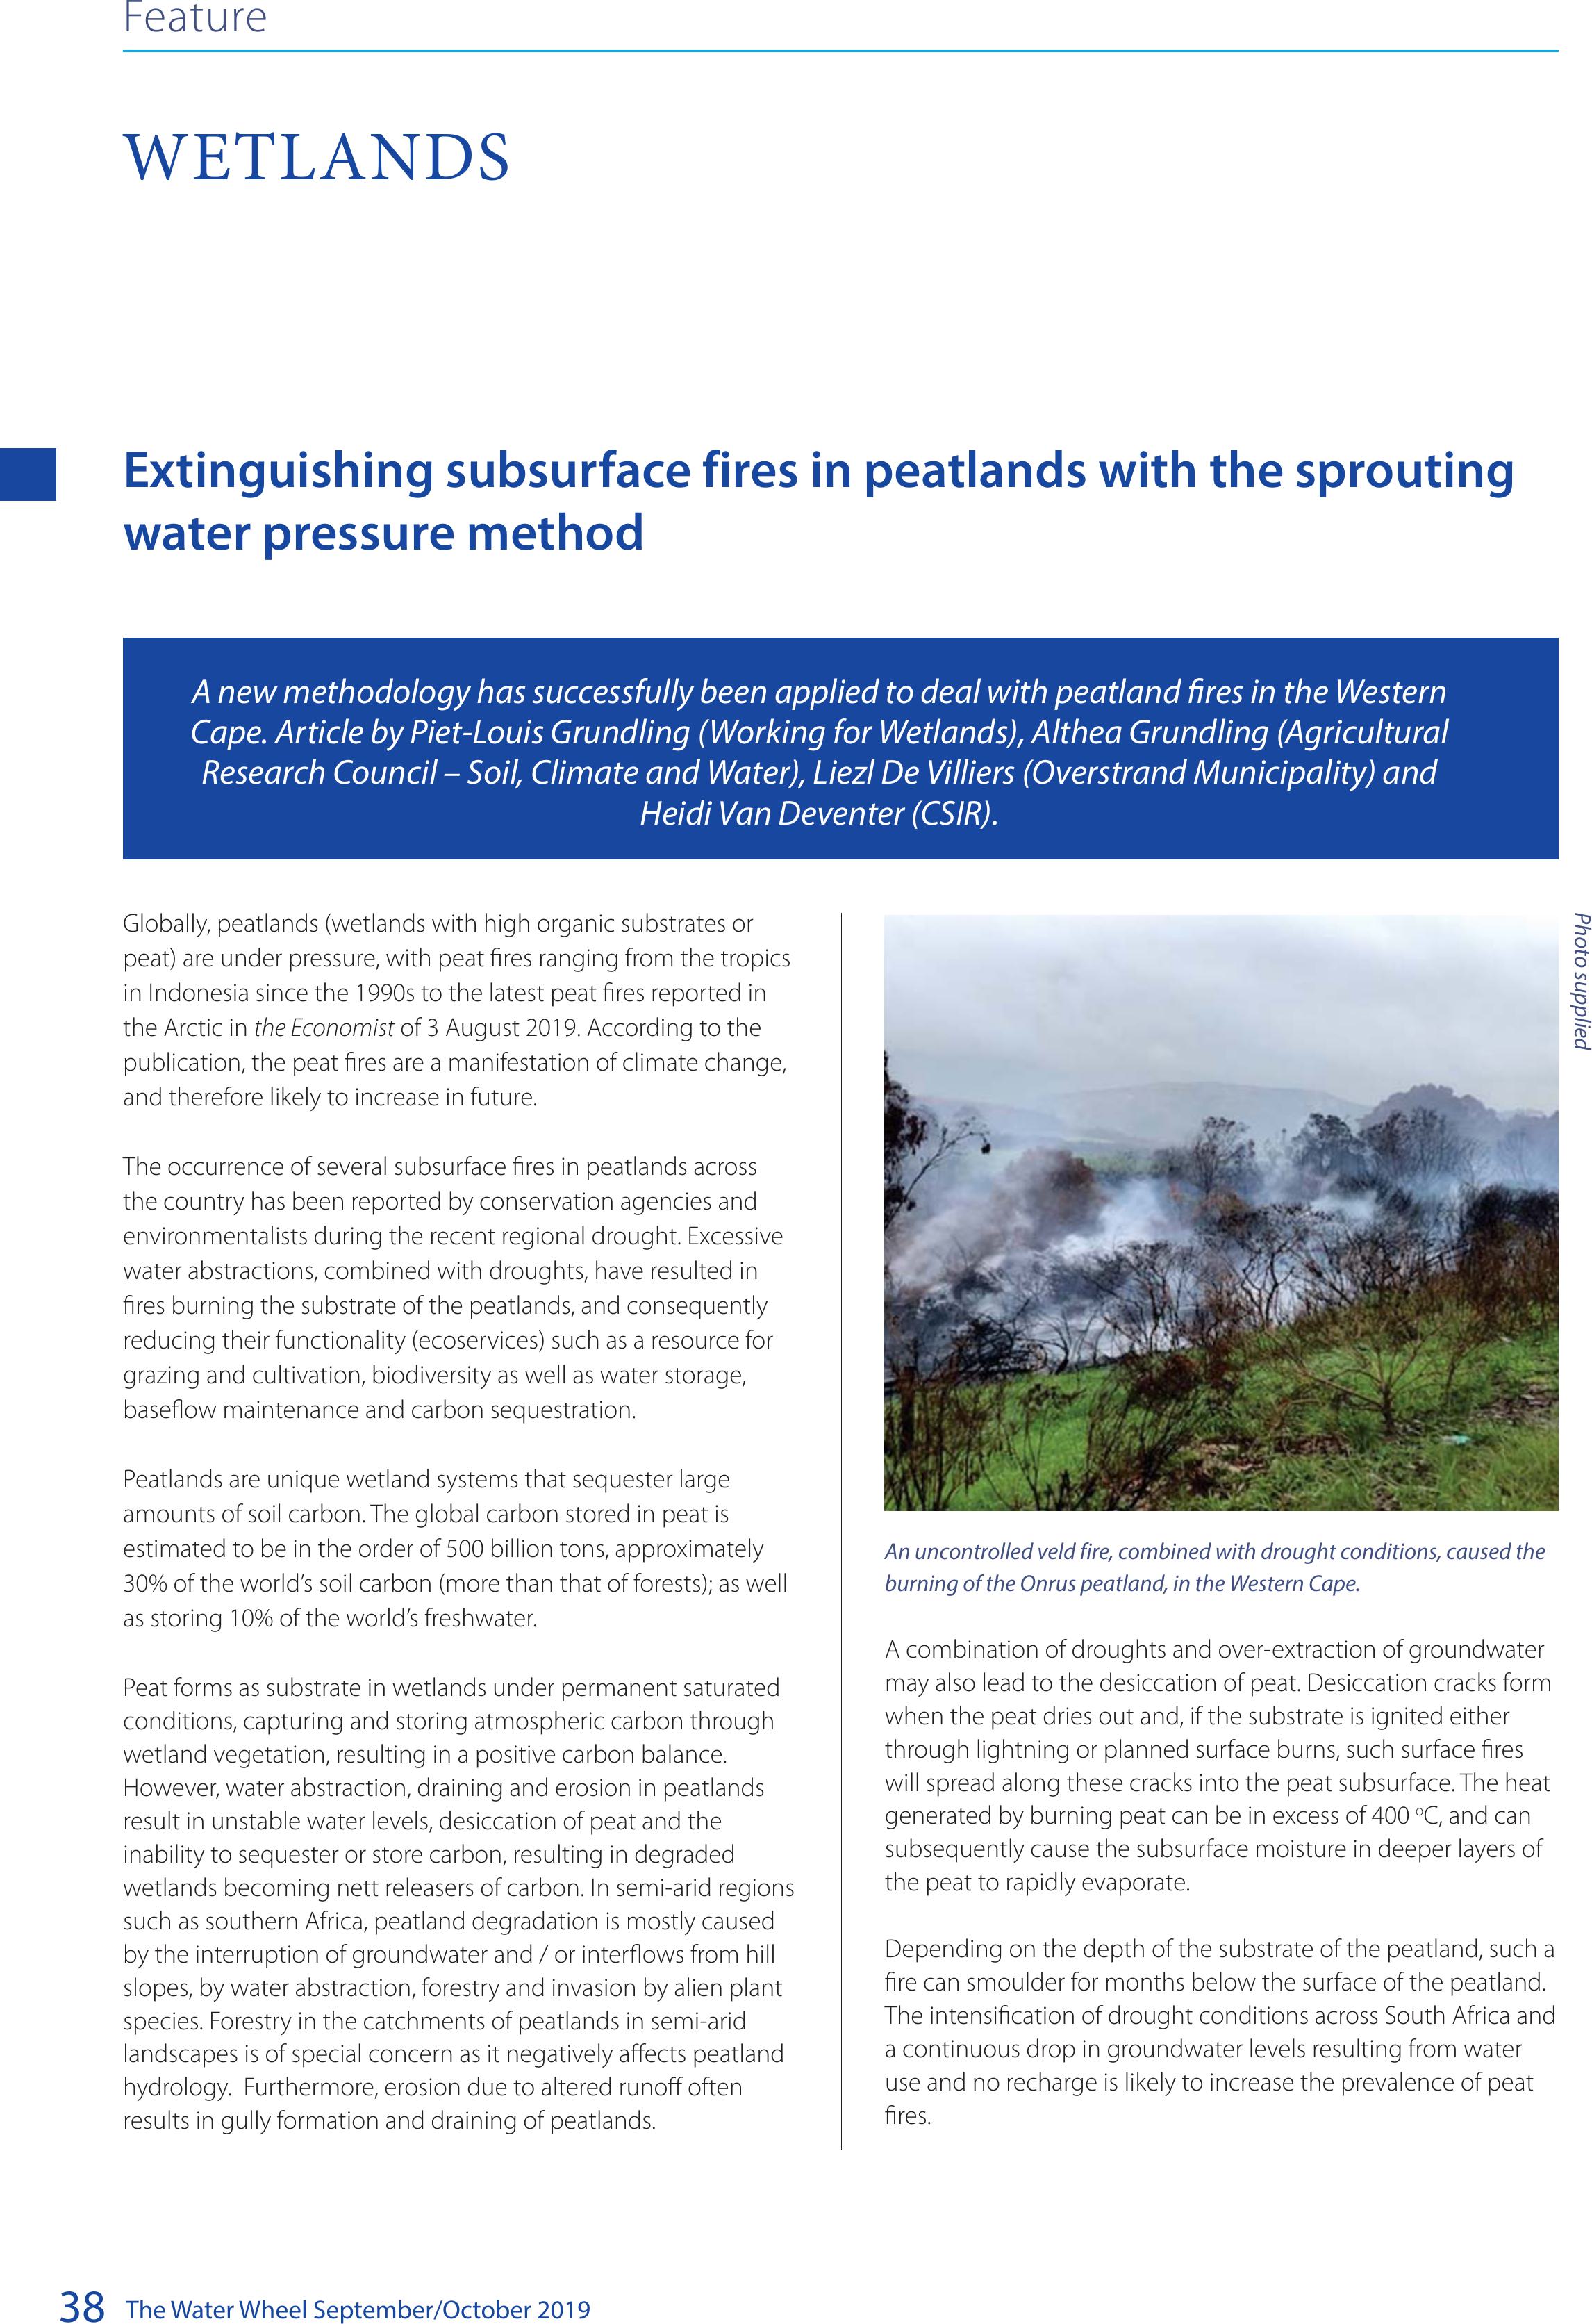
The Water Wheel September/October 2019
38
Extinguishing subsurface fires in peatlands with the sprouting
water pressure method
Globally, peatlands (wetlands with high organic substrates or
peat) are under pressure, with peat fires ranging from the tropics
in Indonesia since the 1990s to the latest peat fires reported in
the Arctic in the Economist of 3 August 2019. According to the
publication, the peat fires are a manifestation of climate change,
and therefore likely to increase in future.
The occurrence of several subsurface fires in peatlands across
the country has been reported by conservation agencies and
environmentalists during the recent regional drought. Excessive
water abstractions, combined with droughts, have resulted in
fires burning the substrate of the peatlands, and consequently
reducing their functionality (ecoservices) such as a resource for
grazing and cultivation, biodiversity as well as water storage,
baseflow maintenance and carbon sequestration.
Peatlands are unique wetland systems that sequester large
amounts of soil carbon. The global carbon stored in peat is
estimated to be in the order of 500 billion tons, approximately
30% of the world’s soil carbon (more than that of forests); as well
as storing 10% of the world’s freshwater.
Peat forms as substrate in wetlands under permanent saturated
conditions, capturing and storing atmospheric carbon through
wetland vegetation, resulting in a positive carbon balance.
However, water abstraction, draining and erosion in peatlands
result in unstable water levels, desiccation of peat and the
inability to sequester or store carbon, resulting in degraded
wetlands becoming nett releasers of carbon. In semi-arid regions
such as southern Africa, peatland degradation is mostly caused
by the interruption of groundwater and / or interflows from hill
slopes, by water abstraction, forestry and invasion by alien plant
species. Forestry in the catchments of peatlands in semi-arid
landscapes is of special concern as it negatively affects peatland
hydrology. Furthermore, erosion due to altered runoff often
results in gully formation and draining of peatlands.
An uncontrolled veld fire, combined with drought conditions, caused the
burning of the Onrus peatland, in the Western Cape.
A combination of droughts and over-extraction of groundwater
may also lead to the desiccation of peat. Desiccation cracks form
when the peat dries out and, if the substrate is ignited either
through lightning or planned surface burns, such surface fires
will spread along these cracks into the peat subsurface. The heat
generated by burning peat can be in excess of 400 oC, and can
subsequently cause the subsurface moisture in deeper layers of
the peat to rapidly evaporate.
Depending on the depth of the substrate of the peatland, such a
fire can smoulder for months below the surface of the peatland.
The intensification of drought conditions across South Africa and
a continuous drop in groundwater levels resulting from water
use and no recharge is likely to increase the prevalence of peat
fires.
A new methodology has successfully been applied to deal with peatland res in the Western
Cape. Article by Piet-Louis Grundling (Working for Wetlands), Althea Grundling (Agricultural
Research Council – Soil, Climate and Water), Liezl De Villiers (Overstrand Municipality) and
Heidi Van Deventer (CSIR).
WETLANDS
Feature
Photo supplied
BACK TO TOP
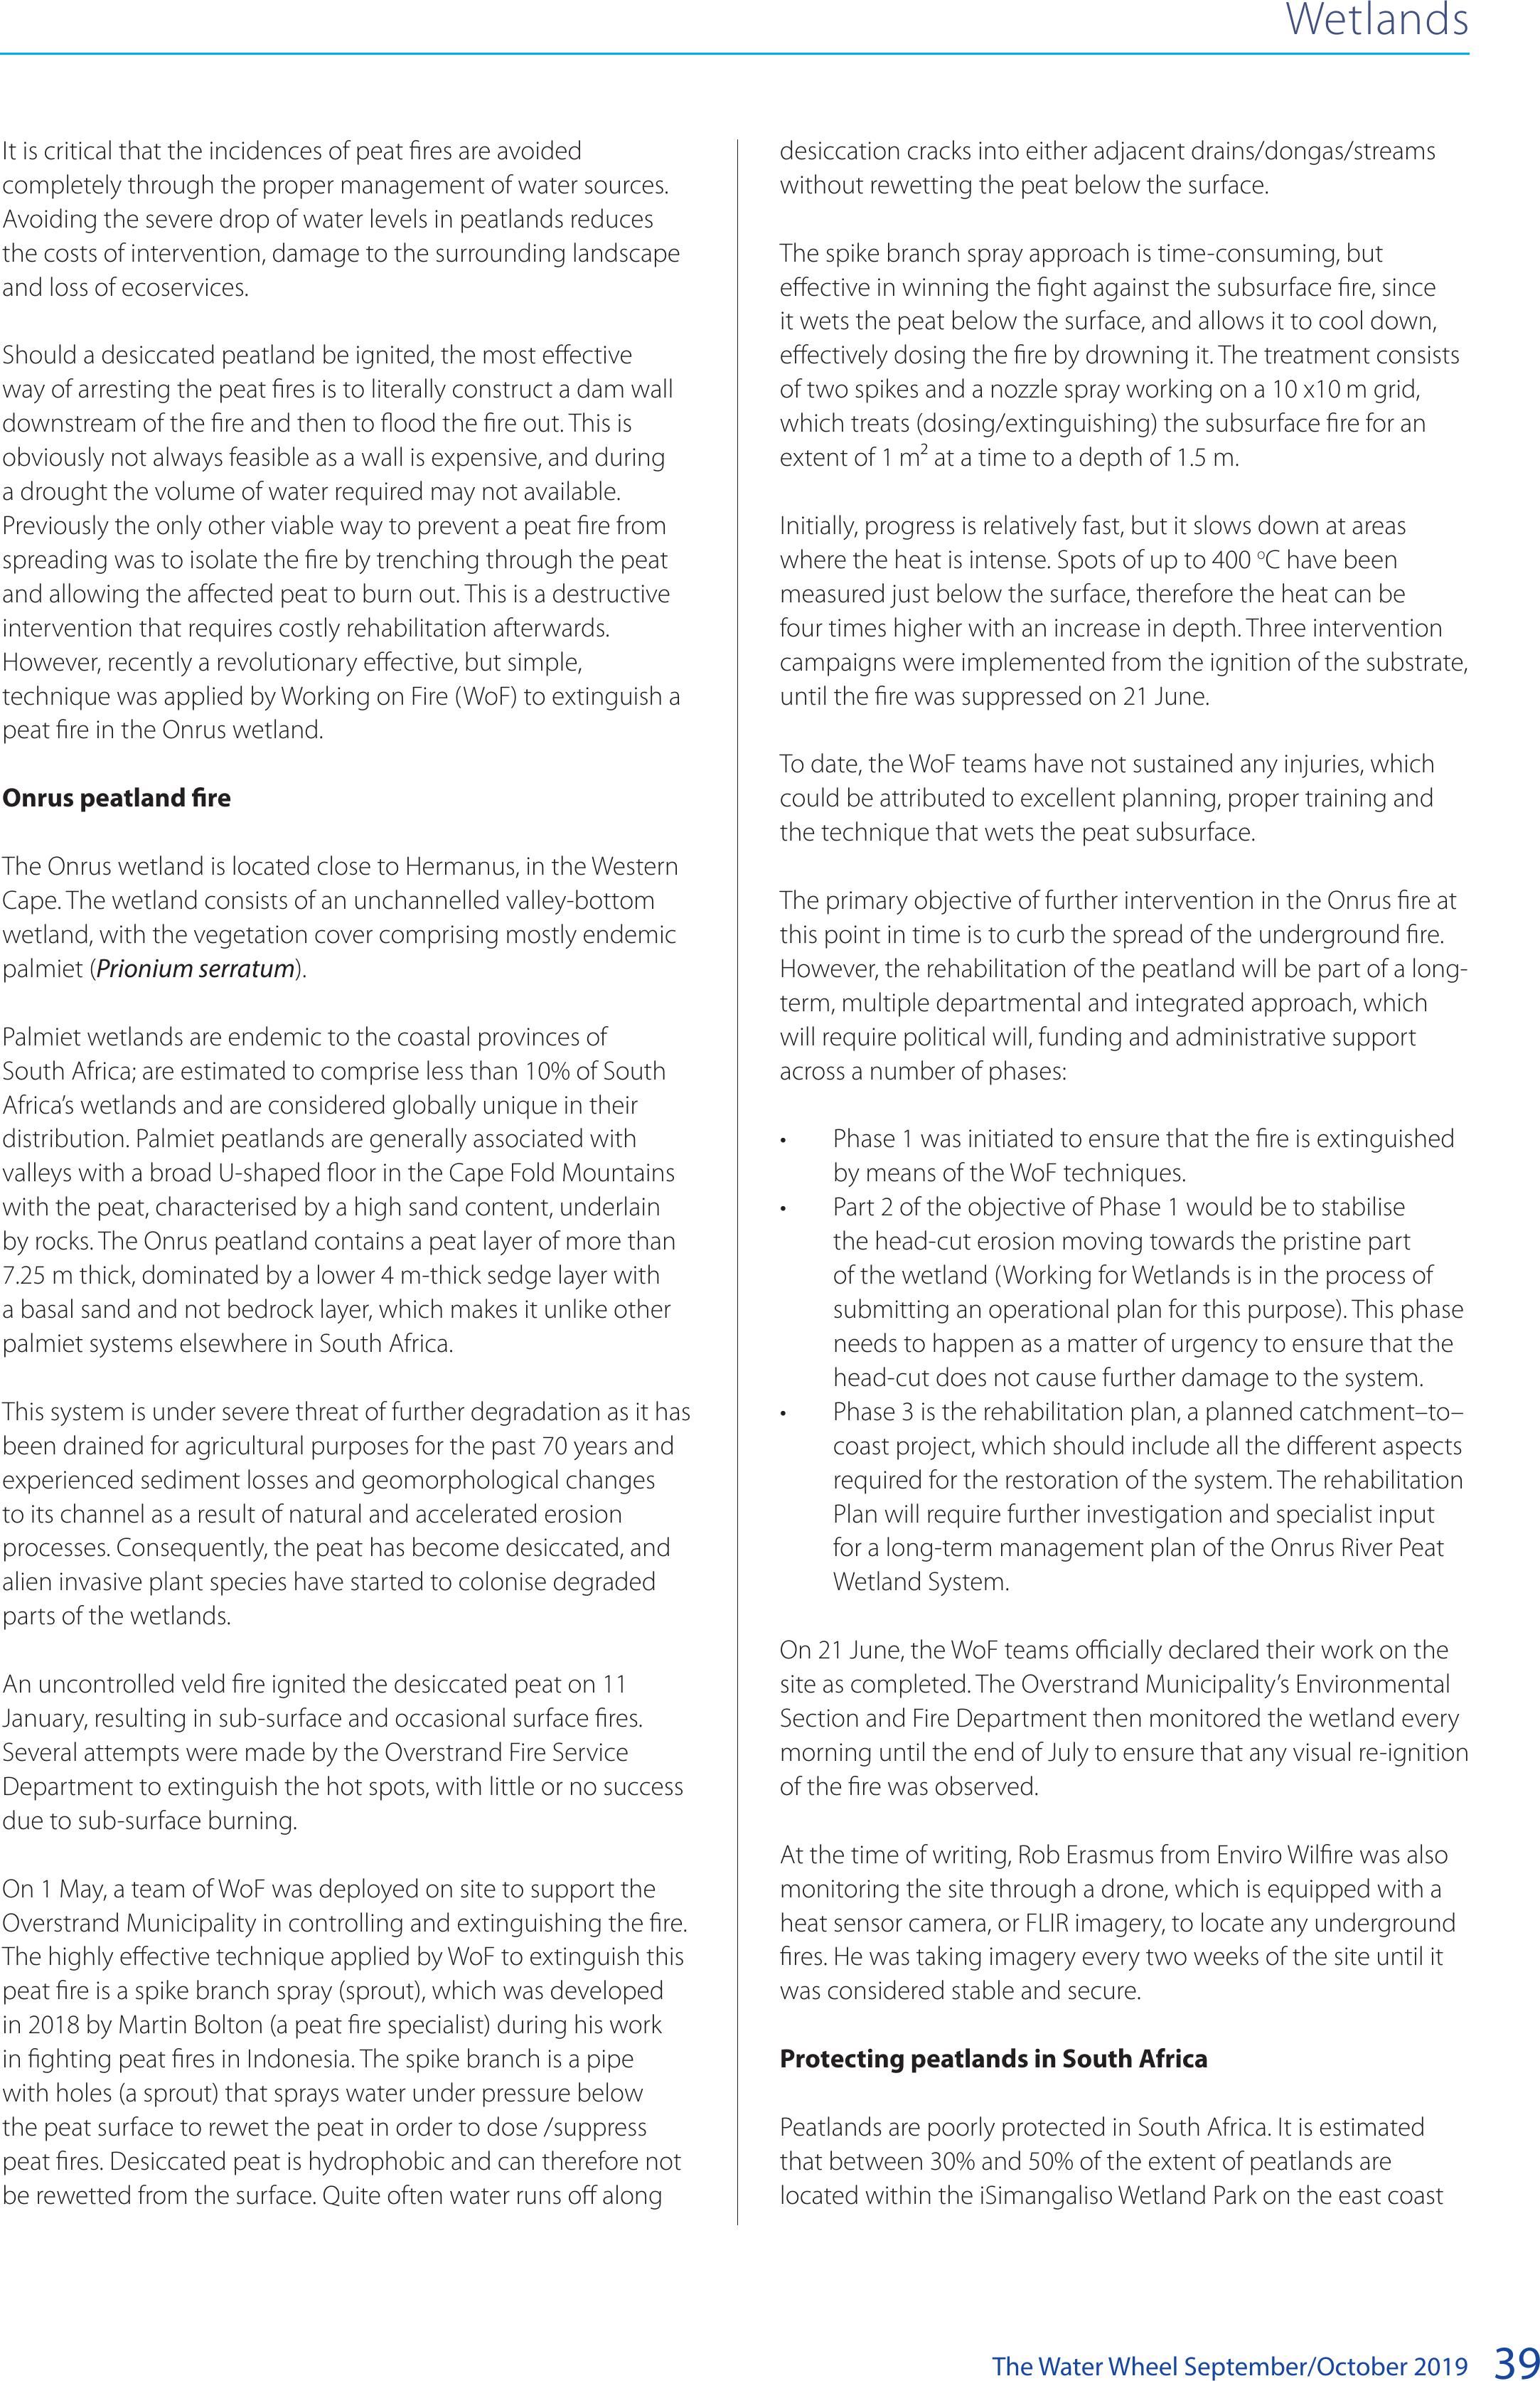
The Water Wheel September/October 201939
desiccation cracks into either adjacent drains/dongas/streams
without rewetting the peat below the surface.
The spike branch spray approach is time-consuming, but
effective in winning the fight against the subsurface fire, since
it wets the peat below the surface, and allows it to cool down,
effectively dosing the fire by drowning it. The treatment consists
of two spikes and a nozzle spray working on a 10 x10m grid,
which treats (dosing/extinguishing) the subsurface fire for an
extent of 1m² at a time to a depth of 1.5 m.
Initially, progress is relatively fast, but it slows down at areas
where the heat is intense. Spots of up to 400 oC have been
measured just below the surface, therefore the heat can be
four times higher with an increase in depth. Three intervention
campaigns were implemented from the ignition of the substrate,
until the fire was suppressed on 21 June.
To date, the WoF teams have not sustained any injuries, which
could be attributed to excellent planning, proper training and
the technique that wets the peat subsurface.
The primary objective of further intervention in the Onrus fire at
this point in time is to curb the spread of the underground fire.
However, the rehabilitation of the peatland will be part of a long-
term, multiple departmental and integrated approach, which
will require political will, funding and administrative support
across a number of phases:
• Phase 1 was initiated to ensure that the fire is extinguished
by means of the WoF techniques.
• Part 2 of the objective of Phase 1 would be to stabilise
the head-cut erosion moving towards the pristine part
of the wetland (Working for Wetlands is in the process of
submitting an operational plan for this purpose). This phase
needs to happen as a matter of urgency to ensure that the
head-cut does not cause further damage to the system.
• Phase 3 is the rehabilitation plan, a planned catchment–to–
coast project, which should include all the different aspects
required for the restoration of the system. The rehabilitation
Plan will require further investigation and specialist input
for a long-term management plan of the Onrus River Peat
Wetland System.
On 21 June, the WoF teams officially declared their work on the
site as completed. The Overstrand Municipality’s Environmental
Section and Fire Department then monitored the wetland every
morning until the end of July to ensure that any visual re-ignition
of the fire was observed.
At the time of writing, Rob Erasmus from Enviro Wilfire was also
monitoring the site through a drone, which is equipped with a
heat sensor camera, or FLIR imagery, to locate any underground
fires. He was taking imagery every two weeks of the site until it
was considered stable and secure.
Protecting peatlands in South Africa
Peatlands are poorly protected in South Africa. It is estimated
that between 30% and 50% of the extent of peatlands are
located within the iSimangaliso Wetland Park on the east coast
It is critical that the incidences of peat fires are avoided
completely through the proper management of water sources.
Avoiding the severe drop of water levels in peatlands reduces
the costs of intervention, damage to the surrounding landscape
and loss of ecoservices.
Should a desiccated peatland be ignited, the most effective
way of arresting the peat fires is to literally construct a dam wall
downstream of the fire and then to flood the fire out. This is
obviously not always feasible as a wall is expensive, and during
a drought the volume of water required may not available.
Previously the only other viable way to prevent a peat fire from
spreading was to isolate the fire by trenching through the peat
and allowing the affected peat to burn out. This is a destructive
intervention that requires costly rehabilitation afterwards.
However, recently a revolutionary effective, but simple,
technique was applied by Working on Fire (WoF) to extinguish a
peat fire in the Onrus wetland.
Onrus peatland fire
The Onrus wetland is located close to Hermanus, in the Western
Cape. The wetland consists of an unchannelled valley-bottom
wetland, with the vegetation cover comprising mostly endemic
palmiet (Prionium serratum).
Palmiet wetlands are endemic to the coastal provinces of
South Africa; are estimated to comprise less than 10% of South
Africa’s wetlands and are considered globally unique in their
distribution. Palmiet peatlands are generally associated with
valleys with a broad U-shaped floor in the Cape Fold Mountains
with the peat, characterised by a high sand content, underlain
by rocks. The Onrus peatland contains a peat layer of more than
7.25 m thick, dominated by a lower 4 m-thick sedge layer with
a basal sand and not bedrock layer, which makes it unlike other
palmiet systems elsewhere in South Africa.
This system is under severe threat of further degradation as it has
been drained for agricultural purposes for the past 70 years and
experienced sediment losses and geomorphological changes
to its channel as a result of natural and accelerated erosion
processes. Consequently, the peat has become desiccated, and
alien invasive plant species have started to colonise degraded
parts of the wetlands.
An uncontrolled veld fire ignited the desiccated peat on 11
January, resulting in sub-surface and occasional surface fires.
Several attempts were made by the Overstrand Fire Service
Department to extinguish the hot spots, with little or no success
due to sub-surface burning.
On 1 May, a team of WoF was deployed on site to support the
Overstrand Municipality in controlling and extinguishing the fire.
The highly effective technique applied by WoF to extinguish this
peat fire is a spike branch spray (sprout), which was developed
in 2018 by Martin Bolton (a peat fire specialist) during his work
in fighting peat fires in Indonesia. The spike branch is a pipe
with holes (a sprout) that sprays water under pressure below
the peat surface to rewet the peat in order to dose /suppress
peat fires. Desiccated peat is hydrophobic and can therefore not
be rewetted from the surface. Quite often water runs off along
Wetlands
BACK TO TOP
The Water Wheel September/October 2019
40
of the KwaZulu-Natal Province. This protected area includes
three Ramsar sites, namely, Kosi (estuarine, lakes and swamp
forests), Lake Sibaya (a freshwater lake or limnetic depression)
and the Lake St Lucia System (lakes, estuary, wetlands, mires and
swamp forests).
The Kruger National Park hosts the Mahlapanga and Mfayeni
Hot Spring Mires, whereas the Marakele National Park (Limpopo
Province) also includes peatlands. Some peatlands also fall in
another four of South Africa’s Ramsar sites, including Verlorenvlei,
Drakensberg, Ntsikeni, and the Marion and Prince Edward
islands). The efficacy of protection is, however, constrained by a
lack of knowledge on several aspects of wetlands, such as the
extent of wetlands in South Africa, which of these are peatlands,
and the ecological status of all wetlands in order to determine
their management and conservation requirements.
In addition to the uncertainty, poor enforcement of relevant
environmental legislation and policies and a lack of quick
and effective response to disaster events, is hampering the
protection of wetlands, and peatlands, in particular. Furthermore,
most of the peatlands in semi-arid regions are dependent
on sustained groundwater and/or hillslope intermediate
flows. Consequently, their management should consider
both catchments and the associated landscapes as part of an
integrated strategy to manage and conserve these peatlands.
Not only should land use practices within the peatland and
adjacent to it be managed, but also in related catchments;
and especially those that could impact on the water and
sediment balance of a peatland. Lastly, since most peatlands
occur in rural areas, a precautionary rule should be to limit any
activities that could jeopardise the integrity of peatlands, while
stipulations of authorisations, in terms of the relevant legislation,
must be strictly adhered to, while monitoring and compliance
enforcement by the relevant authorities should be executed
continuously.
In the past three decades, the application of wetland
management has been undertaken through several
legislative mechanisms, including the Conservation of
Agriculture Resources Act (CARA, Act 43 of 1983), the National
Environmental Management Act (NEMA, Act 28 of 2008), the
Environmental Impact Assessment (EIA) policy and Water Use
Licence Authorisations (WULA) regulations 21c and 21i of the
National Water Act (Act 36 of 1998).
These interventions have resulted in a number of positive
outcomes, namely:
• Limited granting of commercial wetland cultivation
authorisations, resulting in increased protection of the
peatlands;
• EIAs and WULA regulations which had been enforced on
any peatland-related impacts and consequently resulting in
a decrease of development and dams being built within or
upstream of peatlands;
• The prohibition of peat extraction authorisation for
agricultural purposes; and
• A decrease in afforestation and mining authorisations
within and upstream of peatland.
Wetlands
1. The spike branch spray approach involves a spike that sprays water
along its length and can penetrate the hardened dedicated peat crust (top
layer).
2. The spike rewets the dedicated peat along its length in a 360 spray as it
penetrates the peat.
3. The method cools down the peat effectively by drowning it.
C de Kella/Working for Fires
BACK TO TOP
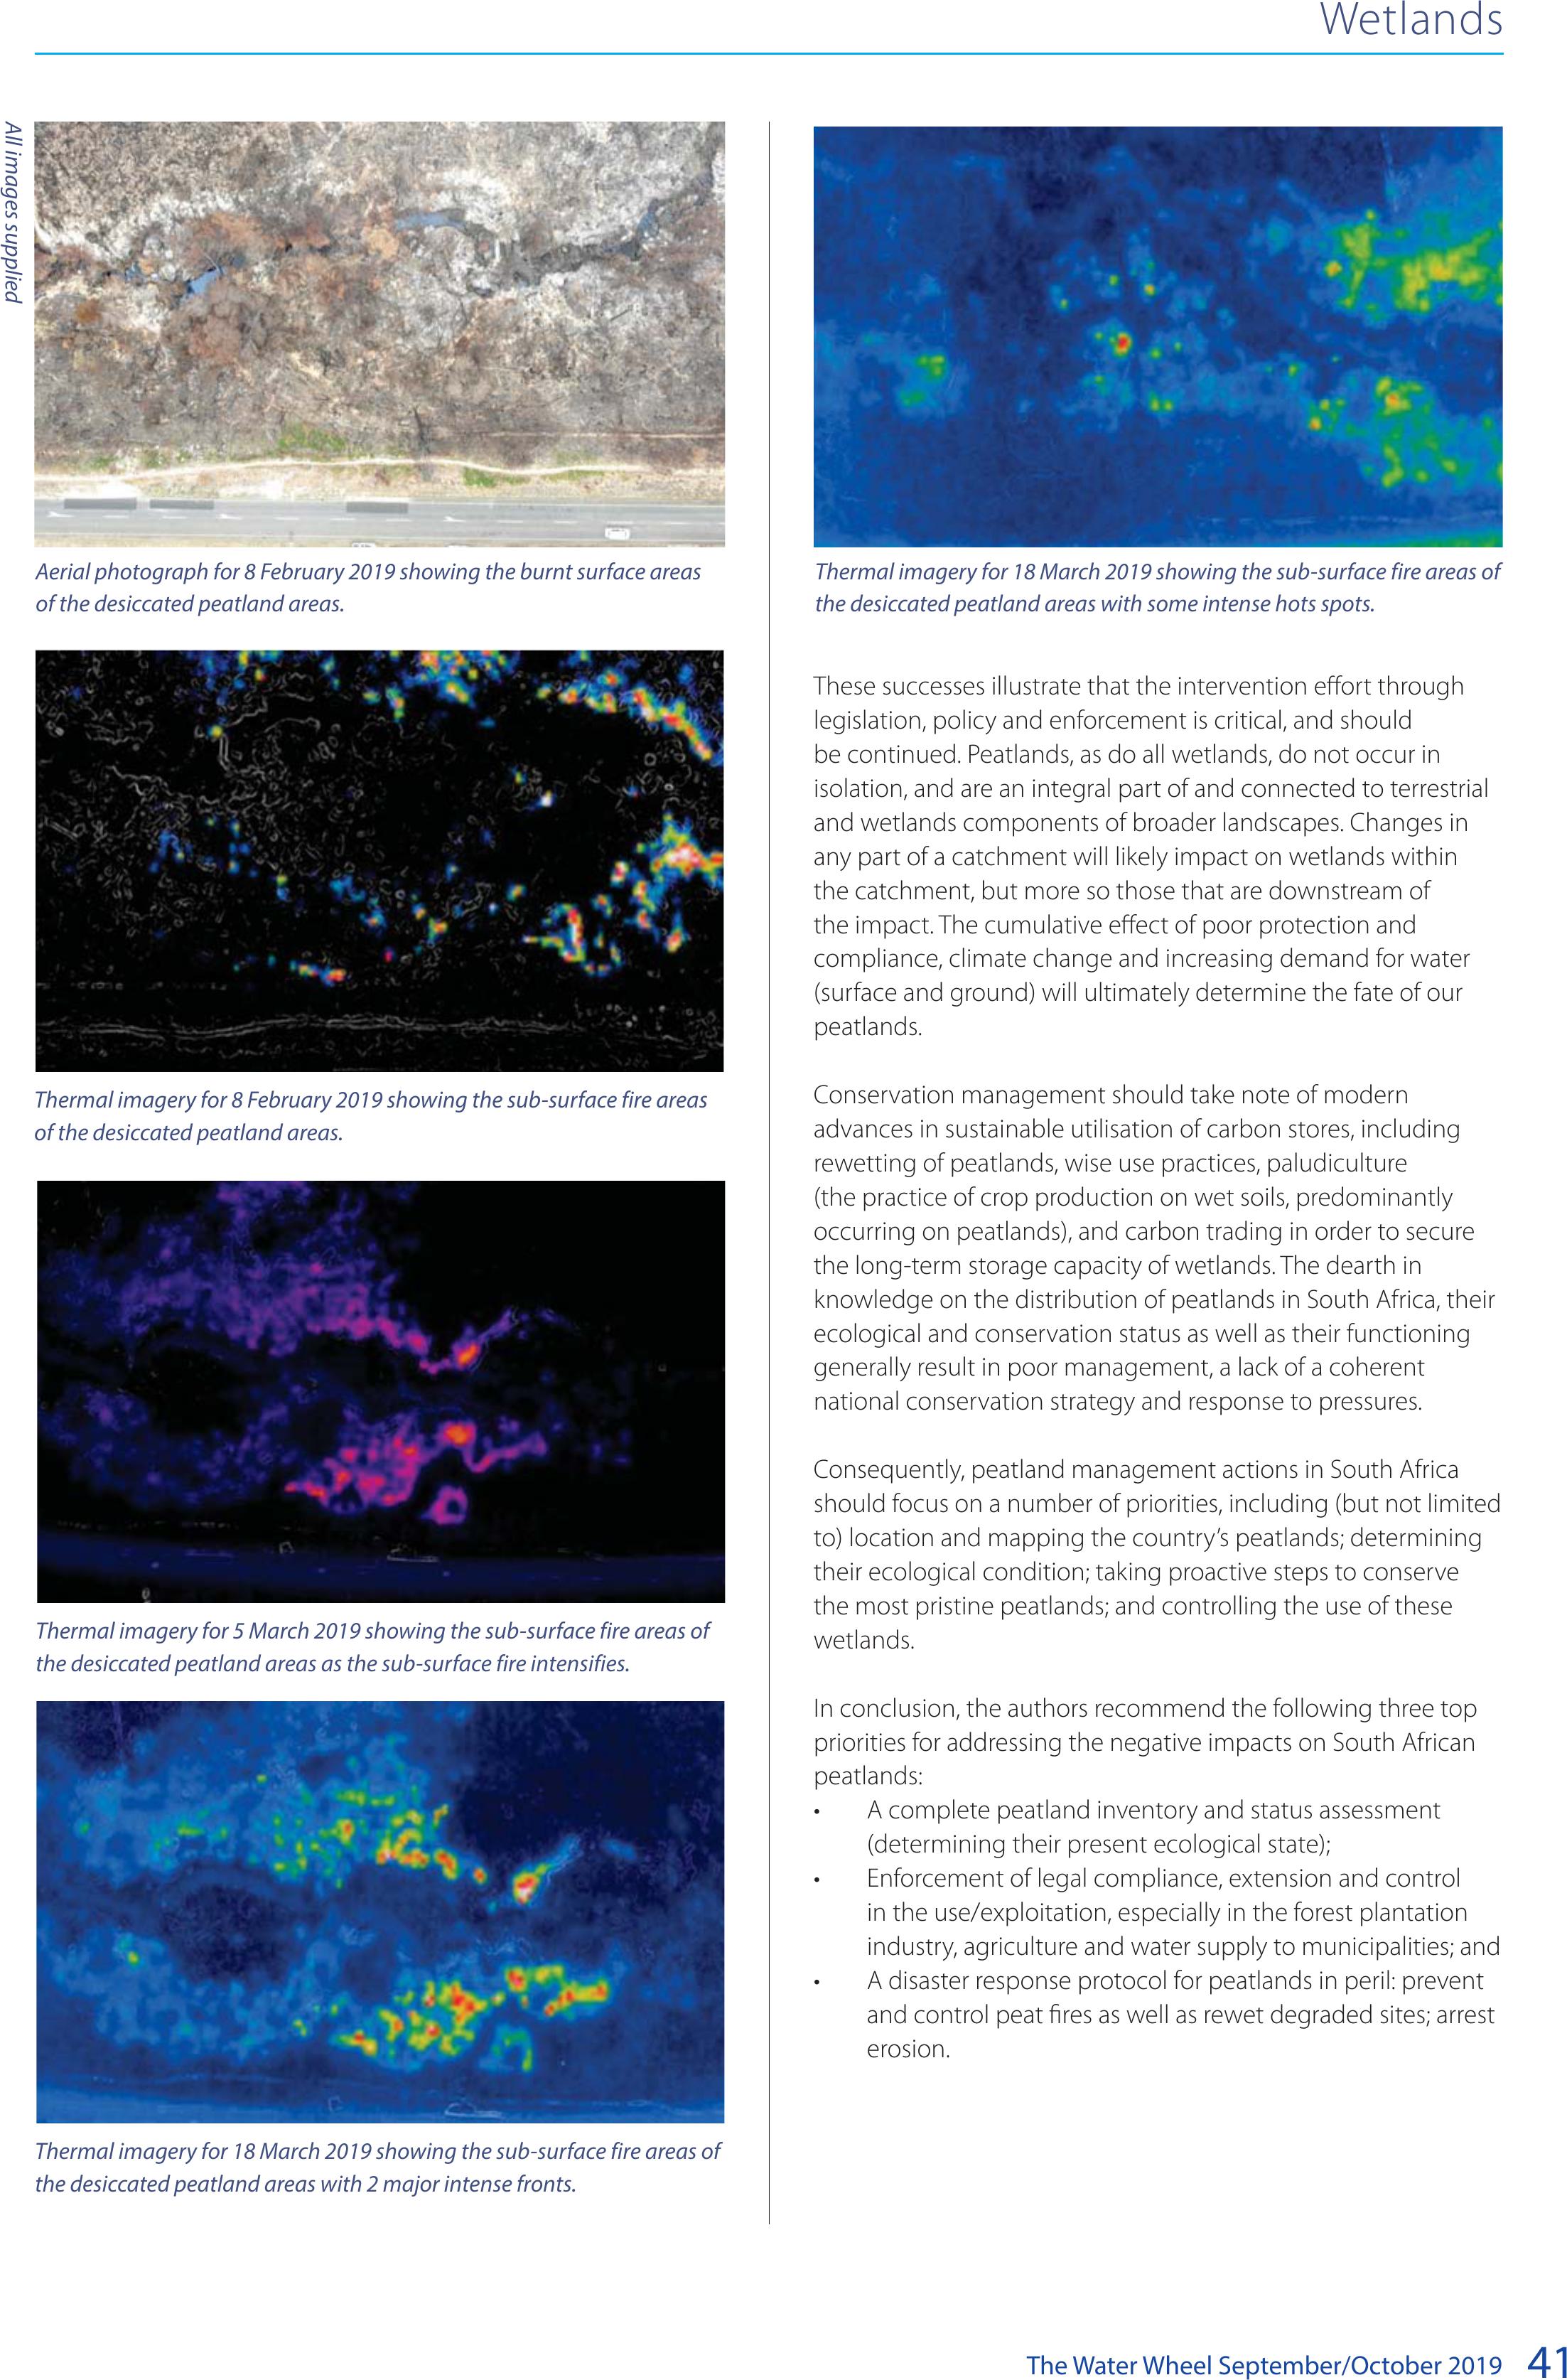
The Water Wheel September/October 201941
These successes illustrate that the intervention effort through
legislation, policy and enforcement is critical, and should
be continued. Peatlands, as do all wetlands, do not occur in
isolation, and are an integral part of and connected to terrestrial
and wetlands components of broader landscapes. Changes in
any part of a catchment will likely impact on wetlands within
the catchment, but more so those that are downstream of
the impact. The cumulative effect of poor protection and
compliance, climate change and increasing demand for water
(surface and ground) will ultimately determine the fate of our
peatlands.
Conservation management should take note of modern
advances in sustainable utilisation of carbon stores, including
rewetting of peatlands, wise use practices, paludiculture
(the practice of crop production on wet soils, predominantly
occurring on peatlands), and carbon trading in order to secure
the long-term storage capacity of wetlands. The dearth in
knowledge on the distribution of peatlands in South Africa, their
ecological and conservation status as well as their functioning
generally result in poor management, a lack of a coherent
national conservation strategy and response to pressures.
Consequently, peatland management actions in South Africa
should focus on a number of priorities, including (but not limited
to) location and mapping the country’s peatlands; determining
their ecological condition; taking proactive steps to conserve
the most pristine peatlands; and controlling the use of these
wetlands.
In conclusion, the authors recommend the following three top
priorities for addressing the negative impacts on South African
peatlands:
• A complete peatland inventory and status assessment
(determining their present ecological state);
• Enforcement of legal compliance, extension and control
in the use/exploitation, especially in the forest plantation
industry, agriculture and water supply to municipalities; and
• A disaster response protocol for peatlands in peril: prevent
and control peat fires as well as rewet degraded sites; arrest
erosion.
Wetlands
Aerial photograph for 8 February 2019 showing the burnt surface areas
of the desiccated peatland areas.
Thermal imagery for 8 February 2019 showing the sub-surface fire areas
of the desiccated peatland areas.
Thermal imagery for 5 March 2019 showing the sub-surface fire areas of
the desiccated peatland areas as the sub-surface fire intensifies.
Thermal imagery for 18 March 2019 showing the sub-surface fire areas of
the desiccated peatland areas with 2 major intense fronts.
Thermal imagery for 18 March 2019 showing the sub-surface fire areas of
the desiccated peatland areas with some intense hots spots.
All images supplied
BACK TO TOP
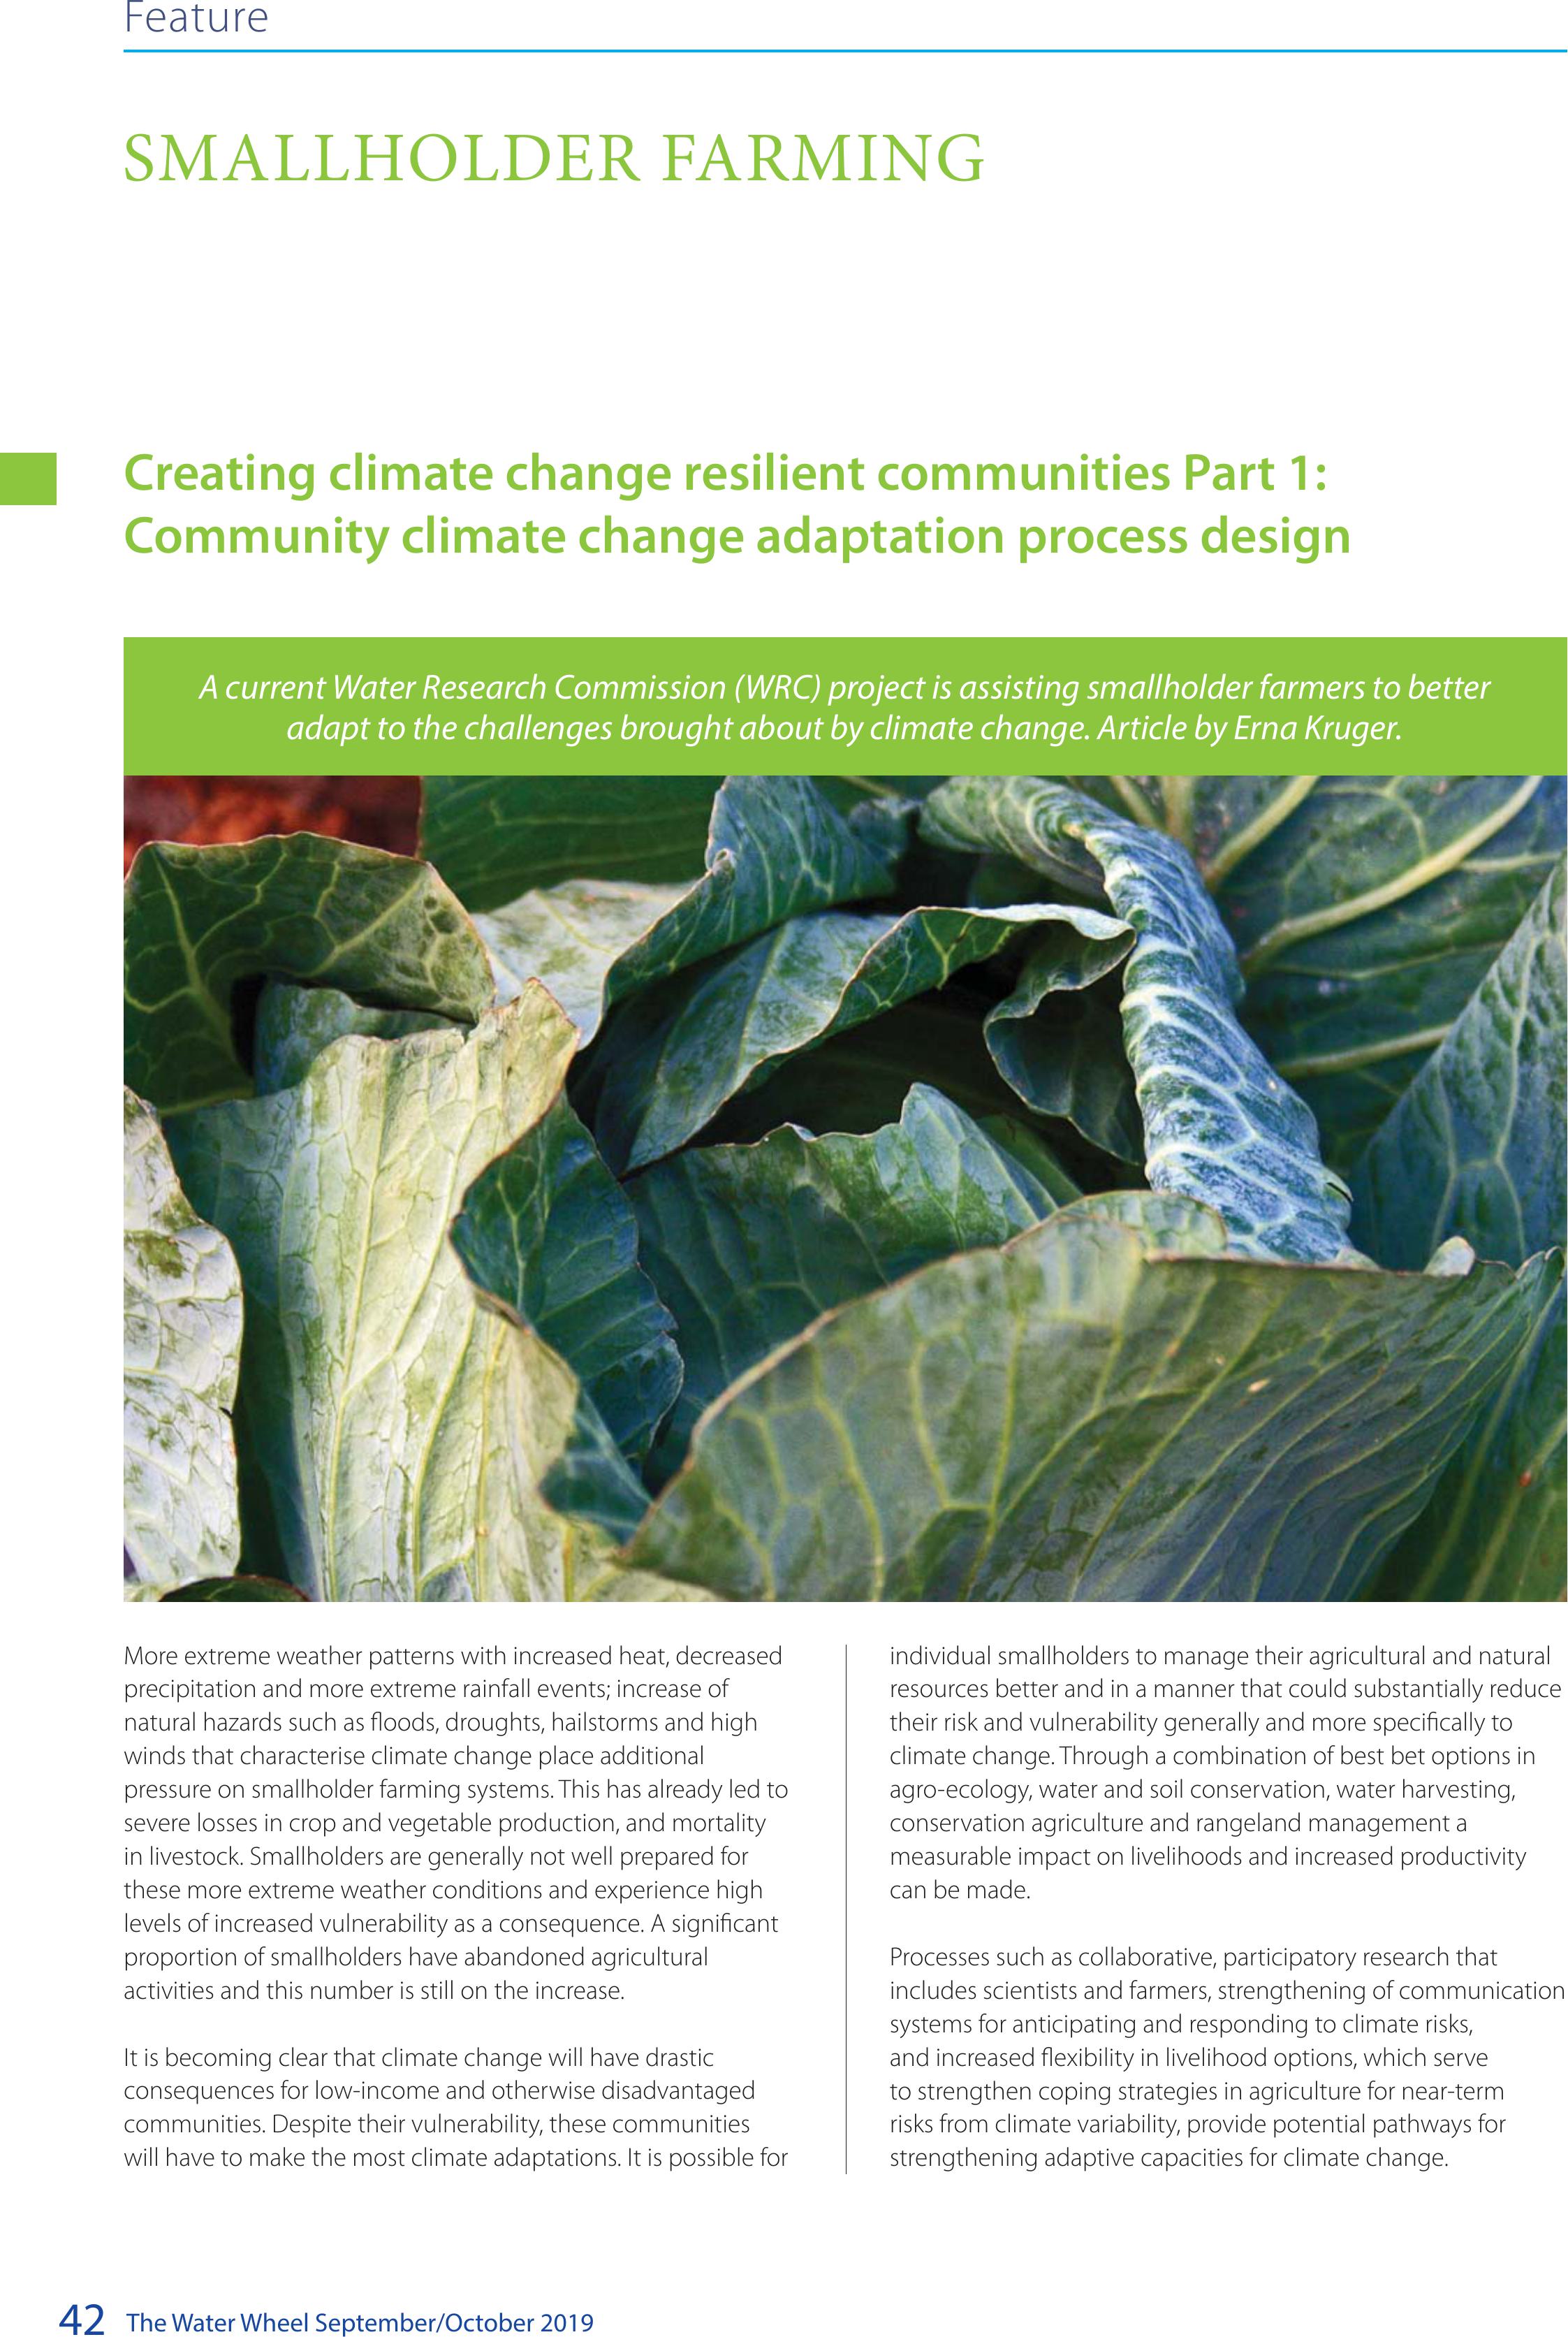
The Water Wheel September/October 2019
42
Feature
SMALLHOLDER FARMING
More extreme weather patterns with increased heat, decreased
precipitation and more extreme rainfall events; increase of
natural hazards such as floods, droughts, hailstorms and high
winds that characterise climate change place additional
pressure on smallholder farming systems. This has already led to
severe losses in crop and vegetable production, and mortality
in livestock. Smallholders are generally not well prepared for
these more extreme weather conditions and experience high
levels of increased vulnerability as a consequence. A significant
proportion of smallholders have abandoned agricultural
activities and this number is still on the increase.
It is becoming clear that climate change will have drastic
consequences for low-income and otherwise disadvantaged
communities. Despite their vulnerability, these communities
will have to make the most climate adaptations. It is possible for
individual smallholders to manage their agricultural and natural
resources better and in a manner that could substantially reduce
their risk and vulnerability generally and more specifically to
climate change. Through a combination of best bet options in
agro-ecology, water and soil conservation, water harvesting,
conservation agriculture and rangeland management a
measurable impact on livelihoods and increased productivity
can be made.
Processes such as collaborative, participatory research that
includes scientists and farmers, strengthening of communication
systems for anticipating and responding to climate risks,
and increased flexibility in livelihood options, which serve
to strengthen coping strategies in agriculture for near-term
risks from climate variability, provide potential pathways for
strengthening adaptive capacities for climate change.
Creating climate change resilient communities Part 1:
Community climate change adaptation process design
A current Water Research Commission (WRC) project is assisting smallholder farmers to better
adapt to the challenges brought about by climate change. Article by Erna Kruger.
BACK TO TOP

The Water Wheel September/October 201943
Mahlathini Development Foundation, its partners and
collaborators (including universities, non-government
organisation, corporate social investment initiatives, district and
local municipalities and government departments), have been
working within the socio-ecological and social learning space to
assist smallholder farmers in KwaZulu-Natal, Limpopo and the
Eastern Cape to improve their resilience and adaptive capacity
to climate change by designing and testing a participatory
smallholder level decision support system for implementing
climate resilient agricultural practices.
Within this process smallholder farmers explore and analyse
their understanding of climate change and the impacts of
these changes on their livelihoods and agricultural systems.
They explore adaptive strategies and measures (local and
external), prioritise appropriate practices for individual and group
experimentation and implementation, assess the impact of
these new practices and processes on their livelihoods and re-
plan their actions and interventions on a cyclical basis.
This allows them to make incremental changes over time in
soil and water management practices, cropping and livestock
management and natural resources management, within the
limits of their own resources, vision and motivation. This provides
a viable model for CCA implementation and financing at
smallholder level.
Recent participatory impact assessments have shown
remarkable improvements in resilience in the space of just one
to two years of focussed local action.
The WRC-funded adaptive research process entitled
‘Collaborative knowledge creation and mediation strategies
for the dissemination of water and soil conservation practices
and climate smart agriculture in smallholder farming systems’ is
exploring best practice options for climate resilient agriculture
for smallholders. The project is also evaluating the impact of
implementation of a range of these practices on the resilience of
agriculture-based livelihoods.
Alongside this, a decision support methodology and system
has been designed to assist smallholders and the facilitators
who support them to make informed and appropriate decisions
about choices of a ‘basket of options’ for implementation at a
local level.
The research process is broadly divided into three elements
for purposes of clarity, although all three elements are tackled
concurrently:
• Community climate change adaptation process design
• Climate resilient agricultural practices and
• A decision support system
This article focuses on the design of the community level
process.
The community climate change adaptation process design
broadly comprises:
• Situation and vulnerability assessments; baselines and
farmer typologies
• Climate Change dialogues; Exploration of climate change
impacts, adaptive strategies and prioritisation of adaptive
measures and
• Participatory impact assessments: Resilience snapshots
(The vulnerability and participatory impact assessment
methodologies will be discussed in two follow-up articles)
Climate change dialogues
A participatory methodology has been developed to allow
groups of farmers to explore the impacts of climate change,
potential adaptive strategies and to prioritise local adaptation
measures. Seven community level workshops have been
conducted across three provinces, involving around 250
participants. Table 1 provides a summary of this community level
analysis.
Smallholder farming
Climate change impacts on livelihoods and farming
KwaZulu-NatalEastern CapeLimpopo
WaterLess water in the landscape; streams
and springs dry up, borehole run dry,
soils dry out quickly after rain
Less water in the landscape; streams
and springs dry up, borehole run dry,
soils dry out quickly after rain
Less water in the landscape; streams and springs dry
up, borehole run dry, soils dry out quickly after rain
Dams dry upDams dry upDams dry up
Municipal water supply becoming
more unreliable
Municipal water supply becoming
more unreliable
Municipal water supply becoming more unreliable
Need to buy water for household use – now
sometimes for more than 6 months of the year
RWH storage only enough for household use.
SoilMore erosionMore erosionMore erosion
Soils becoming more compacted and
infertile
Soils becoming more compacted and
infertile
Soils becoming more compacted and infertile
Soils too hot to sustain plant growth
CroppingTiming for planting has changed- laterTiming for planting has changed- laterCan no longer plant dryland maize
All cropping now requires irrigation – even crops such
as sweet potato
BACK TO TOP
The Water Wheel September/October 2019
44
Although the impacts discussed were similar across the three provinces, the severity of these changes are a lot more obvious in Limpopo.
From these impact diagrams community members discuss adaptive measures and strategies; what they have already tried and what
they would like to try. Here the new ideas or innovations can then be introduced by facilitators, as they are requested by the community
members. Table 2 is illustrative and includes the adaptive measures suggested by the participants in Turkey village (Lower Oliphant’s’ Basin
– Limpopo).
Smallholder farming
Climate change impacts on livelihoods and farming
KwaZulu-NatalEastern CapeLimpopo
CroppingDrought tolerant crops, such as sorghum and millet
grow, but severe bird damage
Heat damage to cropsHeat damage to cropsHeat damage to crops
Reduced germination and growthReduced germination and growthReduced germination and growth
Seeding of legumes becoming
unreliable
Seeding of legumes becoming
unreliable
Seeding of legumes becoming unreliable
Lower yieldsLower yieldsLower yields
Winter vegetables don’t do well – stress induced
bolting and lack of growth
More pests and diseasesMore pests and diseasesMore pests and diseases
Loss of indigenous seed stocksLoss of indigenous seed stocks
LivestockLess grazing; not enough to see cattle
through winter
Less grazing; not enough to see cattle
through winter
Less grazing; not enough to see cattle through winter
More disease in cattle and heat stress
symptoms
More disease in cattle and heat stress
symptoms
More disease in cattle and heat stress symptoms
Fewer calvesFewer calvesFewer calves
More deathsMore deathsMore deaths
Natural
resources
Fewer trees; too much cutting for
firewood
Fewer trees; too much cutting for
firewood
Fewer trees; too much cutting for firewood
Decrease in wild animals and
indigenous plants
Decrease in wild animals and
indigenous plants
Decrease in wild animals and indigenous plants
Increased crop damage from wild
animals such as birds and monkeys
Increased crop damage from wild
animals such as birds and monkeys
Increased crop damage from wild animals such as
birds and monkeys
Availability of indigenous vegetables
has decreased
No longer able to harvest any resources due to
scarcity
Increased population puts pressure on resources
SocialMore diseasesMore diseasesMore diseases
Increased poverty and hungerIncreased poverty and hungerIncreased poverty and hunger
Increased crime and reduced job
opportunities
Increased crime and reduced job
opportunities
Increased crime and reduced job opportunities
Increased food prices
Increased conflict
Inability to survive
Table 1: Summary of climate change impacts from community level workshops (2018)
Turkey CC workshop; December 2017
ImpactsDescription and linkagesOutcomesPotential adaptive measure
Reduced water
availability
Dams dry out, boreholes provide
less water, rivers dry out, less rain
Reduced production,
hunger, diseases, no
jobs, poverty, crime,
death
More boreholes, more dams, water management,
irrigation in evenings and early morning, mulching, trench
beds (keep moisture in and soil cool)
Drying of environmentSoils are hotter and drier, drought,
plants wilt, increased pests
Save plant residues for animals, buy fodder, control pests
on animals
Reduction of resourcesDeforestation, Fruit trees die,
livestock, wild animals die
Planting of trees after they have been cut down; make use
of paraffin stoves and electricity, government involvement
in solving the problem,
Extreme heatEarly fruiting, trees wiltPoor crop healthShade netting
Shortage of waterRivers dry out, municipal supply
only once per week. Boreholes dry
out
Lack of education
towards saving water
NGOs and government to assist
Trench beds, mulching, save water in dams, drip irrigation,
irrigate in evening, boreholes, greywater
BACK TO TOP
The Water Wheel September/October 201945
A list of specific practices is summarised from these discussions and categorised into the five climate resilient agriculture themes. An
example is given below of this process conducted for a learning group from Ezibomvini Village in Bergville, KwaZulu-Natal.
Table 3 outlines the practices and their categories.
Smallholder farming
Turkey CC workshop; December 2017
ImpactsDescription and linkagesOutcomesPotential adaptive measure
Reduction of resourcesLess grazing, seed shortage, trees
are removed, indigenous animals
are no longer there
Increased vulnerability
of the people, forced to
move to urban areas
Donations for/of seed
Rather use paraffin stoves than firewood. Only chop
down mature trees to allow others to grow, planting trees,
government intervention
Taking care of indigenous plants
Plant fodder for livestock
SoilsPoor cultivation practices, soil
erosion, dry soils, sandy soils
Using crop residues and manure, conservation agriculture,
mixed cropping
Social repercussionsLess or no food, health problems,
no jobs
Burning of buses,
divorce, separation of
families, poverty, crime
Getting access to health care, parents must work
Shortage of implementsSetting up cooperatives for government support, use
animal drawn traction- oxen and donkeys, improvise,
make our own tools, make use of hand hoes
Table 2: An example of potential adaptive measures from the Turkey (Limpopo) climate change dialogue process
Natural RMSoilWaterCropsLivestock
Shade Cloth Tunnels
Bed design
Mulching
Natural pest and diseases
Rainwater harvesting
Trench bed
Composting
Conservation Agriculture
Fodder crops
Underground water tank
Mixed cropping
Conservation of wetlands and streams
Burying of disposable pampers
Reducing burning of grazing veld
Greywater use
Table 3: Suggested practices for farmers, categorised into the 5 primary themes
Participants then prioritise these practices in order of importance
for implementation and change as a group. This depends on
local conditions such as drought, harsh weather conditions and
the like.
The preference ranking for this group was as follows:
1. Underground rainwater harvesting tanks
2. Shade cloth tunnels
3. Trench beds
4. Mulching
5. Natural pest and disease control
6. Mixed cropping (fields and gardens)
7. Compost
8. Fodder crops
9. Conserving wetlands and streams
It is also possible here to do a matrix ranking exercise where
you elucidate from the groups their criteria for prioritisation of
practices, which is a very important step in the community-level
decision making process.
This provides a broad action plan for implementation,
which is developed further into an individual farmer level
experimentation plan. Participants choose from these prioritised
practices which ones they will try out in their own homesteads
and devise a broad plan of how to intervene in the communal
activities such as conservation of wetlands. This process provides
a good agenda for securing external support from roleplayers
in the development sector (government departments,
municipalities, CSI- and NGO-funded projects).
In the next issue, we will explore all the CRA practices that have
been implemented by the communities to date and the impact
of these on their livelihoods.
BACK TO TOP
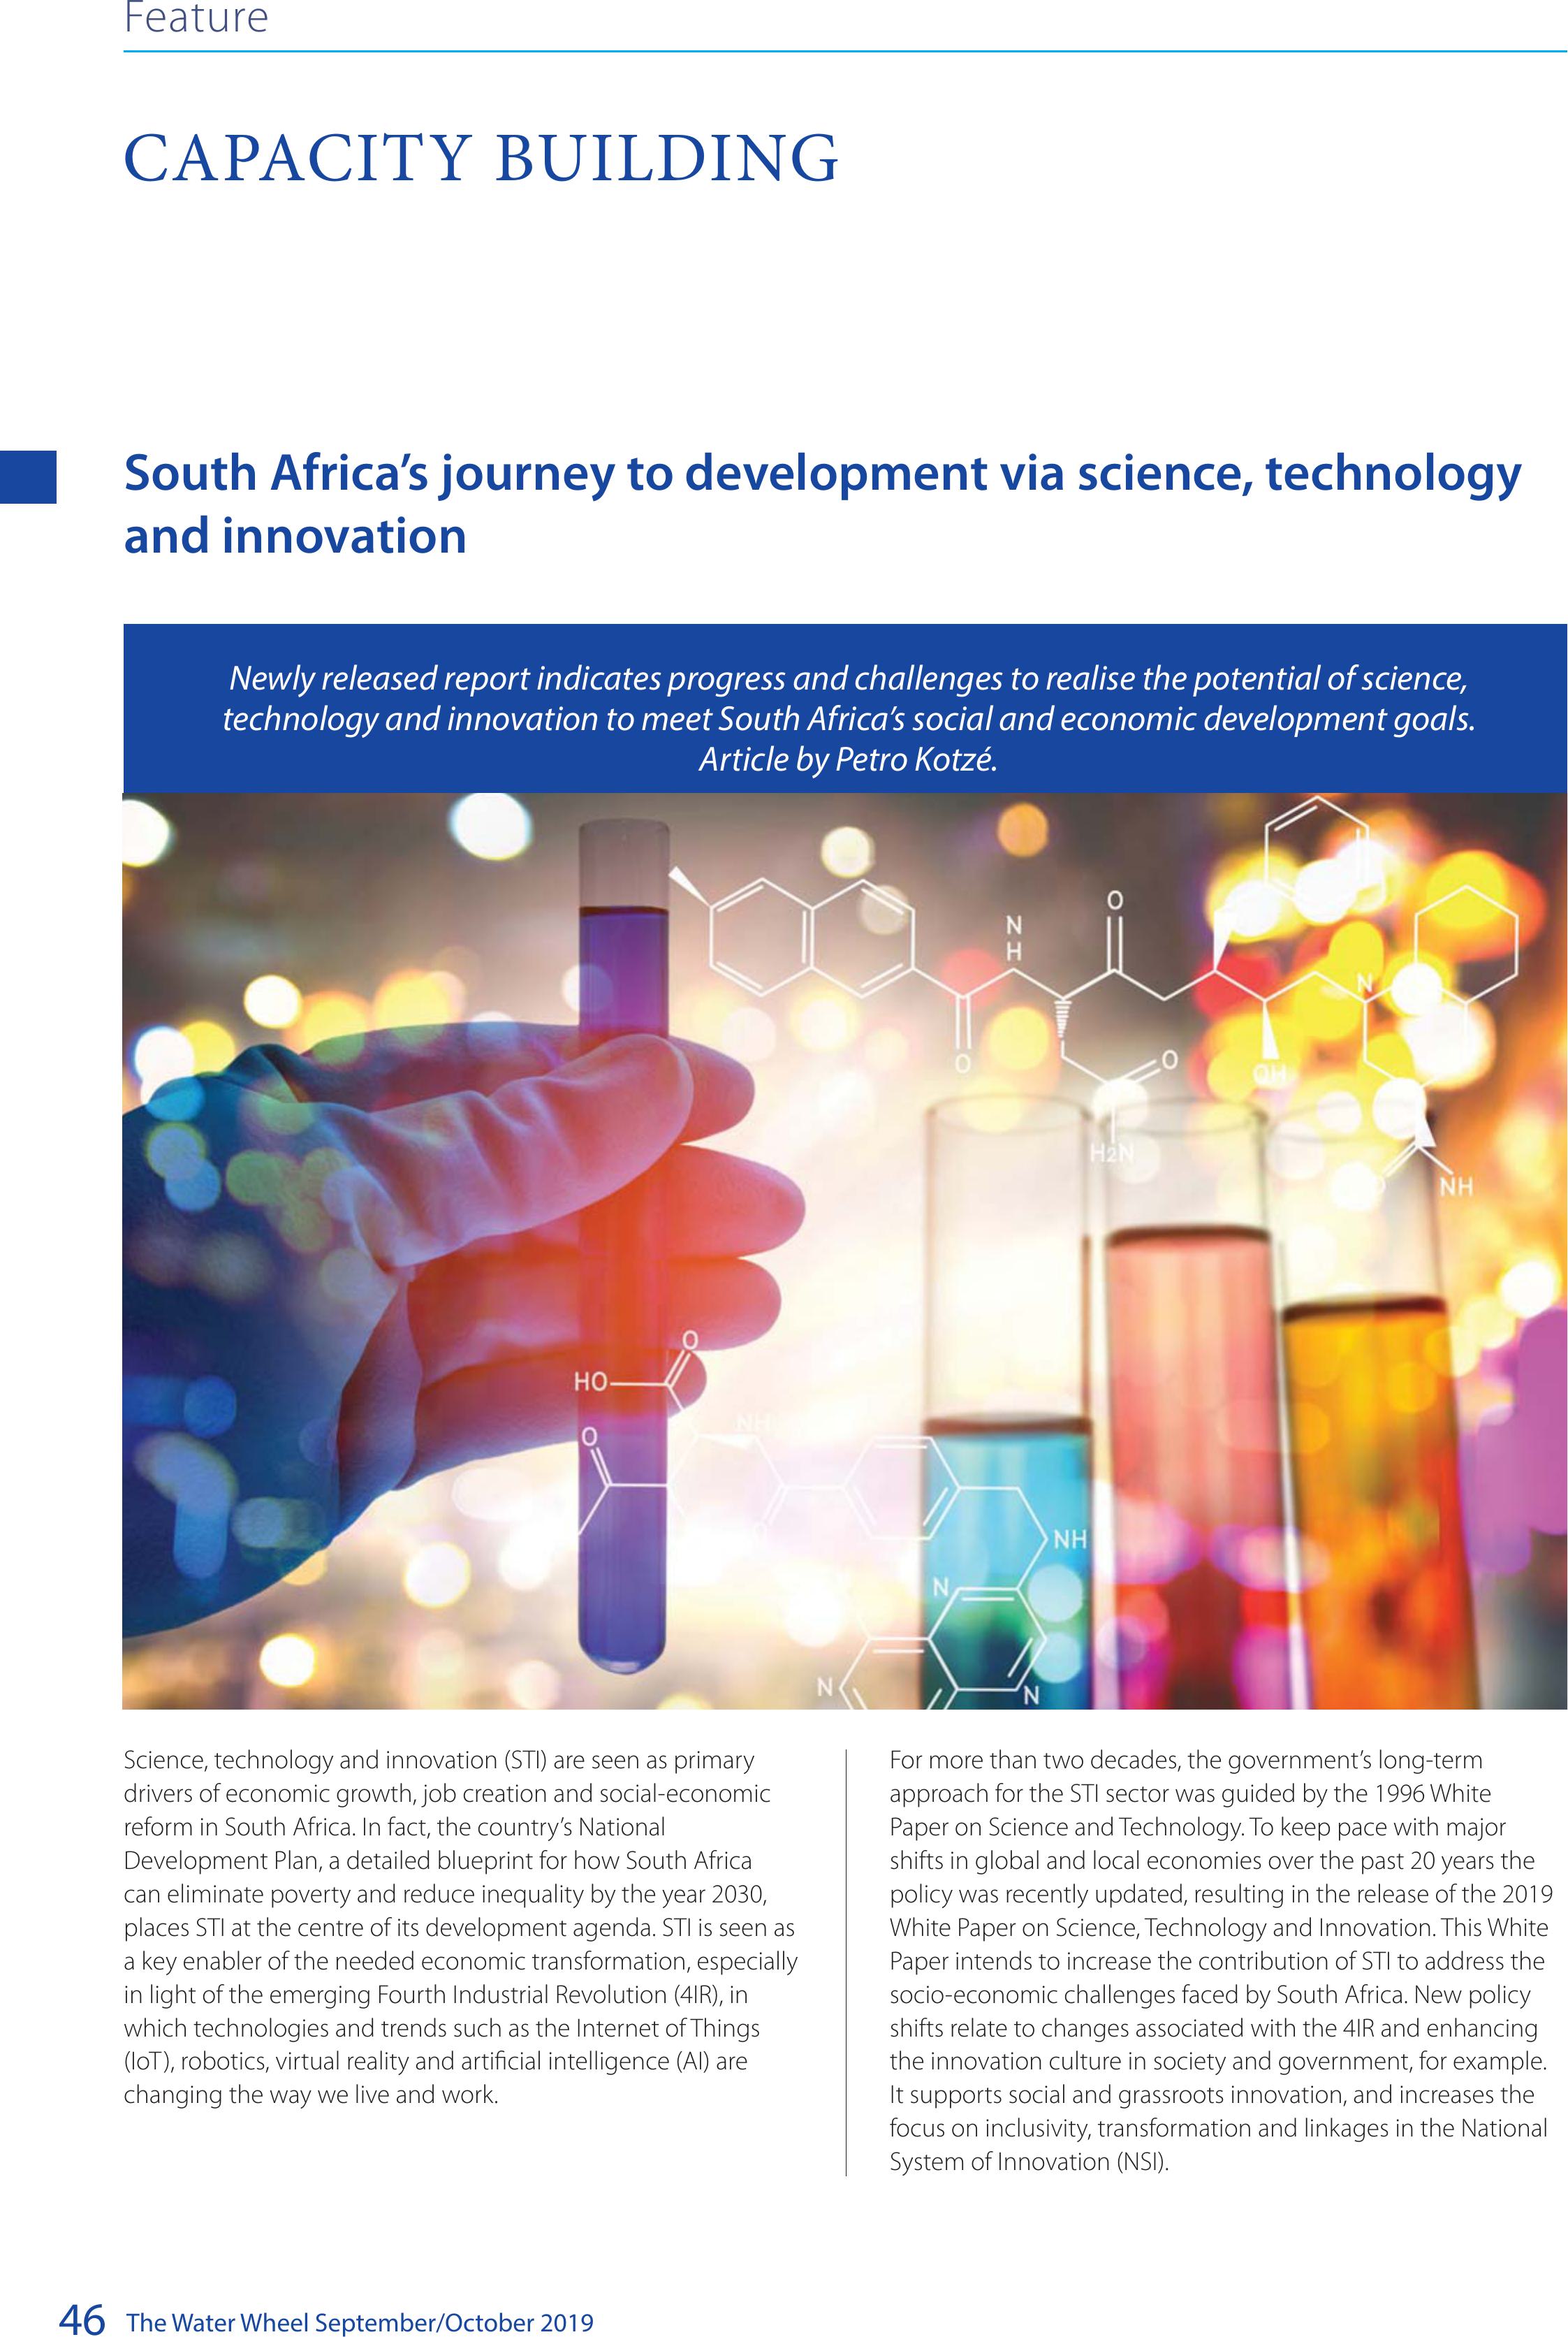
The Water Wheel September/October 2019
46
South Africa’s journey to development via science, technology
and innovation
Science, technology and innovation (STI) are seen as primary
drivers of economic growth, job creation and social-economic
reform in South Africa. In fact, the country’s National
Development Plan, a detailed blueprint for how South Africa
can eliminate poverty and reduce inequality by the year 2030,
places STI at the centre of its development agenda. STI is seen as
a key enabler of the needed economic transformation, especially
in light of the emerging Fourth Industrial Revolution (4IR), in
which technologies and trends such as the Internet of Things
(IoT), robotics, virtual reality and artificial intelligence (AI) are
changing the way we live and work.
For more than two decades, the government’s long-term
approach for the STI sector was guided by the 1996 White
Paper on Science and Technology. To keep pace with major
shifts in global and local economies over the past 20 years the
policy was recently updated, resulting in the release of the 2019
White Paper on Science, Technology and Innovation. This White
Paper intends to increase the contribution of STI to address the
socio-economic challenges faced by South Africa. New policy
shifts relate to changes associated with the 4IR and enhancing
the innovation culture in society and government, for example.
It supports social and grassroots innovation, and increases the
focus on inclusivity, transformation and linkages in the National
System of Innovation (NSI).
Newly released report indicates progress and challenges to realise the potential of science,
technology and innovation to meet South Africa’s social and economic development goals.
Article by Petro Kotzé.
CAPACITY BUILDING
Feature
BACK TO TOP
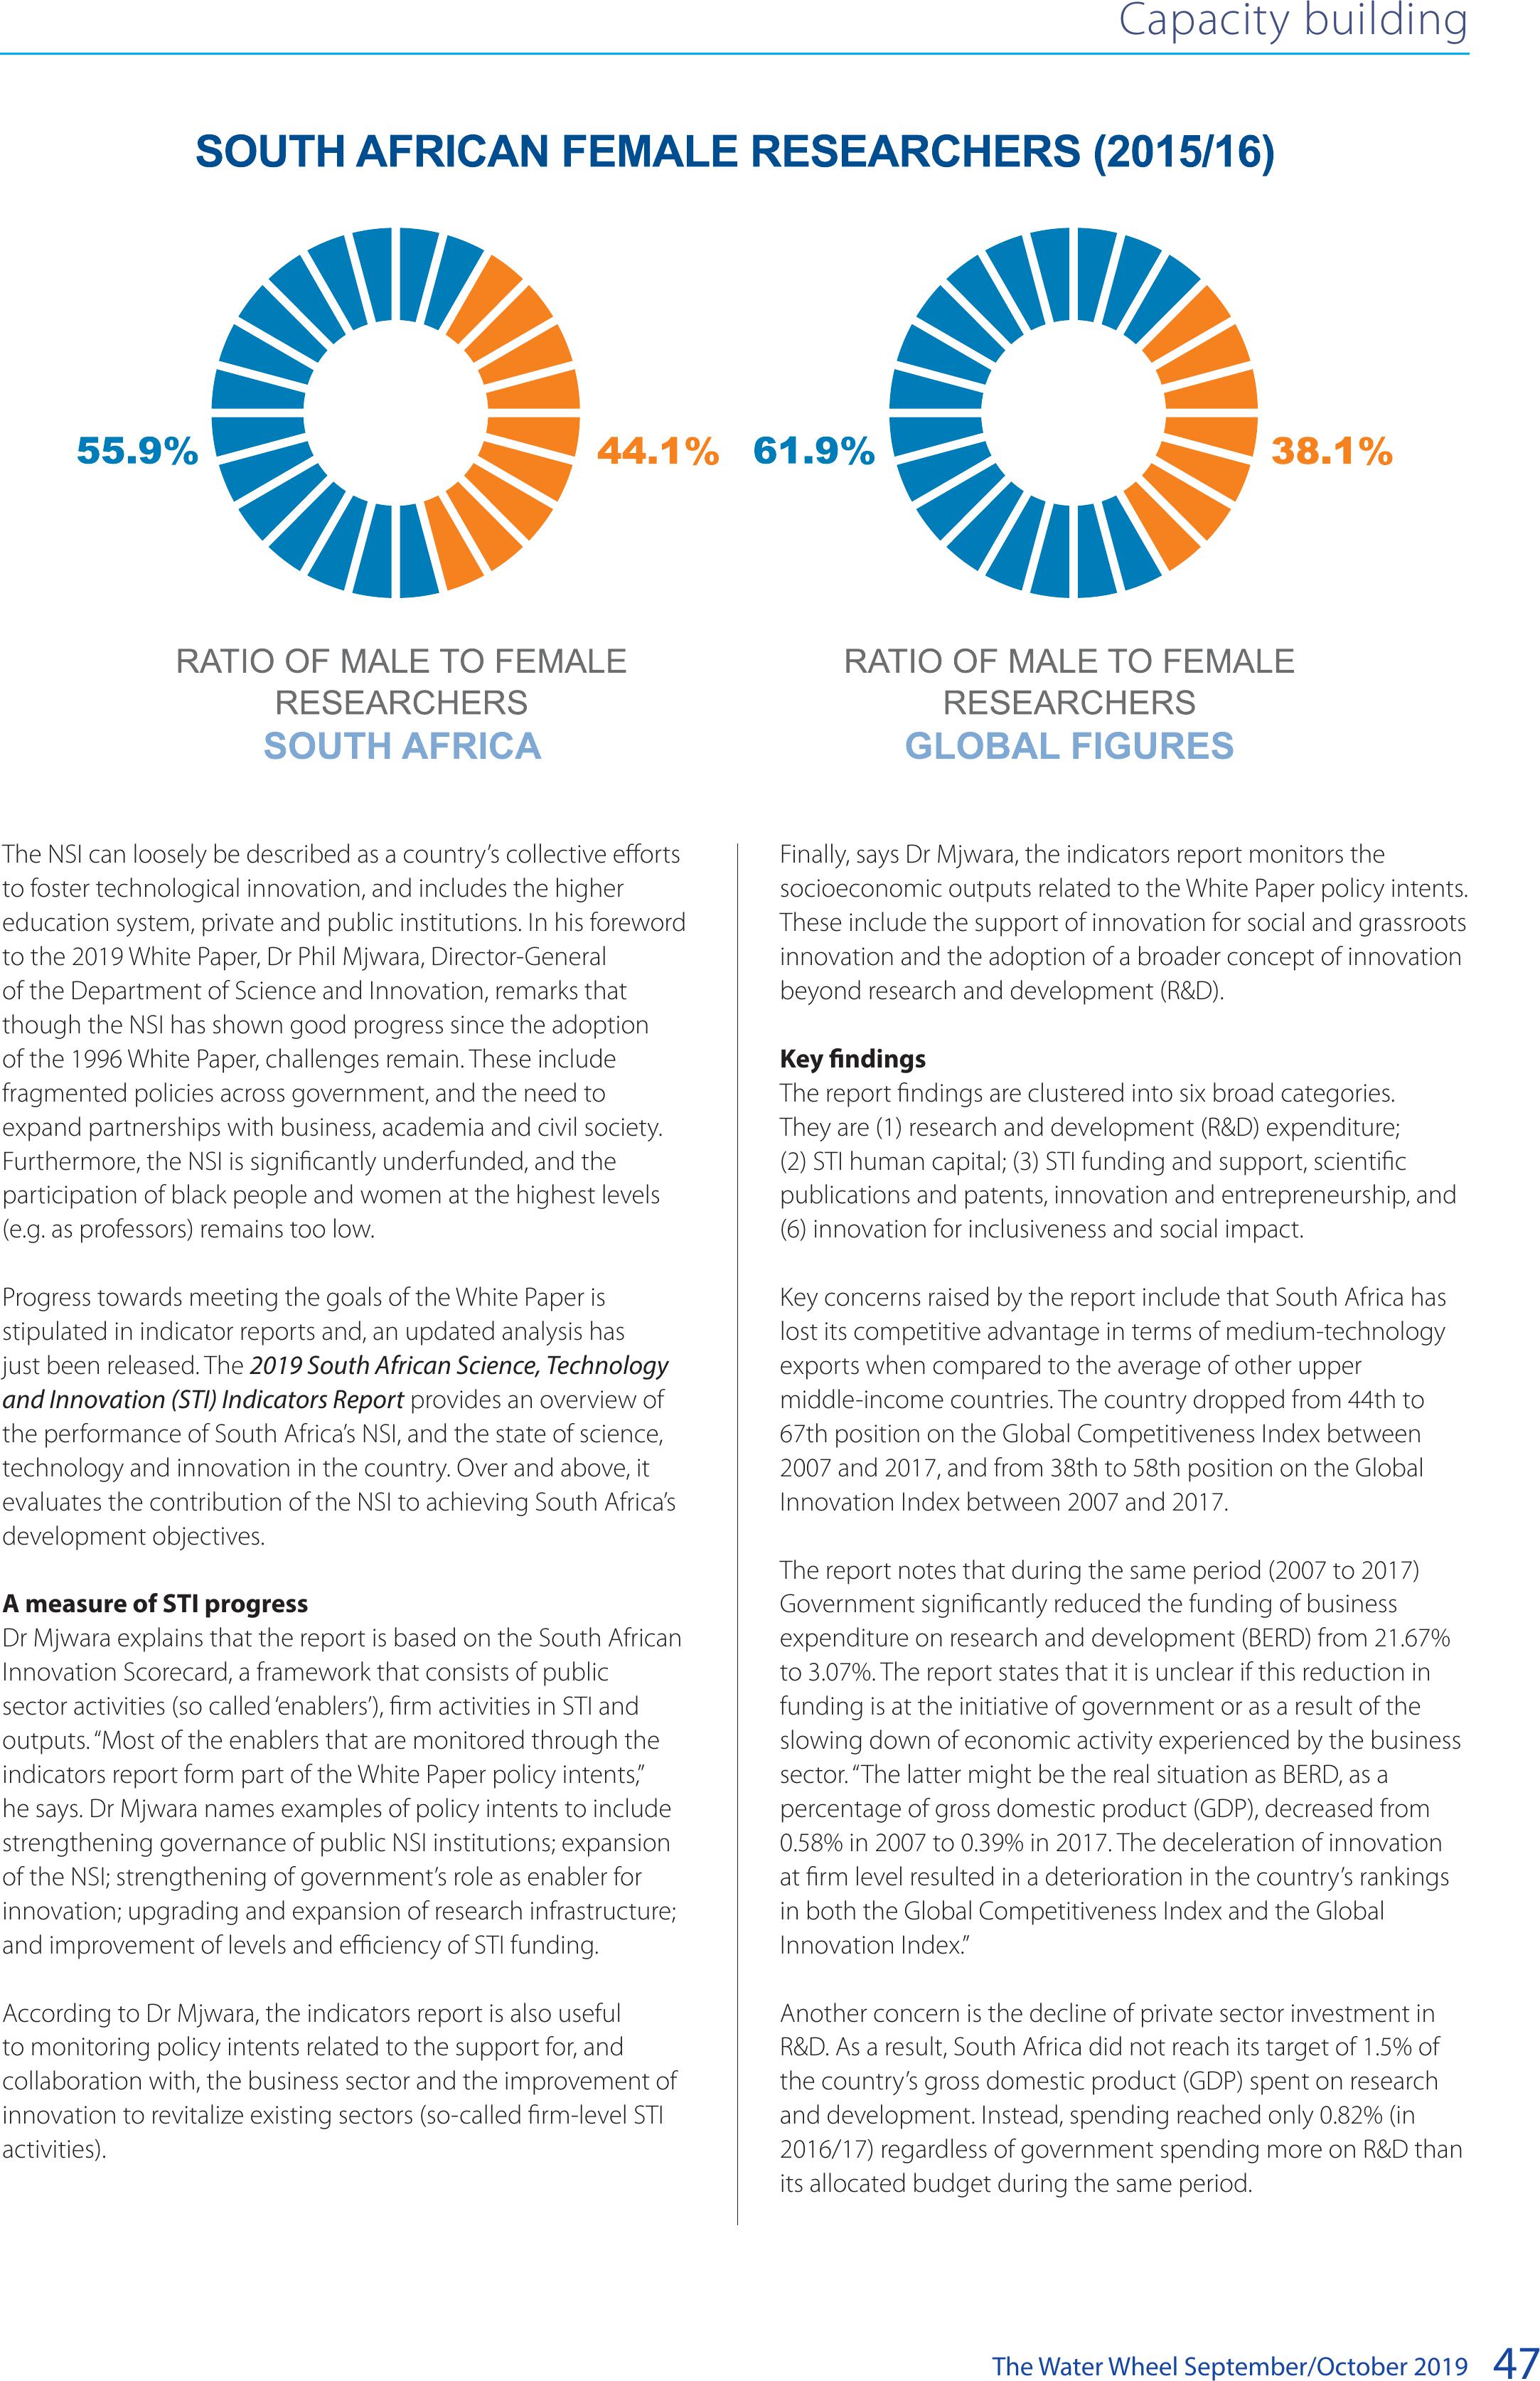
The Water Wheel September/October 201947
Finally, says Dr Mjwara, the indicators report monitors the
socioeconomic outputs related to the White Paper policy intents.
These include the support of innovation for social and grassroots
innovation and the adoption of a broader concept of innovation
beyond research and development (R&D).
Key findings
The report findings are clustered into six broad categories.
They are (1) research and development (R&D) expenditure;
(2) STI human capital; (3) STI funding and support, scientific
publications and patents, innovation and entrepreneurship, and
(6) innovation for inclusiveness and social impact.
Key concerns raised by the report include that South Africa has
lost its competitive advantage in terms of medium-technology
exports when compared to the average of other upper
middle-income countries. The country dropped from 44th to
67th position on the Global Competitiveness Index between
2007 and 2017, and from 38th to 58th position on the Global
Innovation Index between 2007 and 2017.
The report notes that during the same period (2007 to 2017)
Government significantly reduced the funding of business
expenditure on research and development (BERD) from 21.67%
to 3.07%. The report states that it is unclear if this reduction in
funding is at the initiative of government or as a result of the
slowing down of economic activity experienced by the business
sector. “The latter might be the real situation as BERD, as a
percentage of gross domestic product (GDP), decreased from
0.58% in 2007 to 0.39% in 2017. The deceleration of innovation
at firm level resulted in a deterioration in the country’s rankings
in both the Global Competitiveness Index and the Global
Innovation Index.”
Another concern is the decline of private sector investment in
R&D. As a result, South Africa did not reach its target of 1.5% of
the country’s gross domestic product (GDP) spent on research
and development. Instead, spending reached only 0.82% (in
2016/17) regardless of government spending more on R&D than
its allocated budget during the same period.
The NSI can loosely be described as a country’s collective efforts
to foster technological innovation, and includes the higher
education system, private and public institutions. In his foreword
to the 2019 White Paper, Dr Phil Mjwara, Director-General
of the Department of Science and Innovation, remarks that
though the NSI has shown good progress since the adoption
of the 1996 White Paper, challenges remain. These include
fragmented policies across government, and the need to
expand partnerships with business, academia and civil society.
Furthermore, the NSI is significantly underfunded, and the
participation of black people and women at the highest levels
(e.g. as professors) remains too low.
Progress towards meeting the goals of the White Paper is
stipulated in indicator reports and, an updated analysis has
just been released. The 2019 South African Science, Technology
and Innovation (STI) Indicators Report provides an overview of
the performance of South Africa’s NSI, and the state of science,
technology and innovation in the country. Over and above, it
evaluates the contribution of the NSI to achieving South Africa’s
development objectives.
A measure of STI progress
Dr Mjwara explains that the report is based on the South African
Innovation Scorecard, a framework that consists of public
sector activities (so called ‘enablers’), firm activities in STI and
outputs. “Most of the enablers that are monitored through the
indicators report form part of the White Paper policy intents,”
he says. Dr Mjwara names examples of policy intents to include
strengthening governance of public NSI institutions; expansion
of the NSI; strengthening of government’s role as enabler for
innovation; upgrading and expansion of research infrastructure;
and improvement of levels and efficiency of STI funding.
According to Dr Mjwara, the indicators report is also useful
to monitoring policy intents related to the support for, and
collaboration with, the business sector and the improvement of
innovation to revitalize existing sectors (so-called firm-level STI
activities).
Capacity building
BACK TO TOP
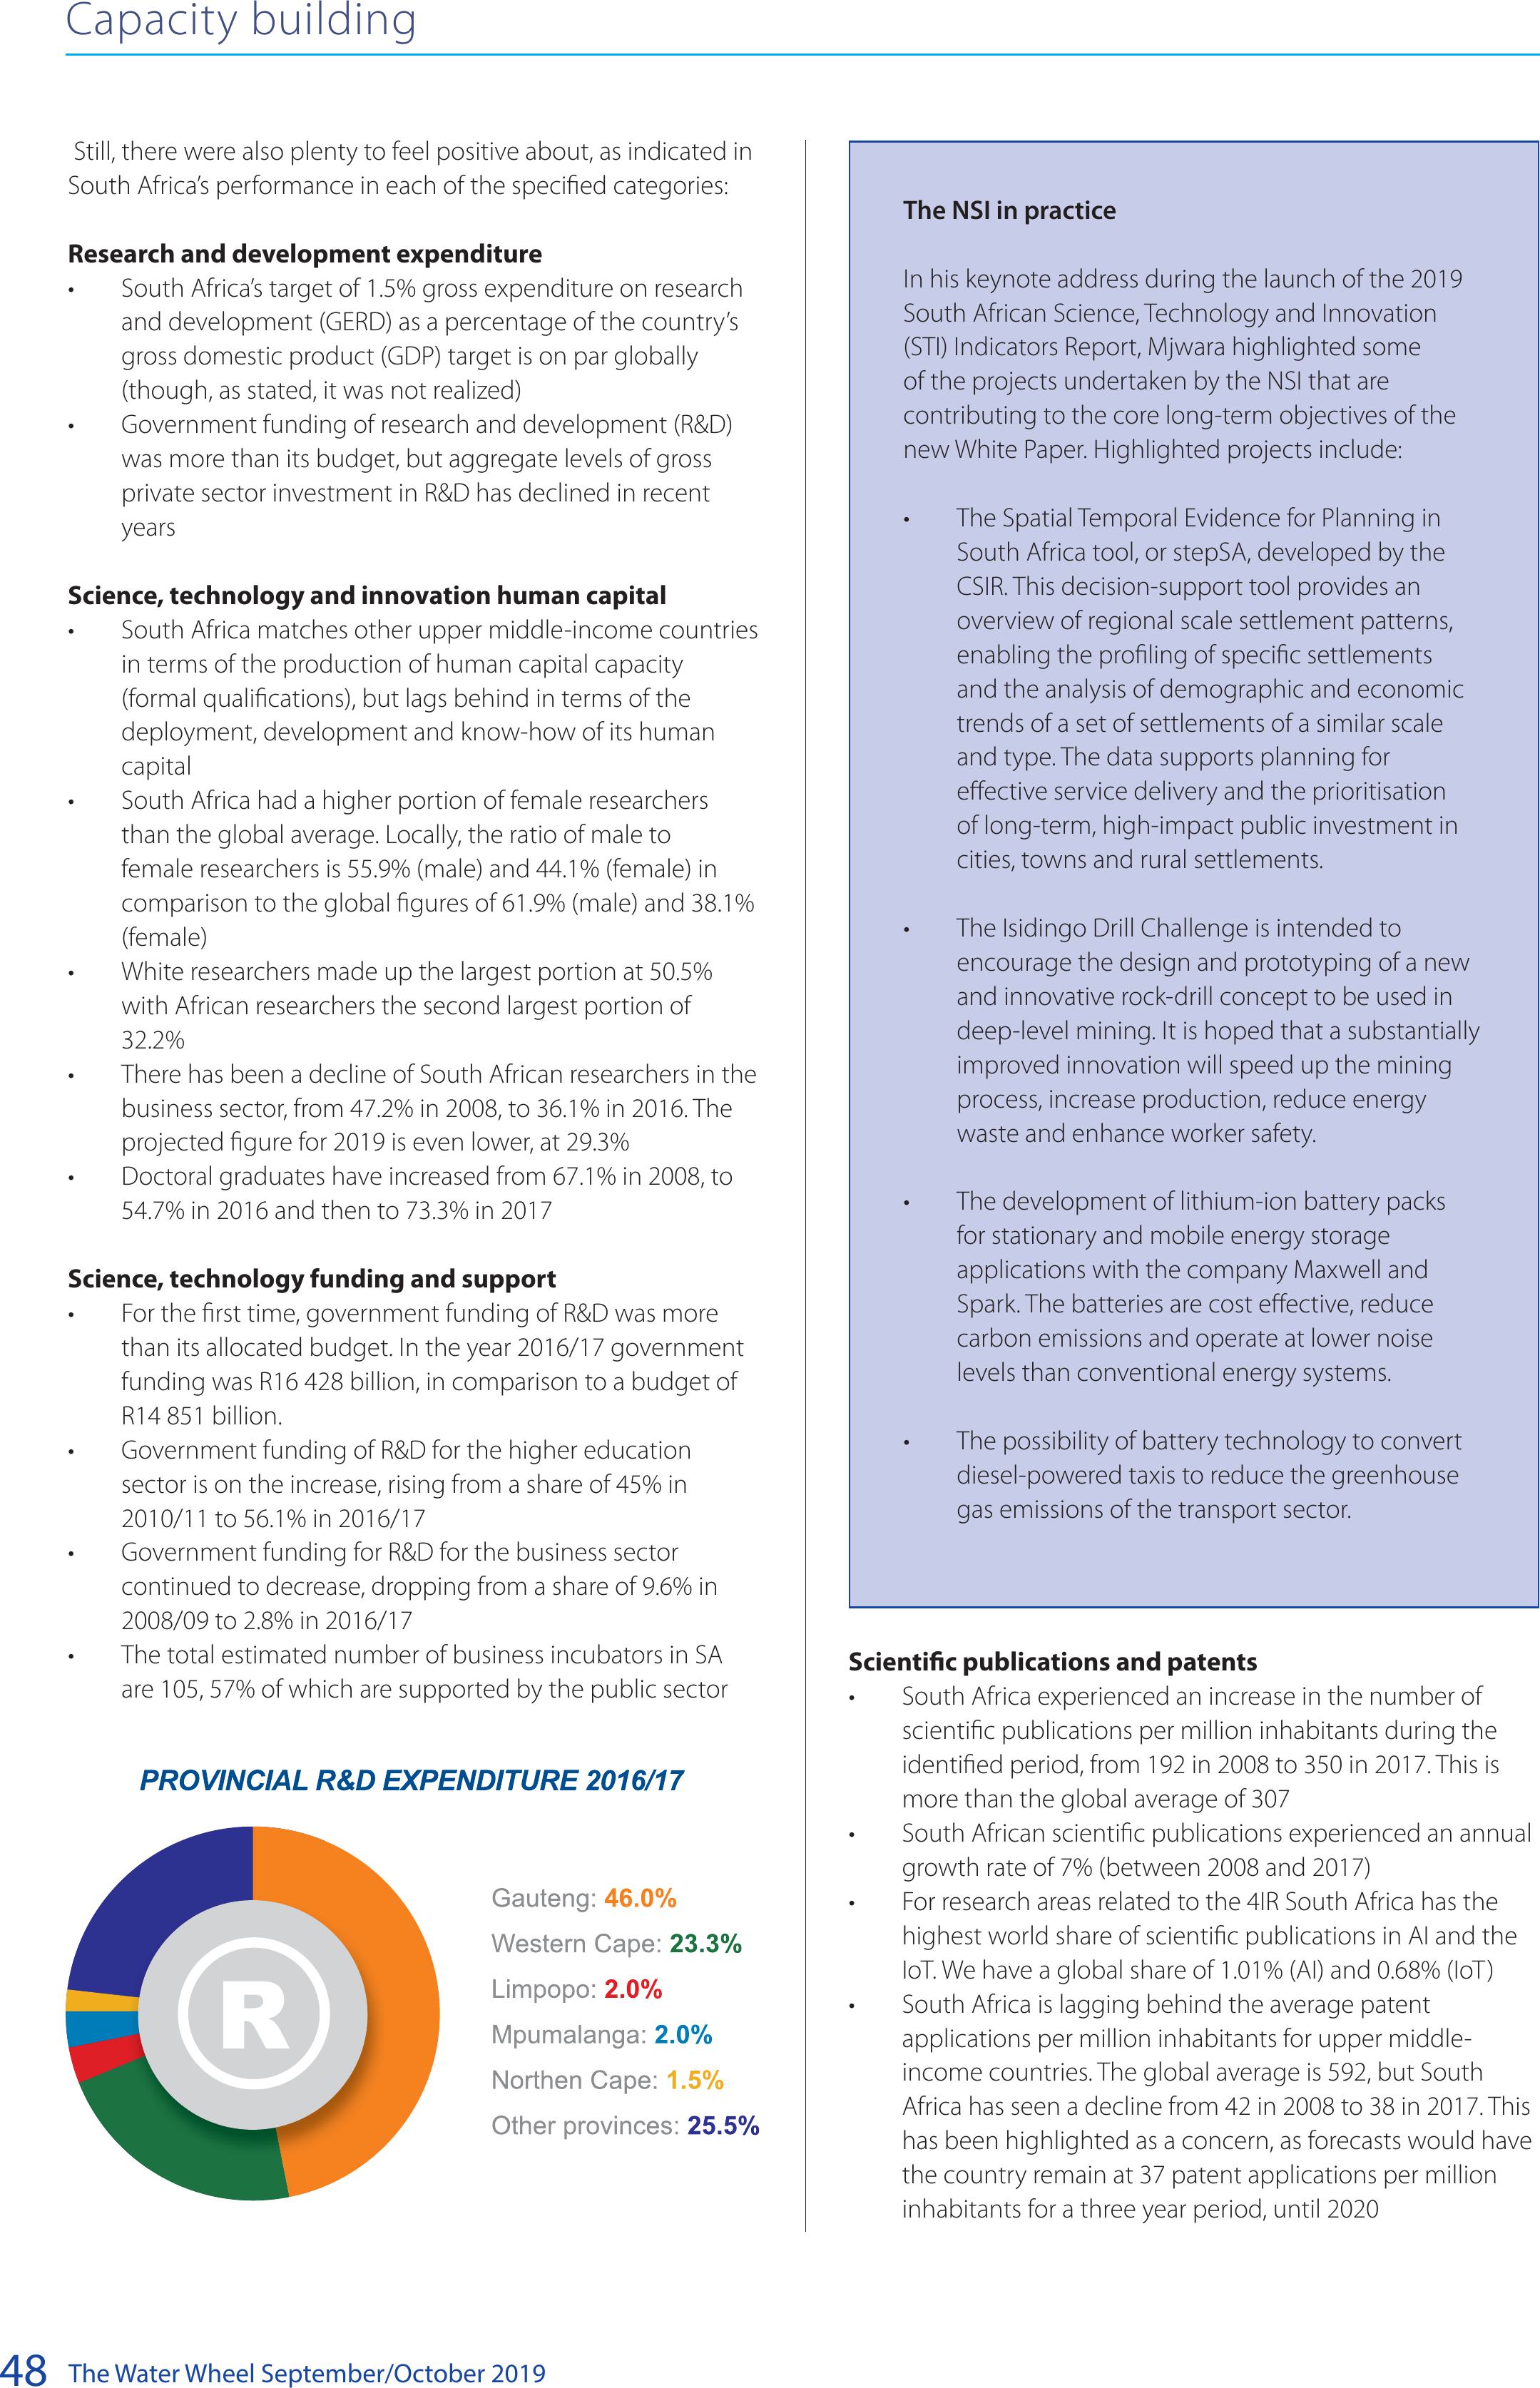
The Water Wheel September/October 2019
48
Capacity building
Still, there were also plenty to feel positive about, as indicated in
South Africa’s performance in each of the specified categories:
Research and development expenditure
• South Africa’s target of 1.5% gross expenditure on research
and development (GERD) as a percentage of the country’s
gross domestic product (GDP) target is on par globally
(though, as stated, it was not realized)
• Government funding of research and development (R&D)
was more than its budget, but aggregate levels of gross
private sector investment in R&D has declined in recent
years
Science, technology and innovation human capital
• South Africa matches other upper middle-income countries
in terms of the production of human capital capacity
(formal qualifications), but lags behind in terms of the
deployment, development and know-how of its human
capital
• South Africa had a higher portion of female researchers
than the global average. Locally, the ratio of male to
female researchers is 55.9% (male) and 44.1% (female) in
comparison to the global figures of 61.9% (male) and 38.1%
(female)
• White researchers made up the largest portion at 50.5%
with African researchers the second largest portion of
32.2%
• There has been a decline of South African researchers in the
business sector, from 47.2% in 2008, to 36.1% in 2016. The
projected figure for 2019 is even lower, at 29.3%
• Doctoral graduates have increased from 67.1% in 2008, to
54.7% in 2016 and then to 73.3% in 2017
Science, technology funding and support
• For the first time, government funding of R&D was more
than its allocated budget. In the year 2016/17 government
funding was R16 428 billion, in comparison to a budget of
R14 851 billion.
• Government funding of R&D for the higher education
sector is on the increase, rising from a share of 45% in
2010/11 to 56.1% in 2016/17
• Government funding for R&D for the business sector
continued to decrease, dropping from a share of 9.6% in
2008/09 to 2.8% in 2016/17
• The total estimated number of business incubators in SA
are 105, 57% of which are supported by the public sector
The NSI in practice
In his keynote address during the launch of the 2019
South African Science, Technology and Innovation
(STI) Indicators Report, Mjwara highlighted some
of the projects undertaken by the NSI that are
contributing to the core long-term objectives of the
new White Paper. Highlighted projects include:
• The Spatial Temporal Evidence for Planning in
South Africa tool, or stepSA, developed by the
CSIR. This decision-support tool provides an
overview of regional scale settlement patterns,
enabling the profiling of specific settlements
and the analysis of demographic and economic
trends of a set of settlements of a similar scale
and type. The data supports planning for
effective service delivery and the prioritisation
of long-term, high-impact public investment in
cities, towns and rural settlements.
• The Isidingo Drill Challenge is intended to
encourage the design and prototyping of a new
and innovative rock-drill concept to be used in
deep-level mining. It is hoped that a substantially
improved innovation will speed up the mining
process, increase production, reduce energy
waste and enhance worker safety.
• The development of lithium-ion battery packs
for stationary and mobile energy storage
applications with the company Maxwell and
Spark. The batteries are cost effective, reduce
carbon emissions and operate at lower noise
levels than conventional energy systems.
• The possibility of battery technology to convert
diesel-powered taxis to reduce the greenhouse
gas emissions of the transport sector.
Scientific publications and patents
• South Africa experienced an increase in the number of
scientific publications per million inhabitants during the
identified period, from 192 in 2008 to 350 in 2017. This is
more than the global average of 307
• South African scientific publications experienced an annual
growth rate of 7% (between 2008 and 2017)
• For research areas related to the 4IR South Africa has the
highest world share of scientific publications in AI and the
IoT. We have a global share of 1.01% (AI) and 0.68% (IoT)
• South Africa is lagging behind the average patent
applications per million inhabitants for upper middle-
income countries. The global average is 592, but South
Africa has seen a decline from 42 in 2008 to 38 in 2017. This
has been highlighted as a concern, as forecasts would have
the country remain at 37 patent applications per million
inhabitants for a three year period, until 2020
BACK TO TOP
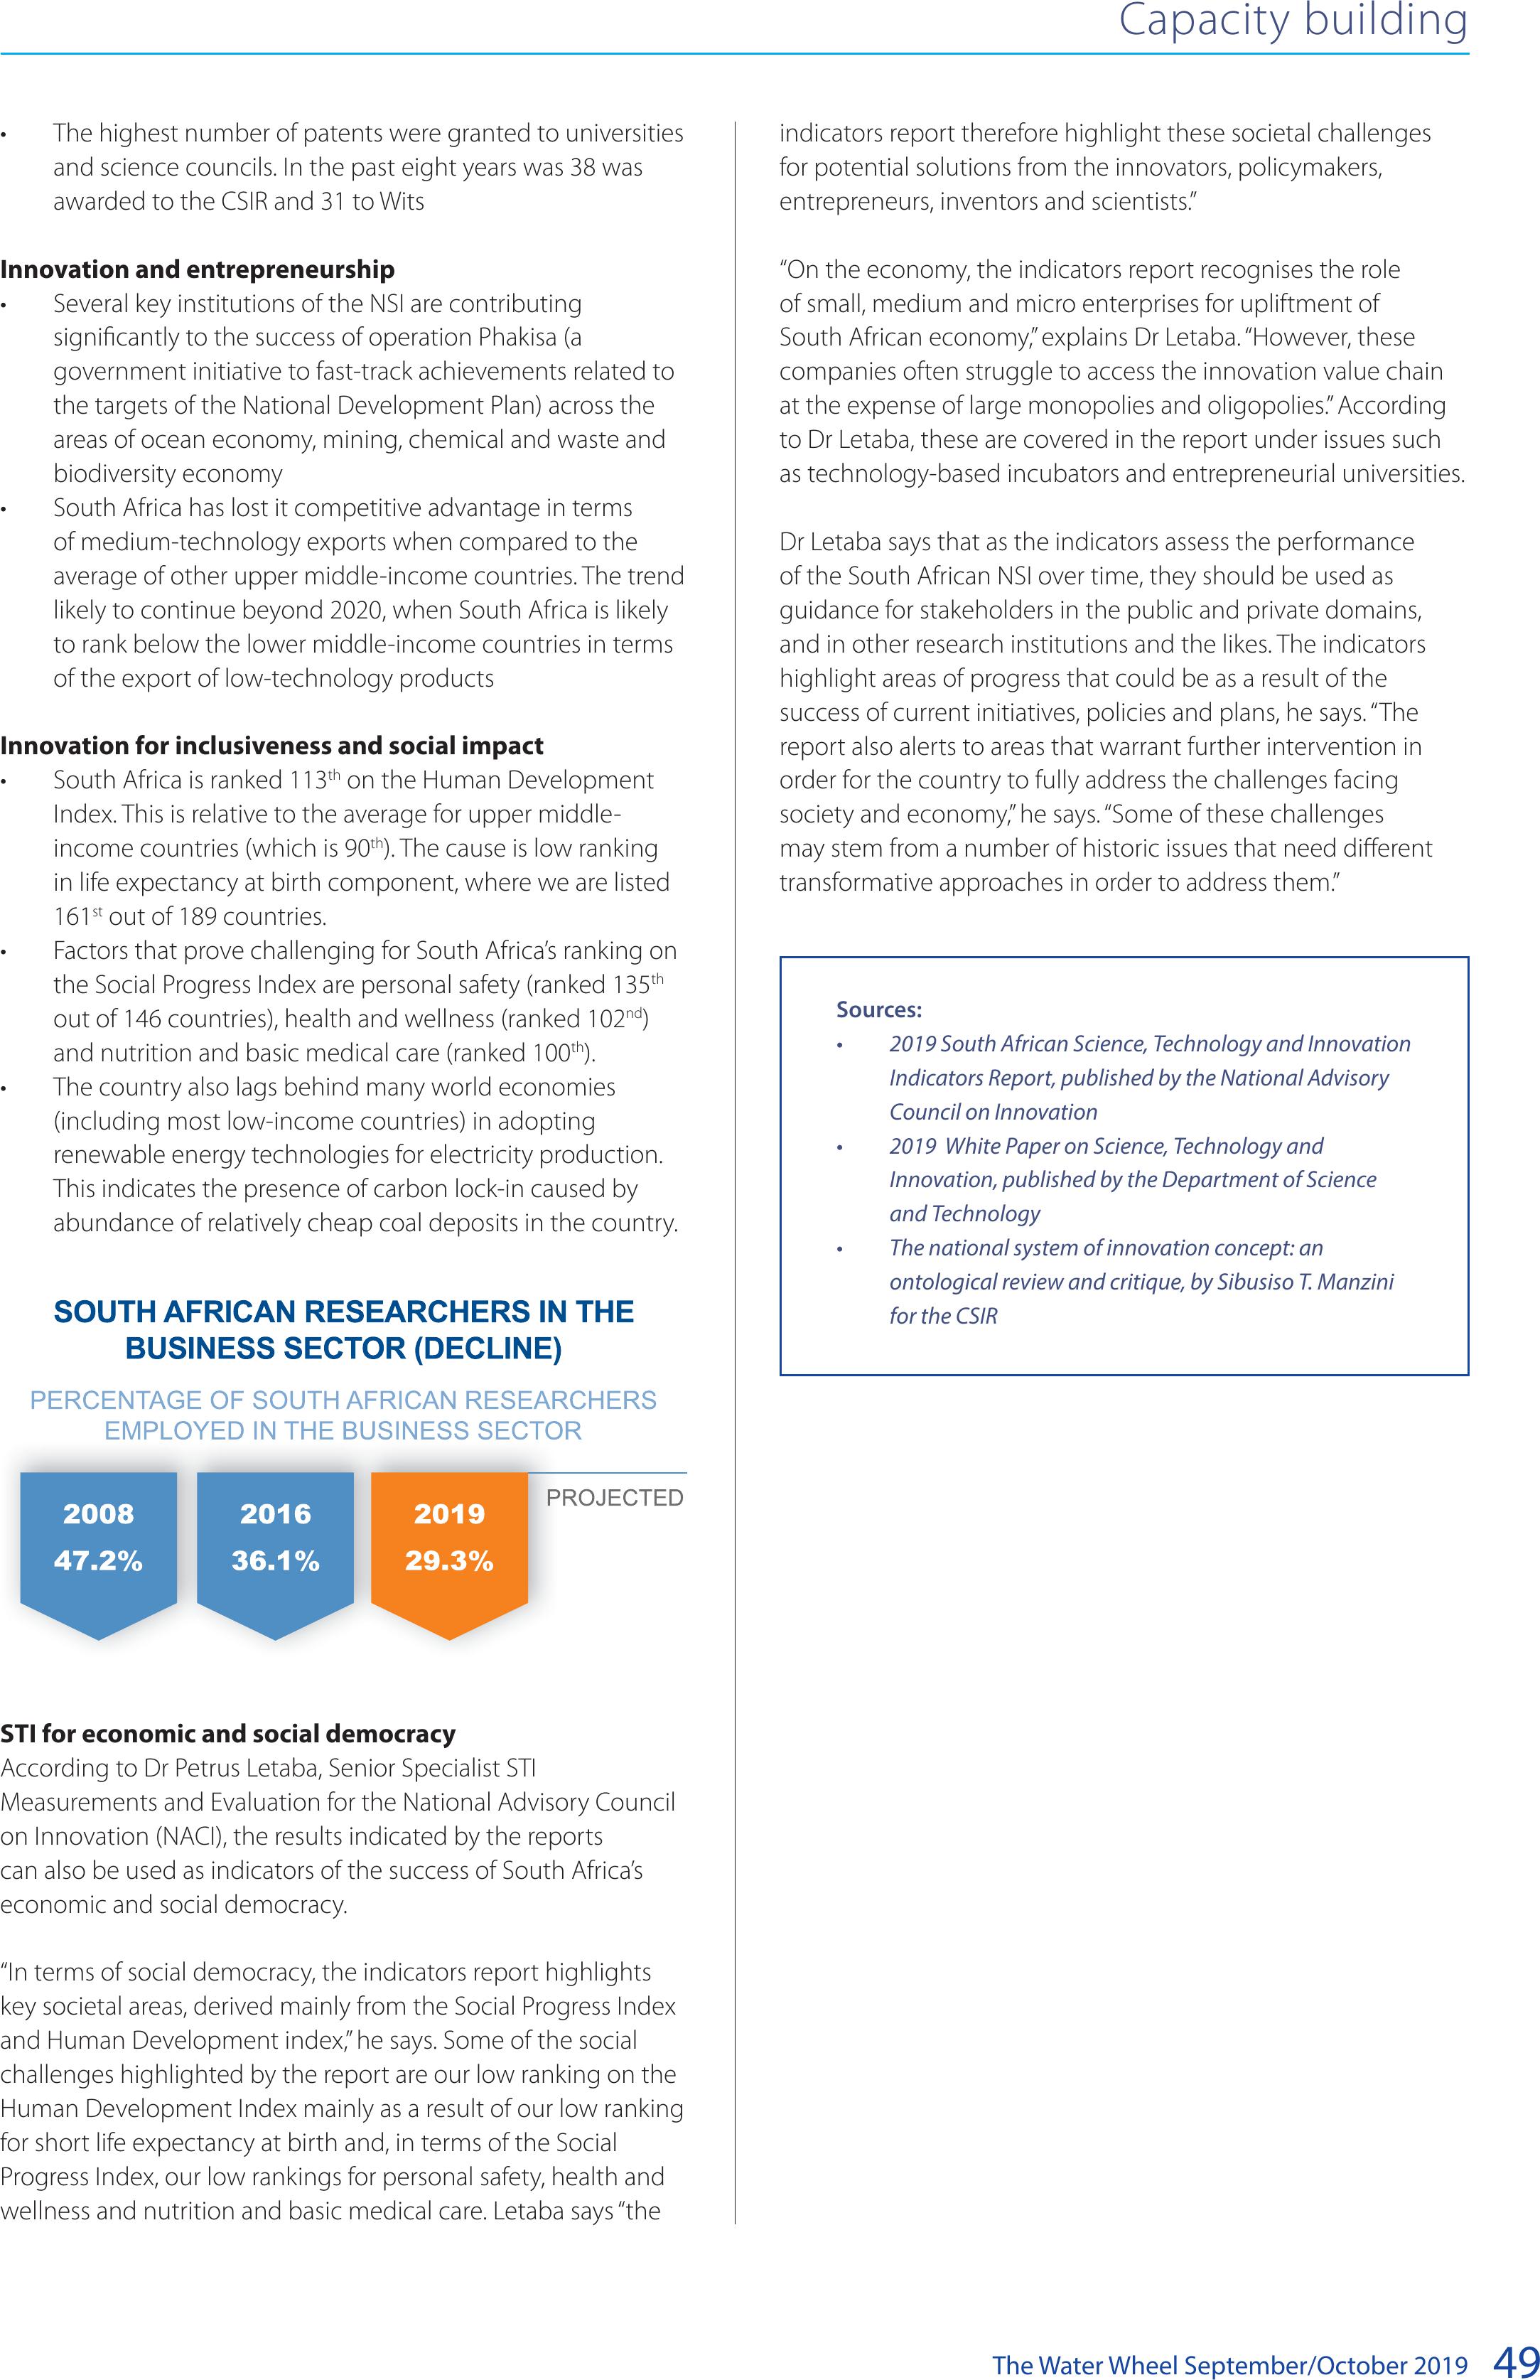
The Water Wheel September/October 201949
Capacity building
• The highest number of patents were granted to universities
and science councils. In the past eight years was 38 was
awarded to the CSIR and 31 to Wits
Innovation and entrepreneurship
• Several key institutions of the NSI are contributing
significantly to the success of operation Phakisa (a
government initiative to fast-track achievements related to
the targets of the National Development Plan) across the
areas of ocean economy, mining, chemical and waste and
biodiversity economy
• South Africa has lost it competitive advantage in terms
of medium-technology exports when compared to the
average of other upper middle-income countries. The trend
likely to continue beyond 2020, when South Africa is likely
to rank below the lower middle-income countries in terms
of the export of low-technology products
Innovation for inclusiveness and social impact
• South Africa is ranked 113th on the Human Development
Index. This is relative to the average for upper middle-
income countries (which is 90th). The cause is low ranking
in life expectancy at birth component, where we are listed
161st out of 189 countries.
• Factors that prove challenging for South Africa’s ranking on
the Social Progress Index are personal safety (ranked 135th
out of 146 countries), health and wellness (ranked 102nd)
and nutrition and basic medical care (ranked 100th).
• The country also lags behind many world economies
(including most low-income countries) in adopting
renewable energy technologies for electricity production.
This indicates the presence of carbon lock-in caused by
abundance of relatively cheap coal deposits in the country.
STI for economic and social democracy
According to Dr Petrus Letaba, Senior Specialist STI
Measurements and Evaluation for the National Advisory Council
on Innovation (NACI), the results indicated by the reports
can also be used as indicators of the success of South Africa’s
economic and social democracy.
“In terms of social democracy, the indicators report highlights
key societal areas, derived mainly from the Social Progress Index
and Human Development index,” he says. Some of the social
challenges highlighted by the report are our low ranking on the
Human Development Index mainly as a result of our low ranking
for short life expectancy at birth and, in terms of the Social
Progress Index, our low rankings for personal safety, health and
wellness and nutrition and basic medical care. Letaba says “the
indicators report therefore highlight these societal challenges
for potential solutions from the innovators, policymakers,
entrepreneurs, inventors and scientists.”
“On the economy, the indicators report recognises the role
of small, medium and micro enterprises for upliftment of
South African economy,” explains Dr Letaba. “However, these
companies often struggle to access the innovation value chain
at the expense of large monopolies and oligopolies.” According
to Dr Letaba, these are covered in the report under issues such
as technology-based incubators and entrepreneurial universities.
Dr Letaba says that as the indicators assess the performance
of the South African NSI over time, they should be used as
guidance for stakeholders in the public and private domains,
and in other research institutions and the likes. The indicators
highlight areas of progress that could be as a result of the
success of current initiatives, policies and plans, he says. “The
report also alerts to areas that warrant further intervention in
order for the country to fully address the challenges facing
society and economy,” he says. “Some of these challenges
may stem from a number of historic issues that need different
transformative approaches in order to address them.”
Sources:
• 2019 South African Science, Technology and Innovation
Indicators Report, published by the National Advisory
Council on Innovation
• 2019 White Paper on Science, Technology and
Innovation, published by the Department of Science
and Technology
• The national system of innovation concept: an
ontological review and critique, by Sibusiso T. Manzini
for the CSIR
BACK TO TOP
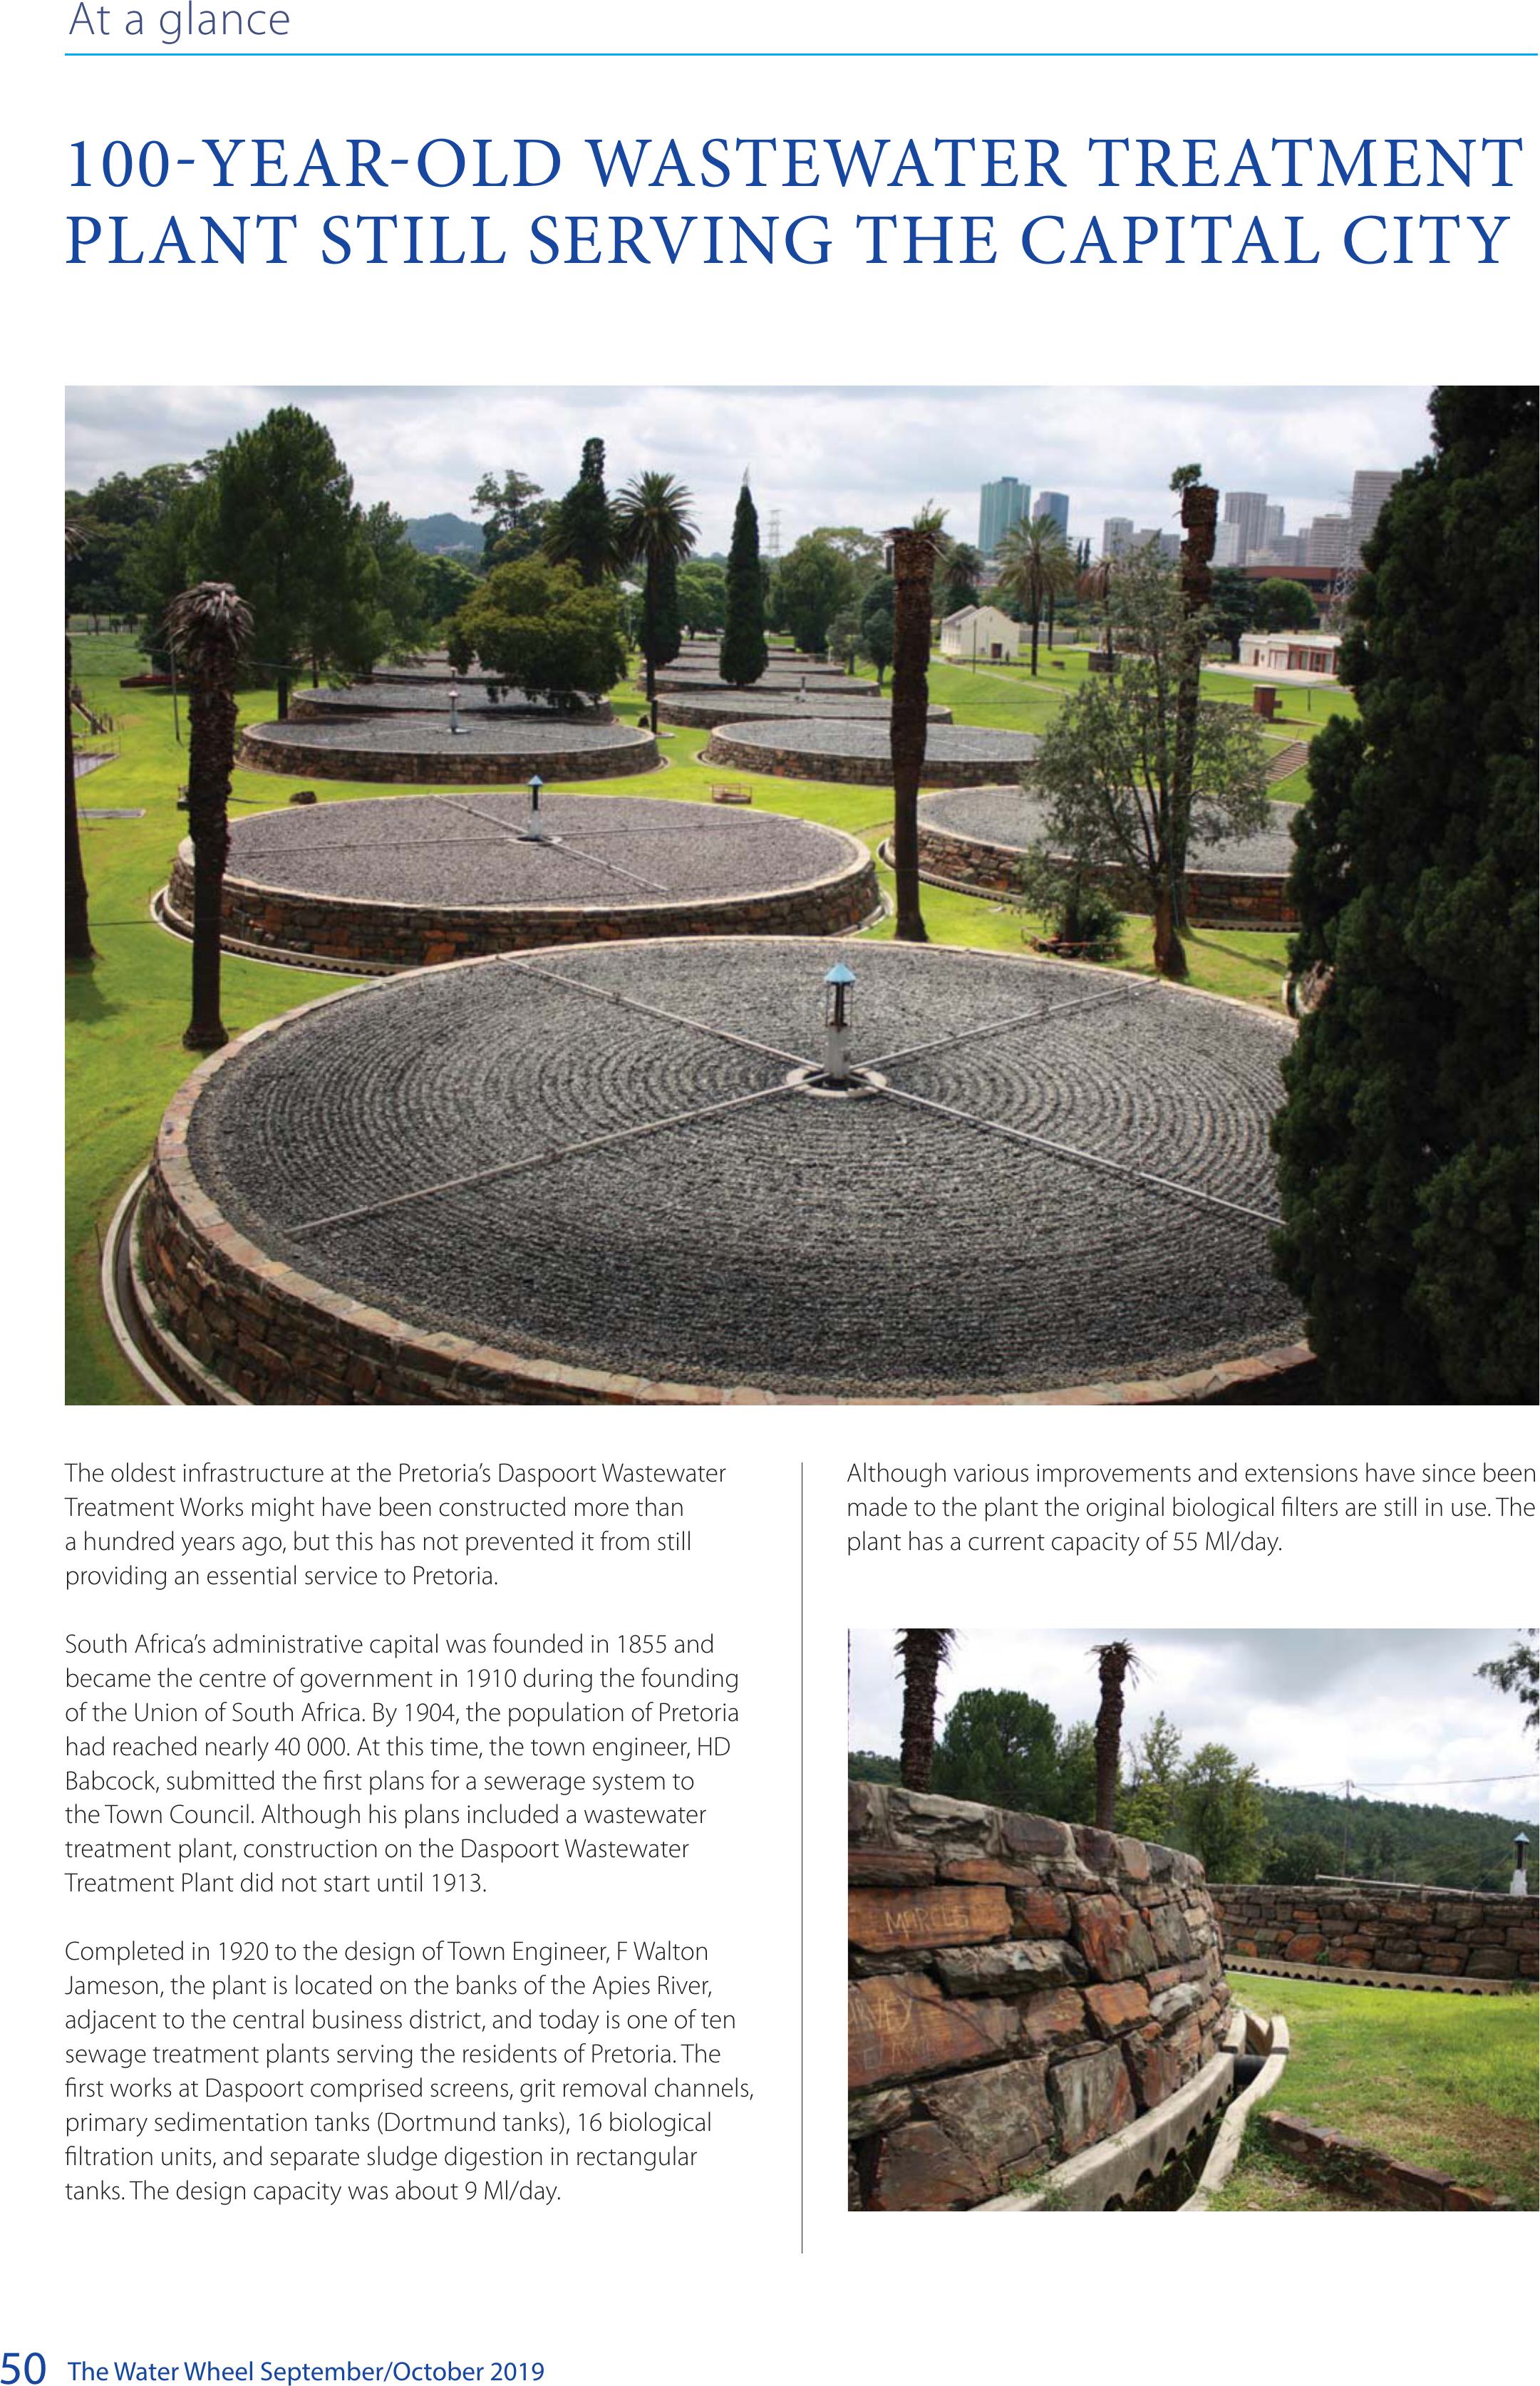
The Water Wheel September/October 2019
50
At a glance
100-YEAR-OLD WASTEWATER TREATMENT
PLANT STILL SERVING THE CAPITAL CITY
The oldest infrastructure at the Pretoria’s Daspoort Wastewater
Treatment Works might have been constructed more than
a hundred years ago, but this has not prevented it from still
providing an essential service to Pretoria.
South Africa’s administrative capital was founded in 1855 and
became the centre of government in 1910 during the founding
of the Union of South Africa. By 1904, the population of Pretoria
had reached nearly 40 000. At this time, the town engineer, HD
Babcock, submitted the first plans for a sewerage system to
the Town Council. Although his plans included a wastewater
treatment plant, construction on the Daspoort Wastewater
Treatment Plant did not start until 1913.
Completed in 1920 to the design of Town Engineer, F Walton
Jameson, the plant is located on the banks of the Apies River,
adjacent to the central business district, and today is one of ten
sewage treatment plants serving the residents of Pretoria. The
first works at Daspoort comprised screens, grit removal channels,
primary sedimentation tanks (Dortmund tanks), 16 biological
filtration units, and separate sludge digestion in rectangular
tanks. The design capacity was about 9 Ml/day.
Although various improvements and extensions have since been
made to the plant the original biological filters are still in use. The
plant has a current capacity of 55 Ml/day.
BACK TO TOP
The Water Wheel May/June 2016
52
Upfront