
The Water Wheel January/February 20201

3
CONTENTS
THE WATER WHEEL is a two-monthly
magazine on water and water research
published by the South African Water
Research Commission (WRC), a statutory
organisation established in 1971 by
Act of Parliament. Subscription is
free. Material in this publication does
not necessarily reflect the considered
opinions of the members of the WRC,
and may be copied with acknow-
ledgement of source.
Editorial Committee:
Dr Sylvester Mpandeli (Chair), Ms Khosi
Jonas, Ms Manjusha Sunil, Mr Bonani
Madikizela, Dr Mamohloding Tlhagale
and Sudhir Pillay.
Editorial offices:
Water Research Commission, Private
Bag X03, Gezina, 0031, Republic of
South Africa.
Tel (012) 761 9300. Fax (012) 331-2565.
WRC Internet address:
http://www.wrc.org.za
Follow us on Twitter:
@WaterWheelmag
Editor: Lani van Vuuren,
E-mail: laniv@wrc.org.za;
Editorial Secretary: Dikeledi Molutsi,
E-mail: dikeledidk@wrc.org.za;
Layout: Anja van der Merwe,
E-mail: anjavdm@wrc.org.za
Marine litter has become a
global crisis, with rivers cited as
a significant contributor to the
problem. Article on page 10.
UPFRONT
WATER RESOURCE MANAGEMENT
To keep the oceans clean, look towards our rivers
WATER RESOURCES
Port Elizabeth – Planning, engineering and science combine to
avoid Day Zero
WATER AND SOCIETY
Connecting to water in a dry Johannesburg
ECOLOGICAL INFRASTRUCTURE
Investing in ecological infrastructure to improve drought
resilience and enhance water security
WATER RESOURCES
Water scenarios for the future: A glimpse of what is to come
WETLANDS
Nature-based solutions for the future: Securing wetlands for
water security in the Western Cape
SMALLHOLDER FARMING
Creating climate change resilient communities Part 3: A
decision support system for smallholder farmers
AT A GLANCE
New partnership hopes to boost rollout of safe sanitation
04
10
16
20
25
32
The Water Wheel January/February 2020
28
36
42

The Water Wheel January/February 2020
4
FLUID THOUGHTS
New water perspectives for 2020
When she addressed the Water Institute of Southern Africa (WISA)
conference, which took place in 2018 in Cape Town, Sunita Narain
of the Centre for Science and the Environment, India, made the
observation that change in weather patterns on the back of
major climatic changes can be evidenced through both droughts
and floods occurring simultaneously in the same country.
This is a phenomenon we are currently living through with the
serious flood damage in some parts of the country while others
are still in the grip of extreme water scarcity.
This physical phenomenon of extreme weather, which is
rapidly defining our new normal, is greatly exacerbated by the
metaphoric drought of ideas and imagination compounded
by the floods of prejudice and negativity. This is particularly
pronounced in the commentary of some regular water and
development experts that fill our media spaces. A clan of Afro-
pessimists in general and South African nay-sayers. They also
happen to be of a certain gender, race and of a particular age.
One of the questions raised in response to the launch of the
Water Masterplan by Minister of Human Settlements, Water and
Sanitation, Lindiwe Sisulu was “where would the water come
from?” South Africa has the accolade of being in the world’s
top 10% of water knowledge producers on the back of a highly
productive research community of practice, so let us assist
in hydrating this drought of ideas. Accepting that the public
is aware of the plans for various surface water augmentation
schemes of dams and pipelines in process at the Department of
Water and Sanitation, let us concentrate on the other even more
attractive options.
Firstly, we have the potential of sustainable groundwater
harvesting from renewable aquifers of between 8 to 12
billion m3 (a m3 is 1 000 litres) annually. Our current use is only
between 2 and 4 billion m3 depending on the season. Core
to the sustainability of this resource is frequent and regular
replenishment. Groundwater also trumps surface water storage
as it is largely immune from the evaporation index. A great
example is the Atlantis aquifer outside Cape Town, which is
being replenished with a combination of stormwater and treated
wastewater. Its current potential for supply is 15-20 million litres
a day.
A further unexploited resource is seawater along the coast and
brackish and polluted waters inland. The traditional barrier to
entry of energy demand has been largely solved by technological
advancement and renewable energy options, and costs will
depend on economies of scale on the one hand and the
planning model on the other. Desalination investments could
easily decrease the current strain on surface water systems by at
least 10%. For this to work it is essential that desalination plants
are retained as a permanent part of the water mix and not only
for emergencies. The possibilities were shown in the Ndlambe
district municipality in the town of Albany in the Eastern Cape
where Minister Sisulu launched the next phase of its desalination,
now utilising a sand water harvesting system to supplement the
seawater feed. The town is now predominantly supplied with
these sources, supplemented by rainwater harvesting tanks. It is, if
you like, an off-the-surface water grid.
The quickest win of all lies in reticulation efficiency. We currently
lose about 25% of treated, expensive drinking quality water to
leaks in our cities and towns. One out of every four litres of water
is lost before it reaches the tap. A dramatically reimagined “war-
on-leaks” initiative designed to build the plumbing capacity we
need, building entrepreneurs to permanently provide this service
to maintain the reticulation systems and the use of the latest
technological platforms, including drones and robotics, will not
only win back the 25% of water currently lost, but will support
an industry platform that will provide livelihoods and economic
growth in an inclusive manner. This is not pie-in-the-sky. The
Water Research Commission, in partnership with the African
Development Bank, has successfully piloted the social franchising
model for school sanitation maintenance in the Eastern Cape,
creating in the process 20 new companies employing at least 3
people each now active players in the industry. This is a model
that can easily operate with similar efficacy and effectiveness in
address the water leaks challenge.
If we delve deeper into the new non-sewered sanitation
technologies, we have the potential to save 30% of water in every
household and workplace in the country. What we observed
when we launched the second phase of the SASTEP (South
African Sanitation Technology Evaluation Programme) with the
WRC’s partners, the South African Government and the Bill and
Melinda Gates Foundation, was the high interest from both
the business sector and the investment community. We add to
this scaled recycling systems as part of the global purple pipe
revolution where up to 80% of water in an average household
can be reused for further purposes. The water arithmetic
now begins to look very positive. In fact, with these demand
management interventions we can easily reduce our South
Africa’s per capita use from its current 253 litres per person per
day to the global average of 173 litres per person per day. This
will be an immediate saving of 30% overall. If we move to the
global best practice of 108 litres per person per day as claimed by
the likes of Denmark, then an amazing 57% of the current water
asset will be available for new use. We will be in the realm of
water prosperity. To answer the expert’s question – that is where
Upfront
WRC CEO, Dhesigen Naidoo
BACK TO TOP

The Water Wheel January/February 20205
Upfront
Water governance
11-13 February
The Water Institute of Southern Africa
(WISA) is offering a three-day training
course in Stellenbosch on water
governance. The course has been
designed to facilitate understanding
of the principles of water governance
from a human rights perspective, and
covers international water governance
approaches, sustainable water resource
management initiatives, and the
implementation of measures in South
Africa through the relevant legislation.
Visit: www.wisa.org.za
Large dams
4-10 April
The 88th annual meeting and symposium
of the International Commission on
Large Dams (ICOLD) will be held in New
Delhi, India, under the theme ‘Sustainable
development of dams and river basins’.
Visit: www.icold-cigb.org
Water
31 May – 4 June
The Biennial conference and exhibition
of WISA is taking place at the Sandton
Convention Centre. The conference is
the region’s biggest water conference
– bringing together water sector
professionals and other stakeholders
from across the country and beyond.
The conference will consider the broader
impacts of water on society and the
environment.
Visit: https://wisa2020.org.za/
Water and the environment
11-10 June
The IUCN World Conservation Congress
is taking place in Marseille, France. The
congress comes just four months before
the world’s governments come together
to set conservation and sustainable
development priorities and to mobilise
action to reach them.
Visit: https://www.iucncongress2020.org
Sanitation
21-24 July
The First IWA Non-Sewered Sanitation
specialist group conference is being
hosted at the Future Africa Campus in
Pretoria in partnership with the Water
WATER DIARY
Research Commission and the University
of Pretoria. The aim of the conference
is to provide stimulus for research and
innovation for non-sewered sanitation
and off-grid sanitation solutions, including
faecal sludge management, build the
technical and scientific base for sanitation
and to contribute to scientific knowledge
and good practice learnings. Enquiries: Dr
Sudhir Pillay, Email: sudhirp@wrc.org.za,
Visit: www.shorturl.at/DIJQ0
World Water
18-23 October
The IWA World Water Congress will take
place in Copenhagen, Denmark with the
theme ‘Water for smart liveable cities’.
Visit: https://worldwatercongress.org/
Municipal water
28-30 October
The Institute of Municipal Engineering of
Southern Africa will be holding its annual
conference in Cape Town.
Visit: https://www.imesa.org.za/
the water will come from even before you consider the classical
augmentation schemes.
Let us address the other side of the coin – the flood of bigotry
and prejudice infused with a deep Apartheid nostalgia garnished
with thinly veiled hyper-privilege. That the current water woes
are only there because there are new folk, black folk, in charge,
completely ignores the fact that the notion of water crisis has
been in the top five risks in the World Economic Forum’s Global
Risk Register for 9 years continuously. That the vagaries of
extreme weather events and climate change is driving two thirds
of the world to water stress. No, it must be a lament on the loss
of skills in the water sector, of course in particular the white male
skills base. Let us remind ourselves that the great efficiency of
water services that these folks long for was one in which only
58% of South Africans had access to safe water and far fewer
had the benefit of dignified improved sanitation. In short, the
nostalgia is not shared. Also, the comments are not only deeply
insulting to the millions of men and women, black and white, that
put their best foot forward every day, toiling hard to provide for
their families while keeping SA Inc ticking over.
This expression of hyper-privilege has become a major hurdle to
the Mzansi Social Democracy project. Also, there is another way.
In 2011, 80% the WRC’s research portfolio was led by white male
researchers, today the majority of projects are led by women and
black researchers. The key enabler to this great transformation
story was, in fact, the generosity and willingness of the older
white male researchers to come on board as the mentorship
group to enable this very important change.
The future is not what it used to be. When we were pegging
our hopes on 2020 in the 1990s, we were in the middle of what
Clem Sunter labelled the long (economic) boom. Our optimism
was further driven by our own liberation from Apartheid and our
re-entry into the Global Community of Nations. The fact that the
Kyoto Protocol was still the main game in town added to our
positive views that we had a handle on making the world a much
better place for future generations.
Much has changed and the world has become a much more
challenging place. Let us reflect this festive season on the South
Africa we really want and whether our current actions help us to
get to the right space or is it taking us the other way. If there was
one truism worth repeating from the Apartheid era it is Eendragt
maakt magt, a national motto shared with several countries.
Unity is indeed strength! A Mzansi united is the only way we can
navigate our way out of the doldrums into prosperity.
BACK TO TOP

The Water Wheel January/February 2020
6
NEWS
Upfront
Water sector gearing up for biggest technical event of the year
#AllHandsOnDeck, the theme for this
year’s event. The WISA 2020 conference
will, therefore, provide a platform for
these issues to be discussed, solutions
shared and decisions taken in a pledge
to action. The theme calls for local and
regional players to work together towards
a sustainable water future, and WISA
2020 aims to speed up delivery and bring
purposeful feedback to the leadership of
South Africa.
The conference will cover various
sub-themes, including reducing water
demand and increasing supply; managing
the resource for a capable ecology;
managing and monitoring effective water
and sanitation services and infrastructure;
governance and regulation; improving
raw water quality and management;
and developing skills and technology
innovations and disruptors.
“Our past conferences have provided
a platform to discuss problems and
solutions facing the water and related
sector. Now is the time to create
the mechanisms and an enabling
environment to set us on a path of
implementation and impact,” notes
Dr Shafick Adams, Chair of the local
organising committee. “Water is
everyone’s business and everyone should
be involved in ensuring that we have
water security. This is now more important
than ever, as we need to navigate issues
of climate change, weather variability,
demand growth, infrastructure needs and
so forth.”
Parliament welcomes DWS financial recovery plan
“An efficiently-run department is a
precursor to improved service delivery.
The plan and the impacts it has made
so far are reasons for optimism,” the
committee believes.
One of the major areas of improvement
has been the reduction in accruals and
payables, which had been reduced to
around R808 000 by November. The
payment for services received ensures
that service providers remain viable and
that projects are completed.
The committee also welcomed the DWS’s
consequence management initiatives to
deal with the over R16 billion in irregular
expenditure. As many as 86 guilty verdicts,
13 dismissals, one demotion and various
suspensions have been meted out against
errant officials.
In respect to debt owed to the
department and its entities, the
committee emphasised the need for
constructive discussions coupled with
strong implementation in areas of
agreement to deal effectively with the
debt and to assist water agencies to
improve their balance sheet.
The committee also noted the
department’s intention to exit the War on
Leaks programme. “While the committee
acknowledges the need to conclude
the programme, the department should
improve its planning capacity, as the
intentions of War on Leaks were noble
and much could have been achieved,
especially in relation to decreasing non-
revenue water.”
The committee has requested regular
updates from the department on the
financial recovery plan.
The Parliamentary Portfolio Committee on
Human Settlements, Water and Sanitation
has welcomed the Department of Water
and Sanitation’s financial recovery plan.
In a statement released in November the
committee said that the plan gave them
assurance that the current leadership
would be able to overcome the
department’s long-standing challenges.
The Water Institute of Southern Africa
(WISA) Biennial Conference and Exhibition
will be held at the Sandton International
Convention Centre from 31 May to 4 June.
Southern Africa’s water demands are
on the rise, as a rapidly growing and
urbanising population, changing lifestyles
and economic growth place increasing
pressure on this resource. The result
is a growing water crisis worsened
by insufficient water infrastructure
maintenance and investment, recurrent
droughts and floods driven by climatic
variation, inequities in access to services,
deteriorating raw water quality, and a lack
of skilled water practitioners.
WISA believes that in order to address
these challenges, the sector needs to have
BACK TO TOP

The Water Wheel January/February 20207
Upfront
Dam safety adherence slips – Minister expresses concern
Water and Sanitation Minister, Lindiwe
Sisulu, has called on dam owners across
the country to adhere to dam safety
legislation in the wake of extreme weather
patterns.
Sisulu warned that failure to stick to the
rules may prompt the department to take
legal action against transgressors.
“We are faced with water security
challenges as a country and key to
this is deteriorating infrastructure. I
therefore urge dam owners to do their
bit to safeguard water infrastructure by
conducting the required [dam safety]
evaluations, which will not only protect
society from potential dam failures, but
will also ensure guaranteed storage,
especially in the current climatic
conditions facing our country,” she noted.
South Africa’s dam safety legislation
requires that all dams with a storage
capacity of more than 50 000 m3 and a
wall height of more than five metres must
be registered as a dam with a safety risk
and is subject to dam safety inspections
by registered persons. The Dam Safety
Office (DSO) currently has over 5 600 such
dams registered across the country.
Sisulu noted that for the 2018/19 period,
at least 313 dam safety evaluation reports
were expected to be submitted to the
DSO, but only 207 (66%) were submitted.
“Each dam must have a safety inspection
conducted every five years. In this case,
dam owners are required to arrange for
the execution of a formal dam safety
inspection by an approved professional
person.”
The minister said that her department
remained committed to safeguarding
South Africa’s water resources. “As such,
dam owners are encouraged to play their
role by abiding to dam safety legislation,
as set out in the National Water Act.”
(Photo for illustrative purposes only)
Environmental assessment practitioners body officially recognised
The South African Qualifications
Authority (SAQA) Executive Committee
has recognised the Environmental
Assessment Practitioners Association of
South Africa (EAPASA) as the first statutory
environmental assessment professional
body for a period of five years.
EAPASA Chairperson, Snowy Makhudu,
has hailed the recognition by SAQA as a
historic achievement for the organisation,
the country, and the African continent.
“This gives credence to our work as we
seek to promote ethical practice and
quality of environmental assessments in
South Africa.”
EAPASA was appointed by the
Department of Environment, Forestry
and Fisheries as the single Registration
Authority for environmental assessment
practitioners in South Africa in 2018. The
recognition of EAPASA as a professional
body is beneficial to the environment
sector, contributing to skills development
of environment assessment practitioners
and enhancing quality assurance and
professionalism in South Africa, the
association said in a statement.
“Registration with EAPASA enables
environmental assessment practitioners
to comply with the national legislation in
their operation. It also creates a platform
to independently address incompetent
and unethical behaviour, while protecting
those who comply and uphold the
EAPASA Code of Ethical Conduct and
Practice.
For more information, Visit: www.eapasa.org
BACK TO TOP

The Water Wheel January/February 2020
8
GLOBAL
Upfront
World Toilet Day highlights rights, dignity of sanitation workers
shunned. “Workers often come into direct
contact with human waste, working with
no equipment or protection to remove
it by hand, which expose them to a long
list of health hazards and diseases,” the
international organisation said.
“It is only when those critical services
fail, when society is confronted with
faecal waste in ditches, streets, rivers and
beaches or occasional media reports of
sanitation worker deaths, that the daily
practice and plight of sanitation workers
come to light,” it maintains.
The publication, Health, safety and dignity
of sanitation workers was produced
jointly with the International Labour
Organisation, World Bank, and WaterAid.
It examines nine case studies of sanitation
workers in low and middle-income
countries, who empty pits and tanks,
transport faecal sludge and perform
sewer maintenance.
The publication describes the workforce
as “invisible, unquantified and ostracised”
and insists that many of the challenges
that sanitation workers face stem from a
lack of acknowledgement for what they
do.
While the workers include full-time
employees with health benefits, pensions
and legal protection, a significant
proportion comes from some of the “most
marginalised, poor and abused members
of society.”
The report also highlights where
sanitation work has been officially
acknowledged and formalised, citing
South Africa as an example, where public
and private employees follow national
labour standards and have proper
equipment and training.
“Many of the challenges sanitation
workers face stem from their lack of
visibility in society,”WHO said, noting
that few countries in the developing
world had any guidelines to protect
sanitation workers. “Where laws do exist,
governments may lack the financial or
technical means to implement them, and
the informality of the roles present further
challenges.”
To access the publication, Visit:
https://www.ilo.org/sector/Resources/
publications/WCMS_728054/lang--en/index.
htm
The plight of sanitation workers in the
developing world should be addressed
urgently, according to the World Health
Organisation (WHO).
Highlighting the dangers for the millions
of people who clean toilets, sewers and
septic tanks, ahead of World Toilet Day
on 19 November, the WHO insisted
that wile the workforce performs an
essential public service, their own health
is compromised and they are often
US shift away from coal saving significant volumes of water
Environment at Duke University.
These savings in both water consumption
and water withdrawal have come despite
the intensification of water use associated
with fracking and shale gas production,
the study shows.
“For every megawatt of electricity
produced using natural gas instead of
coal, the amount of water withdrawn from
local rivers and groundwater is reduced
by 10 500 gallons (about 39 747 litres), the
equivalent of a 100-day water supply for a
typical American household,” says Andrew
Kondash, a post-doctoral researcher who
led the study.
At these rates of reduction, if the rise of
shale gas as an energy source and the
decline of coal continues through the
next decade, by 2030 the US will save
about 483 billion cubic metres of water
each year.
The study was originally published in
Environmental Research Letters, Visit:
https://iopscience.iop.org/
article/10.1088/1748-9326/ab4d71
The ongoing transition from coal to
natural gas and renewables in the US
electricity sector is dramatically reducing
the industry’s water use, a new study has
found.
“While most attention has been focused
on the climate and air quality benefits
of switching from coal, this new study
shows that the transition to natural
gas – and even more so, to renewable
energy sources – has resulted in saving
billions of gallons of water,” notes Avner
Vengosh, professor of geochemistry and
water quality at the Nicholas School of the
BACK TO TOP

The Water Wheel January/February 20209
Upfront
In memoriam – Arjen Hoekstra, father of the water footprint
The international water sector has
expressed its shock and sadness at the
unexpected death of Arjen Hoekstra, co-
founder of the Water Footprint Network.
Hoekstra, who passed away on 18
November at the age of 52, was a
professor of Water Management at the
University of Twente and the inventor of
the ‘water footprint’ concept. The water
footprints Hoekstra invented in 2003 gave
the sector a framework to analyse the
link between human consumption and
production and the appropriation of the
world’s freshwater. This innovation not
only kicked off a whole new academic
field, Water Footprint Assessment, but
also made it possible for companies,
governments and consumers to
understand their water dependence in
locations around the world and how
their water footprint contributes to social,
environmental and economic impacts in
vulnerable river basins.
The water footprint is the actual volume
of freshwater consumed or polluted by
a process, a product or an organisation.
“Thanks to Arjen Hoekstra, the
international discussion about production
and consumption and the trade of goods
moved to a new level of clarity, making
it much easier to go from intentions to
action,” noted the Stockholm International
Water Institute (SIWI).
Over the years thousands of students have
followed the e-learning courses that have
been organised by Hoekstra’s network.
Several companies, including Tata Steel,
Ikea, Coca-Cola and Heineken have used
the concept of water footprint to raise
awareness about water conservation
within their own organisations.
Hoekstra worked tirelessly to expand
the scientific understanding of the real
appropriation of water required for
different human activities. He was one of
the most cited researchers in his field. He
also authored several books.
“With the death of Arjen Hoekstra, the
water world has lost one of its most
brilliant and innovative minds,” said SIWI
in a statement. “Furthermore, many
of us have lost a friend, a colleague
who inspired the best in us and a
co-conspirator who challenged us to
become better advocates for sustainable
development.”
Nile River ‘older than thought’
Ancient Egyptians considered the Nile
River to be the source of all life. The steady
northward path of the river has nourished
the fertile valleys of northeast Africa for
millions of years and in doing so, shaped
the course of human civilisation.
The Nile’s unchanging path, however,
has been a geologic mystery because
long-lived rivers usually move over time.
Researchers at the University of Texas at
Austin have cracked the case by linking
the river’s flow to the movement of rock in
the Earth’s deep mantle. In the course of
their investigation, they found the eternal
river to be much older than anyone
realised, with the scientists estimating
the age of the Nile to be 30 million years
– about six times as long as previously
thought.
The research, published in the journal,
Nature Geoscience, found that if it weren’t
for the mantle movement keeping the
river on course, the Nile would have
turned west long ago, probably changing
the course of history along with it.
The results should settle a long-running
debate about the age of the river
and provide evidence that the slow
movement of the deep mantle is one
of the key forces shaping our Earth’s
landscape and geological processes.
To view the original article, Visit: https://www.
nature.com/articles/s41561-019-0472-x
BACK TO TOP
The Water Wheel January/February 2020
10
To keep the oceans clean, look towards our rivers
According to Senior Manager for the Stockholm International
Water Institute (SIWI) Water Governance Department,
Ruth Mathews, the issue of plastic pollution in the marine
environment was first recognised as an ocean problem. As such,
the necessary action was to clean up the ocean by removing
the plastic that was already there. This led to beach and ocean
cleanups, and the development of technologies to capture
plastic waste from the surface of coastal and marine waters.
However, she says, more recently research has begun to quantify
the amounts of trash in the ocean, and where it comes from.
What goes into our oceans?
According to the United Nations Environment Programme
(UNEP), marine litter is any persistent, manufactured or
processed solid material discarded, disposed of or abandoned in
the marine and coastal environment.
It mainly consists of plastics, wood, metals, glass, rubber,
clothing and paper, although the World Bank reports that about
80% is plastics. This is confirmed by Geoff Tooley, eThekwini
Municipality Senior Manager for Catchment Management, when
asked about what the bulk of trash that ends up on Durban’s
beaches consists of. “Plastic and polystyrene form the base,” he
explains. “There are things like furniture, but most of it is either
plastic, the largest portion, and the next is polystyrene, in the
form of fast food outlet packaging.”
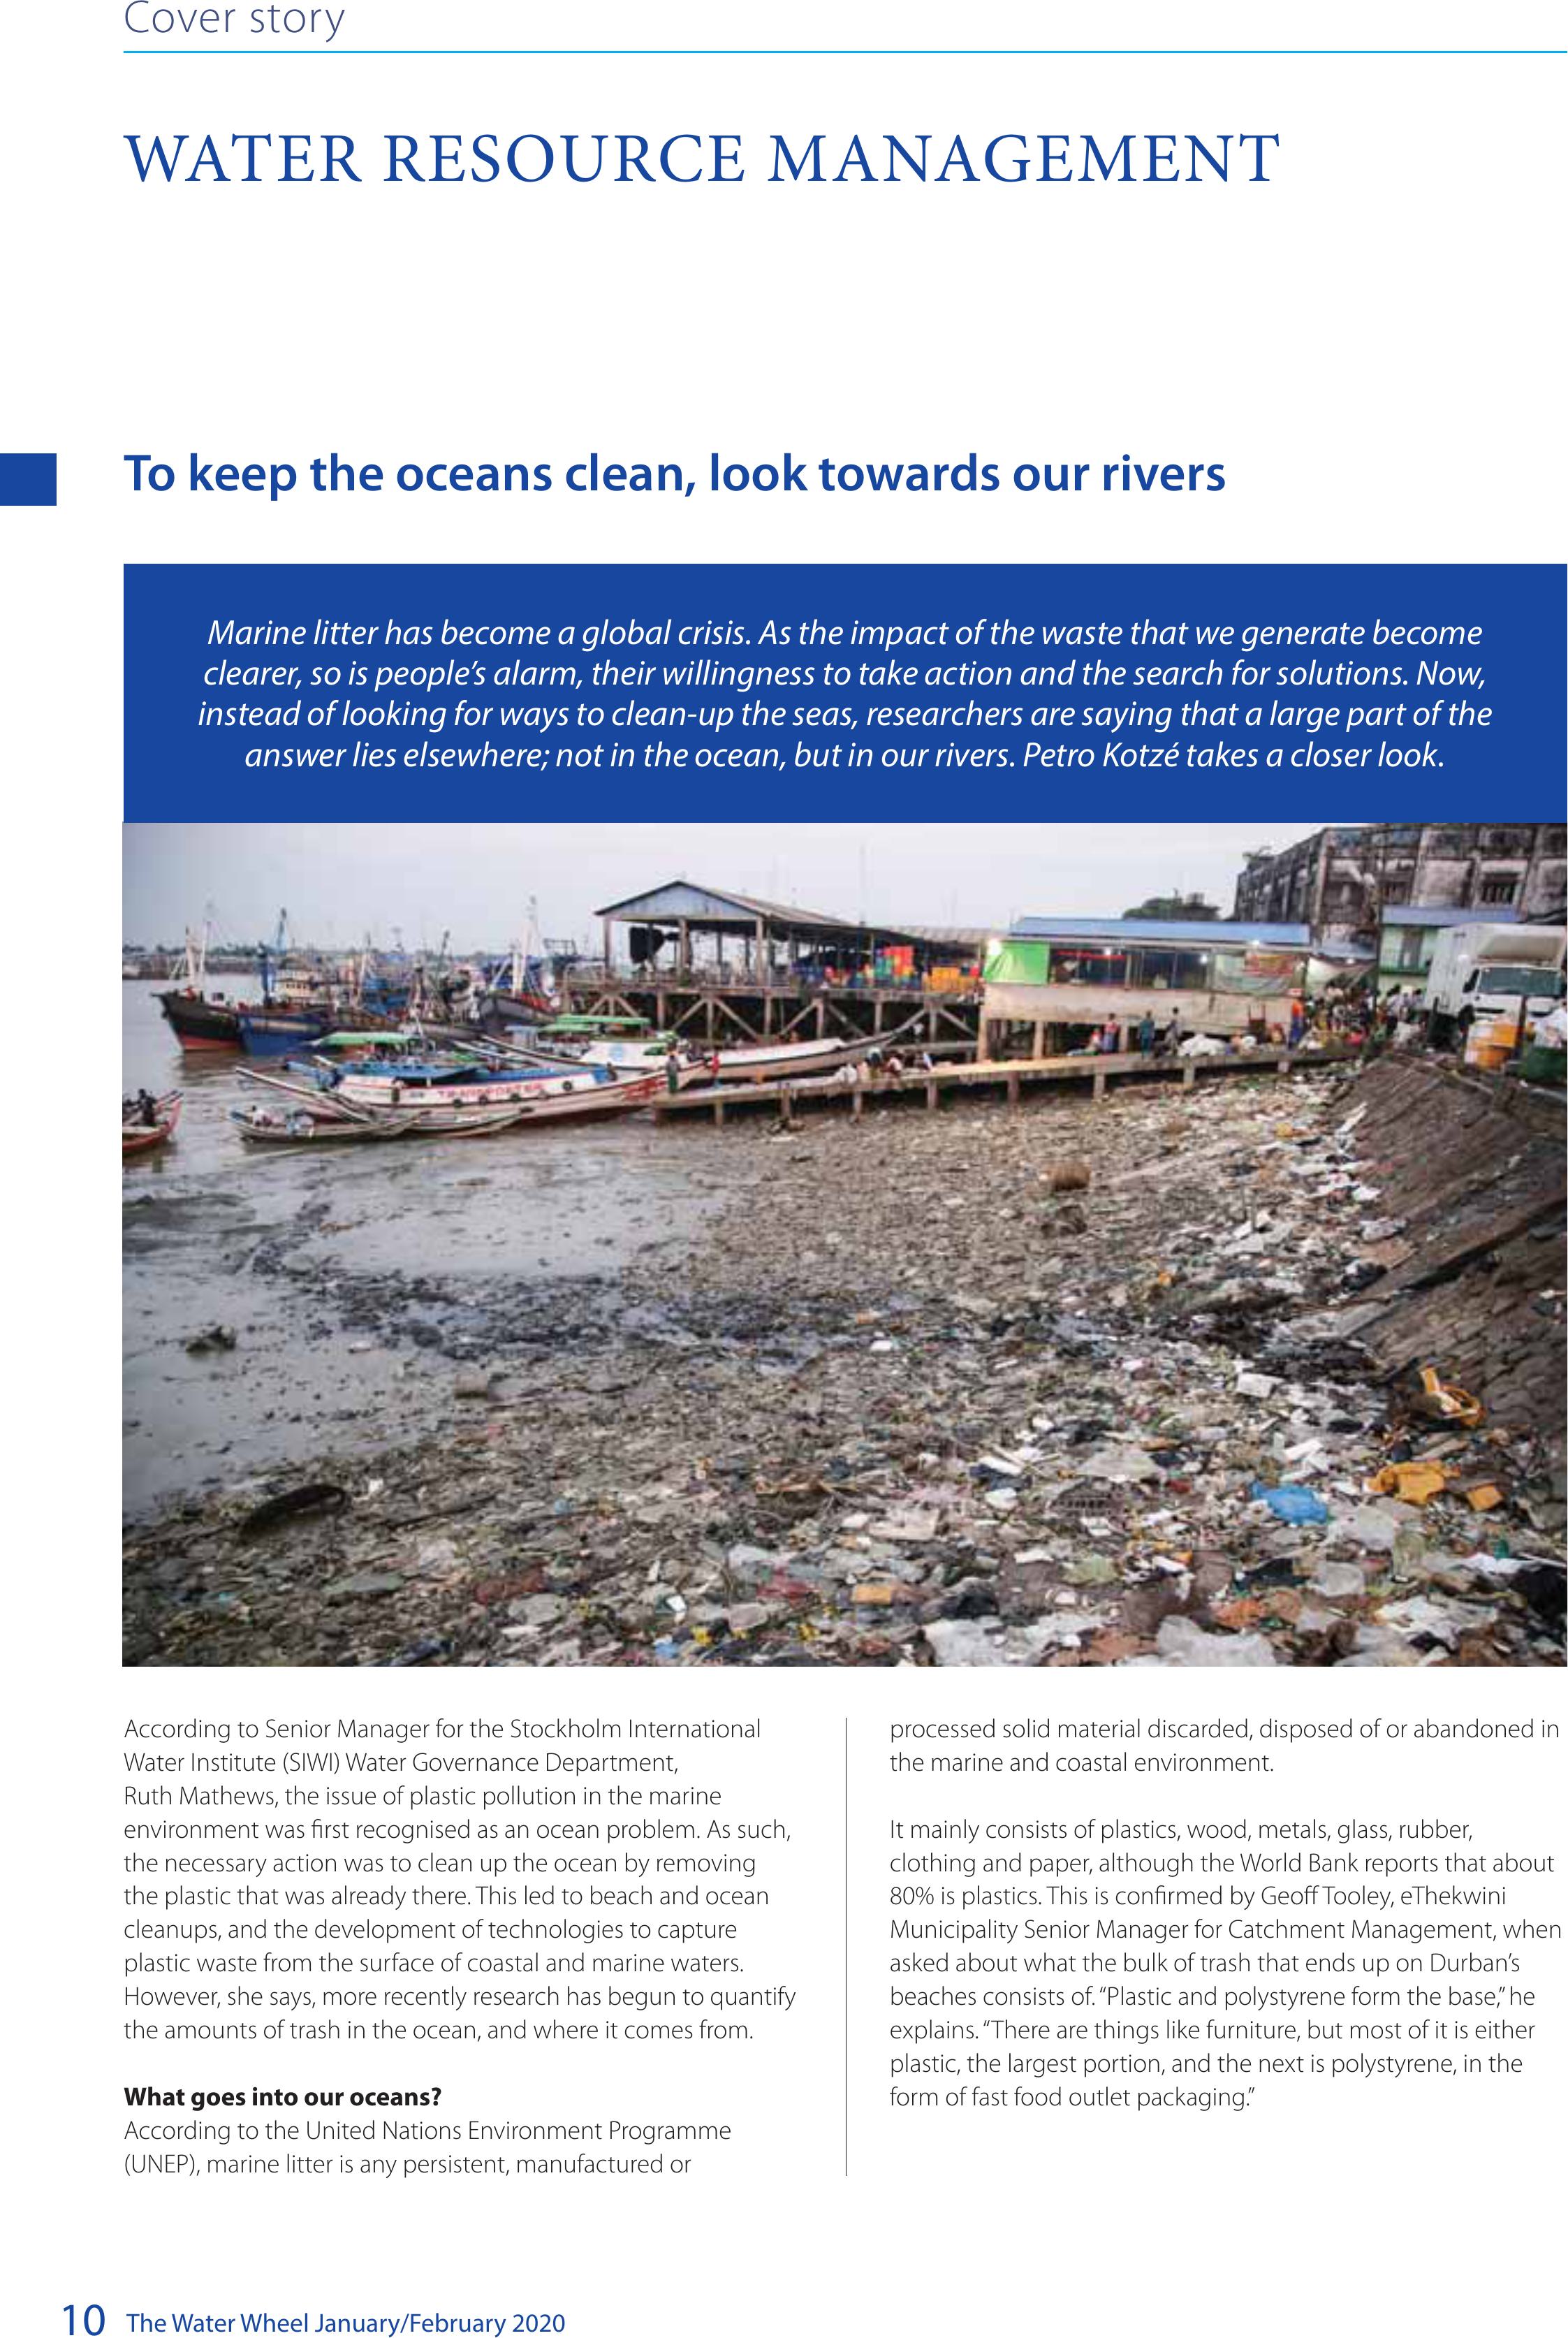
Marine litter has become a global crisis. As the impact of the waste that we generate become
clearer, so is people’s alarm, their willingness to take action and the search for solutions. Now,
instead of looking for ways to clean-up the seas, researchers are saying that a large part of the
answer lies elsewhere; not in the ocean, but in our rivers. Petro Kotzé takes a closer look.
WATER RESOURCE MANAGEMENT
Cover story
BACK TO TOP

The Water Wheel January/February 202011
Where does the trash come from?
International studies (in particular by the Jambeck Research Group at the University of Georgia) estimate that the largest quantities of
marine litter and plastic waste originate from a relatively small number of countries in Asia and other middle income, rapidly developing
countries. Of the top 20 countries South Africa is ranked eleventh and, together with the rest of top perpetrators, account for 83% of the
mismanaged plastic waste entering the ocean.
Water resource management
Waste estimates for 2010 for the top 20 countries ranked by mass of mismanaged plastic waste, indicated in units of millions of metric tons per year.
Mismanaged waste is the sum of inadequately managed waste plus 2% littering. Total mismanaged plastic waste is calculated for populations within 50 km
of the coast in the 192 countries considered. Economic classification is indicated according to World Bank definitions based on 2010 Gross National Income,
as follows: high income (HIC), upper middle income (UMI), lower middle income (LMI), and low income (LI).
Regardless of where the litter comes from, it adds to a global problem. Plastic pollution is moved throughout the world’s oceans by the
wind and currents, but congregate in five highly concentrated subtropical gyres: North Marine Litter Pacific, North Atlantic, South Pacific,
South Atlantic, and Indian Ocean.
A mock-up of the evolution of marine debris by 2018 after 10 years of advection by currents, as determined from real drifter movements, indicating the five
subtropical gyres.
BACK TO TOP
The Water Wheel January/February 2020
12
Water resource management
Figuring out how much plastic there is in the ocean exactly
(by number of pieces and weight) is an ongoing process. This
is made more difficult because the plastic does not remain on
the water’s surface. The UNEP estimates that only 15% of marine
litter floats on the sea’s surface. The rest remains in the water
column (15%) while the bulk (70%) rests on the seabed.
Furthermore, plastic progressively breaks down into smaller
pieces, and is digested by various forms of marine life, making
the true state of plastic presence in the ocean even more difficult
to quantify.
Researchers have placed conservative estimates of the global
weight of plastic pollution in the sea surface at a minimum of
5.25 trillion particles weighing 268 940 tons (as published in Plos
One). This is still only 0.1% of the world annual production of
plastic. Plastics Europe, a trade organisation representing plastic
producers and manufactures, reported that 288 million tons
of plastic were produced worldwide in 2012. The researchers
thus stressed that their estimates of the weight of plastics in the
ocean are highly conservative and based on a limited inventory
of ocean observations. Furthermore, it does not account for
the potentially massive amount of plastic on shorelines, on the
seabed, suspended in the water column, and within organisms
that ingest it.
The route of plastic to the sea
The main sea-based sources of marine litter are shipping and
fishing, but various reports indicate that up to 80% of the litter
comes from land. Sources are listed to include tourism, sewage
and illegal or poorly managed landfills. Tooley estimates that
at least 90% of the litter that plagues Durban’s beaches is from
their river basins. Another 5 – 6% reach the sea directly from the
stormwater drainage system, and the balance is windblown or
chucked on the beach by people.
All over the globe, an astounding amount of litter and other
forms of pollution enter our seas in the same way. The Jambeck
study, using worldwide data on solid waste, population density
and economic status estimated the amount of plastic waste
generated in 192 countries at 275 million metric tons (in
2017). Of this, an estimated 4.8 to 12.7 million metric tons was
estimated to enter the ocean. Looking at plastic pathways, the
study found that 10 rivers basins are responsible for 90% of land-
based leakages to the ocean.
“Researchers have placed
conservative estimates of the global
weight of plastic pollution in the sea
surface at a minimum of 5.25 trillion
particles weighing 268 940 tons.”
Marine litter and other waste has long found an easy way to the sea – via
the rivers that transport it there.
Petro Kotzé
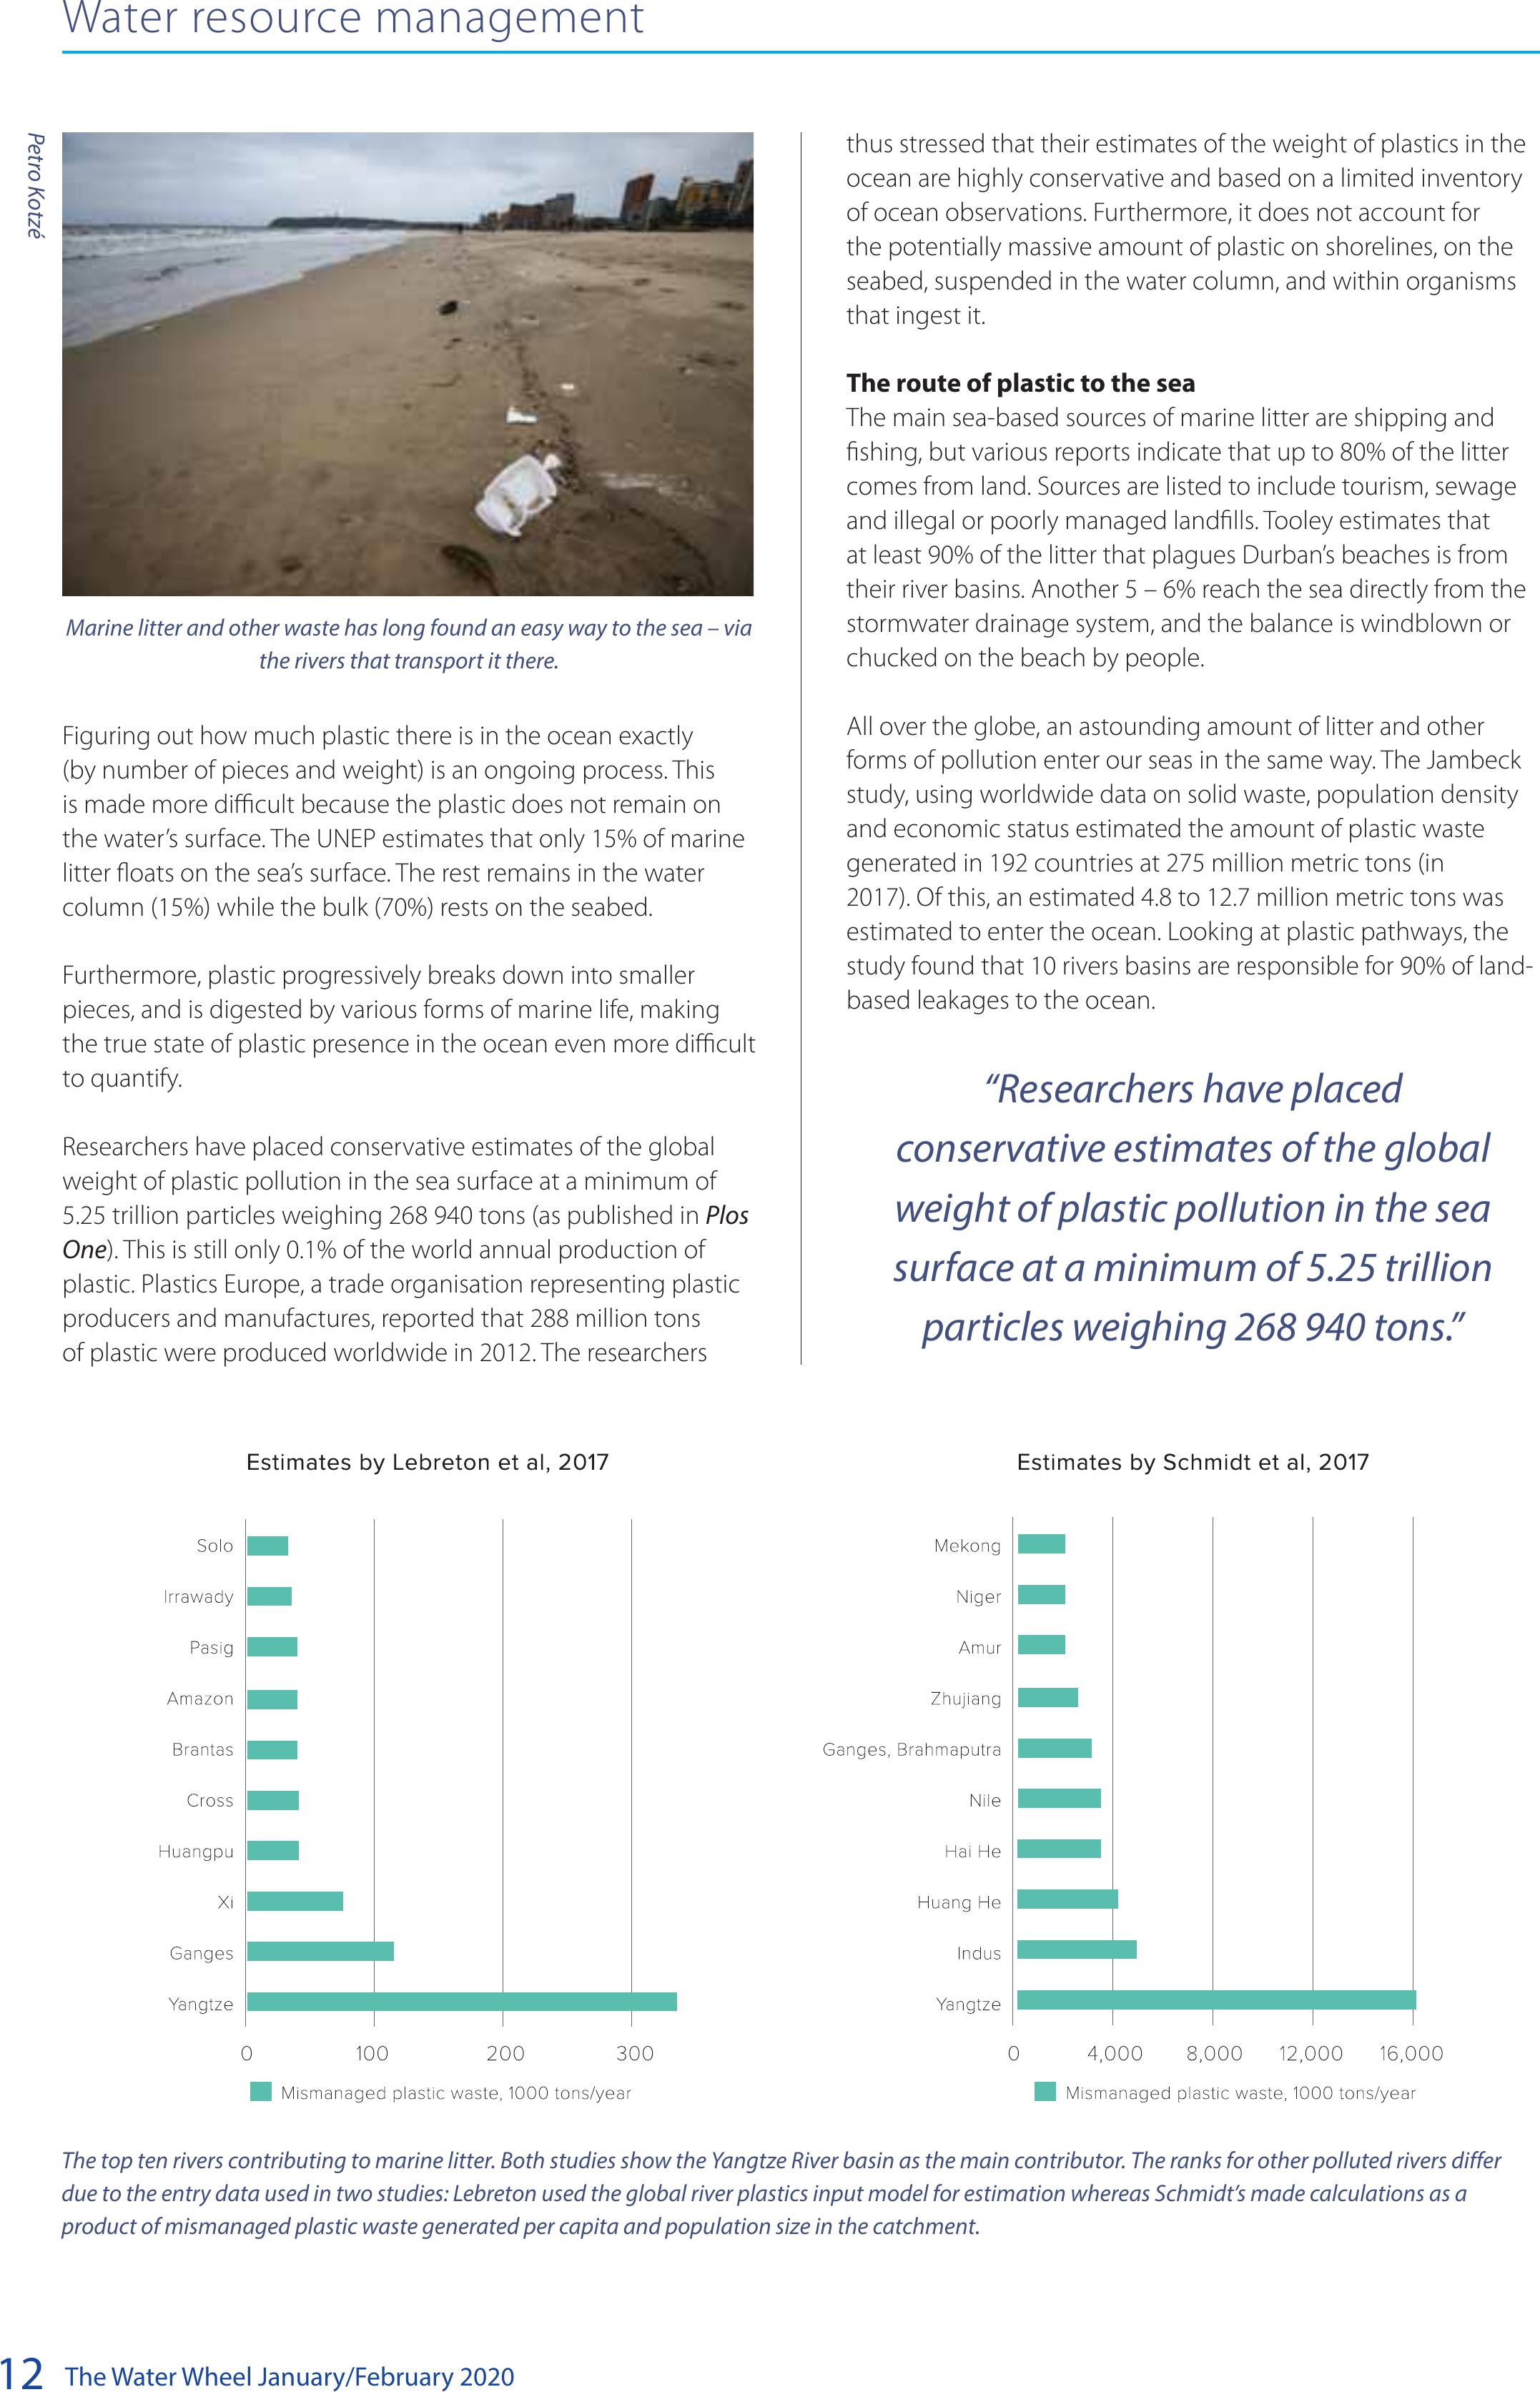
The top ten rivers contributing to marine litter. Both studies show the Yangtze River basin as the main contributor. The ranks for other polluted rivers differ
due to the entry data used in two studies: Lebreton used the global river plastics input model for estimation whereas Schmidt’s made calculations as a
product of mismanaged plastic waste generated per capita and population size in the catchment.
BACK TO TOP
The Water Wheel January/February 202013
Water resource management
Mathews notes that research like this has brought attention
to the urgent need to address land-based sources of plastic
pollution. The challenge, both locally and internationally, is
substantial. Says the Department of Environmental Affairs
(DEA) Chief Director of Communications, Albi Modise: “Despite
ongoing efforts to clean the Republic of South Africa’s beaches,
litter continues to flow to the coast through rivers and
waterways from inland sources.”
There are positive signs that the tide is slowing turning, however.
And increasingly, attention is being turned to the route litter
follows to the sea.
SIWI recently released the Source-to-Sea Framework for Marine
Litter Prevention, highlighting the central role of the river basin.
In South Africa, the DEA too is piloting a source to sea approach
to address marine litter at selected river basins. Tooley says, every
time they experience a big storm, and the beaches are left full
of litter, the same discussion is raised: “How do we stop it from
getting there in the first place?”
South Africa’s source-to-sea intervention
The DEA’s approach involves catchment wide or river basin wide
interventions in five rivers in coastal KwaZulu-Natal. Modise
says these rivers consistently generate beach and marine litter,
especially after heavy rain, when pollution throughout the
catchment tends to be flushed out via the rivers towards the
coast. “Coastal clean-up activities downstream of these loaded
river systems have not been successful due to the constant and
ongoing flow of litter,” he says.
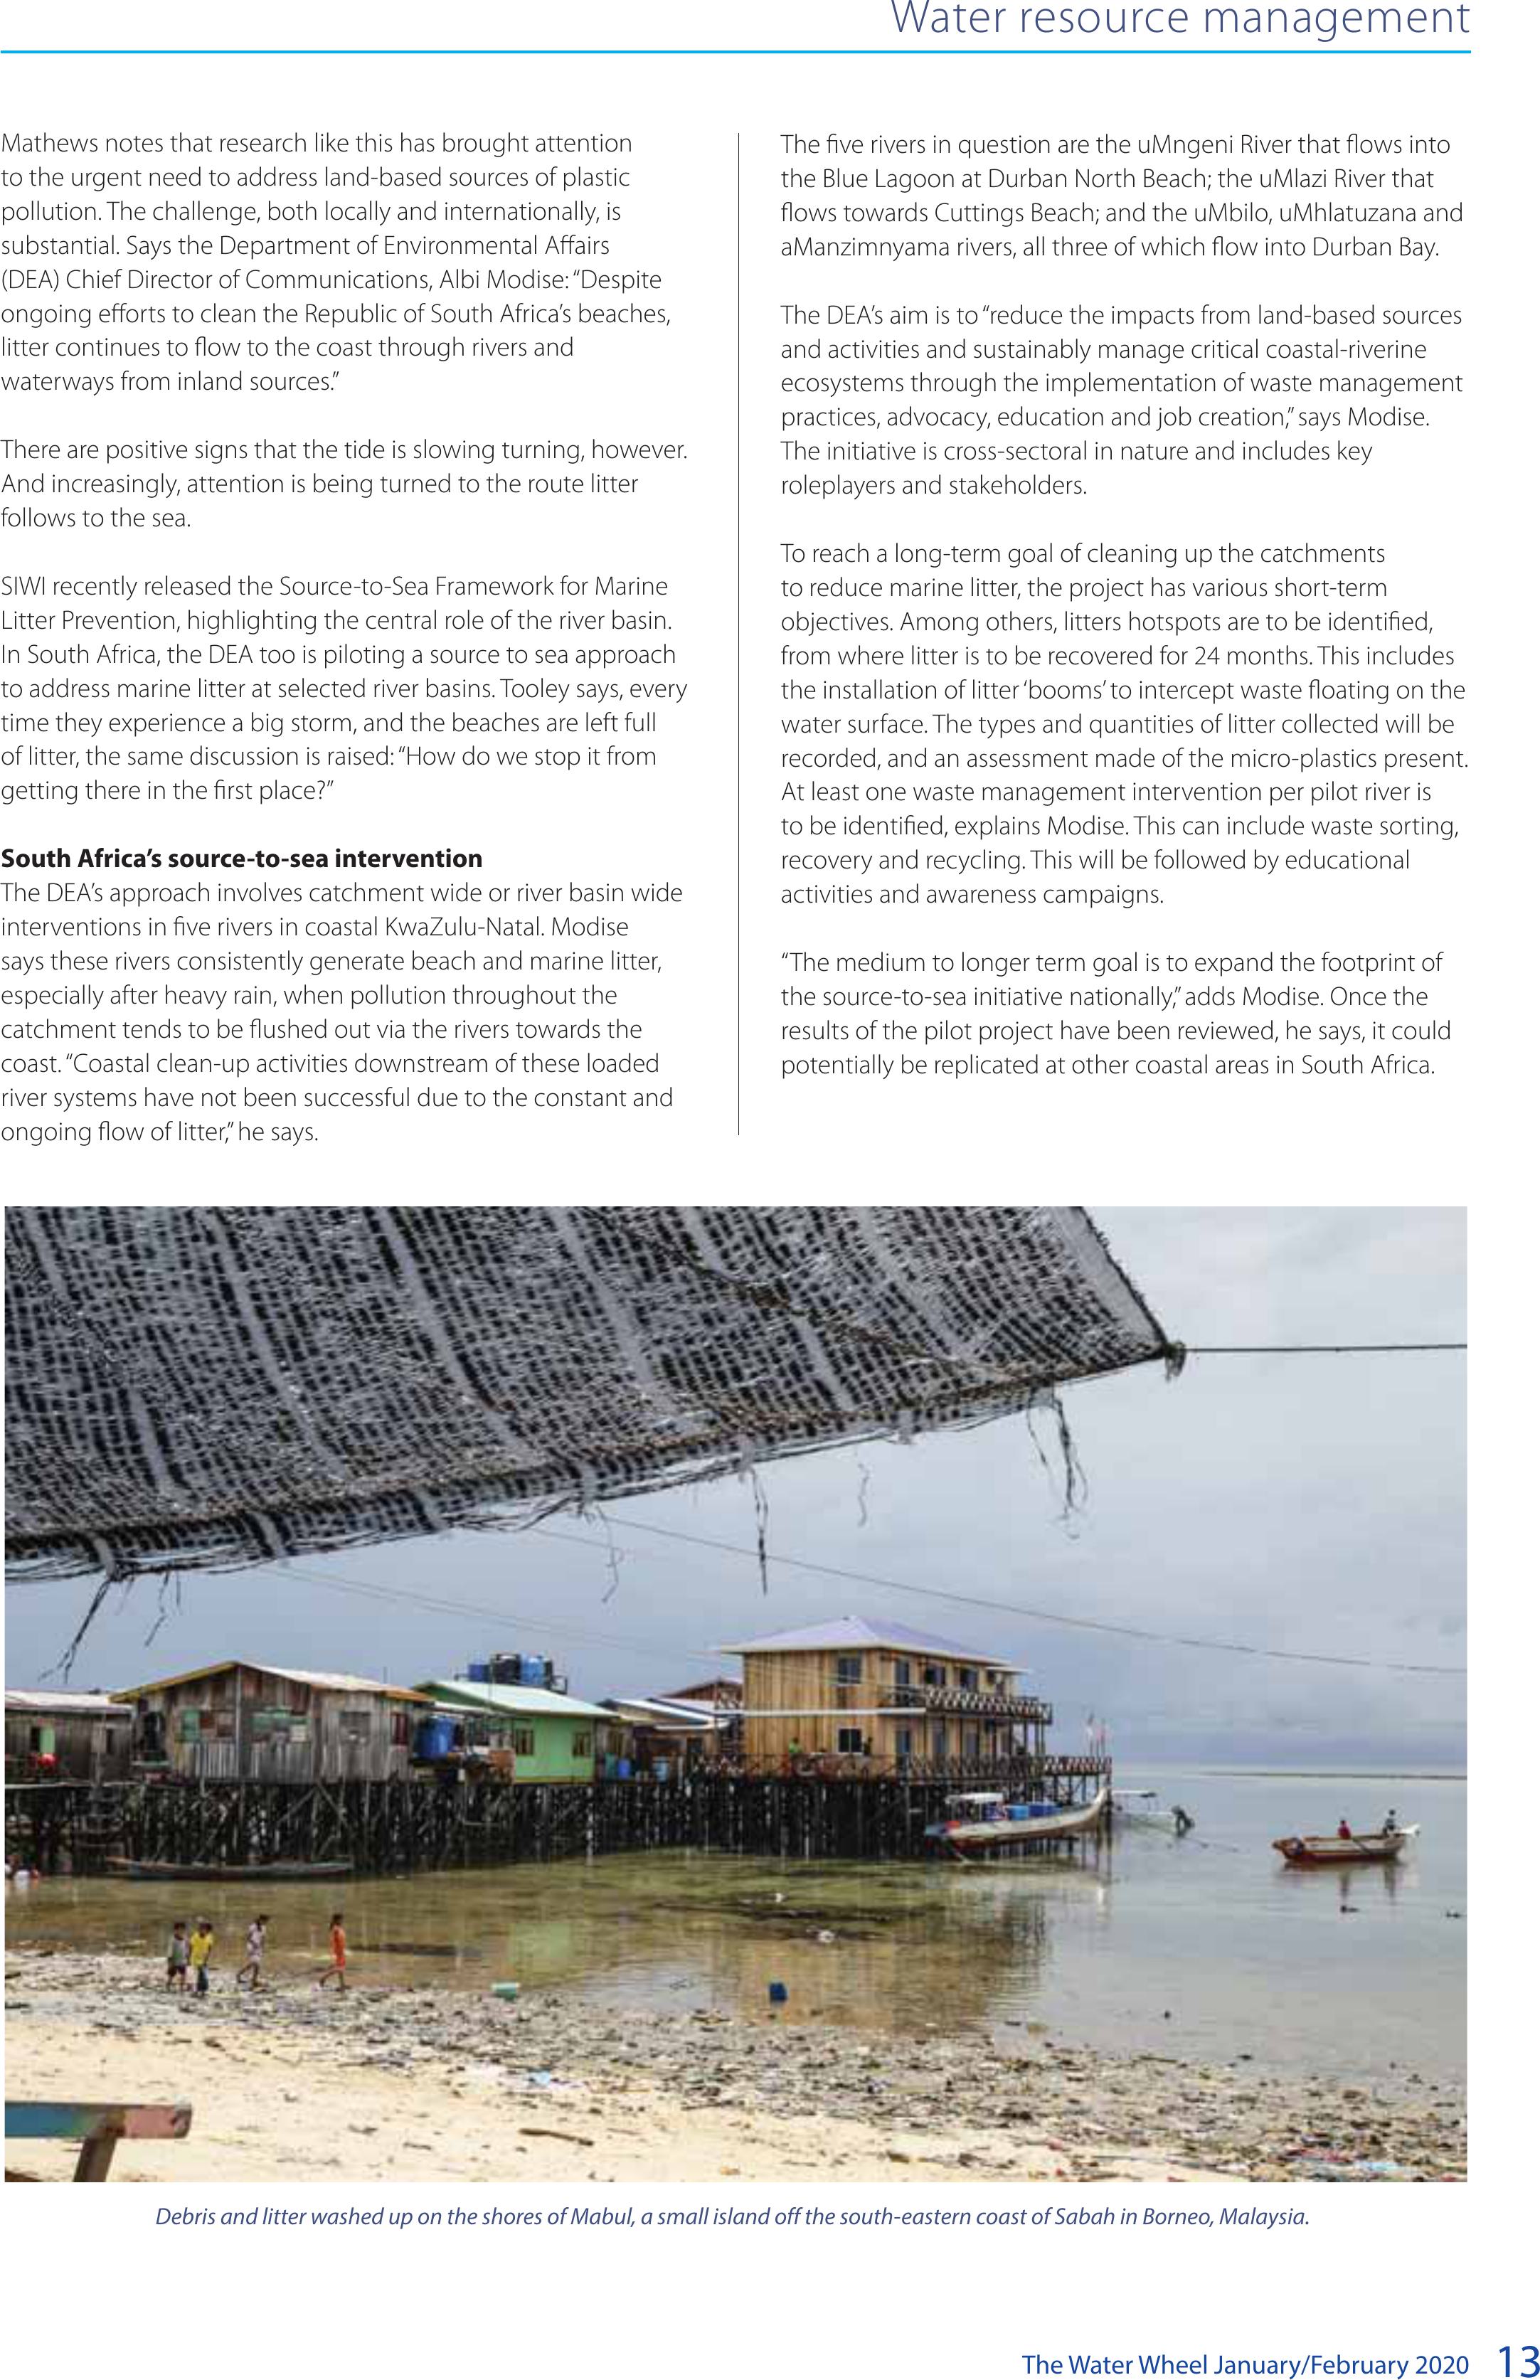
Debris and litter washed up on the shores of Mabul, a small island off the south-eastern coast of Sabah in Borneo, Malaysia.
The five rivers in question are the uMngeni River that flows into
the Blue Lagoon at Durban North Beach; the uMlazi River that
flows towards Cuttings Beach; and the uMbilo, uMhlatuzana and
aManzimnyama rivers, all three of which flow into Durban Bay.
The DEA’s aim is to “reduce the impacts from land-based sources
and activities and sustainably manage critical coastal-riverine
ecosystems through the implementation of waste management
practices, advocacy, education and job creation,” says Modise.
The initiative is cross-sectoral in nature and includes key
roleplayers and stakeholders.
To reach a long-term goal of cleaning up the catchments
to reduce marine litter, the project has various short-term
objectives. Among others, litters hotspots are to be identified,
from where litter is to be recovered for 24 months. This includes
the installation of litter ‘booms’ to intercept waste floating on the
water surface. The types and quantities of litter collected will be
recorded, and an assessment made of the micro-plastics present.
At least one waste management intervention per pilot river is
to be identified, explains Modise. This can include waste sorting,
recovery and recycling. This will be followed by educational
activities and awareness campaigns.
“The medium to longer term goal is to expand the footprint of
the source-to-sea initiative nationally,” adds Modise. Once the
results of the pilot project have been reviewed, he says, it could
potentially be replicated at other coastal areas in South Africa.
BACK TO TOP

The Water Wheel January/February 2020
14
Water resource management
“Ten rivers basins are responsible
for 90% of land-based leakages
to the ocean.”
Still, Modise admits that there are ample challenges, some
of which include the lack of waste management in informal
settlements, for which innovative solutions are necessary.
Another challenge is to change the communities’ behavior and
attitudes to not dump illegally, and to recycle, he says.
Mathews says they hope that their framework can help
address such challenges. “Ultimately the framework is aimed at
supporting local and national governments in gaining control
of plastic waste and guiding the investments of international
organizations, financiers, NGOs, and others who can bring
knowledge and financial resources and build awareness and
political will to address plastic leakage.”
The SIWI Source to Sea Framework
The Source-to-Sea Framework for Marine Litter Prevention
focuses specifically on addressing plastic leakage from river
basins. The framework calls for first, an understanding of the
sources, types, behaviour and impacts of plastic pollution in
riverine and marine environments. Then, stakeholders who are
impacted by, contribute to and provide solutions for plastic
leakage should be engaged.
Failures in governance, finance, management and operations
must be analysed. Commitment towards preventing plastic
pollution must be built. Then, action should be taken on
individual to global levels. Progress should be monitored and
learning fostered by doing and adapting. Transformation to
a circular economy must be supported. Last, the framework
should be applied to key challenges. This includes the many
other issues that contribute to the degrading of riverine and
marine environments, beyond poor solid waste management
and the uncontrolled consumption of plastic goods.
Such a source-to-sea approach takes a global concern, and filters
it down to local interventions, with the river basin at the core. At
the same time, the changes in behavior and practices on various
levels combined, can achieve a large improvement in river basins
that will ultimately filter back again, to the oceans.
“My hope is that the Source-to-Sea Framework for Marine Litter
Prevention will be used in river basins around the world to
establish the governance, management, finance, and behaviours
that will gain control of plastic waste and prevent plastic leakage
from river basins,” notes Mathews.
“Initially, investments should be made to improve solid waste
management locally,” she says. For this, stakeholders at global,
national, and regional levels who can bring financial solutions
and build the political will to address these challenges must
be engaged. Simultaneously, a circular economy that will
There are many sources of marine litter, including from the sea itself, in the form of material lost at sea, or deliberately left there or on the beaches and shores,
such as fishing gear and cargo.
BACK TO TOP

The Water Wheel January/February 202015
Water resource management
add value to plastic must be developed. This will shift plastic
waste management from disposal to reuse and recycling, she
says. “The framework supports this two-pronged approach
of strengthening local management of plastic waste while
developing a circular economy globally.”
SIWI is currently piloting the framework in two locations, namely
the Vu Gia – Thu Bon River basin in Vietnam and Lake Hawassa
basin in Ethiopia. “We have held stakeholder workshops and
capacity training and have received strong interest in using the
framework to address plastic leakage,” explains Mathews. The
project will be continuing into 2020.
Components of a good plan to solve marine litter
According to Modise, research shows that reducing the amount
of mismanaged waste by 50% in the top 20 countries where the
most marine litter and waste originates from, would result in a
nearly 40% decline in inputs of plastic to the ocean. And, he says,
the research also suggests that solutions to the growing problem
of plastic pollution are possible, given sufficient resources and
commitment.
For any such success the whole community has to involved, says
Tooley, including residents, government, the private sector and
businesses. He adds that a convincing factor is the cost avoided
should marine litter not exist. These could include the cost of
collecting the waste from the marine and beach environment,
and the harbours, for example. “It’s cheaper to get it out of the
system before it gets into the system,” he explains. “If we can
get that right, we won’t even have to talk about marine waste.”
Concludes Tooley, the cheapest wat to get rid of the problem, is
to tackle it at the source.
Minh Hai in the Vu Gia – Thu Bon River basin in Vietnam.
SIWI
Sources:
• Plastic Pollution in the World’s Oceans: More than 5 Trillion
Plastic Pieces Weighing over 250,000 Tons Aoat at Sea by
M Eriksen, LCM Lebreton, HS Carson, M Thiel, CJ Moore, JC
Borerro, et al published in PLoS ONE (2014)
• Plastic waste inputs from land into the ocean, by Jenna R.
Jambeck, Roland Geyer, Chris Wilcox, Theodore R. Siegler,
Miriam Perryman, Anthony Andrady, Ramani Narayan and
Kara Lavender Law published in Science,13 February 2015
• Solving marine pollution - Successful models to reduce
wastewater, agricultural runo, and marine litter, a World
Bank report by Olha Krushelnytska, September 2018
• Source-to-Sea Framework for Marine Litter Prevention:
Preventing Plastic Leakage in River Basins by RE Mathews,
R.E. & J. Stretz, 2019 for the Stockholm International Water
Institute (SIWI)
BACK TO TOP
The Water Wheel January/February 2020
16
Feature
WATER RESOURCES
At the beginning of December, residents of Port Elizabeth and
adjacent towns in the Nelson Mandela Bay (NMB) Municipality
were facing another holiday season of harsh water restrictions
due to the ongoing drought. Yet the situation was not quite as
dire as might be expected from the area’s startlingly low dam
levels.
Two weeks earlier the level of the second largest dam, the
Krom River’s Impofu Dam, had fallen below the lowest intake
point, which meant that its water was no longer accessible.
Subsequently, good rains in the catchment caused the small
Churchill Dam, 21 km upstream, to overflow, and by 2 December
this water had raised the level of the Impofu Dam a percentage
point to 17.5%. The larger Kouga Dam (previously called the
Paul Sauer Dam) on the Kouga River stood at 32.8% – a huge
improvement from the record low of 6.7% in July 2018.
But it is thanks to planning initiated a decade ago that there
is room for optimism. In 2008 the then Department of Water
Affairs, in collaboration with Nelson Mandela Bay (NMB)
Port Elizabeth – Planning, engineering and science combine to
avoid Day Zero
Forward planning for the Algoa Bay Water Supply System has helped reduce the risk of a
drought-induced ‘Day Zero’ in Port Elizabeth. Article by Sue Matthews.
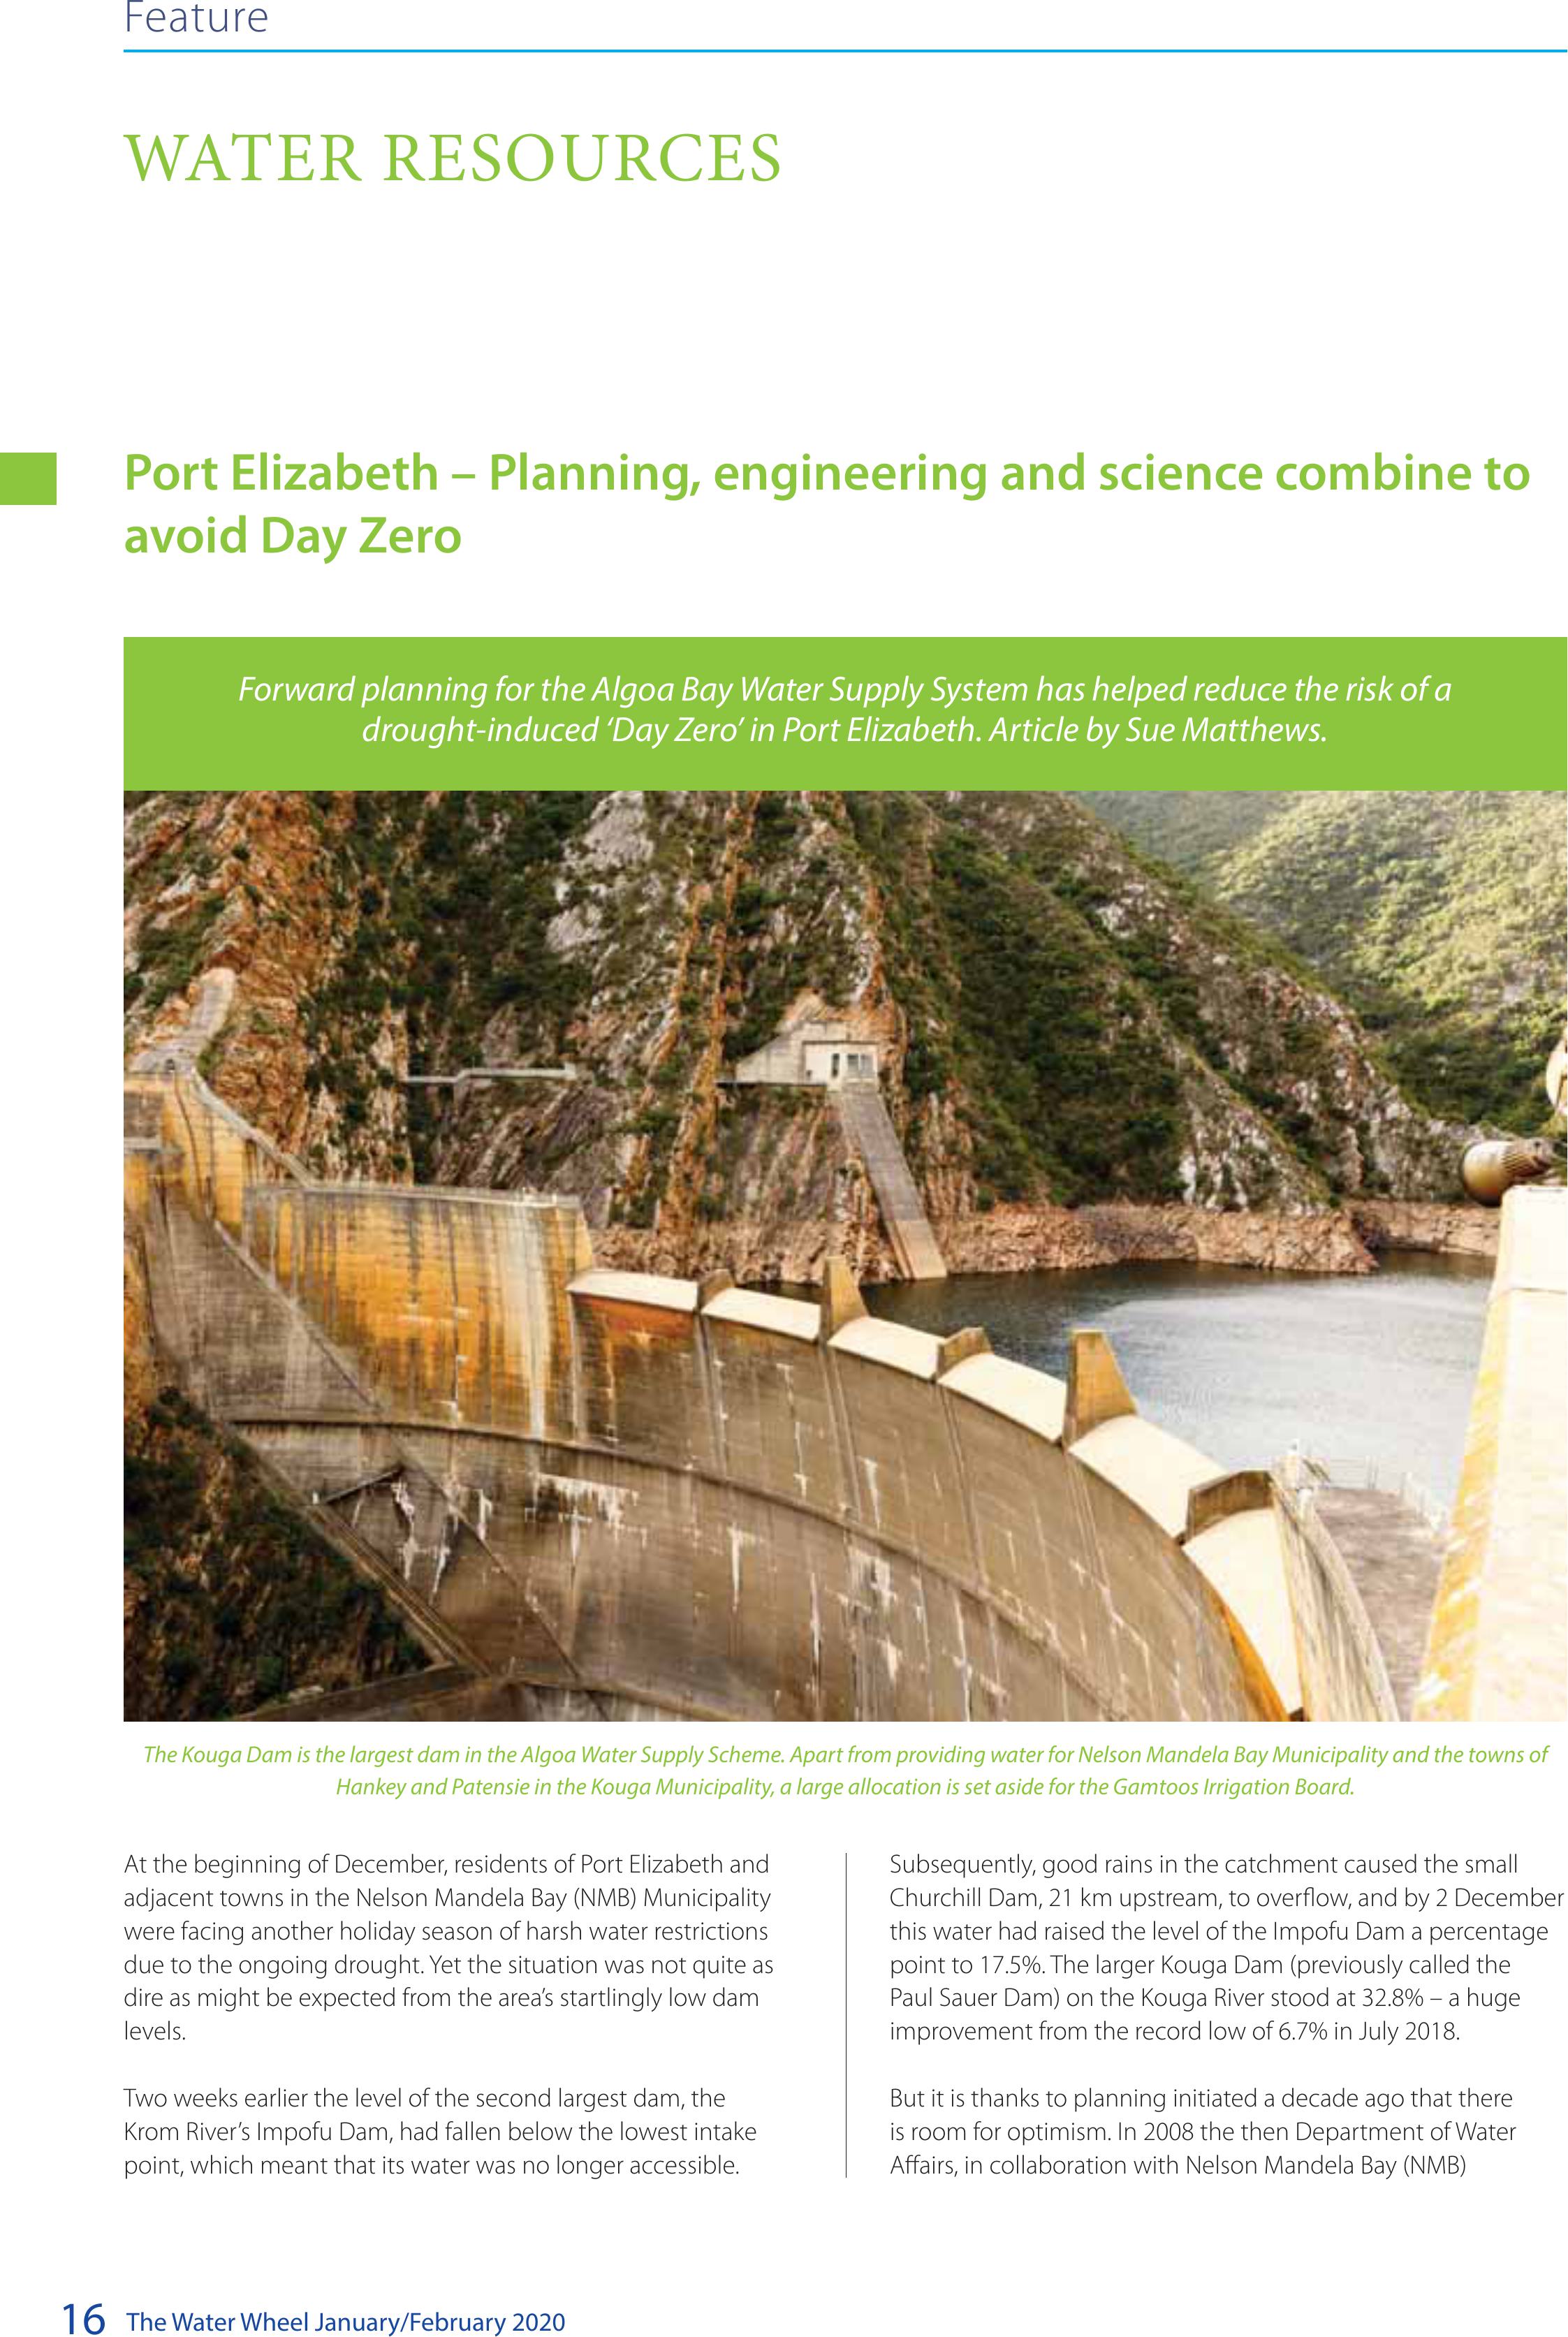
The Kouga Dam is the largest dam in the Algoa Water Supply Scheme. Apart from providing water for Nelson Mandela Bay Municipality and the towns of
Hankey and Patensie in the Kouga Municipality, a large allocation is set aside for the Gamtoos Irrigation Board.
BACK TO TOP

The Water Wheel January/February 202017
Municipality, commissioned the Algoa Reconciliation Strategy
Study to ensure a sustainable future supply from the Algoa Water
Supply System, which serves the area extending from the Kouga
River system in the west to the Sundays River system in the east.
The study was completed in April 2010, but updated in April
2011 to address emergency interventions planned as a result
of the 2009-2011 drought, as well as the anticipated water
requirements of the Coega Industrial Development Zone (IDZ).
Since then, a strategy steering committee set up to monitor
implementation of the study recommendations and update
them as necessary has continued to meet regularly. Technical
support has been provided by Aurecon, which also conducted
the reconciliation strategy study with the assistance of AfriCoast
Engineers, Palmer Development Group, Groundwater Africa,
MGP Consulting, and Scherman Colloty & Associates.
The final report of the reconciliation strategy study identified a
number of potential interventions and made recommendations
about their order of priority. Among others, they included
options for water re-use (using treated wastewater from the
existing Fishwater Flats wastewater treatment works and
planned Coega wastewater treatment works) and desalination
(of both seawater and Sundays River irrigation return flows),
some of which were investigated further and either ruled out
as not feasible or put on the backburner, being unaffordable or
impractical at this time. For example, environmental approval
for the rezoning and development of the Coega IDZ was
conditional upon treated wastewater being used as a source of
industrial water supply. But the NMB Municipality does not have
the funds to implement this – and the IDZ does not yet have
any big industry players with significant water requirements – so
currently there is only limited re-use from the Fishwater Flats
wastewater treatment works, mainly by the surrounding Deal
Party industries.
The reconciliation strategy study supported the fast-tracking
of the Nooitgedacht Low-Level Scheme, an extension of the
existing Nooitgedacht High-Level Scheme that treats water
from the Gariep Dam, delivered via the Orange-Fish-Sunday’s
transfer system. Although Treasury made R450 million of
emergency drought funding available to the NMB Municipality
in 2011, this still left a massive shortfall. Phase 1 was completed
by mid-2013, but numerous delays due to funding issues
meant that Phase 2 was only completed in mid-2017, and the
completion date for the final Phase 3 has recently been pushed
back to April 2021. National government has footed the bill,
but the total cost has escalated by some R300 million over the
past decade. Nevertheless, the scheme is designed to provide
an average of 160 Mℓ potable water per day for distribution
by the NMB Municipality, which is a significant contribution.
Water restrictions, leak repairs and pressure management had
succeeded in reducing potable water use to approximately
280 Mℓ per day in November 2019 – it had risen to 345 Mℓ per
day in 2017, before the current drought took hold.
The reconciliation strategy study also supported the NMB
Municipality’s emergency intervention to investigate
groundwater resources close to existing infrastructure.
Dr Ricky Murray of Groundwater Africa explains that he was
asked by the municipality to start looking for areas with
promising groundwater potential in 2010. Two years previously
– before the 2009-2011 drought began – he had completed a
Water Research Commission (WRC) project on the development
of a GIS-based approach for identifying municipal groundwater
exploration target areas. The final report, co-authored with Marc
Goedhart and Jane Baron, was titled High-yielding groundwater
areas around the Nelson Mandela Bay Municipality (WRC
Report No. TT 327/08), and it focused on areas within an
economically acceptable distance of existing water-supply
pipelines and electricity sources. This was a desktop study that
drew upon an earlier WRC and Council for Geoscience project by
Goedhart, Small and Hulley, completed in 2004.
Water resources
The main dams supplying Port Elizabeth and other towns in the Nelson Mandela Bay Municipality and the Kouga Municipality. There are also a number
of smaller dams, plus water is transferred from the Gariep Dam on the Orange River via the Orange-Fish-Sundays interbasin transfer scheme to the
Nooitgedacht water treatment works.
BACK TO TOP

The Water Wheel January/February 2020
18
Water resources
The area to the north of the Port Elizabeth central business
district, extending along the coast to the Coega IDZ and inland
to Uitenhage, has long been recognised as an important
groundwater area. This is the Uitenhage Artesian Basin, which
was so heavily exploited for irrigation in the first half of the 1900s
that it was declared a Subterranean Government Water Control
Area in 1957. Subsequently, the basin was extensively researched
in a variety of projects, and the findings on its hydrogeology
were synthesised by Maclear in a paper published in Water SA in
2001.
The basin is divided into two independent systems, separated
by the Coega Fault. To the north is the relatively shallow Coega
Ridge Aquifer, subject to large-scale abstraction to supply some
outlying suburbs and the town of Uitenhage, while the much
deeper Swartkops Aquifer to the south is relatively underutilised.
Interestingly, in 1909 a borehole drilled there in search of oil
struck artesian groundwater at a depth of 1 082 metres, and 55°C
water, rich in iron and manganese, gushed to the surface. This
put paid to the oil exploration at the site, but the Zwartkops Spa
was established instead, and later upgraded to a swish hotel that
incorporated ‘mineral baths’ and a drinking fountain for those
who wanted to ‘take the waters’. In 1965 the borehole’s steel
casing rusted through and groundwater leaked under artesian
pressure at a rate of 13 ℓ/s into the surrounding sediments, so
the Department of Water Affairs drilling division grout-sealed the
borehole a few years later to prevent further loss of groundwater
from the aquifer.
This very deep borehole is believed to have tapped into water
from the basal bedrock – the fractured quartzitic sandstones of
the Table Mountain Group’s Peninsula Formation. The Formation
can be seen buckled up as mountain ranges inland, but it dips
below the surface at the coast, apart from isolated outcrops at
Coega Kop and the Algoa Bay islands. Murray and his team knew
that the section of the Coega Fault close to Coega Kop offered
the potential to access this TMG Aquifer water much closer to
the surface than the kilometre-deep Zwartkops borehole. But
first they had to find it.
Dr Murray explains that in the 1970s a wide swath depicting
the fault zone had been mapped by the state oil-exploration
company SOEKOR from data collected during seismic surveys,
but pinpointing the exact location of the main Coega Fault
would require some additional detective work.
“The challenge was trying to look with geophysics through
about 200 metres of soft material to find a near-vertical fault
below that,” says Dr Murray. “It really was like trying to find a
needle in a haystack, but the haystack was buried 200 metres
below the ground! And since you’re looking for a near-vertical
target, if you’re off by a few metres you can miss it.”
First he commissioned Dr Edgar Stettler – a geological
consultant and University of the Witwatersrand honorary
professor – to re-interpret SOEKOR’s seismic data and construct a
3D model of the Coega Fault.
“That put it in a zone about a kilometre wide, which got us in the
right area, and then we did a gravity survey to try and narrow it
down to a point where we could do more precise geophysics.”
He explains that the gravity survey was conducted with a
handheld metre that is used to take density readings, since the
quartzitic rock has a higher density than the soft Cretaceous
sediments that had filled the displaced area at the fault zone. The
gravity model developed from the survey results allowed them
to narrow their target down to a 200 metre wide zone.
“Again, that doesn’t help us pinpoint a near-vertical fault, but it
told us where to focus our geophysics efforts. Then we tried a
variety of different methods, and the one that gave us the most
precise data to work with at depth was magnetotellurics.”
Magnetotellurics, or MT, makes use of natural variations of the
Earth’s magnetic and electric fields, caused by solar wind and
lightning strikes, to measure the electrical resistivity of the
subsurface.
“Essentially, you use electrodes to measure the differences in the
conductance of the rocks in a particular area,” explains Dr Murray.
“Quartzites are far more resistive to electrical currents than the
more clay-rich, younger Cretaceous sediments, which conduct
electricity very easily.”
Ensuring accurate and noise-free results meant that the
electricity supply to the area had to be switched off for six hours,
but the MT survey allowed the team to peg the position of the
faults. In 2014 they drilled a number of exploration boreholes,
and made a massive strike that confirmed they were on the right
track in targeting the Coega Fault. In late 2018 they returned to
start drilling production boreholes, and on 21 March 2019 they
The initial spa at the kilometre-deep Zwartkops borehole in 1914 was
replaced by a swish ‘sanatorium’ hotel in 1936.
BACK TO TOP

The Water Wheel January/February 202019
hit their target at a depth of 265 metres. A second borehole was
drilled at the site and the combined drilling yield of these two
holes was 150 ℓ/s.
Drilling of all five production boreholes that make up the Coega
Kop Wellfield is now complete. The boreholes have not yet been
test pumped, but initial indications are good as their combined
drilling yield is 357 ℓ/s. The groundwater cannot yet be fed
into the NMB Municipality’s water supply system because – like
the Zwartkops Spa ‘mineral waters – it is very high in iron and
manganese.
Treating it to meet SANS 241 standards is best done in a
dedicated biofiltration plant, similar to the 10 Mℓ per day
Preekstoel plant in Hermanus, which treats groundwater tapped
from the Overstrand Municipality’s Gateway and Hemel en Aarde
wellfields. The Coega Kop plant will have the capacity to treat
20 Mℓ per day, and although its design has been completed – by
Aurecon, using some innovative 3D modelling and virtual reality
(VR) tools – construction has not yet started.
Given that the current drought will probably have broken before
the plant is up and running, why should the groundwater
development work provide any cause for optimism?
Dr Murray explains that using drought-relief funding provided
by National Treasury to NMB Municipality, the groundwater team
drilled over 23 km of boreholes between late 2018 and mid-
2019, both in the Port Elizabeth city limits and further afield. They
included, for example, areas close to reservoirs and hospitals, on
the Churchill Dam property and St Georges Park Cricket Ground,
as well as in the Bushy Park area, which the 2008 WRC study had
highlighted as the top priority.
“The total drilling yield was just under 1000 ℓ/s and the results
are still being analysed to finalise production yields,” he says. “But
there are some boreholes that could potentially be equipped
very rapidly and brought online if the water supply situation got
really bad. At the same time, National Treasury also gave Kouga
Municipality drought-relief funding, and we drilled boreholes for
them too. Since their towns of Jeffreys Bay, Humansdorp, Hankey
and Patensie all partly depend on water from the Algoa Bay
Water Supply System, the increased groundwater use by Kouga
Municipality will relieve pressure on the surface water supply, to
the benefit of the Port Elizabeth metro.”
Water resources
Groundwater spurts up from a depth of 265 m in the first strike at a
production borehole at the Coega Kop wellfield.
Ricky Murray of Groundwater Africa led a field trip to the Coega Kop
wellfield as part of the GWD 2019 Groundwater Conference, held in Port
Elizabeth in October 2019.
BACK TO TOP

The Water Wheel January/February 2020
20
Connecting to water in a dry Johannesburg
“My grandmother often extolled the powers of sea water and
it was not uncommon in our house to find bottles of ocean
water reverently stashed away. These stashed bottles seemed
to represent an extra layer of protection over the family,” says
Confidence Joseph, a PhD student at the Oceanic Humanities
for the Global South project based at the Wits Institute for Social
and Economic Research (WISER). “She also believed that there
were benevolent as well as malevolent water gods who could
either bless or smite, depending on how one related with them.
Decades later, finding myself in Johannesburg, my connection
with water has not changed much. This should not be surprising
considering that Johannesburg is as dry and land-locked as
Bulawayo.”
Joseph recently presented her paper on how water, and the
absence of it, can help us think differently about the plight of the
global citizen. A student of African Literature, she says she also
wanted to show that there are alternative ways of replenishing
ourselves in waterless spaces like Bulawayo and Johannesburg.
One is through stories of water spirits who defy time and space,
and make their presence felt in urban and modernised settings.
Her talk was one of a series of lectures, screenings, live musical
performances, immersive installations, live readings and public
city walks led by artists and scholars. Called Holding Water, the
programme was a collection of interpretations of the politics and
poetics of ocean flow, from the perspective of Johannesburg.
Petro Kotzé explores how stories and art can keep the city of gold, and the people that live there,
connected to water.
WATER AND SOCIETY
Feature
BACK TO TOP

The Water Wheel January/February 202021
The project is also investigating how our stories and histories
can help us understand each other, our past, and the current
environmental crisis we are experiencing.
A city far from the coast, but close to the ocean
Charne Lavery, research associate at WISER (and lecturer at the
University of Pretoria), says thinking about the ocean from the
perspective of land-locked Johannesburg is not that far-fetched.
“Despite the paradox of the ocean versus the landlocked city,
they are connected,” she says. Hints of Johannesburg’s unlikely
connection to the sea are scattered throughout its streets. For
one, it’s home to Africa’s largest dry port. Reportedly, more than
half of the cargo received at our seaports at Durban and Cape
Town lands at the City Deep container terminal. Hurrying along
the transport of goods between land and sea, it’s our only inland
terminal where customs clearance takes place.
Then there was the South African Institute for Maritime Research,
a shadowy apartheid-era paramilitary force, the existence of
which emerged during the Truth and Reconciliation Committee
meetings. Once, Wemmerspan in the South of Johannesburg
was home to one of our two inland navy bases (the SAS Rand
Naval Base). Back in the day, the best restaurant was known to be
the Carlton Hotel’s Three Ships.
The city’s very location connects it to the sea. Straddling the
watershed that divides the Limpopo and Orange rivers’ basins,
rain falling north of Johannesburg’s Parktown ridge drains
into the Limpopo River to flow towards the Indian Ocean.
Rain falling south of the ridge, again, drains into the Vaal River
and eventually into the Atlantic. Lavery says their research has
shown that Johannesburg itself is located on what was once a
prehistoric ocean floor.
The connection can also be drawn to environmental impacts.
“It seems out of sight and out of mind, but it’s not,” she
maintains. The impact of climate change, for one, will also be
felt in Johannesburg. Possible droughts are connected to the
hydrological cycles that start in the ocean. Johannesburg may
also, in future, become waterlogged again, as a dry island amid
rising seas or sunk into acid mine water.
Environmental humanities analyse and investigate exactly this -
the complex interrelationships between human activity (cultural,
economic and political) and the environment.
Oceanic humanities for the global south
Within this field, oceanic humanities engage with the human
and non-human aspects of the ocean. Oceanic Humanities
for the Global South, in particular, focuses on themes of
decolonialism. Critical of knowledge dictated by the Euro-
North point of view, global maritime trade and the oceanic
environment is instead approached from the viewpoint of the
Indian Ocean and other southern seas.
This approach favours South-South connections instead of the
history of European explorers that came to Africa. “Indian Ocean
studies puts the Indian Ocean at the centre, highlighting links
between Africa, India and the Arab world,” notes Lavery.
Within this field of academia, scholars have recently started to
call for critical ocean studies, she adds. Not only should we speak
about themes of decolonisation, but it should include critical
environmental issues. Lavery says, “It’s asking how to think about
environmental and social justice at the same time.”
The Holding Water programme was part of WISER’s attempt to
engage a broader public in this field of thought. They want to
“bridge the gap between ivory tower academia and the wider
public.”The events took place throughout Johannesburg, in
collaboration with POOL, described as an emergent platform for
curatorial and artistic production, experimentation and research,
working with artists to support and commission new work.
Taking oceanic humanities to the streets of the city
One of WISER’s aims is to provide a platform for experts from
different fields to collaborate, and then to develop the ideas
that emerge. Lavery, for example, specialises in oceanic literary
studies, but the project includes varied experts across fields that
include visual art, maritime archaeology and architectural history.
As such, the topics presented throughout the programme varied
vastly, but all of them approached Johannesburg’s relation to
oceans and water.
Jonathan Cane is a Mellon Postdoctoral Fellow in Oceanic
Humanities at Wits, with research interests in landscape art,
architectural modernism, post-colonialism and urban queer
studies. His presentation, ‘Concrete Oceans’ is part of a larger
research project investigating concrete and modernity in the
Global South. Cane explains that so far, he has written about
the use of precast concrete panels in Chile, high-rise concrete
structures in Maputo and the London Zoo’s concrete penguin
pool.
“The focus of ‘Concrete Oceans’ is to apply an oceanic humanities
lens to my broader project,” he explains. “This means looking at
the relationship between the southern oceans and concrete
through a 1964 invention called the dolos.” Cane says this
modular interlocking ‘coastal armour’ works to attenuate wave
energy and thereby stabilise the water-land relationship.
“Through my analysis of the history of this invention, I offer a
critical reading of apartheid science and technology and hope
to suggest alternative ways of conceptualising the ocean-earth
binary.”
WISER senior researcher, Dr Pamela Gupta’s research interests
include connecting Lusophone India (Goa) and Africa,
Water and society
Johannesburg is located on top of an escarpment which functions as a
continental drainage divide or watershed.
BACK TO TOP

The Water Wheel January/February 2020
22
ethnographies of decolonisation, heritage tourism and visual
cultures. She chose to approach the Holding Water project
through Johannesburg’s public pools, “precisely because
they hold water in some sense in a dry land-locked city like
Johannesburg.” Gupta says this city’s aridity is always related
to its wetness, and as a Johannesburg resident and regular
swimmer for the last 15 years, she has continually gone in search
of it in places that she is also fond of frequenting, and where
she knows she can find and feel water. “I think this viewpoint of
Joburg is valuable because swimming pools hold many of the
city’s complex histories within its infrastructural borders, those
of apartheid (whiteness), sexuality, freedom, (black) leisure, and
disrepair.”
During her talk, Gupta presented a series of contemplations on
Johannesburg’s public pools which, for some residents, is the
closest thing to an ocean they have in the city. Gupta says “pools
supply/provide water oases in cities, yet they are as evil as they
are gentle and tranquil, and portend our dry futures in an era of
the Anthropocene. I am reminded of flying into Cape Town in
March 2017 and seeing eerily empty swimming pools from my
aerial view window seat.”
In reference to a series of paintings of abandoned pools by artist
Willem Pretorius, Gupta says: “That so many dried up pools exist
(and have been captured on canvas by Pretorius), scattered
throughout South Africa’s barren landscape suggest they are an
important part of Joburg’s landscape of ruination, decay, and
abandonment, much like its leftover mines. They too portend
an anthropogenic future of dramatic climate change and water
restrictions, a future Joburg in which, during crises (such as
the one that hit Cape Town in 2017, suggesting that Joburg
is perhaps not so far off), the filling of pools will be strictly
forbidden except for the chosen few, a luxury in a sea of dryness,
thus producing an aerial view of a landscape littered with mostly
empty squares and circles.”
Lavery notes that personal experiences, individual beliefs and
cultural representations such as those presented during Holding
Water are important in order for us to understand diverse views
and contribute to deeper understanding of the environmental
issues we are currently experiencing.
The importance of stories in our world today
“If you don’t engage with hidden stories and histories to deal
with the aftermath of colonisation, you cannot understand
where people come from, or try and instill positive change,” she
says. As example, Lavery mentions different culture’s historical
experiences with beaches. In Mozambique, for example, the
beach is, among other things, the place where people were
taken away from their homes during the slave trade. “Beaches are
not only a places of leisure, but also of deep historical wounds.”
This perspective was one of the many explored during the
programme. The below is an excerpt from the poem ‘Water’ by
Koleka Putuma published in Collective Amnesia (part of the list
of suggested reading for one of the Holding Water events):
Water and society
Johannesburg’s connection with water goes much further than its water reservoirs.
BACK TO TOP

The Water Wheel January/February 202023
Water and society
If you don’t engage with hidden stories and histories to deal with the aftermath
of colonisation, you cannot understand where people come from, or try and instill
positive change.
BACK TO TOP

The Water Wheel January/February 2020
24
“I often wonder why I feel as if I’m drowning every time I look out
into the sea,
this and feeling incredibly small.
And I often hear this joke
about Black people not being able to swim,
or being scared of water.
We are mocked
and we have often mocked ourselves
for wiping our faces the way that we do when we come out of
the water.
Compare to how they do it, all Baywatch-like,
And how we so ratchet-like with our postures and kink.
Yet every time our skin goes under,
it’s as if the reeds remember that they were once chains,
and the water, restless, wishes it cold spew all of the slaves and
ships onto shore,
whole as they boarded, sailed and sunk.
Their tears are what have turned the ocean salty,
This is why our irises burn every time we go under.”
If you do not engage that history, you cannot demand that
people help conserve and keep the ocean clean, says Lavery.
“The humanities and arts angle is one of the resources that we
have to think through our ecological crisis.”
Yet, she thinks there’s more to it. “There’s something deeper to
these symptomatic reactions that we’re swiftly cycling though,”
she says, in reference to the suite of issues like the hole in the
ozone layer, the use of plastic straws and acid mine drainage
that have received so much public attention for relatively short
periods of time. “There seems to be a panicked, short-term view
of the environmental crisis as its hitting people.” In comparison,
environmental humanities calls for a long-term, vigorous view of
what is happening in our culture, what brought us to this crisis,
how we talk about it and the metaphors we use to describe it.
“Good historical and cultural research needs to be done,” she
says. “We have to learn what the metaphors and stories are
that can have damaging and empowering effects.” Stories have
power, she maintains, “and we need to understand how stories
work in order to help us harness them as one of the tools to
solve our environmental problems.”
While the Holding Water programme has come to an end, Lavery
says they are considering more events for next year. Updates will
be posted on the Wits Institute for Social and Economic Research
Facebook website, the Oceanic Humanities for the Global South
Facebook page, and the mailing list and social media of the
POOL project.
Water and society
Artist Willem Pretorius’s style can best be described as observational realism. His work can be seen as a type of visual diary
where he documents a specic time and place in our history and in doing so, remembering. It also reminds us of our own
transience and mortality. Everything is temporary.
BACK TO TOP

The Water Wheel January/February 202025
Feature
ECOLOGICAL INFRASTRUCTURE
South Africa is among the most water scarce countries per capita
in the world, a situation which is made more complicated by
the uneven distribution of water availability across the country.
Rainfall varies from over 1 900 mm in the east of the country and
in the mountainous areas, to almost zero in the west and north-
west of the country.
With an average rainfall of less than 500 mm/year, and significant
annual and seasonal variability, only 9% ends up as water in
rivers and aquifers (DWAF, 2013). Like precipitation, runoff
is highly variable in both space and time. Much of South
Africa’s water is generated in small areas identified as Strategic
Water Source Areas (SWSAs) for surface water (SWSA-sw) and
groundwater (SWSA-gw) (see map elsewhere).
These areas are considered strategically important at a national
level for water and economic security for the country, supporting
growth and development needs. The transboundary SWSA-sw
cover only 10% of the country’s land surface area but produce
50% of its surface runoff and most of its groundwater recharge,
sustaining most of the perennial rivers.
The SWSA-gw cover around 9% of the land surface of South
Africa and account for up to 42% of the baseflow. Sustained
Investing in ecological infrastructure to improve drought
resilience and enhance water security
Chantel Petersen, Lindie Smith-Adao, David Le Maitre, Nebo Jovanovic
Strategic Water Source Areas for surface water and groundwater in South Africa, Lesotho and Swaziland (Le Maitre et al., 2018).
BACK TO TOP

The Water Wheel January/February 2020
26
river flows are important because they support people and
communities who depend directly on rivers for their water,
especially during droughts. Society obtains many water-related
benefits from water source areas, including water for urban and
industrial purposes, and for irrigation. Water from these areas are
also critical for cooling at the power stations, which generate
most of South Africa’s electricity (Le Maitre et al., 2018).
South Africa’s water security therefore depends not only on our
built or hard water infrastructure but also on well-managed land
in our catchments. Most of the cost-effective, hard infrastructure
options such as large-scale dams and pipeline schemes are
exploited in key catchment areas, with planners historically
relying heavily on such engineering solutions to secure the
country’s water security.
Healthy wetlands, rivers and groundwater ecosystems in
the multi-purpose landscape will however make our future
more water secure. They are ecological infrastructure that can
generate and deliver significant improvements in water quantity
and quality if we look after them. Ecological infrastructure
refers to naturally functioning ecosystems that deliver valuable
services to people, such as fresh water (water purification),
climate regulation, soil formation and disaster risk reduction
(e.g. flood attenuation and drought mitigation). It is the nature-
based equivalent of built infrastructure, and is just as important
for providing services and underpinning socio-economic
development.
Investing in water-related ecological infrastructure in
conjunction with built infrastructure, will deliver more clean
water from our land. Investments are particularly important in
our SWSAs where ecological infrastructure assets are under-
protected and degrading. Currently only 11% of all water source
areas fall within protected areas. Investment in this kind of
infrastructure includes clearing invasive alien vegetation like pine
trees and black wattle from mountains, rivers and wetlands as
well as river and wetland rehabilitation (Figure 1).
Ecological infrastructure
Figure 1: Examples of benefits flowing to society from investing in ecological infrastructure (after SANBI, 2014).
Water security underpins economic development but is at risk from the pressures created by a growing population, land degradation and
an increasingly variable climate (CSIR, 2010 and 2015). Many predictions of climate change have been made and they have improved over
time, but some uncertainty still remains (Pearce, 2014).
What is certain is that our climate is changing based on the overwhelming evidence of its impacts and knock-on effects observed in many
sectors of the environment including cities. Climate change is shifting rainfall patterns, causing increases in temperatures and accelerating
the risks of extreme weather events across the country.
Recent droughts that occurred in the Southern African region (2015-2017) exacerbated issues of water scarcity and equitable water
allocation in the country. The drought, which started in 2015, was a result of the combined effects of a severe drought and a strong El Nino
event (Baudoin et al., 2017). This has resulted in some South African Provinces declared as disaster areas (e.g. KwaZulu-Natal), declines in
harvest being experienced, which resulted in the necessity to import crops, and heavy water restrictions were implemented to cope with
dwindling water resources and the need to adapt to the “new normal” of water scarcity.
The Western Cape Province and the City of Cape Town in particular experienced one of its worst droughts ever during 2015 to 2017. Water
shortages occurred with low dam levels experienced (e.g. Theewaterskloof Dam) and six levels of water restrictions were imposed as a
means to reduce usage and conserve water (Booysen et al., 2019).
BACK TO TOP
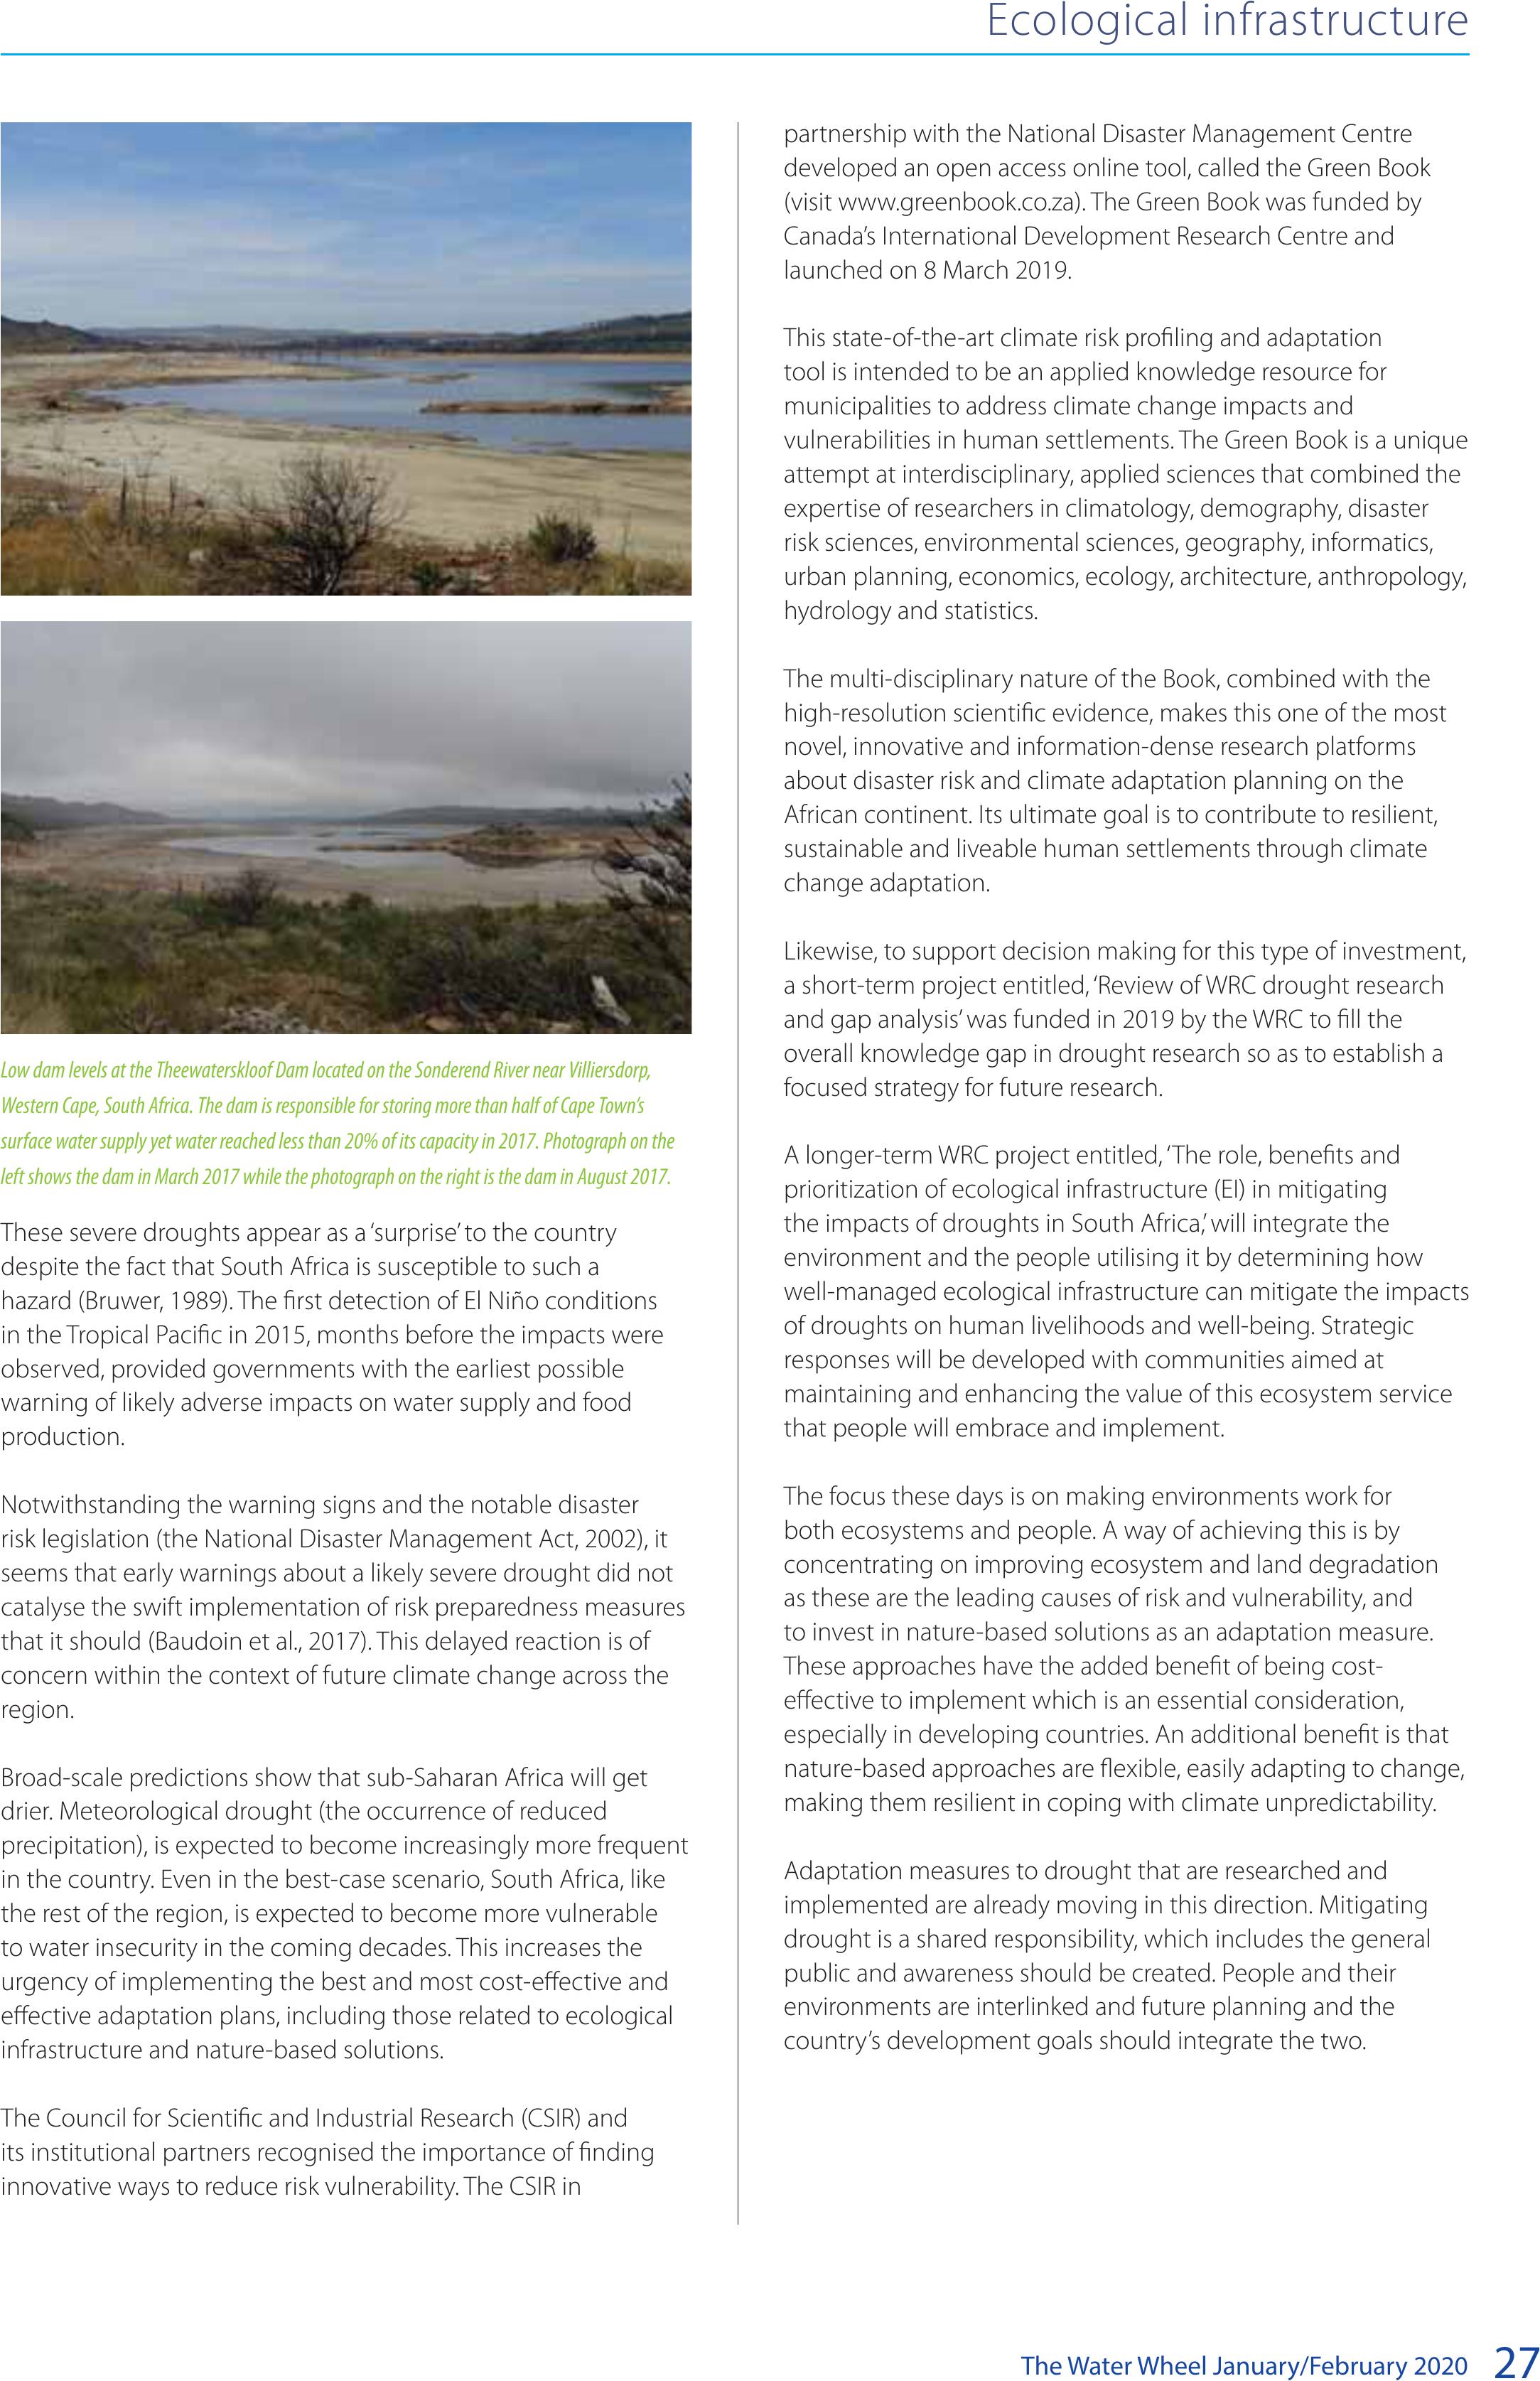
The Water Wheel January/February 202027
partnership with the National Disaster Management Centre
developed an open access online tool, called the Green Book
(visit www.greenbook.co.za). The Green Book was funded by
Canada’s International Development Research Centre and
launched on 8 March 2019.
This state-of-the-art climate risk profiling and adaptation
tool is intended to be an applied knowledge resource for
municipalities to address climate change impacts and
vulnerabilities in human settlements. The Green Book is a unique
attempt at interdisciplinary, applied sciences that combined the
expertise of researchers in climatology, demography, disaster
risk sciences, environmental sciences, geography, informatics,
urban planning, economics, ecology, architecture, anthropology,
hydrology and statistics.
The multi-disciplinary nature of the Book, combined with the
high-resolution scientific evidence, makes this one of the most
novel, innovative and information-dense research platforms
about disaster risk and climate adaptation planning on the
African continent. Its ultimate goal is to contribute to resilient,
sustainable and liveable human settlements through climate
change adaptation.
Likewise, to support decision making for this type of investment,
a short-term project entitled, ‘Review of WRC drought research
and gap analysis’ was funded in 2019 by the WRC to fill the
overall knowledge gap in drought research so as to establish a
focused strategy for future research.
A longer-term WRC project entitled, ‘The role, benefits and
prioritization of ecological infrastructure (EI) in mitigating
the impacts of droughts in South Africa,’ will integrate the
environment and the people utilising it by determining how
well-managed ecological infrastructure can mitigate the impacts
of droughts on human livelihoods and well-being. Strategic
responses will be developed with communities aimed at
maintaining and enhancing the value of this ecosystem service
that people will embrace and implement.
The focus these days is on making environments work for
both ecosystems and people. A way of achieving this is by
concentrating on improving ecosystem and land degradation
as these are the leading causes of risk and vulnerability, and
to invest in nature-based solutions as an adaptation measure.
These approaches have the added benefit of being cost-
effective to implement which is an essential consideration,
especially in developing countries. An additional benefit is that
nature-based approaches are flexible, easily adapting to change,
making them resilient in coping with climate unpredictability.
Adaptation measures to drought that are researched and
implemented are already moving in this direction. Mitigating
drought is a shared responsibility, which includes the general
public and awareness should be created. People and their
environments are interlinked and future planning and the
country’s development goals should integrate the two.
These severe droughts appear as a ‘surprise’ to the country
despite the fact that South Africa is susceptible to such a
hazard (Bruwer, 1989). The first detection of El Niño conditions
in the Tropical Pacific in 2015, months before the impacts were
observed, provided governments with the earliest possible
warning of likely adverse impacts on water supply and food
production.
Notwithstanding the warning signs and the notable disaster
risk legislation (the National Disaster Management Act, 2002), it
seems that early warnings about a likely severe drought did not
catalyse the swift implementation of risk preparedness measures
that it should (Baudoin et al., 2017). This delayed reaction is of
concern within the context of future climate change across the
region.
Broad-scale predictions show that sub-Saharan Africa will get
drier. Meteorological drought (the occurrence of reduced
precipitation), is expected to become increasingly more frequent
in the country. Even in the best-case scenario, South Africa, like
the rest of the region, is expected to become more vulnerable
to water insecurity in the coming decades. This increases the
urgency of implementing the best and most cost-effective and
effective adaptation plans, including those related to ecological
infrastructure and nature-based solutions.
The Council for Scientific and Industrial Research (CSIR) and
its institutional partners recognised the importance of finding
innovative ways to reduce risk vulnerability. The CSIR in
Ecological infrastructure
Low dam levels at the Theewaterskloof Dam located on the Sonderend River near Villiersdorp,
Western Cape, South Africa. The dam is responsible for storing more than half of Cape Town’s
surface water supply yet water reached less than 20% of its capacity in 2017. Photograph on the
left shows the dam in March 2017 while the photograph on the right is the dam in August 2017.
BACK TO TOP

The Water Wheel January/February 2020
28
Water scenarios for the future: A glimpse of what is to come
Change is taking place in the climate system and this could have
a significant impact on the future of water and agriculture.
This reality has been highlighted in the latest research on South
Africa’s water management scenarios for the future. Experts from
the University of the Free State (UFS) have been researching the
different drivers and enablers that could determine South Africa’s
water futures. This has enabled them to come up with four
detailed scenario’s that can now inform policy responses and
adaptation practices.
This project, funded by the Water Research Commission (WRC),
provides a glimpse of what is to come in future decades.
Prof Andries Jordaan, a research fellow at the UFS, led this
comprehensive scenario-building process. The researchers
considered key trends and drivers reshaping the water and
agricultural future and the road ahead. They also investigated
different policy responses and decision-making concerning
water realities.
“The challenge now and in the future is to produce more food
with the same quantity of water or less given the depleting
state of water resources in the country,” Prof Jordaan said. “It is
empirical to promote the productivity of agricultural water use
to enhance agricultural output and increase the contribution of
the sector to the economy.”
The paradigm of scarcity
There are major challenges with water availability and quality
across the country. South Africa is expected to face a water
deficit of 17% by 2030, and this shortage will only be worsened
by climate change.
South Africa receives 450 mm of rain a year, which is half the
global rainfall average. Only 12% of the land area generates
50% of available surface water resources. Pollution remains a
serious problem, causing water quality and quantity problems
in various regions. Most of the major urban hubs and industrial
developments are also situated far from the country’s larger
watercourses, which necessitates large-scale transfers of water
across catchments.
Decadal rainfall variability also results in extended periodic dry
and wet periods across the country. As the country’s water
resources become more constrained, the amount of water
Taking into account future uncertainties, what kind of realities do we need to adapt to ensure we
use our water resources sustainably while promoting economic development and food security?
Jorisna Bonthuys reports on the latest research looking at the country’s future water management
scenarios.
WATER RESOURCES
Feature
BACK TO TOP
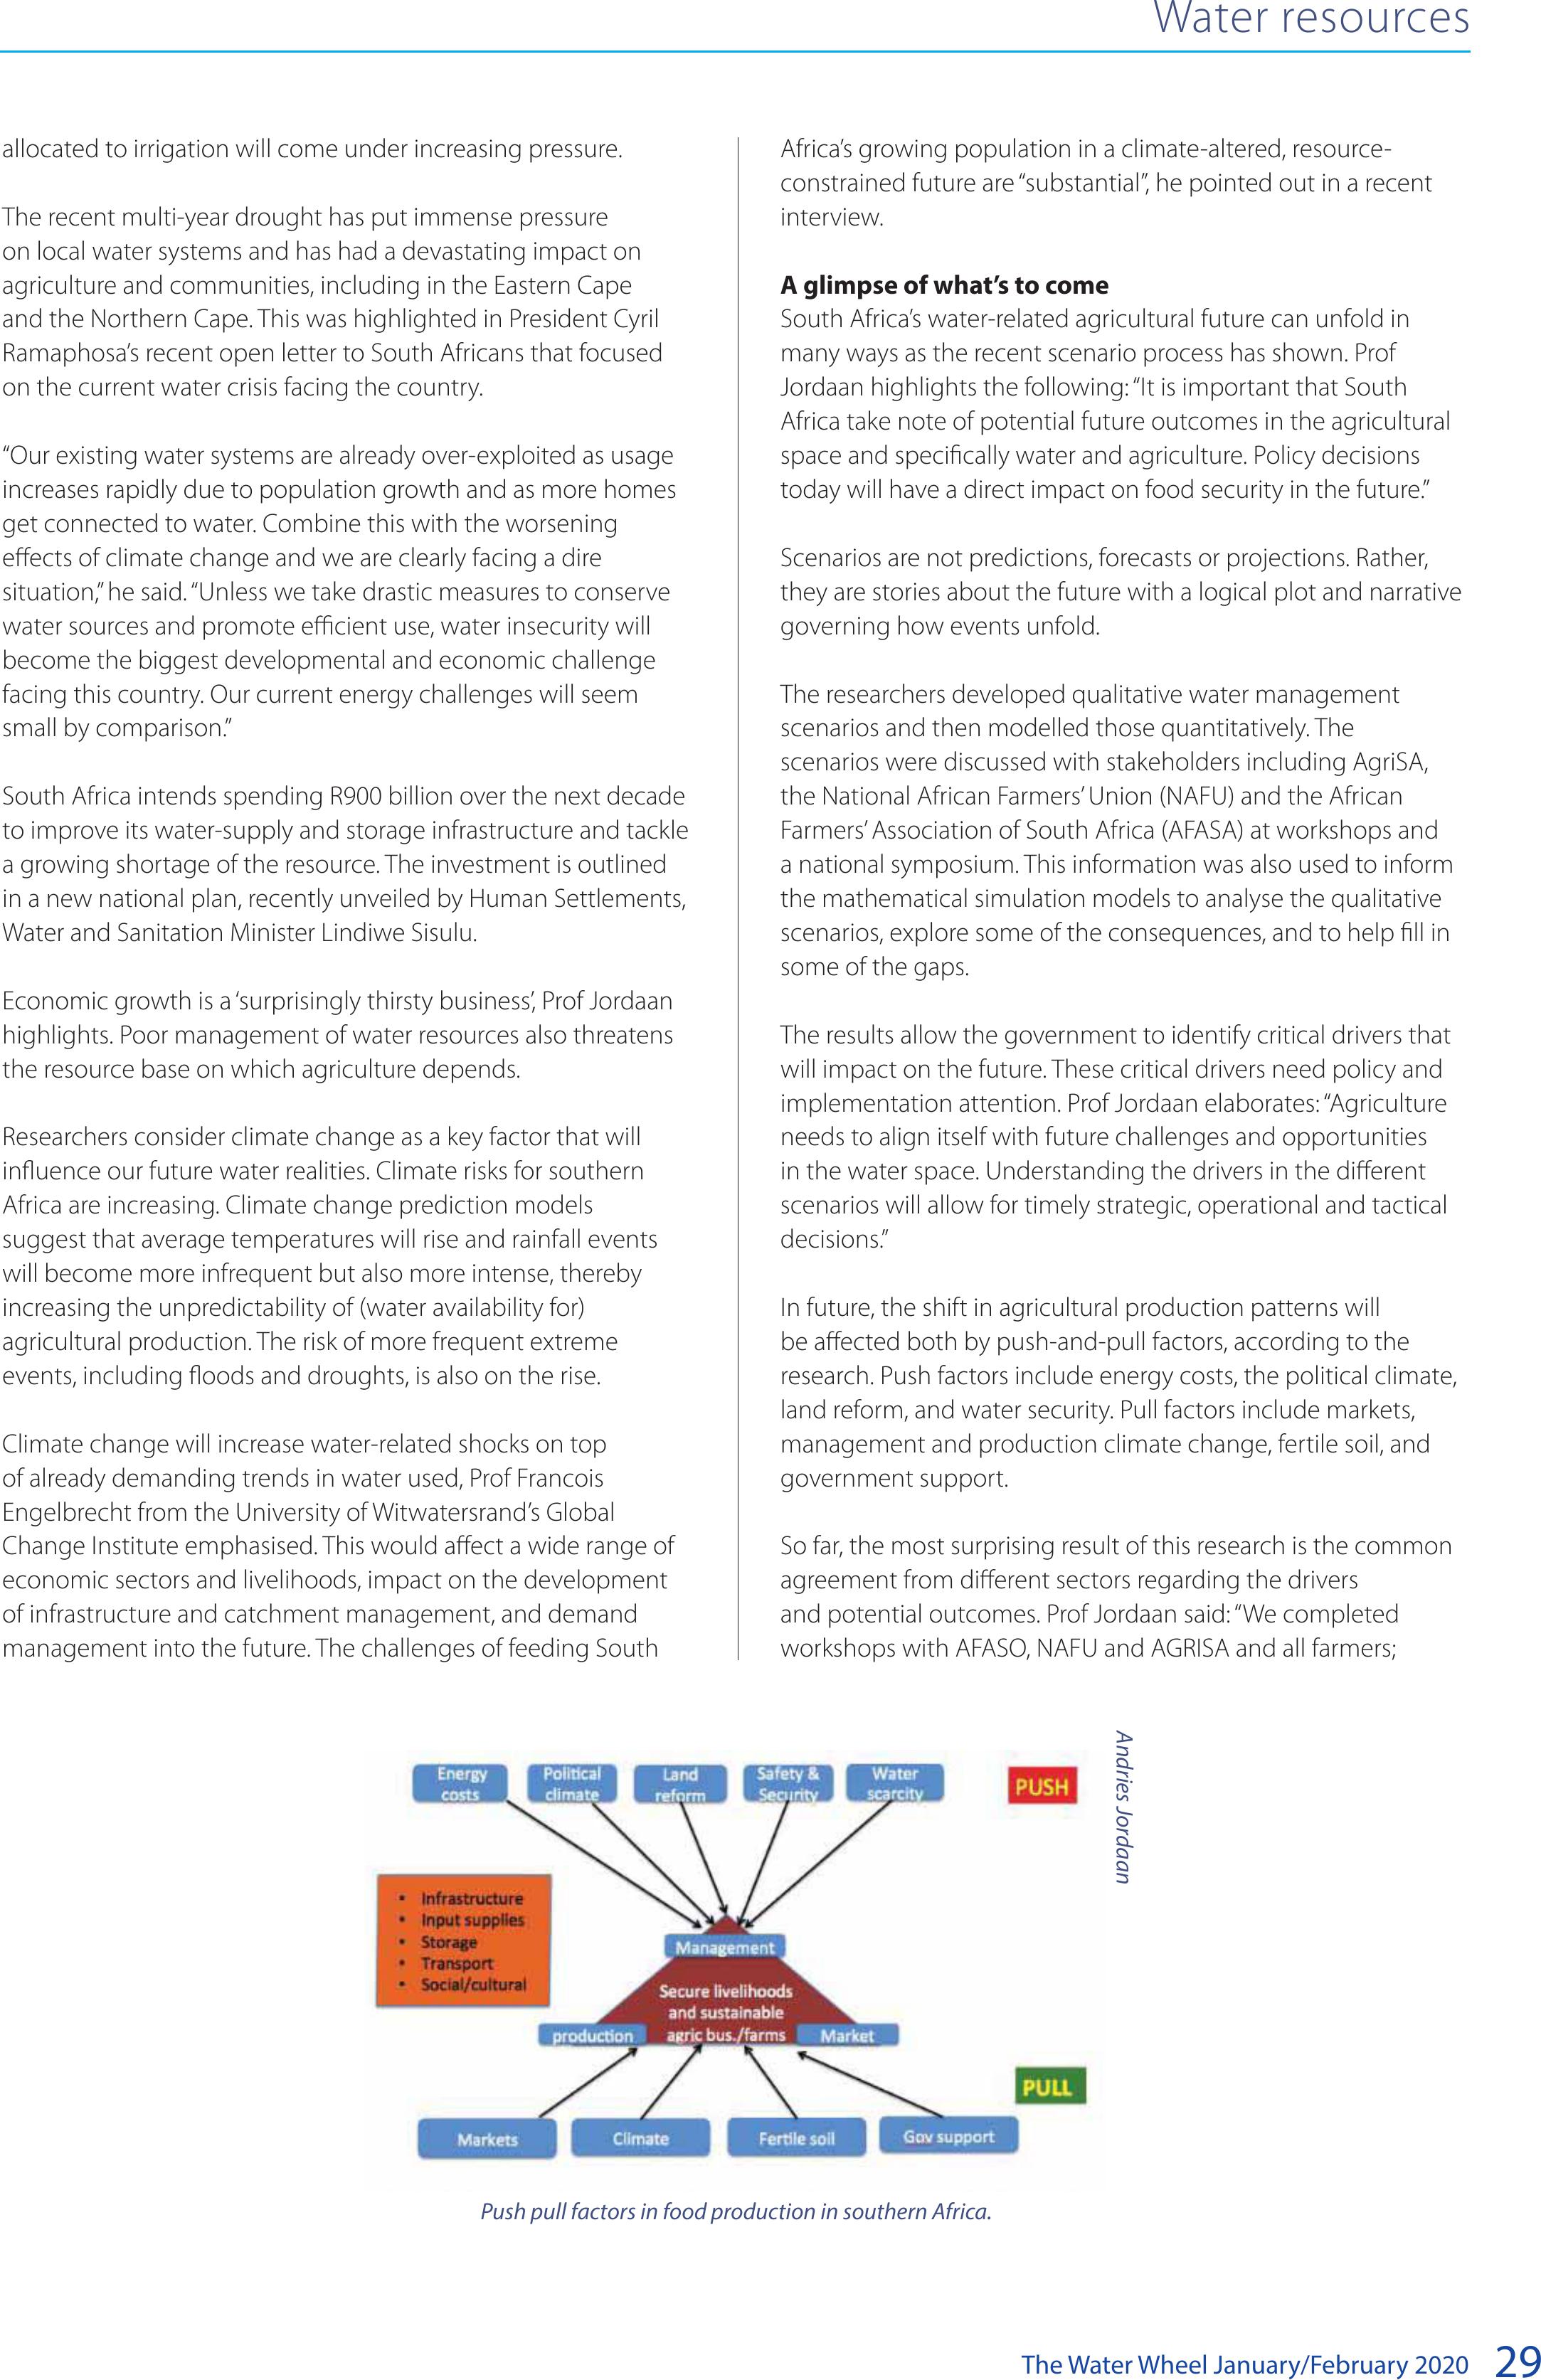
The Water Wheel January/February 202029
Africa’s growing population in a climate-altered, resource-
constrained future are “substantial”, he pointed out in a recent
interview.
A glimpse of what’s to come
South Africa’s water-related agricultural future can unfold in
many ways as the recent scenario process has shown. Prof
Jordaan highlights the following: “It is important that South
Africa take note of potential future outcomes in the agricultural
space and specifically water and agriculture. Policy decisions
today will have a direct impact on food security in the future.”
Scenarios are not predictions, forecasts or projections. Rather,
they are stories about the future with a logical plot and narrative
governing how events unfold.
The researchers developed qualitative water management
scenarios and then modelled those quantitatively. The
scenarios were discussed with stakeholders including AgriSA,
the National African Farmers’ Union (NAFU) and the African
Farmers’ Association of South Africa (AFASA) at workshops and
a national symposium. This information was also used to inform
the mathematical simulation models to analyse the qualitative
scenarios, explore some of the consequences, and to help fill in
some of the gaps.
The results allow the government to identify critical drivers that
will impact on the future. These critical drivers need policy and
implementation attention. Prof Jordaan elaborates: “Agriculture
needs to align itself with future challenges and opportunities
in the water space. Understanding the drivers in the different
scenarios will allow for timely strategic, operational and tactical
decisions.”
In future, the shift in agricultural production patterns will
be affected both by push-and-pull factors, according to the
research. Push factors include energy costs, the political climate,
land reform, and water security. Pull factors include markets,
management and production climate change, fertile soil, and
government support.
So far, the most surprising result of this research is the common
agreement from different sectors regarding the drivers
and potential outcomes. Prof Jordaan said: “We completed
workshops with AFASO, NAFU and AGRISA and all farmers;
allocated to irrigation will come under increasing pressure.
The recent multi-year drought has put immense pressure
on local water systems and has had a devastating impact on
agriculture and communities, including in the Eastern Cape
and the Northern Cape. This was highlighted in President Cyril
Ramaphosa’s recent open letter to South Africans that focused
on the current water crisis facing the country.
“Our existing water systems are already over-exploited as usage
increases rapidly due to population growth and as more homes
get connected to water. Combine this with the worsening
effects of climate change and we are clearly facing a dire
situation,” he said. “Unless we take drastic measures to conserve
water sources and promote efficient use, water insecurity will
become the biggest developmental and economic challenge
facing this country. Our current energy challenges will seem
small by comparison.”
South Africa intends spending R900 billion over the next decade
to improve its water-supply and storage infrastructure and tackle
a growing shortage of the resource. The investment is outlined
in a new national plan, recently unveiled by Human Settlements,
Water and Sanitation Minister Lindiwe Sisulu.
Economic growth is a ‘surprisingly thirsty business’, Prof Jordaan
highlights. Poor management of water resources also threatens
the resource base on which agriculture depends.
Researchers consider climate change as a key factor that will
influence our future water realities. Climate risks for southern
Africa are increasing. Climate change prediction models
suggest that average temperatures will rise and rainfall events
will become more infrequent but also more intense, thereby
increasing the unpredictability of (water availability for)
agricultural production. The risk of more frequent extreme
events, including floods and droughts, is also on the rise.
Climate change will increase water-related shocks on top
of already demanding trends in water used, Prof Francois
Engelbrecht from the University of Witwatersrand’s Global
Change Institute emphasised. This would affect a wide range of
economic sectors and livelihoods, impact on the development
of infrastructure and catchment management, and demand
management into the future. The challenges of feeding South
Water resources
Push pull factors in food production in southern Africa.
Andries Jordaan
BACK TO TOP

The Water Wheel January/February 2020
30
emerging, communal, small-scale and commercial is largely in
agreement of the key drivers and potential outcomes in the
water sector and that agriculture is not governed properly.”
Scenarios for the future
Prof Jordaan and his team identified four basic scenarios. These
include the ‘Traditional scenario’, the ‘Best-case scenario’, the ‘Z
scenario’ and the ‘Frustration scenario’.
The Z scenario is the result of poor leadership in both the
political and water environment with low education standards
and a private sector that withdraw from the national discourse
due to extreme polarisation between the private sector and
the government. In this scenario, South Africa will experience
a continuous recession, with negative economic growth.
Unemployment will increase dramatically and the safety and
security situation will get out of hand. Violent civil unrest will be
a daily occurrence with security forces (SAPS and SANDF) using
deadly force to control the masses. South Africa will become a
net importer of food. This is the chaos scenario – very similar to
Zimbabwe today.
In this scenario, South Africa experiences water shortages,
hyperinflation and disinvestment in agriculture. This scenario,
really a worst-case scenario, leads to food insecurity, land
grabs, and a poor, small-scale agricultural sector. Commercial
farmers move to other countries and food-importing increases
significantly. At the same time, water infrastructure is not
maintained, and rivers and dams are heavily polluted. The ‘Day
Zero’ threat becomes a reality for urban areas and agriculture
during dry periods.
The frustration or polarisation scenario is the result of
poor governance and political leadership with a strong private
sector that is still functioning in a hostile political climate. More
people are educated and civil society takes responsibility for
its functioning. The gap between the haves and have-nots
will continue to increase with the poor totally dependent on
the State, who is nationalising all resources. In this scenario,
researchers foresee slow economic growth of about 2%, which is
mainly driven by the private sector. Production from commercial
agriculture will slow down with many farmers investing in other
countries. South Africa will become a net importer of staple food
5 out of every 10 years.
In this scenario, the gap between the haves and the have-nots
increases. Poor enforcement of policies and laws, conflict about
water use and unequal access to water could also become
more pronounced. Only the private sector will benefit from the
advantages of the fourth industrial revolution (4IR) with the
State still working with outdated systems and not able to apply
regulations and policies. The private sector will take responsibility
for water management where it is possible, but many towns
and cities will experience Day Zero scenarios during dry periods
because of poor management at all governance levels. The
private sector will, however, also invest the bulk of their funds in
other countries. Agriculture will be heavily taxed with high water
and electricity tariffs.
In the traditional scenario, political leadership takes strong
action to reduce corruption and increase productivity and good
governance in the State. Distrust remains high between the
private sector and the government. This scenario will see slow
economic growth with less than 2% and little innovation in the
water sector. Food insecurity will increase, and the country will
become a net importer of staple food 7 out of every 10 years.
In this scenario, South Africa becomes a welfare state. Land and
other resources are nationalised with new farmers having no title
deeds for their land. It entails centralised water management
and policies, low productivity and innovation in agriculture as
well as increased competition between water users. Farmers
do not trust government and food production will slow down,
with many farmers investing in other countries. The smallholder
sector will increase dramatically with the government enforcing
more socialist policies.
The best-case scenario is the result of strong leadership,
good governance, more people receiving a good education
and a private sector who work together with the government
to reduce unemployment rates and increase efficiency in
production and water use through innovative technologies.
Economic growth increases to more than 5% annually. All
sectors and people have equal access to water resources. The
smallholder sector received good extension support from the
government and the commercial agricultural sector actively
assist with mentoring new farmers. South Africa remains a net
exporter of food, even during dry years. The exchange rate is
stable and global markets reacted positively to developments in
the country.
In this scenario, decentralised water management is embraced
by water management agencies. New water infrastructure
is built with the newest technologies. Current infrastructure
is well — maintained and pollution levels in all rivers and
dams are within limits. In this scenario, there is good regional
collaboration in terms of water management, decentralised
water management through water management agencies and
efficient institutions that manage water resources.
There is strong enforcement of water user guidelines, and
water management authorities are efficient. There is also good
collaboration between the private sector and the state where
water is concerned. The country as a whole benefits from the 4IR.
Where are we heading?
The strength of the scenarios is that it considers all drivers that
might impact on the future and the classification of the drivers
into different clusters allows researchers to systematically analyse
all drivers. The weakness of this process is that it remains looking
into the future between different extremes.
“We cannot for sure say which scenario we will experience 10
years from now,” Prof Jordaan said. “The global economy and
political landscape, as well as our own political landscape, is just
too unpredictable and unstable to tell for sure where we are
going. What we can do now is identify the drivers that will push
us into the direction of the Z-scenario and address those as a
priority and implement the drivers that will put us on a path to
the best-case scenario.”
“Until recently, we were definitely leading to the Z-scenario
or frustration scenario,” Prof Jordaan continued. “That is where
Water resources
BACK TO TOP
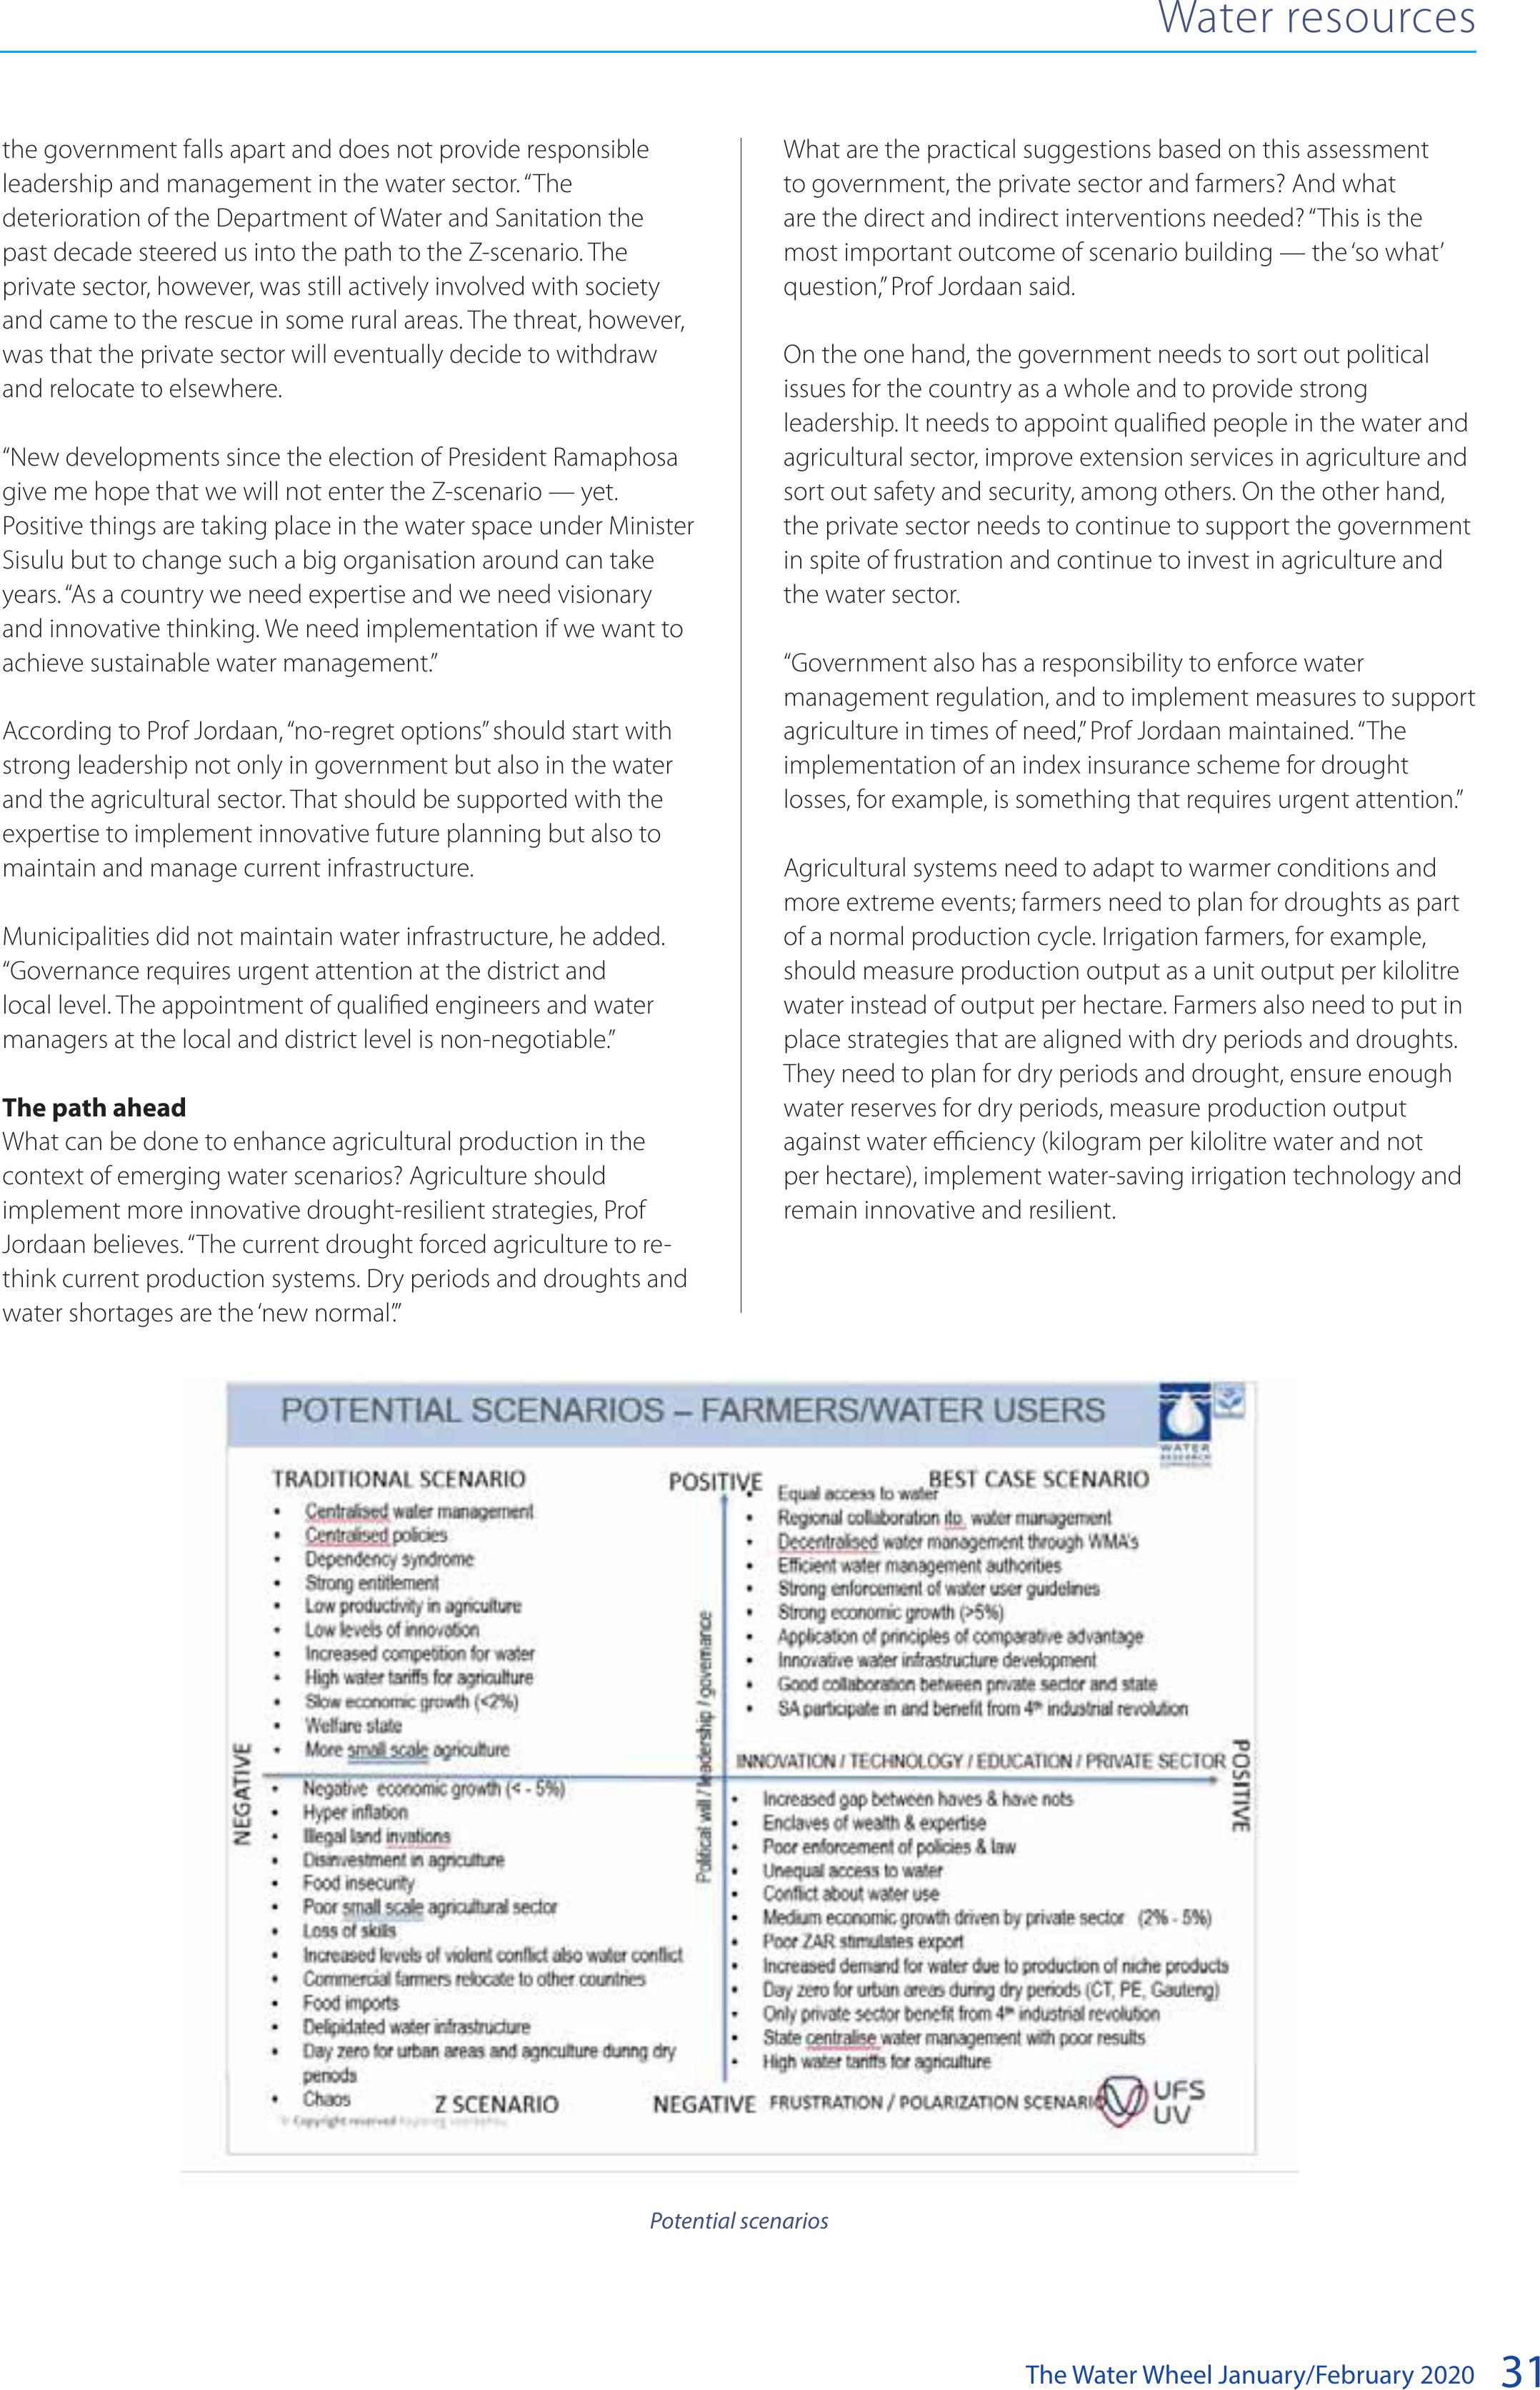
The Water Wheel January/February 202031
Water resources
What are the practical suggestions based on this assessment
to government, the private sector and farmers? And what
are the direct and indirect interventions needed? “This is the
most important outcome of scenario building — the ‘so what’
question,” Prof Jordaan said.
On the one hand, the government needs to sort out political
issues for the country as a whole and to provide strong
leadership. It needs to appoint qualified people in the water and
agricultural sector, improve extension services in agriculture and
sort out safety and security, among others. On the other hand,
the private sector needs to continue to support the government
in spite of frustration and continue to invest in agriculture and
the water sector.
“Government also has a responsibility to enforce water
management regulation, and to implement measures to support
agriculture in times of need,” Prof Jordaan maintained. “The
implementation of an index insurance scheme for drought
losses, for example, is something that requires urgent attention.”
Agricultural systems need to adapt to warmer conditions and
more extreme events; farmers need to plan for droughts as part
of a normal production cycle. Irrigation farmers, for example,
should measure production output as a unit output per kilolitre
water instead of output per hectare. Farmers also need to put in
place strategies that are aligned with dry periods and droughts.
They need to plan for dry periods and drought, ensure enough
water reserves for dry periods, measure production output
against water efficiency (kilogram per kilolitre water and not
per hectare), implement water-saving irrigation technology and
remain innovative and resilient.
the government falls apart and does not provide responsible
leadership and management in the water sector. “The
deterioration of the Department of Water and Sanitation the
past decade steered us into the path to the Z-scenario. The
private sector, however, was still actively involved with society
and came to the rescue in some rural areas. The threat, however,
was that the private sector will eventually decide to withdraw
and relocate to elsewhere.
“New developments since the election of President Ramaphosa
give me hope that we will not enter the Z-scenario — yet.
Positive things are taking place in the water space under Minister
Sisulu but to change such a big organisation around can take
years. “As a country we need expertise and we need visionary
and innovative thinking. We need implementation if we want to
achieve sustainable water management.”
According to Prof Jordaan, “no-regret options” should start with
strong leadership not only in government but also in the water
and the agricultural sector. That should be supported with the
expertise to implement innovative future planning but also to
maintain and manage current infrastructure.
Municipalities did not maintain water infrastructure, he added.
“Governance requires urgent attention at the district and
local level. The appointment of qualified engineers and water
managers at the local and district level is non-negotiable.”
The path ahead
What can be done to enhance agricultural production in the
context of emerging water scenarios? Agriculture should
implement more innovative drought-resilient strategies, Prof
Jordaan believes. “The current drought forced agriculture to re-
think current production systems. Dry periods and droughts and
water shortages are the ‘new normal’.”
Potential scenarios
BACK TO TOP

The Water Wheel January/February 2020
32
Feature
WETLANDS
Alien plant infestation is a huge problem in many parts of
the country. Often, these alien plants form a thick, almost
impenetrable wall high up in important catchments. Research
shows that the catchment area for the Theewaterskloof Dam –
the biggest dam providing water to the City of Cape Town – is,
for instance, nearing natural thresholds due to land-use changes
and the impact of alien plants on water supplies.
It is estimated that alien invasive plants are currently reducing
the water supply to the Theewaterskloof Dam by 55 million m3
per annum. This is equivalent to almost the full capacity of the
Wemmershoek Dam. Should no clearing be done, the reduction
in water supply by 2045 will double per annum.
Luckily, water yield from catchments can be improved
significantly by removing alien invasive species from the
landscape and key catchments. Ecological engineering (‘soft’
solutions) can also be used rather than constantly turning
to expensive ‘hard’ solutions. At the very least, wetland
management should complement traditional engineering
solutions (municipal dams and water treatment works), the
research highlights.
“Alignment of solutions to ensure water security in the Western
Cape is needed, and this includes wetland rehabilitation and
other nature-based solutions,” says Louise Stafford from the
global non-profit organisation, The Nature Conservancy. Stafford
and colleagues developed the business case for establishing the
Greater Cape Town Water Fund. A key focus of this new fund will
be the potential to make investments in nature-based solutions,
Nature-based solutions for the future: Securing wetlands for
water security in the Western Cape
The rehabilitation of priority wetlands as part of an investment in nature-based solutions can
contribute signicantly to water security in the Western Cape Water Supply System, according to
the latest research. Article by Jorisna Bonthuys.
A view across the Theewaterskloof Dam. It is estimated that alien invasive plants are currently reducing the water supply to the dam by 55 million m3 per
annum.
BACK TO TOP
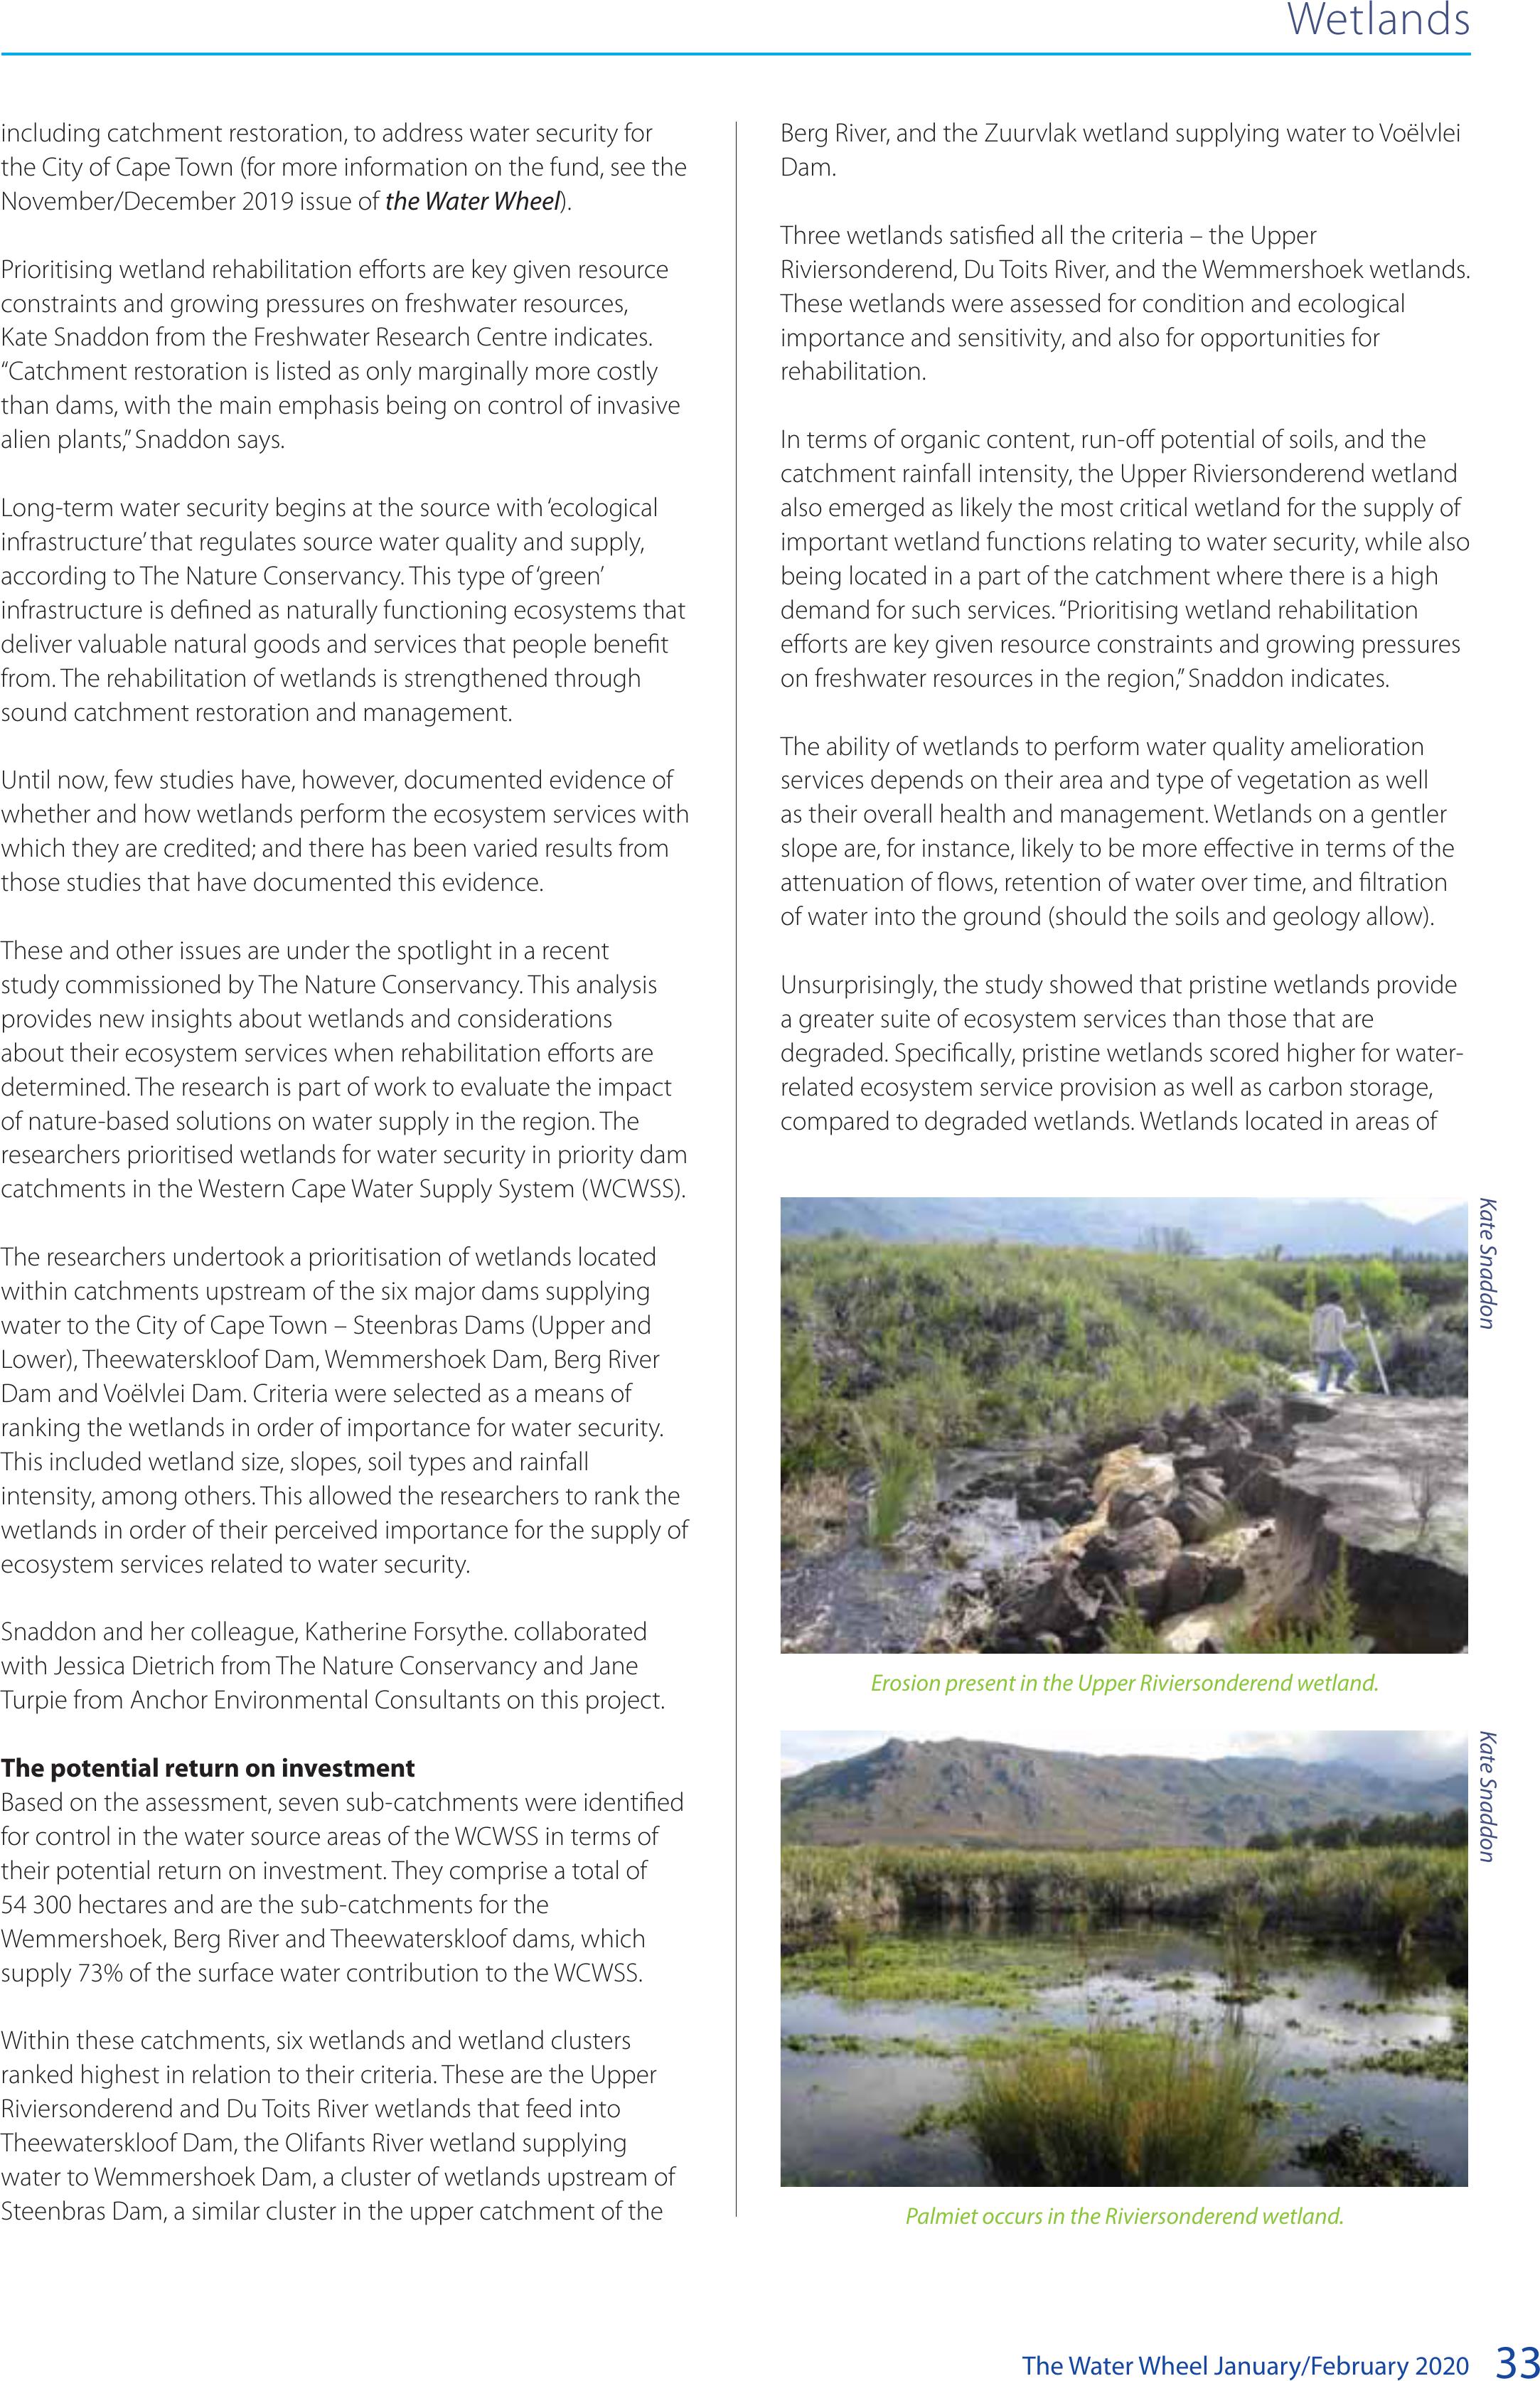
The Water Wheel January/February 202033
including catchment restoration, to address water security for
the City of Cape Town (for more information on the fund, see the
November/December 2019 issue of the Water Wheel).
Prioritising wetland rehabilitation efforts are key given resource
constraints and growing pressures on freshwater resources,
Kate Snaddon from the Freshwater Research Centre indicates.
“Catchment restoration is listed as only marginally more costly
than dams, with the main emphasis being on control of invasive
alien plants,” Snaddon says.
Long-term water security begins at the source with ‘ecological
infrastructure’ that regulates source water quality and supply,
according to The Nature Conservancy. This type of ‘green’
infrastructure is defined as naturally functioning ecosystems that
deliver valuable natural goods and services that people benefit
from. The rehabilitation of wetlands is strengthened through
sound catchment restoration and management.
Until now, few studies have, however, documented evidence of
whether and how wetlands perform the ecosystem services with
which they are credited; and there has been varied results from
those studies that have documented this evidence.
These and other issues are under the spotlight in a recent
study commissioned by The Nature Conservancy. This analysis
provides new insights about wetlands and considerations
about their ecosystem services when rehabilitation efforts are
determined. The research is part of work to evaluate the impact
of nature-based solutions on water supply in the region. The
researchers prioritised wetlands for water security in priority dam
catchments in the Western Cape Water Supply System (WCWSS).
The researchers undertook a prioritisation of wetlands located
within catchments upstream of the six major dams supplying
water to the City of Cape Town – Steenbras Dams (Upper and
Lower), Theewaterskloof Dam, Wemmershoek Dam, Berg River
Dam and Voëlvlei Dam. Criteria were selected as a means of
ranking the wetlands in order of importance for water security.
This included wetland size, slopes, soil types and rainfall
intensity, among others. This allowed the researchers to rank the
wetlands in order of their perceived importance for the supply of
ecosystem services related to water security.
Snaddon and her colleague, Katherine Forsythe. collaborated
with Jessica Dietrich from The Nature Conservancy and Jane
Turpie from Anchor Environmental Consultants on this project.
The potential return on investment
Based on the assessment, seven sub-catchments were identified
for control in the water source areas of the WCWSS in terms of
their potential return on investment. They comprise a total of
54 300 hectares and are the sub-catchments for the
Wemmershoek, Berg River and Theewaterskloof dams, which
supply 73% of the surface water contribution to the WCWSS.
Within these catchments, six wetlands and wetland clusters
ranked highest in relation to their criteria. These are the Upper
Riviersonderend and Du Toits River wetlands that feed into
Theewaterskloof Dam, the Olifants River wetland supplying
water to Wemmershoek Dam, a cluster of wetlands upstream of
Steenbras Dam, a similar cluster in the upper catchment of the
Berg River, and the Zuurvlak wetland supplying water to Voëlvlei
Dam.
Three wetlands satisfied all the criteria – the Upper
Riviersonderend, Du Toits River, and the Wemmershoek wetlands.
These wetlands were assessed for condition and ecological
importance and sensitivity, and also for opportunities for
rehabilitation.
In terms of organic content, run-off potential of soils, and the
catchment rainfall intensity, the Upper Riviersonderend wetland
also emerged as likely the most critical wetland for the supply of
important wetland functions relating to water security, while also
being located in a part of the catchment where there is a high
demand for such services. “Prioritising wetland rehabilitation
efforts are key given resource constraints and growing pressures
on freshwater resources in the region,” Snaddon indicates.
The ability of wetlands to perform water quality amelioration
services depends on their area and type of vegetation as well
as their overall health and management. Wetlands on a gentler
slope are, for instance, likely to be more effective in terms of the
attenuation of flows, retention of water over time, and filtration
of water into the ground (should the soils and geology allow).
Unsurprisingly, the study showed that pristine wetlands provide
a greater suite of ecosystem services than those that are
degraded. Specifically, pristine wetlands scored higher for water-
related ecosystem service provision as well as carbon storage,
compared to degraded wetlands. Wetlands located in areas of
Wetlands
Erosion present in the Upper Riviersonderend wetland.
Kate Snaddon
Palmiet occurs in the Riviersonderend wetland.
Kate Snaddon
BACK TO TOP

The Water Wheel January/February 2020
34
of priority wetlands, the economic gains in terms of ecosystem
services could be in the order of R0.81-R1.35 million per year (see
accompanying tables for more information).
This analysis suggests that rehabilitation of the Zuurvlak wetland
could, for instance, save treatment costs in the order of
R472 000-R937 000 per year. This large range of values highlights
the need to collect more site-specific data.
The Du Toits River wetland also showed the highest return on
investment compared to the other two wetlands. This is due to
the lower rehabilitation costs, even though the costs avoided
through rehabilitation were the lowest of the three wetlands.
The study lays the groundwork for prioritising investments in
wetland restoration and alien clearing efforts in the region,
Snaddon indicates. Unfortunately, the National Inland Aquatic
Ecosystem Inventory map was not completed at the time of this
study’s conclusion. There was also not enough information on
the prioritised wetlands to allow an in-depth ecosystem service
high total rainfall are likely to be more important in terms of the
demand for services relating to attenuation of flows, streamflow
regulation and infiltration into groundwater.
The presence of fibrous peat (and to a lesser extent amorphous
peat) is also likely to increase the capacity of the wetland to store
water and ensure infiltration of water into groundwater (should
the geology allow). Water is more likely to be released slowly
throughout the year.
To calculate the return on investment for rehabilitation of these
priority wetlands, the researchers calculated the present values
of the costs avoided through rehabilitation and the present
value of the rehabilitation costs over a 30-year time frame using
a 6% discount value. They assumed that the capital costs were
spent in the first year with ongoing maintenance costs of 2% per
year (based on an average of costs reported in the literature for
wetland rehabilitation works).
The preliminary analyses suggest that through rehabilitation
Wetlands
Total wetland
area influenced
Number
of hectare
equivalents
gained or
secured
% increase in
streamflow
regulation
% increase in
nitrate removal
% increase in
erosion control
% increase in
carbon storage
% increase in
biodiversity
maintenance
Upper
Riviersonderend
22277 0033 25 23
Du Toits680560061116
Wemmershoek3230 (no rehab
opportunities
currently
identified)
n/a n/a n/a n/a n/a
Zuurvlak925 227 88252532
Summary of potential costs avoided through rehabilitation of priority wetlands (R’000s per year)
WetlandIncrease in water
quality amelioration
benefits
Increase in sediment
retention benefits
Increase in carbon
benefits
Increase in tourism
value
Total gain (R’000s/yr)
Upper
Riviersonderend
- 164-32818-71- 182-399
Du Toit-116-23222-89-138-321
Zuurvlak 472-937-10-13010-26492-628
Total472-937 280-560 50-29010-26812-1348
Preliminary estimates of present values of costs avoided through rehabilitation and costs of rehabilitation as well as the
potential range of return on investments
WetlandPresent value of ES gains (6% discount rate
over 30 years)
Present value of
rehabilitation costs
(6% discount rate
over 30 years)
Return on investment
Lower BoundUpper BoundLower BoundUpper bound
Upper
Riviersonderend
2 496 0005 478 0003 842 0000.651.43
Du Toit1 898 0004 406 000691 0002.756.38
Zuurvlak6 757 0009 636 0006 744 0001.001.28
Summary of rehabilitation gains
BACK TO TOP
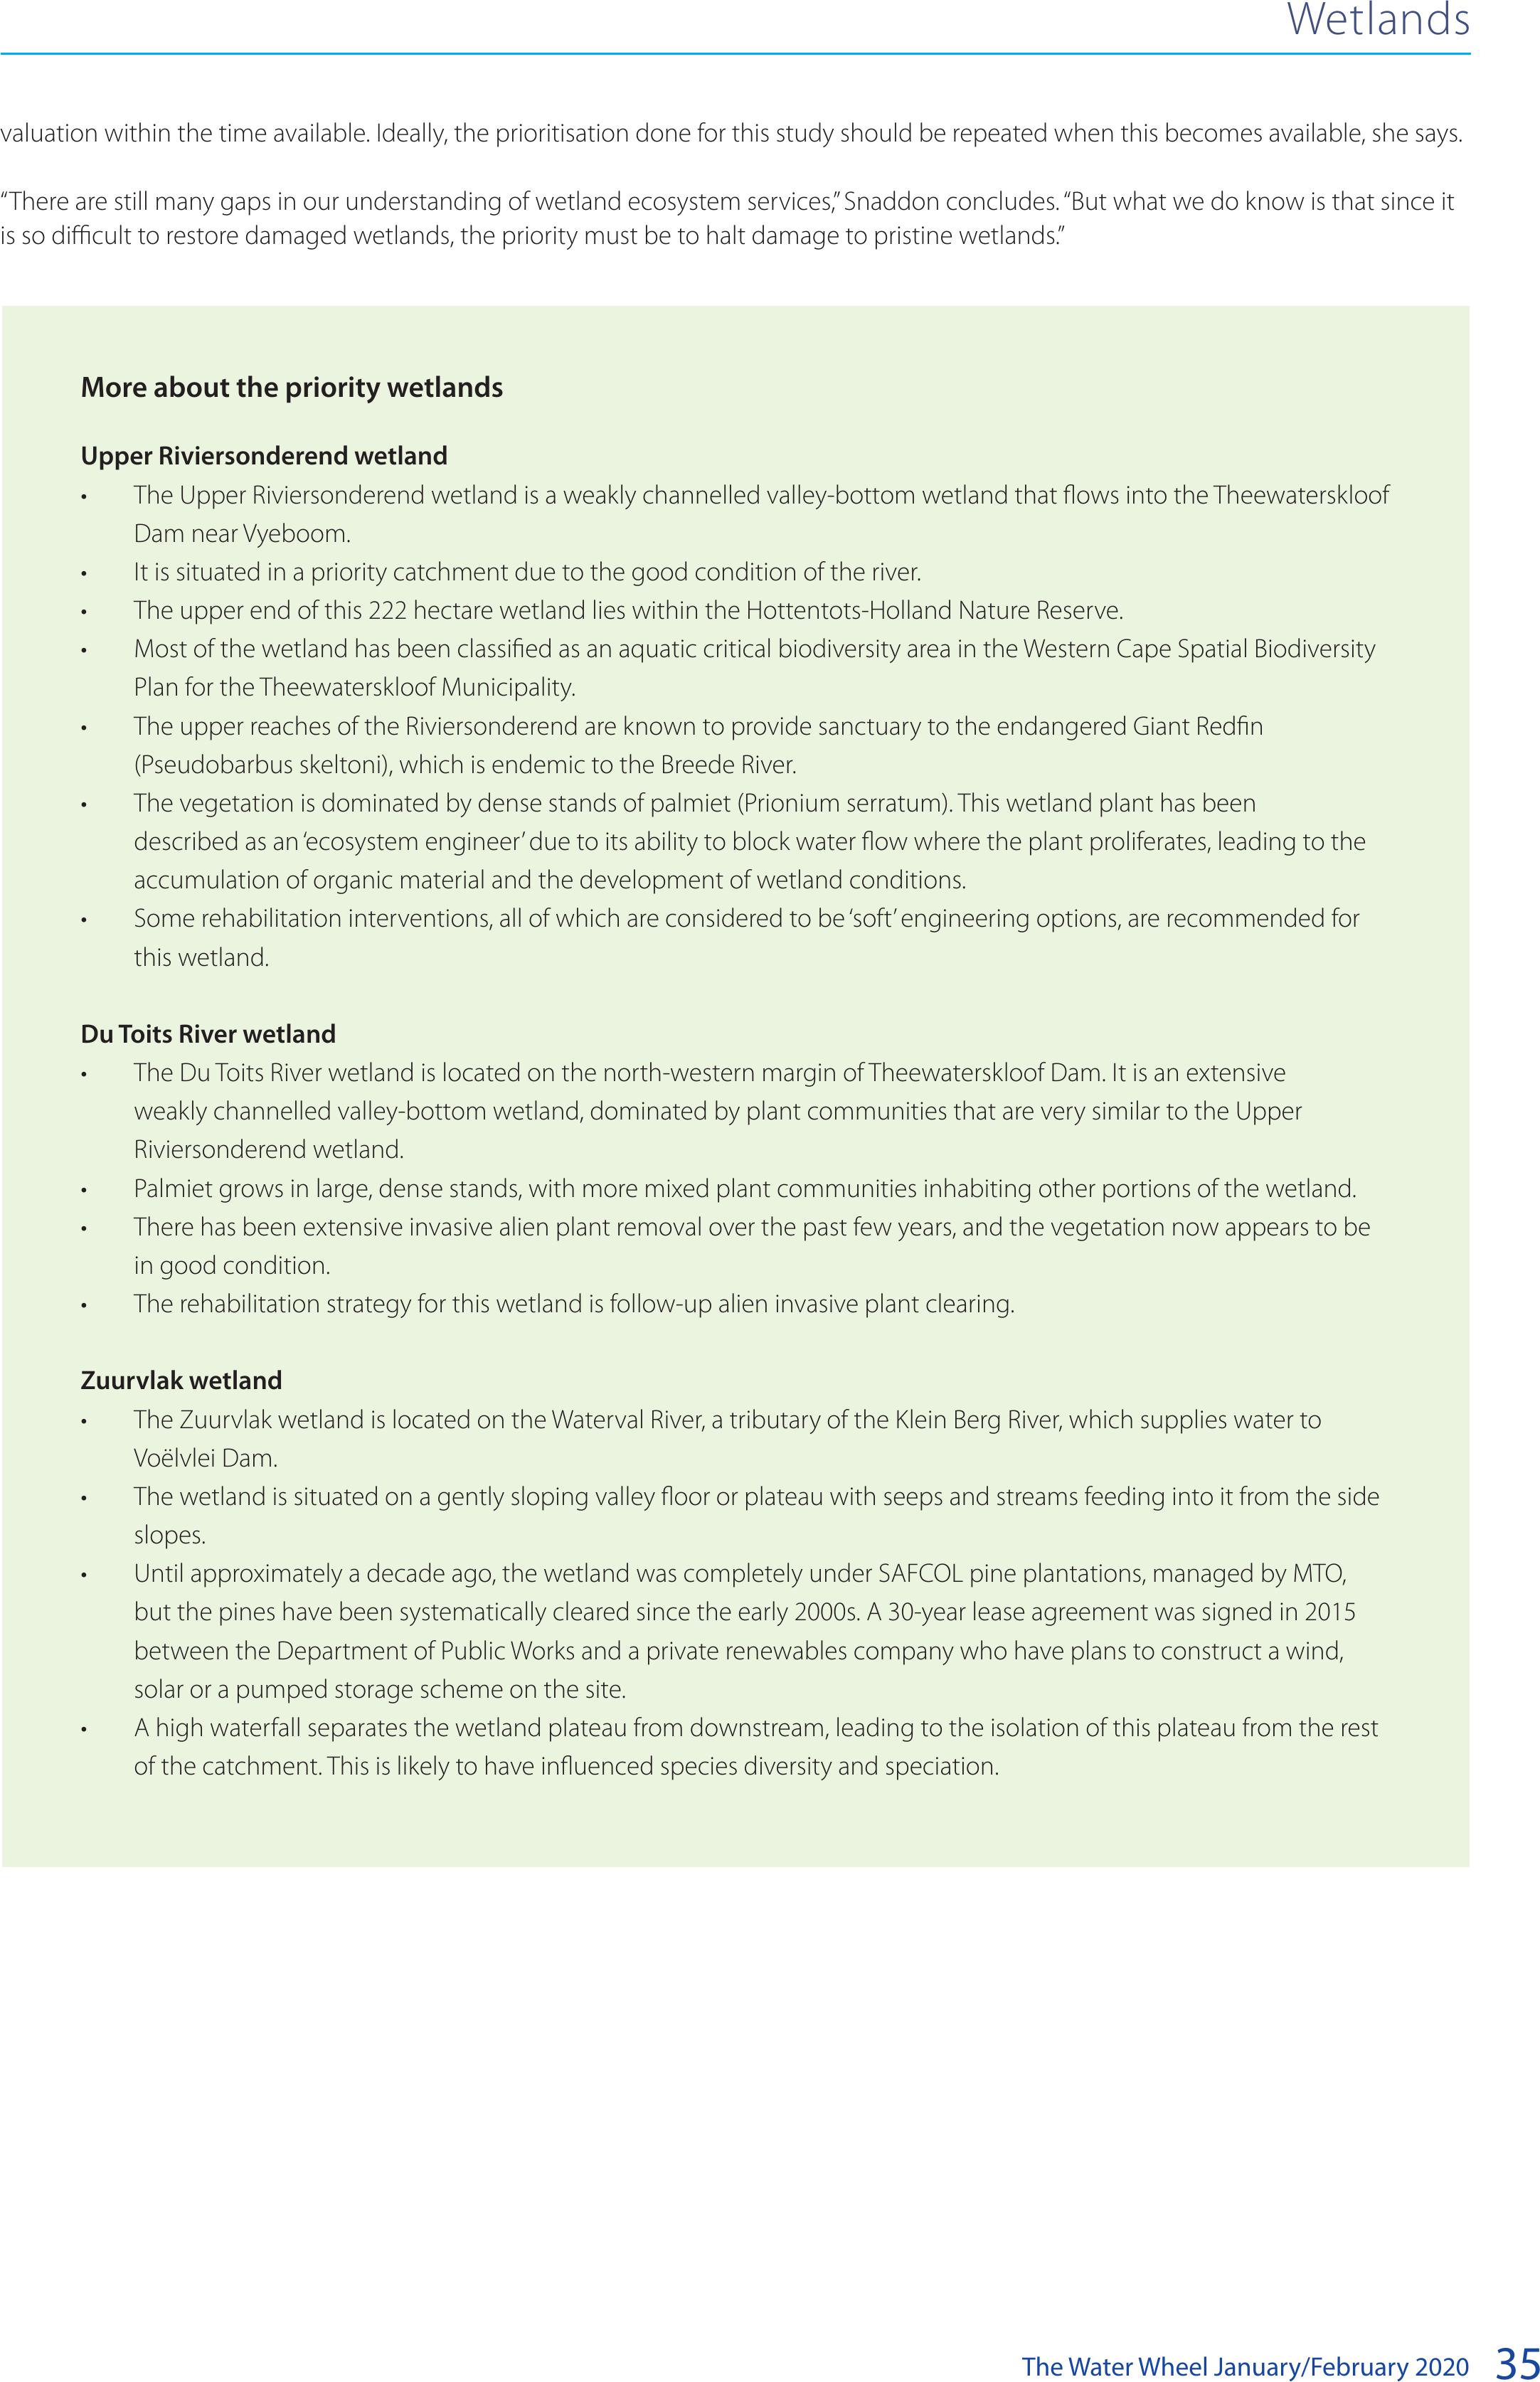
The Water Wheel January/February 202035
valuation within the time available. Ideally, the prioritisation done for this study should be repeated when this becomes available, she says.
“There are still many gaps in our understanding of wetland ecosystem services,” Snaddon concludes. “But what we do know is that since it
is so difficult to restore damaged wetlands, the priority must be to halt damage to pristine wetlands.”
Wetlands
More about the priority wetlands
Upper Riviersonderend wetland
• The Upper Riviersonderend wetland is a weakly channelled valley-bottom wetland that flows into the Theewaterskloof
Dam near Vyeboom.
• It is situated in a priority catchment due to the good condition of the river.
• The upper end of this 222 hectare wetland lies within the Hottentots-Holland Nature Reserve.
• Most of the wetland has been classified as an aquatic critical biodiversity area in the Western Cape Spatial Biodiversity
Plan for the Theewaterskloof Municipality.
• The upper reaches of the Riviersonderend are known to provide sanctuary to the endangered Giant Redfin
(Pseudobarbus skeltoni), which is endemic to the Breede River.
• The vegetation is dominated by dense stands of palmiet (Prionium serratum). This wetland plant has been
described as an ‘ecosystem engineer’ due to its ability to block water flow where the plant proliferates, leading to the
accumulation of organic material and the development of wetland conditions.
• Some rehabilitation interventions, all of which are considered to be ‘soft’ engineering options, are recommended for
this wetland.
Du Toits River wetland
• The Du Toits River wetland is located on the north-western margin of Theewaterskloof Dam. It is an extensive
weakly channelled valley-bottom wetland, dominated by plant communities that are very similar to the Upper
Riviersonderend wetland.
• Palmiet grows in large, dense stands, with more mixed plant communities inhabiting other portions of the wetland.
• There has been extensive invasive alien plant removal over the past few years, and the vegetation now appears to be
in good condition.
• The rehabilitation strategy for this wetland is follow-up alien invasive plant clearing.
Zuurvlak wetland
• The Zuurvlak wetland is located on the Waterval River, a tributary of the Klein Berg River, which supplies water to
Voëlvlei Dam.
• The wetland is situated on a gently sloping valley floor or plateau with seeps and streams feeding into it from the side
slopes.
• Until approximately a decade ago, the wetland was completely under SAFCOL pine plantations, managed by MTO,
but the pines have been systematically cleared since the early 2000s. A 30-year lease agreement was signed in 2015
between the Department of Public Works and a private renewables company who have plans to construct a wind,
solar or a pumped storage scheme on the site.
• A high waterfall separates the wetland plateau from downstream, leading to the isolation of this plateau from the rest
of the catchment. This is likely to have influenced species diversity and speciation.
BACK TO TOP

The Water Wheel January/February 2020
36
Creating climate change resilient communities Part 3: A
decision support system for smallholder farmers
The project is exploring best practice options for climate resilient
agriculture (CRA) for smallholders and evaluating the impact of
implementation of a range of these practices on the resilience
of agriculture-based livelihoods. Alongside this, a decision
support methodology and system has been designed to assist
smallholders and the facilitators who support them to make
informed and appropriate decisions about choices of a ‘basket of
options’ for implementation at a local level.
The smallholder climate change adaptation decision
support process
The decision support process focuses on a bottom-up approach,
where individual farmers in a locality make decisions regarding
the ‘basket’ of climate resilient agriculture approaches and
practices most suited to their specific situation. To do this in a
way that also includes the concepts of social learning, innovation
and agency the following decision support concept has been
developed.
The process is designed to also support and assist the facilitator
in their decision making, in support of the smallholder farmers;
meaning that the facilitator accesses information such as the
basic climate change predictions for the area, the agroecological
characteristics including rainfall, temperature, soil texture etc)
and an initial contextualised basket of practices from which to
negotiate prioritised practices with farmers. Practices are thus
chosen by both facilitators and farmers.
In this third article based on the Water Research Commission (WRC) funded project titled,
‘Collaborative knowledge creation and mediation strategies for the dissemination of water and
soil conservation practices and climate smart agriculture in smallholder farming systems’ we focus
on the design of a farmer level decision support system. Article by Erna Kruger.
SMALLHOLDER FARMING
Feature
Figure 1: The smallholder decision support model.
BACK TO TOP
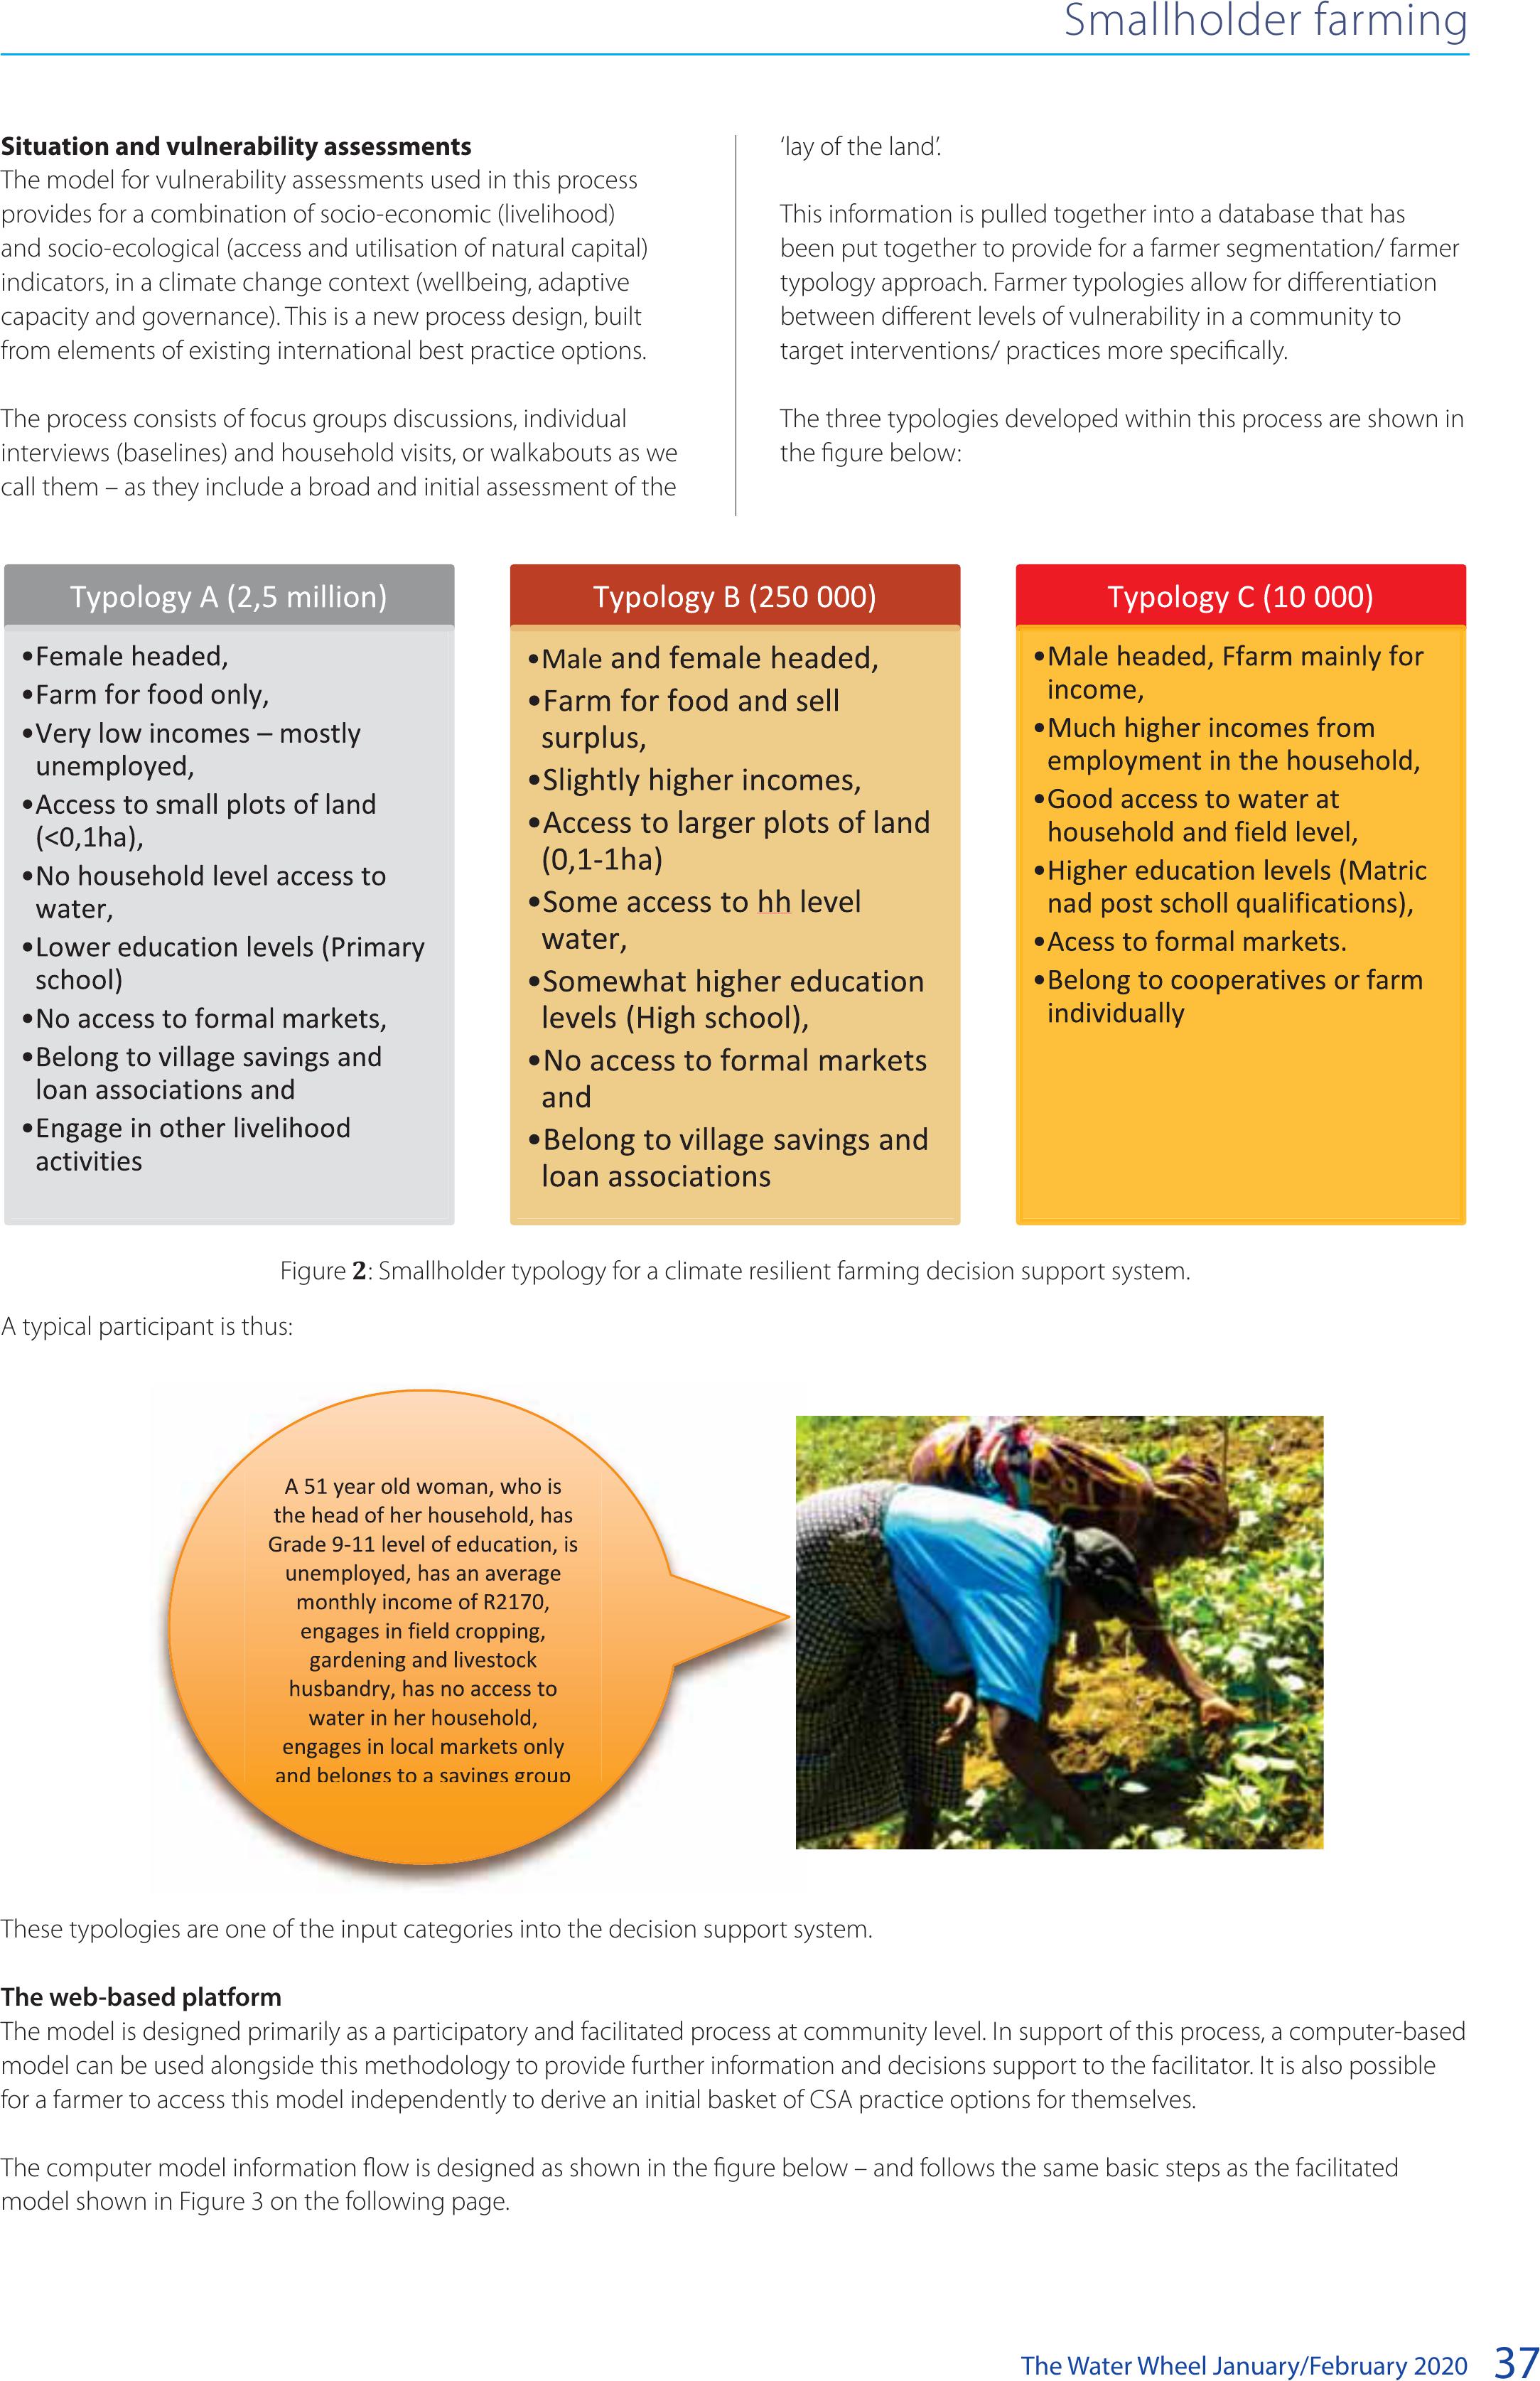
The Water Wheel January/February 202037
‘lay of the land’.
This information is pulled together into a database that has
been put together to provide for a farmer segmentation/ farmer
typology approach. Farmer typologies allow for differentiation
between different levels of vulnerability in a community to
target interventions/ practices more specifically.
The three typologies developed within this process are shown in
the figure below:
Situation and vulnerability assessments
The model for vulnerability assessments used in this process
provides for a combination of socio-economic (livelihood)
and socio-ecological (access and utilisation of natural capital)
indicators, in a climate change context (wellbeing, adaptive
capacity and governance). This is a new process design, built
from elements of existing international best practice options.
The process consists of focus groups discussions, individual
interviews (baselines) and household visits, or walkabouts as we
call them – as they include a broad and initial assessment of the
A typical participant is thus:
Smallholder farming
Figure 2: Smallholder typology for a climate resilient farming decision support system.
These typologies are one of the input categories into the decision support system.
The web-based platform
The model is designed primarily as a participatory and facilitated process at community level. In support of this process, a computer-based
model can be used alongside this methodology to provide further information and decisions support to the facilitator. It is also possible
for a farmer to access this model independently to derive an initial basket of CSA practice options for themselves.
The computer model information flow is designed as shown in the figure below – and follows the same basic steps as the facilitated
model shown in Figure 3 on the following page.
BACK TO TOP

The Water Wheel January/February 2020
38
Besides this, the resources and related management strategies
as well as a list of practices need to be provided as input to
the system. All information, except the physical environment;
i.e. climate, soil and topography, and the resources and
management strategies, are derived through the use of a range
of participatory processes. Data on the physical environmental
conditions have been taken from datasets freely available online.
This information can however be customised by the DSS user,
in case more appropriate information is available for the specific
farmer concerned.
For the Facilitator-Farmer DSS the resources and related
management strategies are discussed and negotiated in the
participatory process. For the computer based or Individual
Farmer DSS these are provided as an input into the model using
the following framework:
In our case the set of criteria (proxies used as indicators for
the complex reality) that helps to make informed decisions on
management practices are:
• The current farming systems; gardening, field cropping,
livestock production and natural resource management
(NRM) (including trees),
• The physical environment: agroecological zone, soil texture,
slope and organic soil carbon and
• The socio-economic background of the farmer;
demographic information (gender HH head, age,
dependency ratio), level of education, sources of income
(unemployment vs. external employment, own business,
grants, farm, etc.), total income, access to services,
infrastructure, technology (Electricity, water (tap, borehole,
rainwater harvesting, etc.), irrigation (buckets, standpipes,
etc.), fencing and farming tools (hand vs traction/other),
social organisation, market access (formal vs. informal), farm
size and farming purpose (food vs. selling).
Smallholder farming
Figure 3: The computer-based model for the smallholder DSS.
Figure 4: Resources to manage and their associated management strategies.
BACK TO TOP

The Water Wheel January/February 202039
Smallholder farming
Once all the information is inputted into the model an initial list of practices is suggested for each individual farmer. The model has
been tested and rened, through comparison of this computed based process with the participatory process and assessing how
closely these two processes are aligned.
Below is an example for 1 farmer in each of the three provinces where the model has been tested.
Table 1: Basket/list of practices recommended for version 2 of the DSS
ProvinceKZNLimpopo EC
VillageEzibomvini SekororoMxumbu
Name and SurnamePhumelele HlongwaneChenne MailulaXolisa Dwane
Drip irrigation 000
Bucket drip kits000
Furrows and ridges/ furrow irrigation000
Greywater management110
Shade cloth tunnels110
Mulching11 0
Improved organic matter (manure and crop
residues)
111
Diversion ditches100
Grass water ways000
Infiltration pits / banana circles110
Zai pits100
Rain water harvesting storage111
Tied ridges000
Half- moon basins001
Small dams000
Contours; ploughing and planting100
Gabions00 1
Stone bunds000
Check dams001
Cut off drains / swales001
Terraces00 0
Stone packs100
Strip cropping100
Pitting11 0
Woodlots for soil reclamation100
Targeted application of small quantities of
fertilizer, lime etc
100
Liquid manures110
Woody hedgerows for browse, mulch, green
manure, soil conservation
100
Conservation Agriculture100
Planting legumes, manure, green manures100
Mixed cropping100
Planting herbs and multifunctional plants100
Agroforestry (trees + agriculture)100
Trench beds/ eco circles110
push-pull technology 100
Natural pest and disease control100
BACK TO TOP
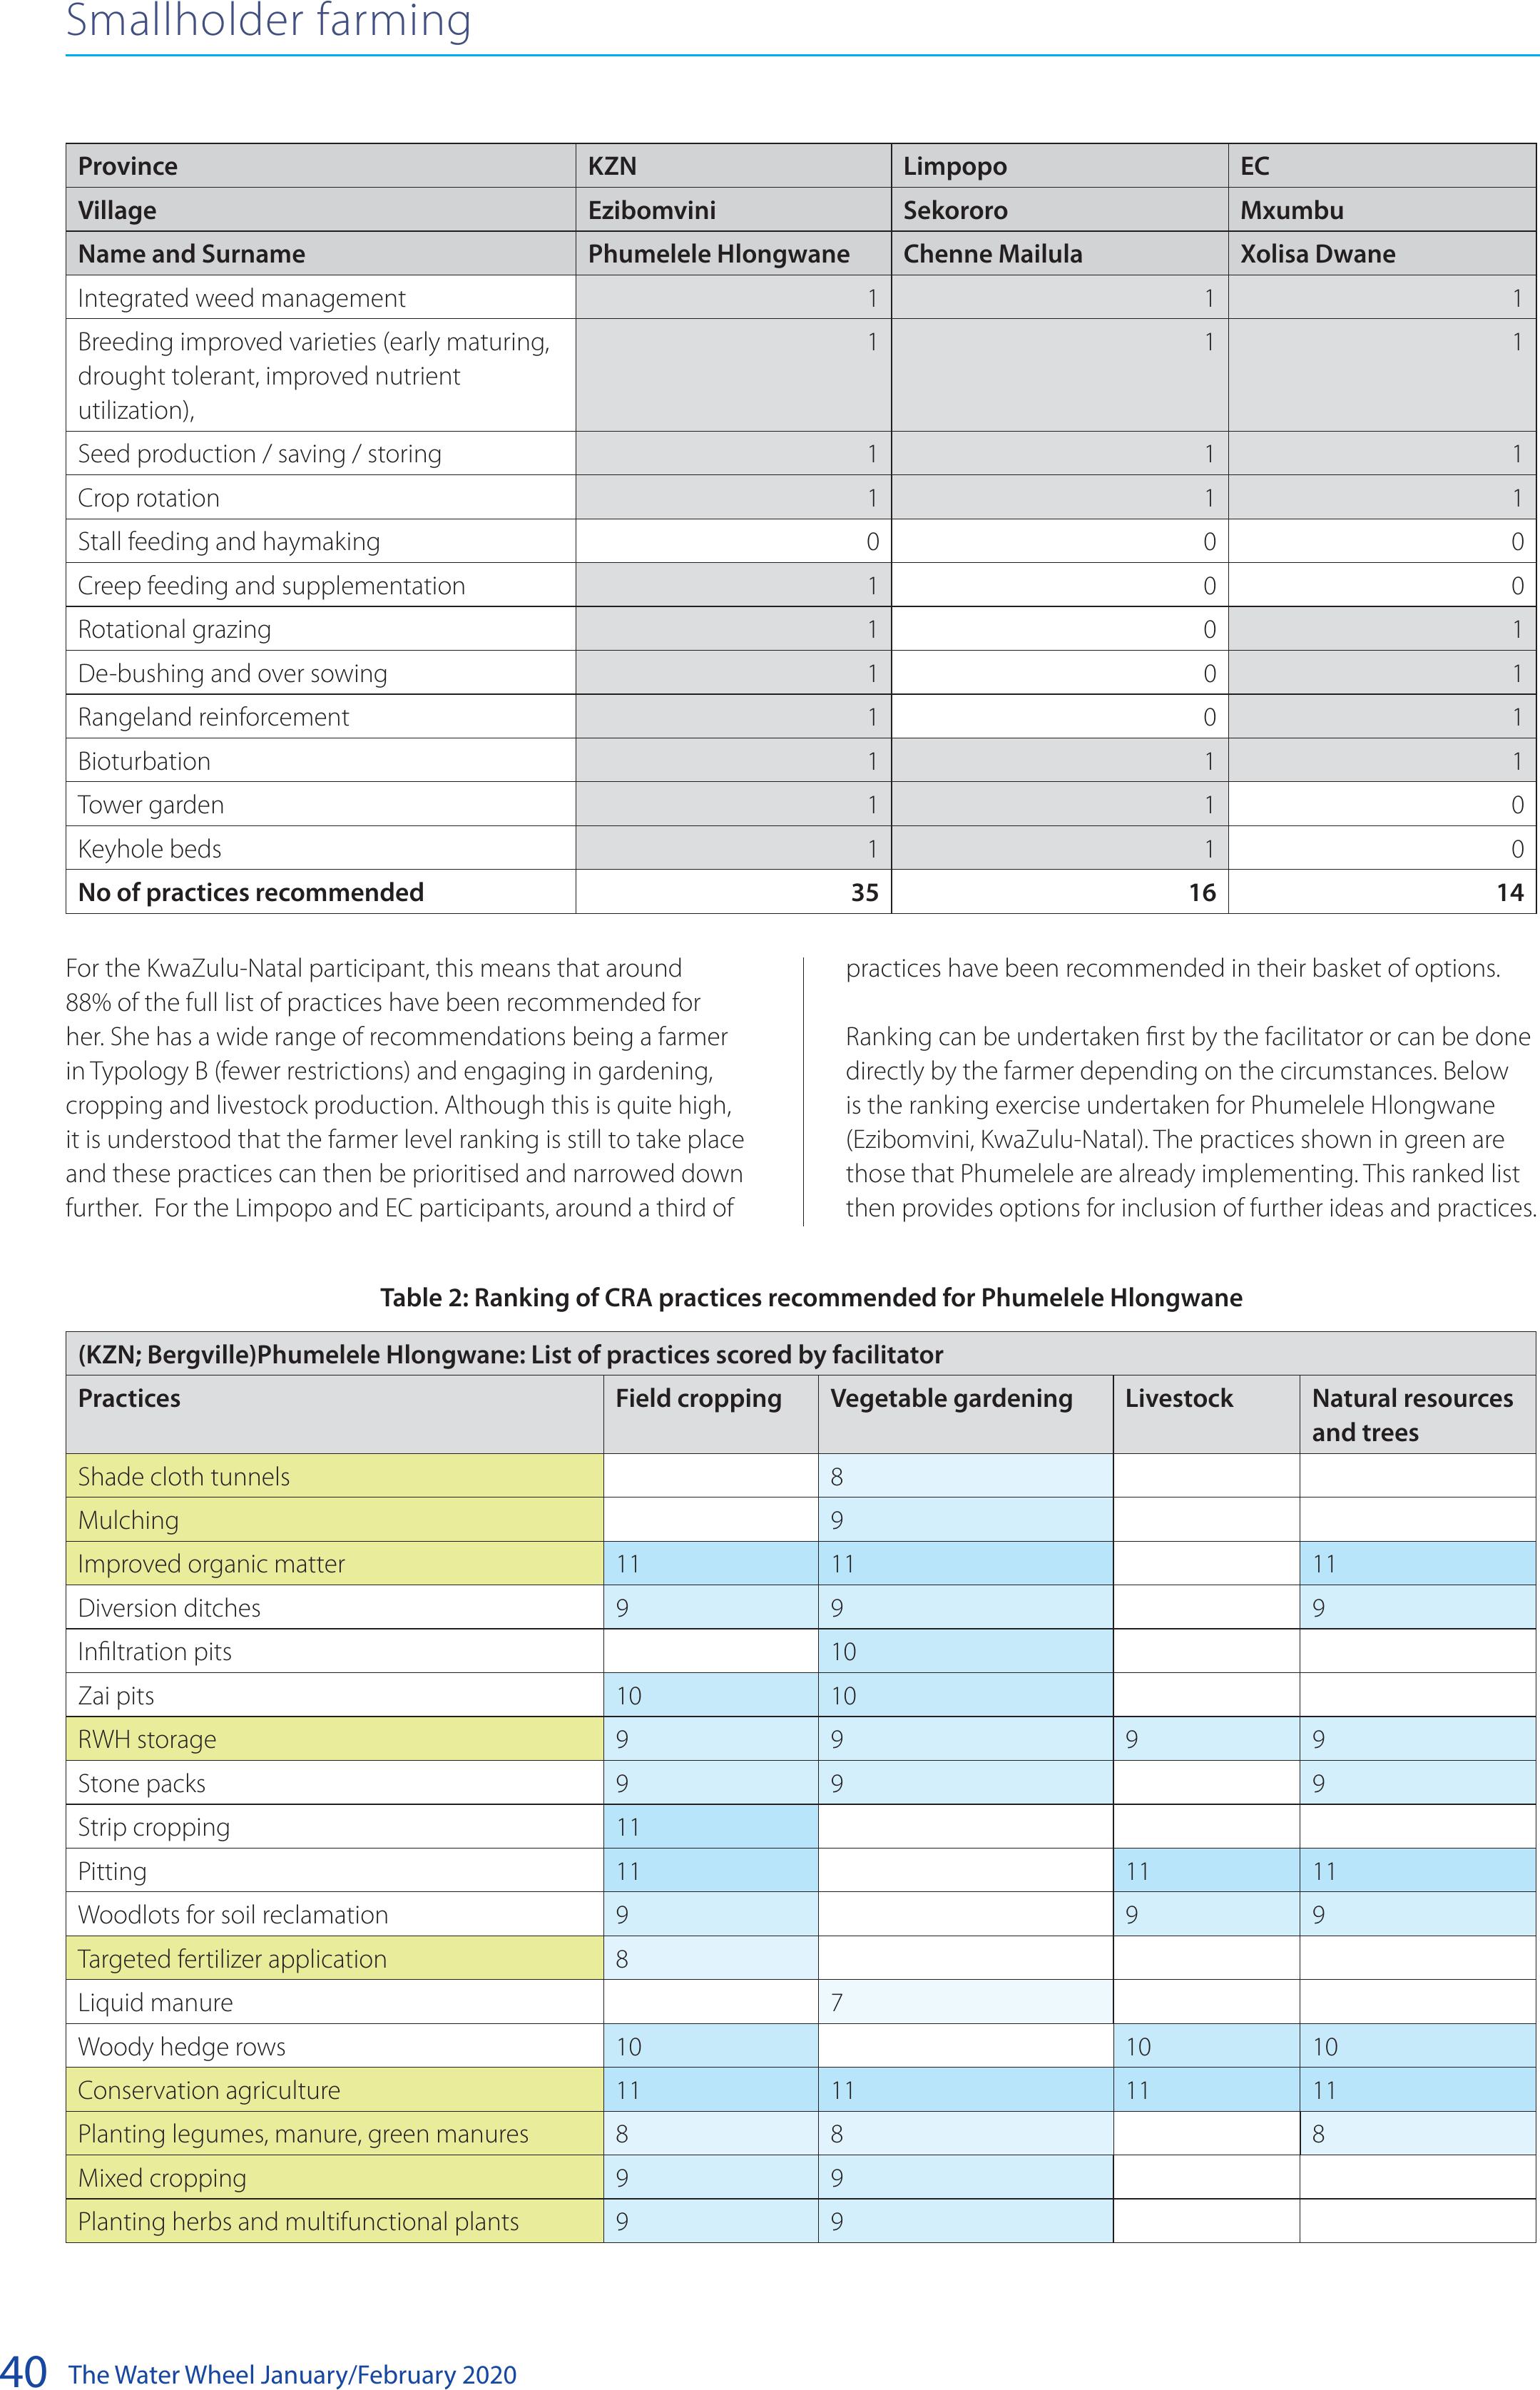
The Water Wheel January/February 2020
40
Smallholder farming
ProvinceKZNLimpopo EC
VillageEzibomvini SekororoMxumbu
Name and SurnamePhumelele HlongwaneChenne MailulaXolisa Dwane
Integrated weed management 111
Breeding improved varieties (early maturing,
drought tolerant, improved nutrient
utilization),
111
Seed production / saving / storing111
Crop rotation111
Stall feeding and haymaking000
Creep feeding and supplementation100
Rotational grazing101
De-bushing and over sowing101
Rangeland reinforcement101
Bioturbation11 1
Tower garden110
Keyhole beds110
No of practices recommended351614
practices have been recommended in their basket of options.
Ranking can be undertaken first by the facilitator or can be done
directly by the farmer depending on the circumstances. Below
is the ranking exercise undertaken for Phumelele Hlongwane
(Ezibomvini, KwaZulu-Natal). The practices shown in green are
those that Phumelele are already implementing. This ranked list
then provides options for inclusion of further ideas and practices.
For the KwaZulu-Natal participant, this means that around
88% of the full list of practices have been recommended for
her. She has a wide range of recommendations being a farmer
in Typology B (fewer restrictions) and engaging in gardening,
cropping and livestock production. Although this is quite high,
it is understood that the farmer level ranking is still to take place
and these practices can then be prioritised and narrowed down
further. For the Limpopo and EC participants, around a third of
(KZN; Bergville)Phumelele Hlongwane: List of practices scored by facilitator
PracticesField croppingVegetable gardeningLivestockNatural resources
and trees
Shade cloth tunnels8
Mulching 9
Improved organic matter111111
Diversion ditches999
Infiltration pits10
Zai pits1010
RWH storage9999
Stone packs999
Strip cropping11
Pitting1111 11
Woodlots for soil reclamation999
Targeted fertilizer application8
Liquid manure7
Woody hedge rows101010
Conservation agriculture11111111
Planting legumes, manure, green manures888
Mixed cropping99
Planting herbs and multifunctional plants99
Table 2: Ranking of CRA practices recommended for Phumelele Hlongwane
BACK TO TOP

The Water Wheel January/February 202041
Smallholder farming
(KZN; Bergville)Phumelele Hlongwane: List of practices scored by facilitator
PracticesField croppingVegetable gardeningLivestockNatural resources
and trees
Agroforestry (trees + agriculture)11111111
Trench beds/ eco circles9
push-pull technology 7
Natural pest and disease control777
Integrated weed management 777
Breeding improved varieties (early maturing,
drought tolerant, improved nutrients),
77 77
Seed production / saving / storing666
Crop rotation99
Stall feeding and haymaking
Creep feeding and supplementation7
Rotational grazing9
De-bushing and over sowing9
Rangeland reinforcement9
Bioturbation999 9
Tower garden10
Keyhole beds10
Below are a few indicative photographs of Phumelele’s CRA practices.
Above clockwise from top left: A view of Phumelele Hlongwane’s vegetable garden, a newly constructed tower garden, trench beds planted
to a mixture of vegetables in her shade cloth tunnel, a plot of Dolichos in her CA eld and a plot of summer cover crops- sunnhemp and
millet.
The decision support system for climate resilient agriculture implementation by smallholder farmers is an important new innovation in the
field of community-based climate change adaptation and can be scaled up as a framework in research, learning and implementation in
this field.
BACK TO TOP

The Water Wheel January/February 2020
42
At a glance
NEW PARTNERSHIP HOPES TO BOOST
ROLLOUT OF SAFE SANITATION
In November, the Water Research Commission (WRC) and
its partners, the Department of Science and Innovation,
Department of Water and Sanitation, the South African Bureau
of Standards, and the Department of Trade and Industry with the
support of the Bill and Melinda Gates Foundation, launched the
South African Sanitation Demonstration Programme (SASTEP).
SASTEP will support and accelerate the application and uptake
of the latest cutting-edge toilets through evidence-based
policy adjustments, demonstration, testing and science-based
improvements towards localisation and industrialisation. This
includes technologies supported by the Bill and Melinda Gates
Foundation ‘Reinvent the Toilet’ programme. The revolutionary
toilet systems will offer water-saving or water-recycling features,
be aspirational in design and, more importantly, offer dignity and
convenience. To demonstrate the potential of the reinvented
toilet as a sustainable solution to national sanitation challenges,
the initiative will work with local communities to pilot proven
and emerging technologies alongside the business and
service models used to maintain the systems,” noted WRC CEO,
Dhesigen Naidoo. “Local innovation which fit the criteria and
are designed to meet the new SABS 30500 standard for a non-
sewered sanitation system could also join the programme for
further support and evaluation.”
BACK TO TOP


The Water Wheel May/June 2016
44
Upfront