CONSERVATION AGRICULTURE IN AFRICA: CLIMATE SMART
AGRICULTURAL DEVELOPMENT
Chapter X
CA INNOVATION SYSTEMS BUILD CLIMATE RESILIENCE FOR
SMALLHOLDER FARMERS IN SOUTH AFRICA
Erna Kruger1 *, Hendrik Smith 2, Phumzile Ngcobo3, Mazwi Dlamini 4 and Temakholo
Mathebula5
1 Mahlathini Development Foundation, Pietermaritzburg, KwaZulu-Natal, South Africa
* Corresponding author: info@mahlathini.org
2 Grain SA, 457 Witherite street, The Willows, Pretoria, Gauteng, South Africa
3 Mahlathini Development Foundation, Pietermaritzburg, KwaZulu- Natal, South
Africa
4 Mahlathini Development Foundation, Pietermaritzburg, KwaZulu- Natal, South
Africa
5 Mahlathini Development Foundation, Pietermaritzburg, KwaZulu- Natal, South
Africa
Keywords; Innovation systems, conservation agriculture, climate change resilience,
smallholder farming systems, participatory impact assessment, climate change adaptation,
Southern Africa
1.1SUMMARY
Introduction of conservation agriculture (CA) and associated climate resilient agriculture
(CRA) practices within an innovation systems approach and using farmer-level
experimentation and learning groups as the primary learning and social empowerment
processes has created a sustainable and expanding farming alternative for smallholders that is
improving their resilience to climate change substantially.
Smallholder participants in the CA innovation system development process in the KwaZulu-
Natal province of South Africa have built resilience to climate change and improved their
livelihoods through substantial improvement in yields, productivity, and soil and water
conservation parameters. They have improved their social agency and social and economic
resilience through their involvement in innovation platforms, Village Savings and Loan
Associations (VSLAs), farmer centres, development of cooperatives, as well as local sales
and initiation of processing facilities.
Participatory design of a monitoring process using multiple system indicators (social,
economic, physical, agronomic, and environmental) has provided a framework for assessing
impact of community-level climate change adaptation.
1.2INTRODUCTION
Sustainable and regenerative agricultural practices such as conservation agriculture (CA), that
conserve and increase soil organic carbon (SOC) and improve soil health, are increasingly
promoted in Southern Africa as an alternative to conventional farming systems (Smith, et al.,
2017). CA depends on the simultaneous implementation of three linked principles: (1)
continuous zero or minimal soil disturbance, (2) permanent organic soil cover, and (3) crop
diversification (FAO, 2013). The latter usually entails crop rotation and the inclusion of
legumes and/or cover crops.
Complementary practices supporting CA implementation in smallholder farming systems
include appropriate nutrient management and stress-tolerant crop varieties, increased
efficiency of planting and mechanization, integrated pest and disease and weed management,
livestock integration, and enabling political and social environments (Thierfelder, et al.,
2018).
The MaizeTrust-funded CA Smallholder Farmer Innovation Programme (SFIP) in South
Africa, as conceptualized and implemented through Mahlathini Development Foundation
(MDF), has pioneered the use of agricultural innovation systems as a methodological approach
for the promotion of an appropriate smallholder CA farming system, as well as awareness
raising and adaptive research into specific elements of this system(Kruger & Smith, 2019).
This approach takes cognizance of the complexity of introducing CA into a farming system,
including working with smallholder farmers as partners in the knowledge co-creation process
through on-farm research and experiential learning, as well as embedding the process into the
existing socio-political environments and economic value chains.The overall goal of the CA
SFIP is the mainstreaming of CA by grain farmers to ensure sustainable use and management
of natural resources while enhancing national and household food security and income.
Specific objectives of the programme include also increasing the sustainability and efficiency
of CA systems in the study areas giving specific attention to the value chain and
incorporation into the broader agribusiness environment and strengthening and use different
innovation platforms, such as social institutions as avenues to scale out sustained collective
action and CA practices.
Figure 1 outlines the elements of the CA-SFIP in South Africa (2013-2019) (Smith & Visser,
2014).
(Insert Figure 1)
Figure 1: Elements of the CA-SFIP innovation system
This chapter considers the building blocks of an innovation systems approach, issues of
horizontal-or out-scaling and three different sets of indicators (innovation system indicators,
soil health indicators and resilience indicators) that have been developed to monitor and track
progress within the system.
In the smallholder context, introduction of CA into the farming system requires the design,
introduction, and facilitation of a reasonably complex innovation system (IS) approach by the
implementers, as well as practice, labour, and resources (including natural and financial
resources) by the farmers that have system-wide implications. Inthe SFIP, on-farm, farmer-
led research is the most central component of the IS, supported by learning, awareness raising
and economic elements (Smith, et al., 2017) (Swanepoel, et al., 2017). Different activities are
undertaken within each of these elements. A strongly participatory facilitation process is
required to ensure synergies across the activities and the knowledge co-creation that is crucial
to the success of the process. To date the introduction of CA into smallholder farming systems
has mainly consisted of researcher or extension led Ca trials and demonstrations and uptake
has been extremely limited (Swanepoel, et al., 2017).
Interested individuals in a local area or village come together to form a learning group. Several
farmers in that group then volunteer to undertake on-farm experimentation, which creates an
environment where the whole group learns throughout the season through observations and
reflections on the trials’ implementation and results. They compare various CA treatments with
their standard practices, which are planted as control plots. This provides an opportunity to
explore all aspects of the cropping system, its socio-economic context and feasibility, as well
as the grain and legume value chain in the area. Over a period of 4–6 years farmers develop
their ability to define their own farm-level experimental processes, which increases in
complexity and design to incorporate different aspects of the cropping system. They work
together to share labour and equipment, set up Village Savings and Loan Associations
(VSLAs), do bulk buying, set up farmer centres, and arrange for local processing and marketing
options. They bring new farmers interested in CA on board throughout the process.
This process also allows for longer-term monitoring and research into biophysical and socio-
economic changes in the areas of operation.
1.3SMALLHOLDER FARMING SYSTEM AND PARTICIPANTS
The majority of smallholder farmers in South Africa live in scattered communal tenure
communities, more often than not in agriculturally marginal production areas. They suffer
under the yoke of extreme poverty, highly degraded natural environments, and are highly
vulnerable to the effects of climate change.
Agricultural production is central to rural livelihoods and food production and is undertaken
as a mixed farming system approach that typically includes vegetable production in small
household gardens, field cropping in dryland fields of between 0,1–2ha and livestock rearing
- mostly cattle, goats, and sheep in village-based commonages (De Wit M, et al., 2015).
There are an estimated 3 million smallholder farmers in South Africa, of whom around 72%
fall within a non-commercial category consisting primarily of unemployed women who rely
on social grants (89%), who farm for household food purposes on small plots (0,1–1ha), with
very low household incomes (~R2,000/month), with low productivity (maize yields of
between 0,1–2t/ha), and with negligible external support. A further 23% are considered semi-
commercial, as they produce for both household consumption and sale and are slightly better
resourced. Commercial smallholders make up the remaining 5% and are often supported
through employment in the family (Cousins, 2015).
Though a focus on the rural poor, this programme has worked primarily with the non-
commercial and semi-commercial smallholders in the Eastern Cape and KwaZulu-Natal
provinces of South Africa. The focus has been on three distinct agroecological zones within
KwaZulu-Natal: Bergville, in the Drakensberg mountain foothills with an average annual
rainfall of between 650–750mm per annum, with high percentage clay soils; Southern
KwaZulu-Natal and the northern reaches of the Eastern Cape (EC & SKZN), also in the
Drakensberg foothills, but with more variable rainfall (450–750mm/annum) and much
sandier soils; and the Midlands, in the more coastal region of Southern KZN, with a higher
average annual rainfall of between 750–850mm and a wide range of soil types.
1.4ASPECTS OF THE CA-SFIP INNOVATION SYSTEM
In broadening the introduction of CA beyond the scope of researcher-managed trial plots and
commercial cropping advice, the following aspects have been included in the agricultural
innovation process:
•Collaborative and participatory research for knowledge co-creation in terms of applying
CA principles to smallholder farming systems,
•Farmer-level experimentation,
•Introduction of crop rotation, intercropping, cover crops and fodder crops into the
smallholder farming system,
•A focus on livestock integration.
•A focus on new cover crops and planting options; such as strip cropping,
•Inclusion of quantitative research elements into the experimentation process - soil
fertility, soil health (including carbon sequestration), run-off, infiltration, and water
productivity,
•Adaptive and localized research into aspects such as soil and waterconservation, spacing,
varieties, herbicide and weeding regimes, pest control, and local breeding options,
•A maize commodity value chain focus; including relationships with agribusiness, bulk
buying, farmer centres, and local marketing initiatives,
•Support for microfinance and small business development in the CA system.
•Learning and mentorship - for community-level facilitators and lead farmers, internships
for agriculture and rural development studies graduates, postgraduate (MSc and PhD)
opportunities in CA, and short learning programmes for stakeholders, including other
NGOs, research organizations, and government.
•Development of visual and proxy indicators suitable for local-level implementation.
•Cost-benefit and livelihoods improvement analysis for the CA systems at local levels.
•A focus on post-harvest aspects, storage, threshing, and milling.
•Brokering of partnerships in agribusiness, research, and implementation.
•Exploration of alternative financing models, including payment for ecosystem services
and climate change adaptation incentives.
•Production of a CA manual for smallholder farmers (in English and isiZulu).
•Production of articles, conference papers, and presentations by all members of the
implementation team and
•Setting up of innovation platforms and forums that include all role players.
The combination of all these aspects have provided for a coherent CA implementation
process for smallholder farmers. The primary organisational structure through which all the
aspects of learning, experimentation, implementation and value chain development are
negotiated are village-based farmer learning groups. Individual farmers undertake
experimentation suited to their own needs and farming process. Sub-groups of farmers
undertake different experiments, for example new crop varieties and cover crop combinations
and the results are fed back into the learning groups and innovation platforms, allowing for a
cyclical increase in complexity of the system.
1.5HORIZONTAL SCALING
This aspect of the process relies on verbal communication between smallholder farmers as
the basis for awareness raising and spread of CA in and between these communal tenure
villages. It is based on communication in learning groups and also on open days and
stakeholder forums, given that smallholders rarely rely on printed information for their
farming decisions (Smith, et al., 2017).
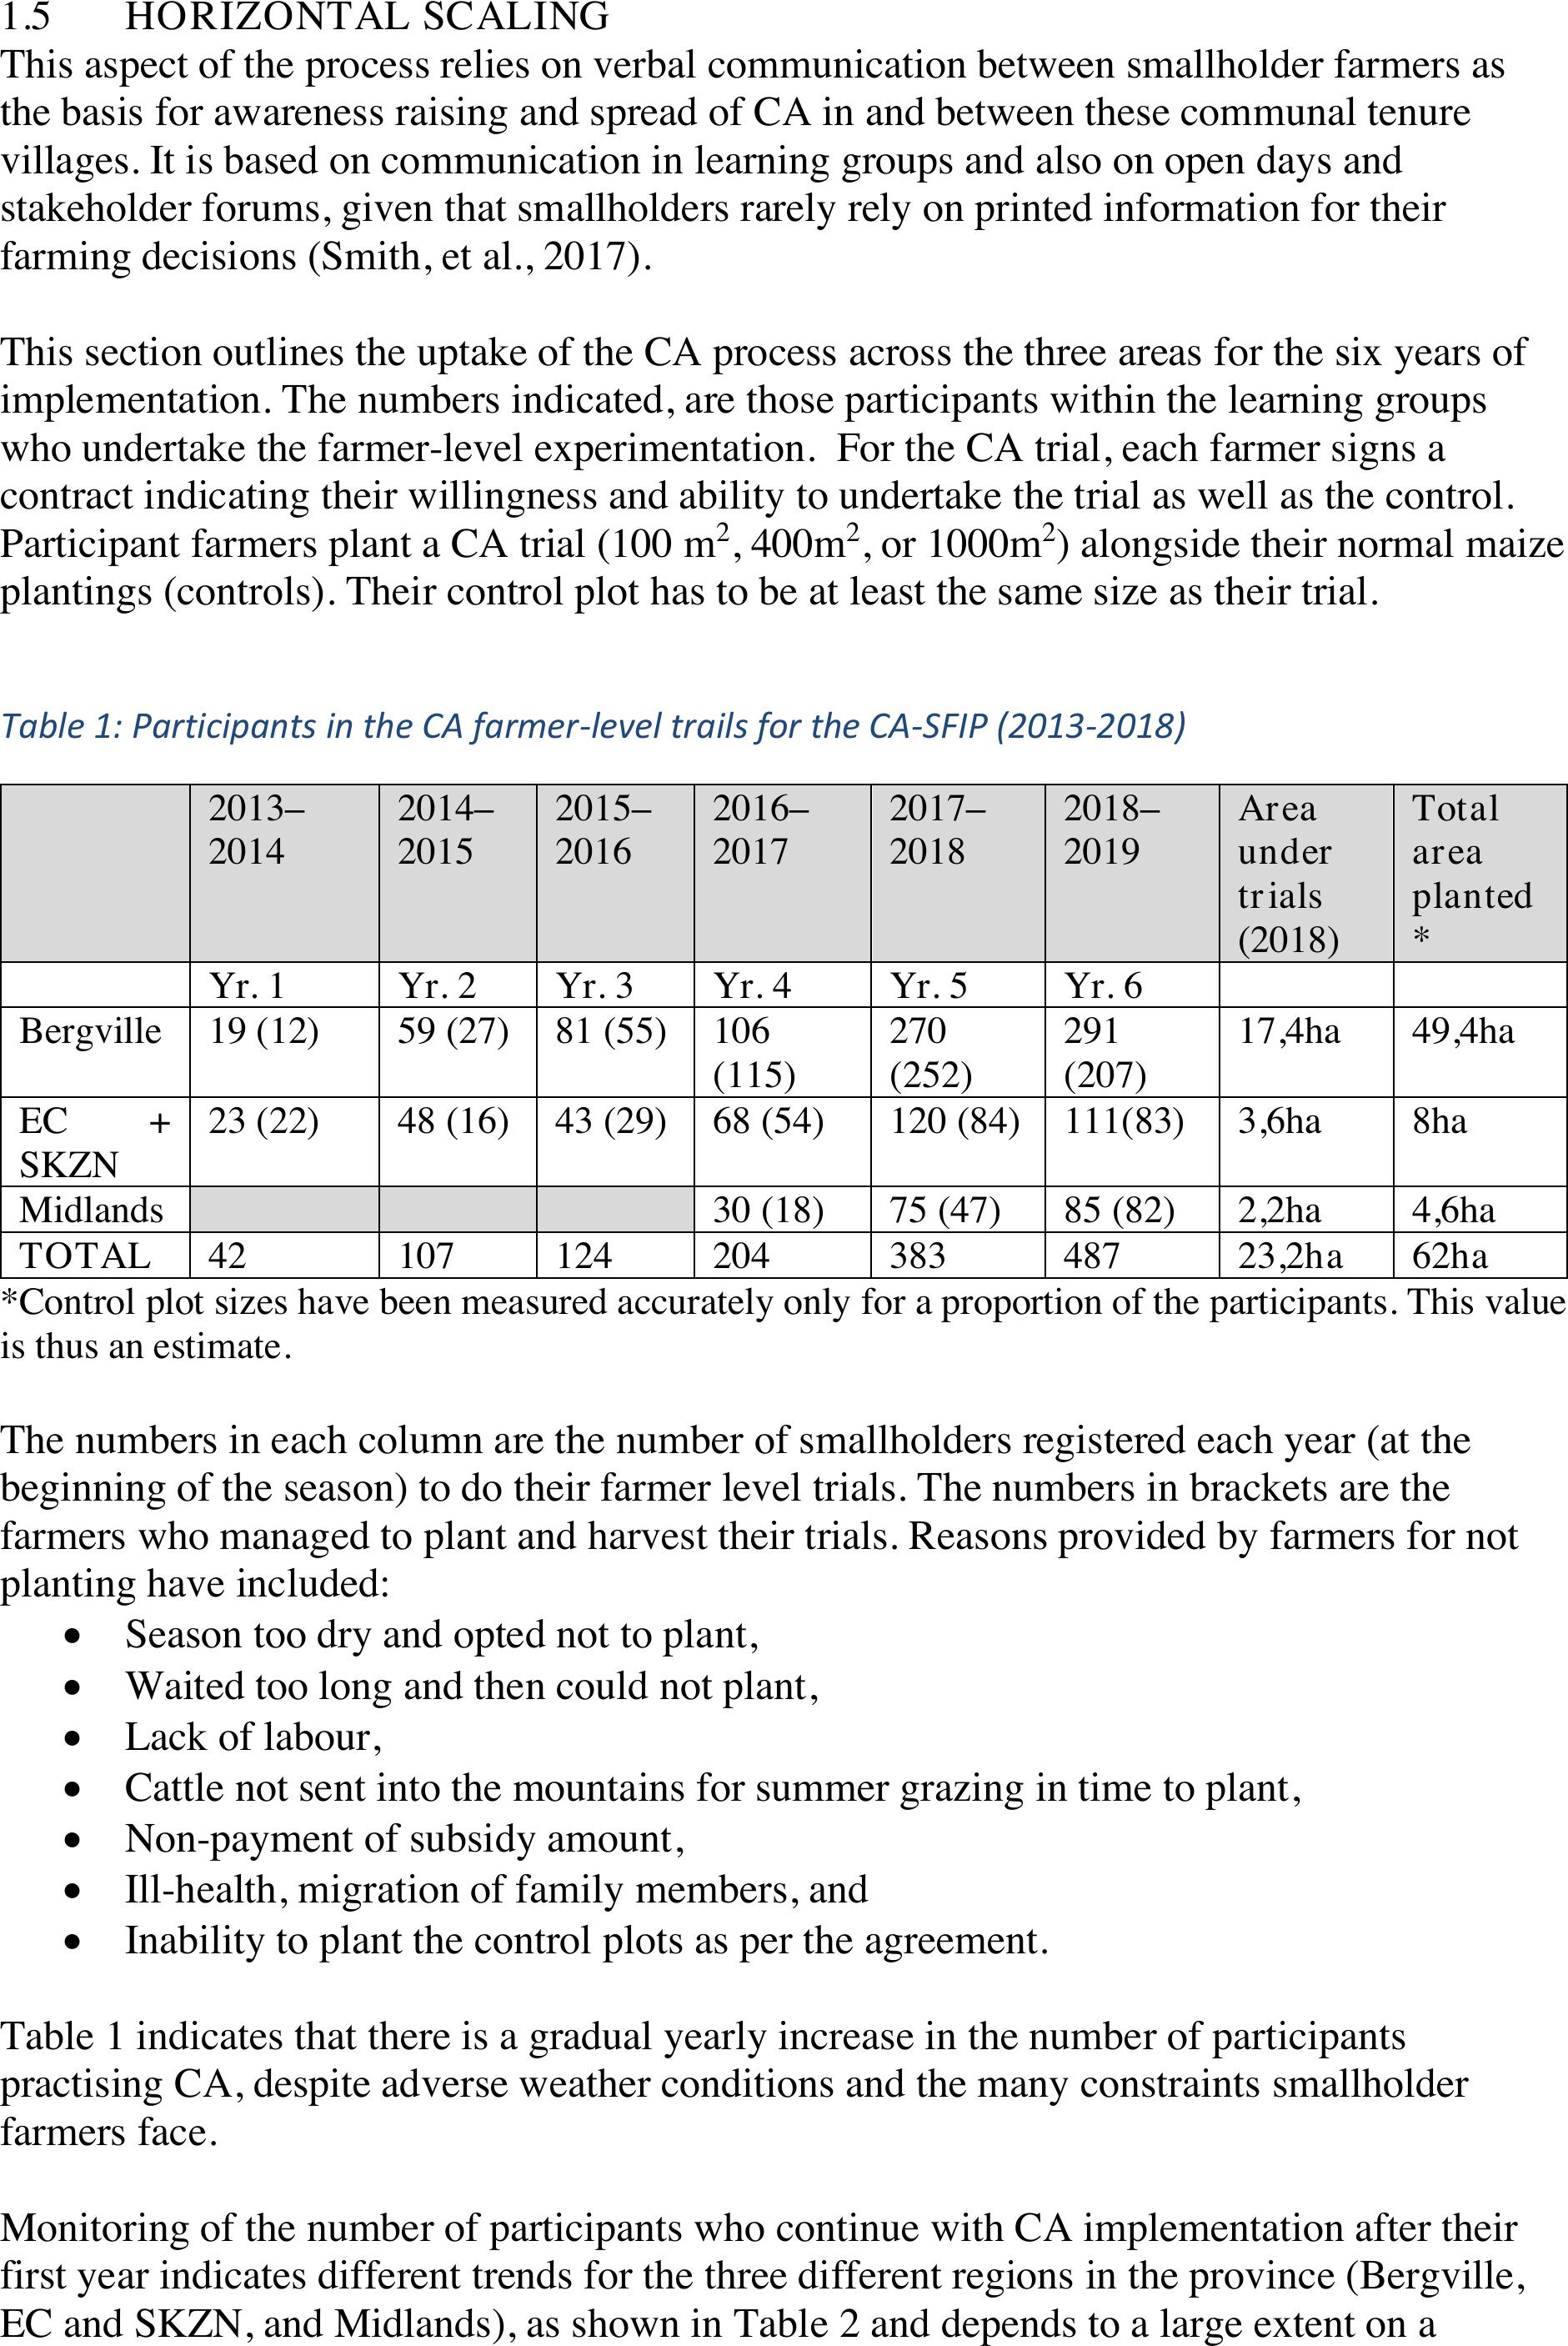
This section outlines the uptake of the CA process across the three areas for the six years of
implementation. The numbers indicated, are those participants within the learning groups
who undertake the farmer-level experimentation. For the CA trial, each farmer signs a
contract indicating their willingness and ability to undertake the trial as well as the control.
Participant farmers plant a CA trial (100 m2, 400m2, or 1000m2) alongside their normal maize
plantings (controls). Their control plot has to be at least the same size as their trial.
Table 1: Participants in the CA farmer-level trails for the CA-SFIP (2013-2018)
2013–
2014
2014–
2015
2015–
2016
2016–
2017
2017–
2018
2018–
2019
Area
under
trials
(2018)
Total
area
planted
*
Yr. 1
Yr. 2
Yr. 3
Yr. 4
Yr. 5
Yr. 6
Bergville
19 (12)
59 (27)
81 (55)
106
(115)
270
(252)
291
(207)
17,4ha
49,4ha
EC +
SKZN
23 (22)
48 (16)
43 (29)
68 (54)
120 (84)
111(83)
3,6ha
8ha
Midlands
30 (18)
75 (47)
85 (82)
2,2ha
4,6ha
TOTAL
42
107
124
204
383
487
23,2ha
62ha
*Control plot sizes have been measured accurately only for a proportion of the participants. This value
is thus an estimate.
The numbers in each column are the number of smallholders registered each year (at the
beginning of the season) to do their farmer level trials. The numbers in brackets are the
farmers who managed to plant and harvest their trials. Reasons provided by farmers for not
planting have included:
•Season too dry and opted not to plant,
•Waited too long and then could not plant,
•Lack of labour,
•Cattle not sent into the mountains for summer grazing in time to plant,
•Non-payment of subsidy amount,
•Ill-health, migration of family members, and
•Inability to plant the control plots as per the agreement.
Table 1 indicates that there is a gradual yearly increase in the number of participants
practising CA, despite adverse weather conditions and the many constraints smallholder
farmers face.
Monitoring of the number of participants who continue with CA implementation after their
first year indicates different trends for the three different regions in the province (Bergville,
EC and SKZN, and Midlands), as shown in Table 2 and depends to a large extent on a
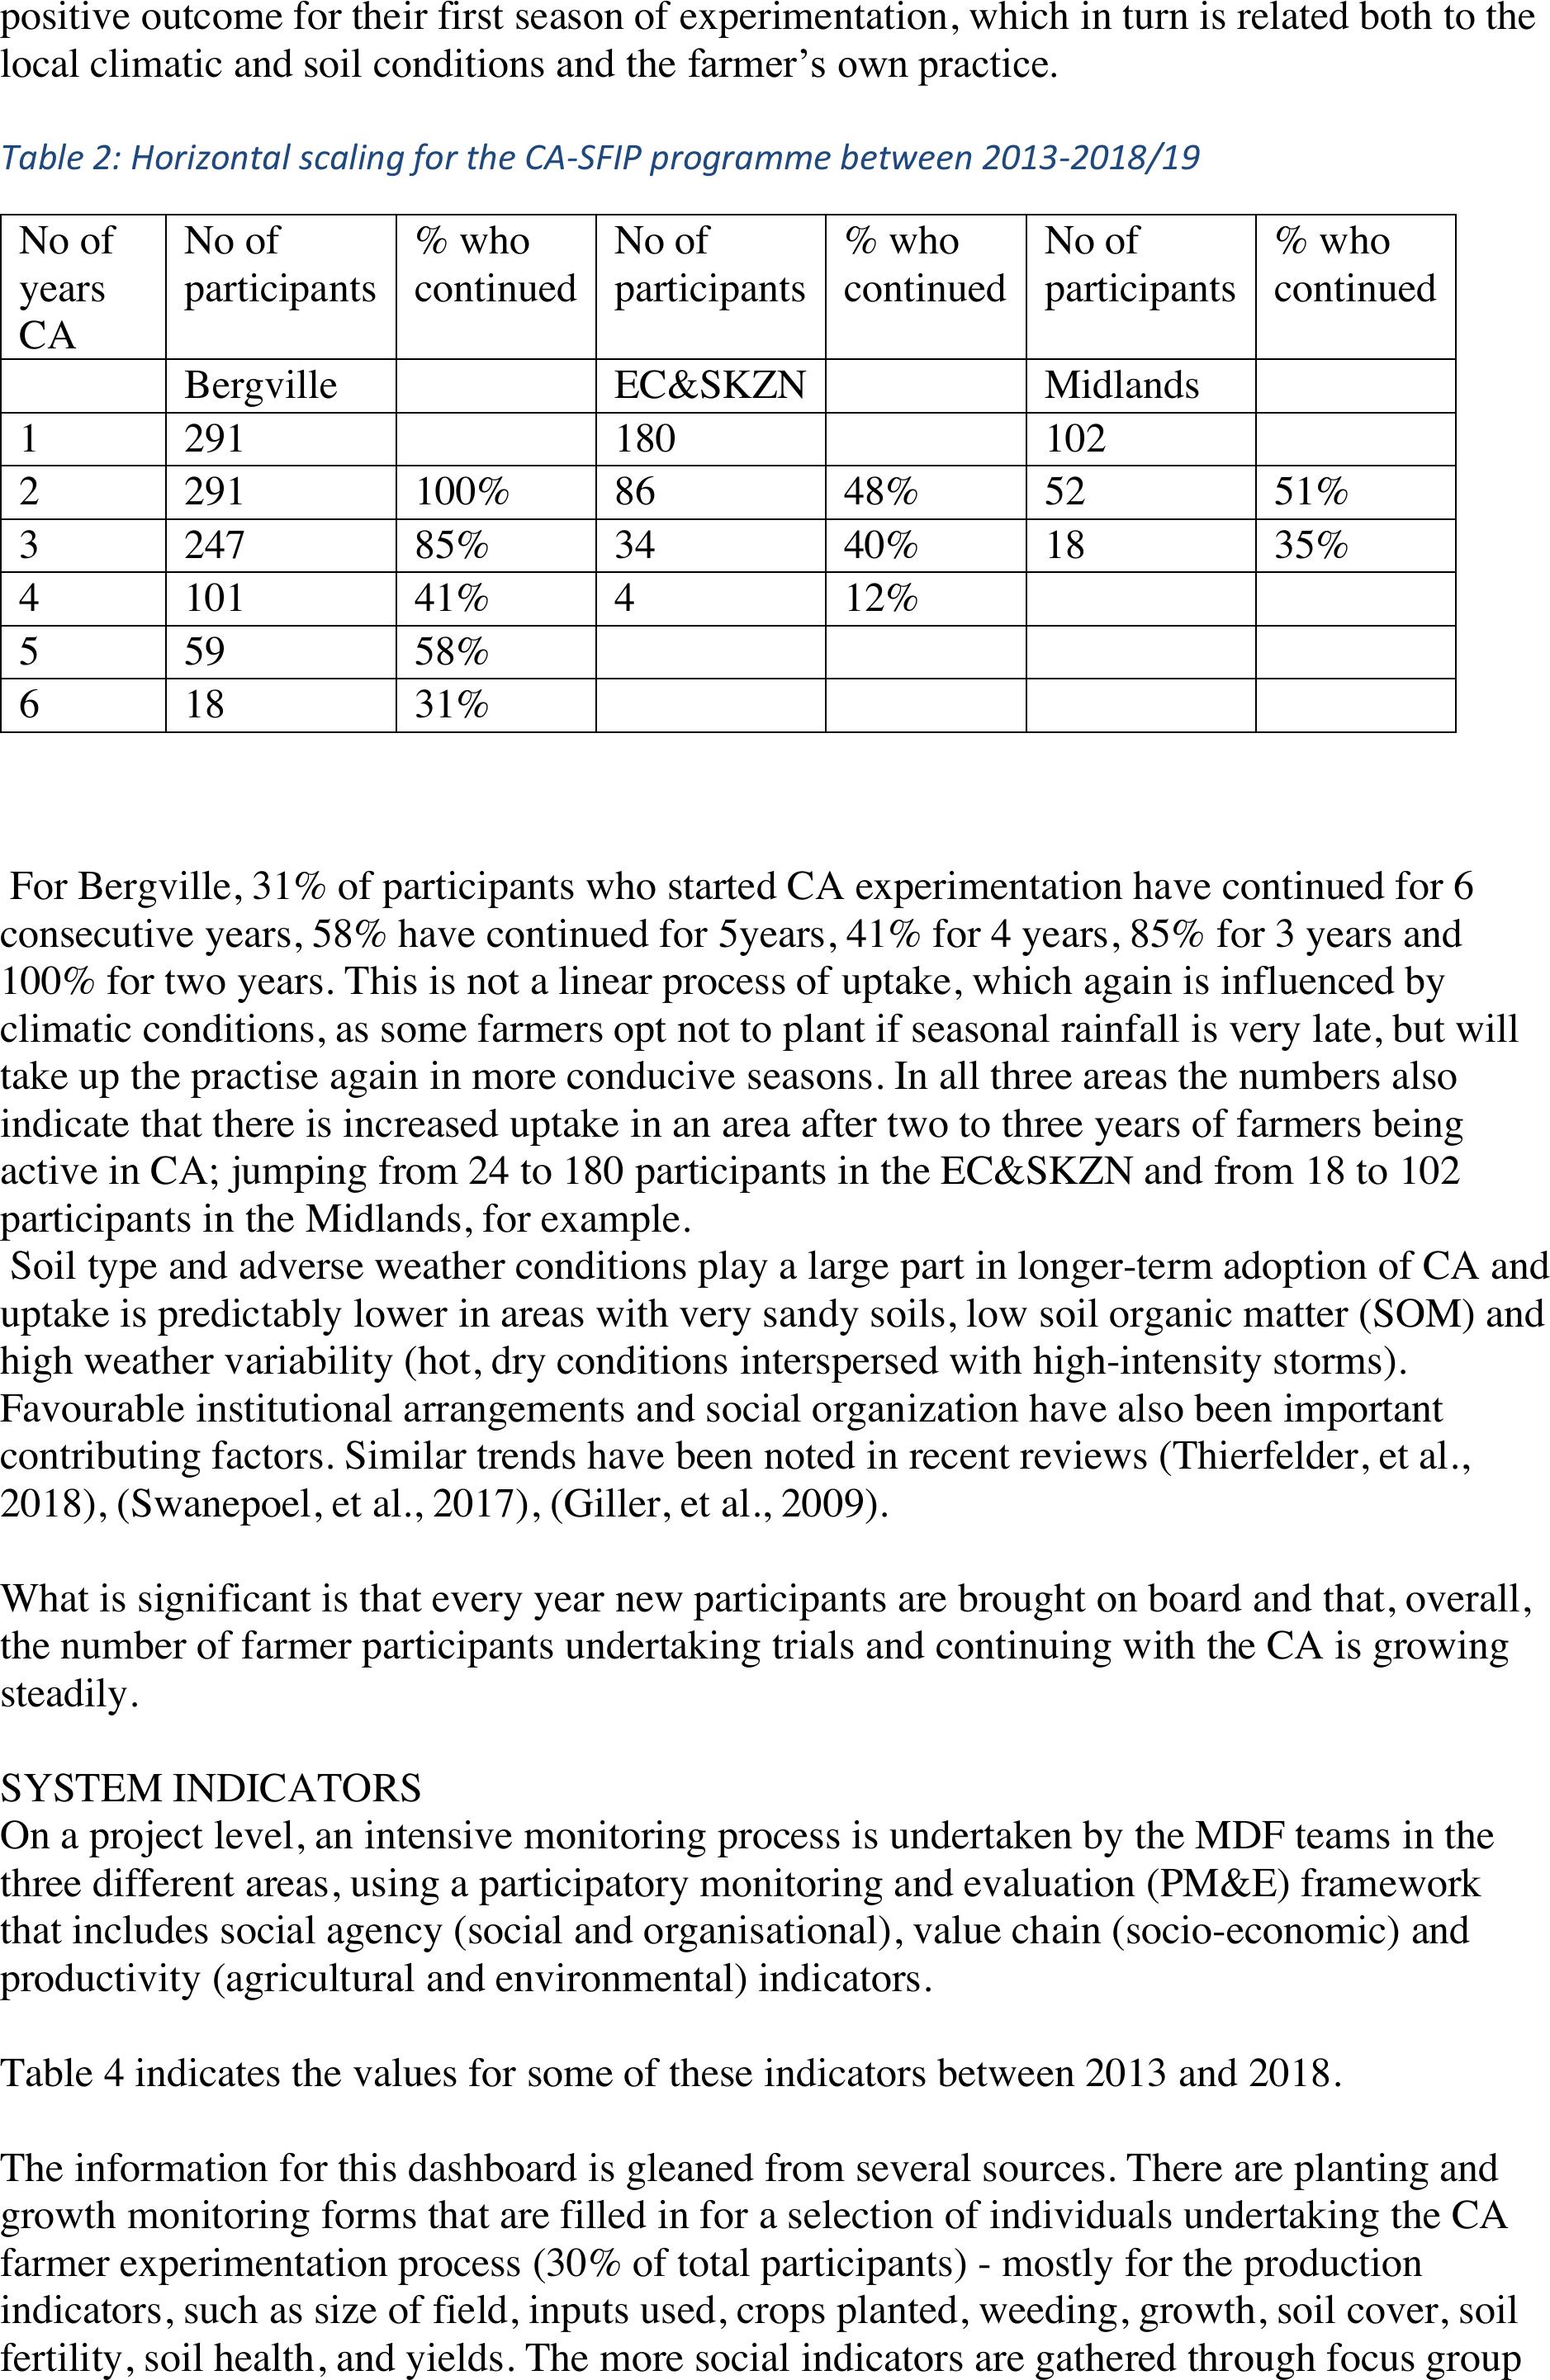
positive outcome for their first season of experimentation, which in turn is related both to the
local climatic and soil conditions and the farmer’s own practice.
Table 2: Horizontal scaling for the CA-SFIP programme between 2013-2018/19
No of
years
CA
No of
participants
% who
continued
No of
participants
% who
continued
No of
participants
% who
continued
Bergville
EC&SKZN
Midlands
1
291
180
102
2
291
100%
86
48%
52
51%
3
247
85%
34
40%
18
35%
4
101
41%
4
12%
5
59
58%
6
18
31%
For Bergville, 31% of participants who started CA experimentation have continued for 6
consecutive years, 58% have continued for 5years, 41% for 4 years, 85% for 3 years and
100% for two years. This is not a linear process of uptake, which again is influenced by
climatic conditions, as some farmers opt not to plant if seasonal rainfall is very late, but will
take up the practise again in more conducive seasons. In all three areas the numbers also
indicate that there is increased uptake in an area after two to three years of farmers being
active in CA; jumping from 24 to 180 participants in the EC&SKZN and from 18 to 102
participants in the Midlands, for example.
Soil type and adverse weather conditions play a large part in longer-term adoption of CA and
uptake is predictably lower in areas with very sandy soils, low soil organic matter (SOM) and
high weather variability (hot, dry conditions interspersed with high-intensity storms).
Favourable institutional arrangements and social organization have also been important
contributing factors. Similar trends have been noted in recent reviews (Thierfelder, et al.,
2018), (Swanepoel, et al., 2017), (Giller, et al., 2009).
What is significant is that every year new participants are brought on board and that, overall,
the number of farmer participants undertaking trials and continuing with the CA is growing
steadily.
SYSTEM INDICATORS
On a project level, an intensive monitoring process is undertaken by the MDF teams in the
three different areas, using a participatory monitoring and evaluation (PM&E) framework
that includes social agency (social and organisational), value chain (socio-economic) and
productivity (agricultural and environmental) indicators.
Table 4 indicates the values for some of these indicators between 2013 and 2018.
The information for this dashboard is gleaned from several sources. There are planting and
growth monitoring forms that are filled in for a selection of individuals undertaking the CA
farmer experimentation process (30% of total participants) - mostly for the production
indicators, such as size of field, inputs used, crops planted, weeding, growth, soil cover, soil
fertility, soil health, and yields. The more social indicators are gathered through focus group
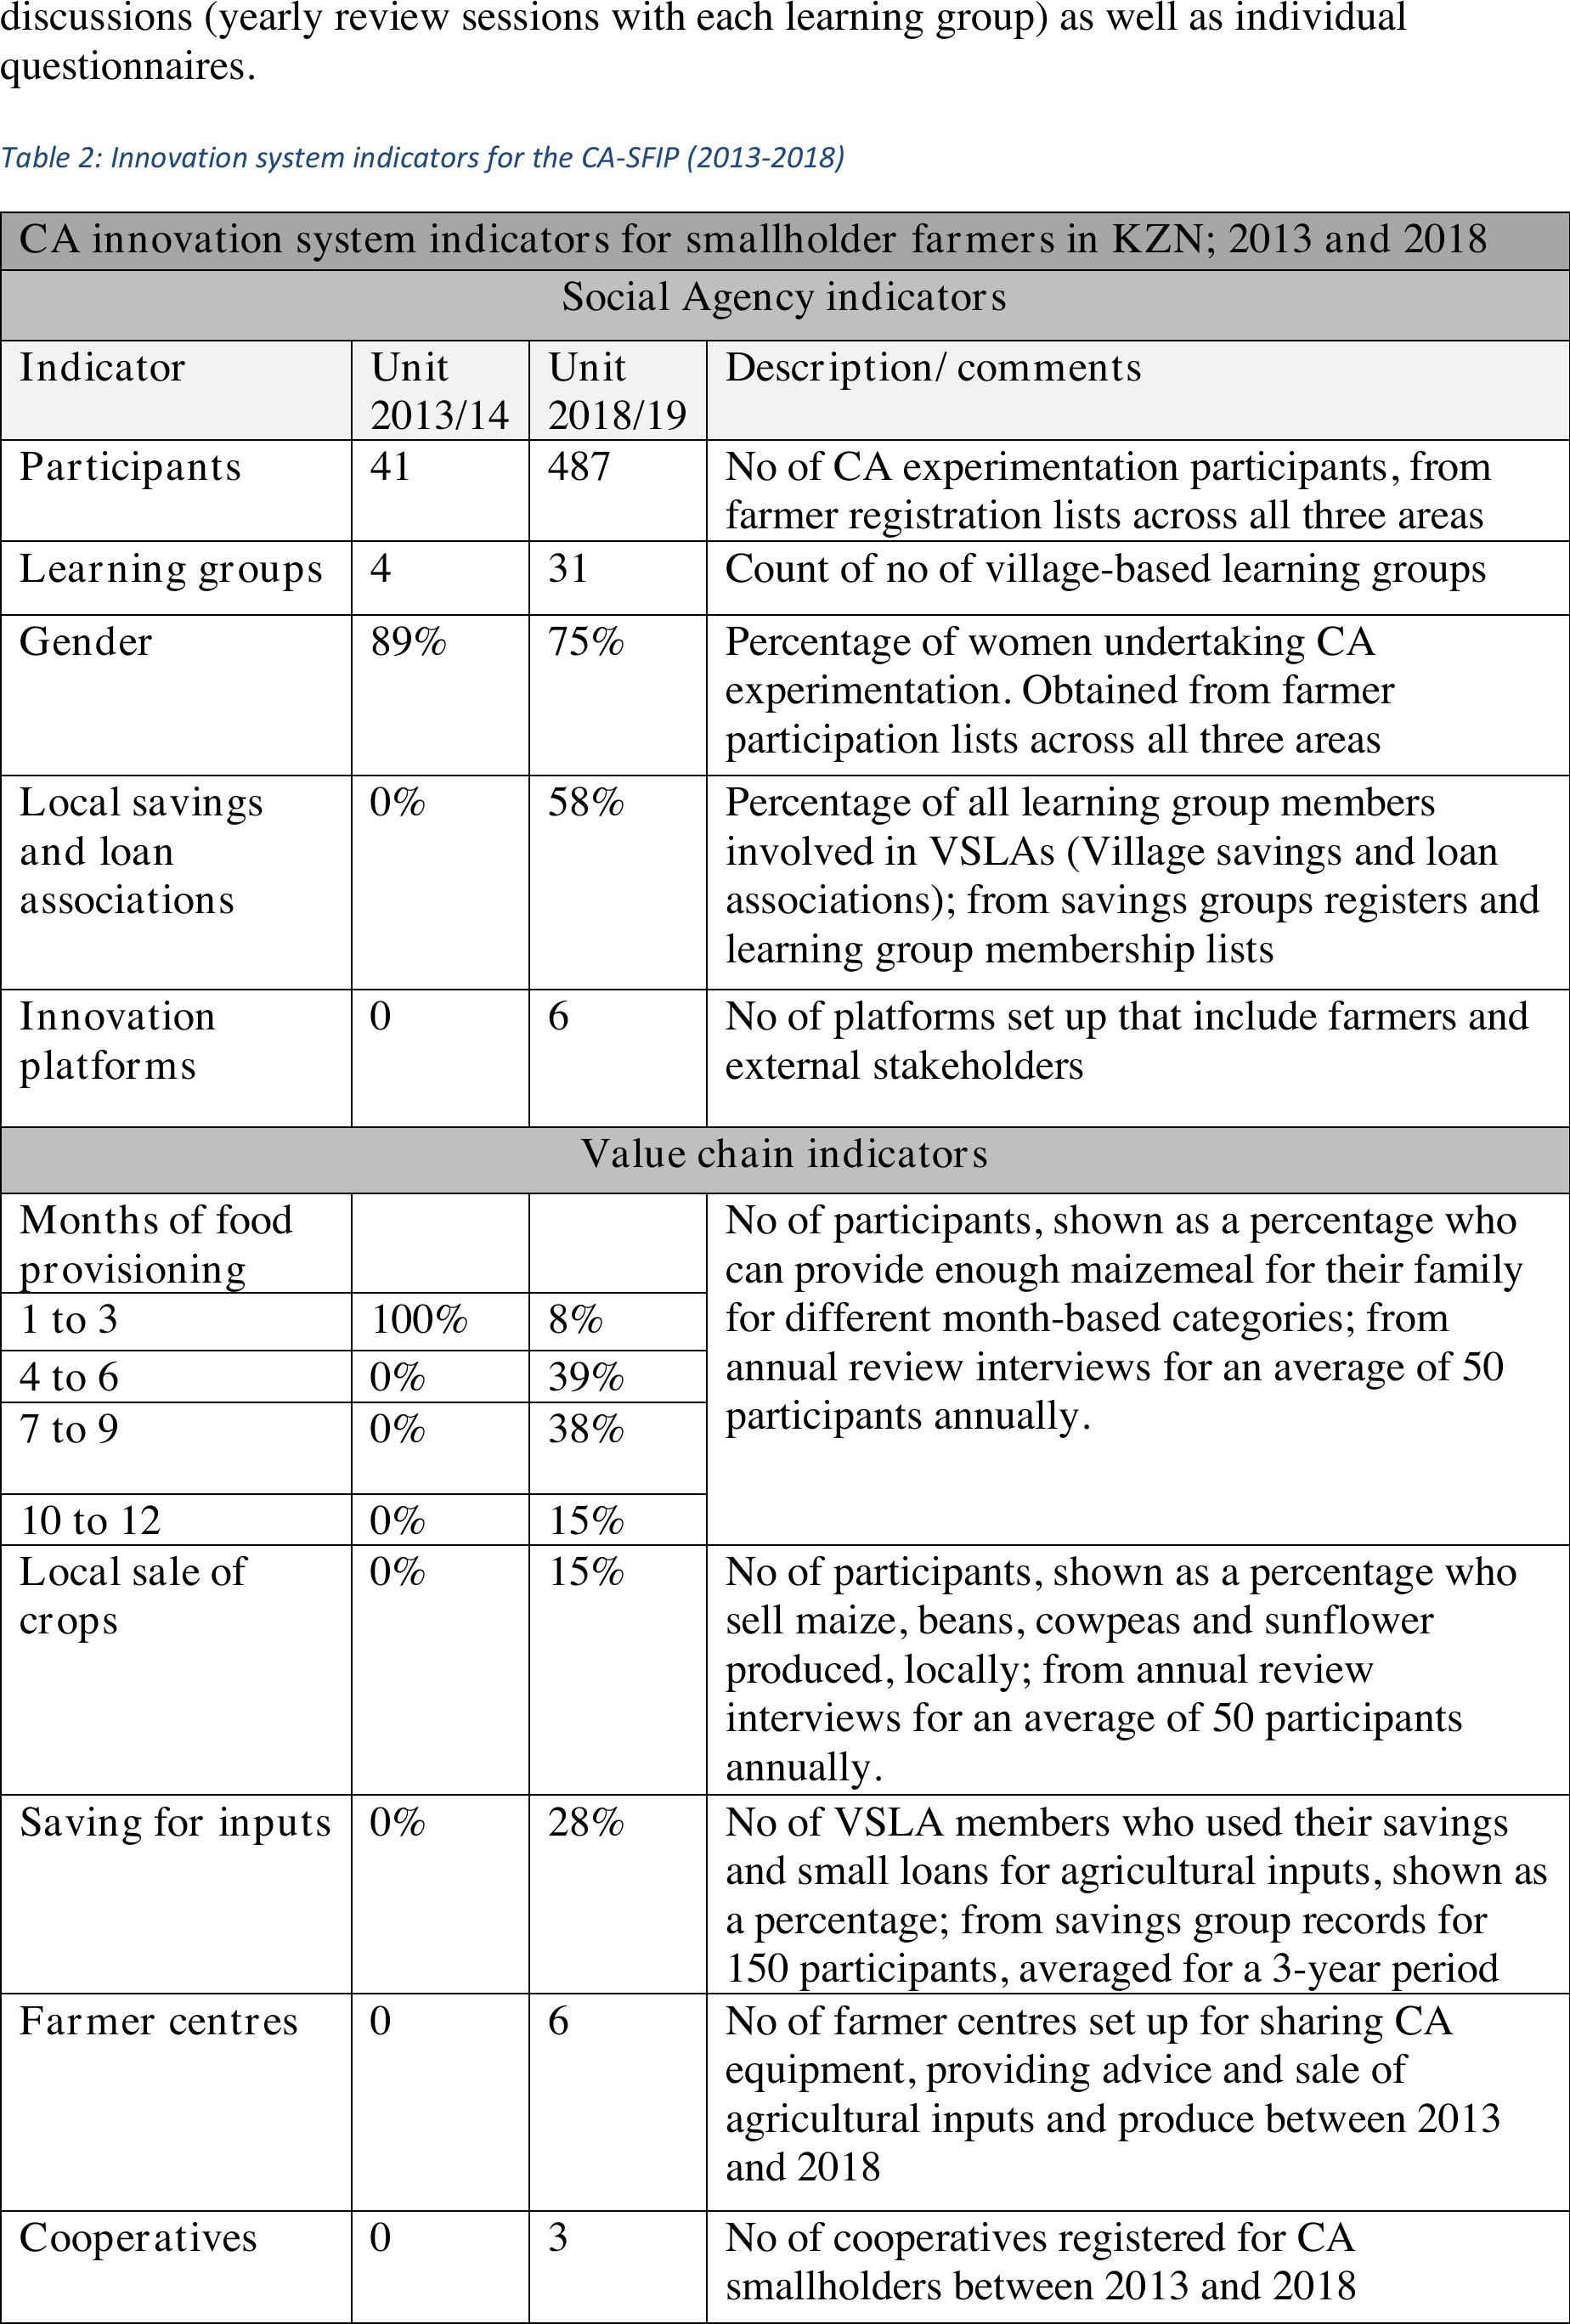
discussions (yearly review sessions with each learning group) as well as individual
questionnaires.
Table 2: Innovation system indicators for the CA-SFIP (2013-2018)
CA innovation system indicators for smallholder farmers in KZN; 2013 and 2018
Social Agency indicators
Indicator
Unit
2013/14
Unit
2018/19
Description/ comments
Participants
41
487
No of CA experimentation participants, from
farmer registration lists across all three areas
Learning groups
4
31
Count of no of village-based learning groups
Gender
89%
75%
Percentage of women undertaking CA
experimentation. Obtained from farmer
participation lists across all three areas
Local savings
and loan
associations
0%
58%
Percentage of all learning group members
involved in VSLAs (Village savings and loan
associations); from savings groups registers and
learning group membership lists
Innovation
platforms
0
6
No of platforms set up that include farmers and
external stakeholders
Value chain indicators
Months of food
provisioning
No of participants, shown as a percentage who
can provide enough maizemeal for their family
for different month-based categories; from
annual review interviews for an average of 50
participants annually.
1 to 3
100%
8%
4 to 6
0%
39%
7 to 9
0%
38%
10 to 12
0%
15%
Local sale of
crops
0%
15%
No of participants, shown as a percentage who
sell maize, beans, cowpeas and sunflower
produced, locally; from annual review
interviews for an average of 50 participants
annually.
Saving for inputs
0%
28%
No of VSLA members who used their savings
and small loans for agricultural inputs, shown as
a percentage; from savings group records for
150 participants, averaged for a 3-year period
Farmer centres
0
6
No of farmer centres set up for sharing CA
equipment, providing advice and sale of
agricultural inputs and produce between 2013
and 2018
Cooperatives
0
3
No of cooperatives registered for CA
smallholders between 2013 and 2018
Co-financing of
local
infrastructure
0
3
No of learning groups who took advantage of
the matching grant funding to finance local
mills, threshers and water infrastructure or
supplementary irrigation
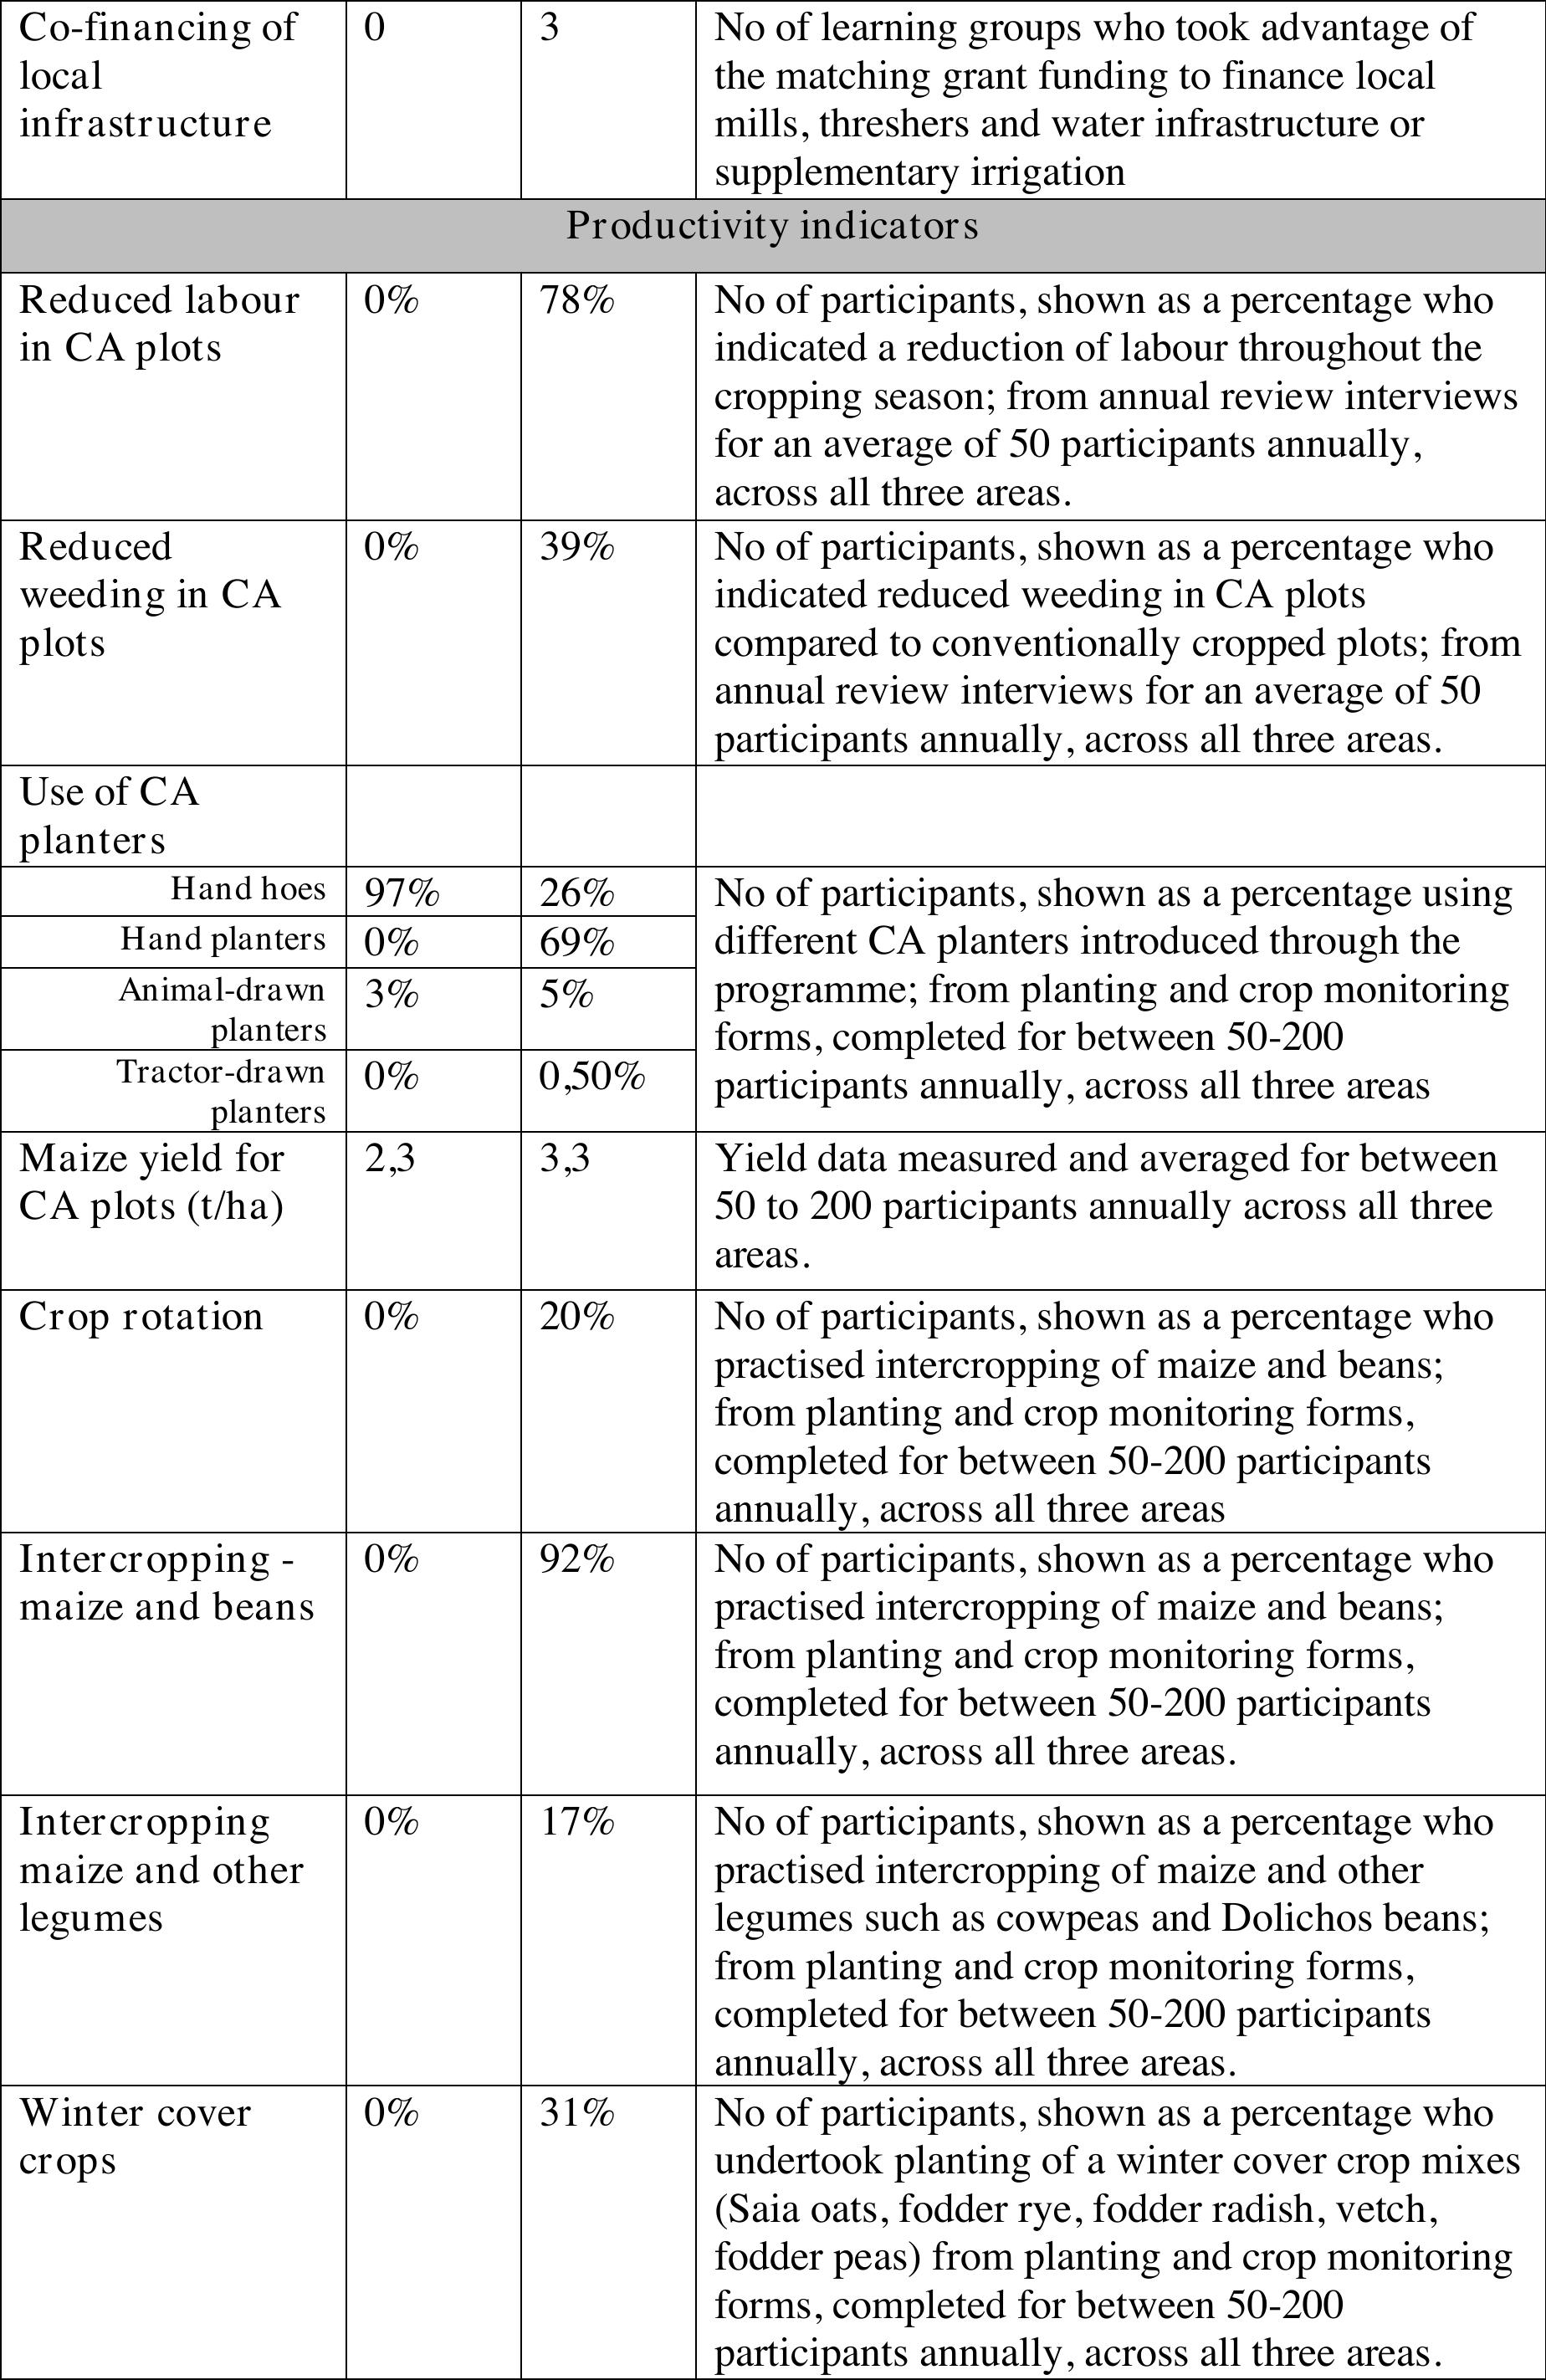
Productivity indicators
Reduced labour
in CA plots
0%
78%
No of participants, shown as a percentage who
indicated a reduction of labour throughout the
cropping season; from annual review interviews
for an average of 50 participants annually,
across all three areas.
Reduced
weeding in CA
plots
0%
39%
No of participants, shown as a percentage who
indicated reduced weeding in CA plots
compared to conventionally cropped plots; from
annual review interviews for an average of 50
participants annually, across all three areas.
Use of CA
planters
Hand hoes
97%
26%
No of participants, shown as a percentage using
different CA planters introduced through the
programme; from planting and crop monitoring
forms, completed for between 50-200
participants annually, across all three areas
Hand planters
0%
69%
Animal-drawn
planters
3%
5%
Tractor-drawn
planters
0%
0,50%
Maize yield for
CA plots (t/ha)
2,3
3,3
Yield data measured and averaged for between
50 to 200 participants annually across all three
areas.
Crop rotation
0%
20%
No of participants, shown as a percentage who
practised intercropping of maize and beans;
from planting and crop monitoring forms,
completed for between 50-200 participants
annually, across all three areas
Intercropping -
maize and beans
0%
92%
No of participants, shown as a percentage who
practised intercropping of maize and beans;
from planting and crop monitoring forms,
completed for between 50-200 participants
annually, across all three areas.
Intercropping
maize and other
legumes
0%
17%
No of participants, shown as a percentage who
practised intercropping of maize and other
legumes such as cowpeas and Dolichos beans;
from planting and crop monitoring forms,
completed for between 50-200 participants
annually, across all three areas.
Winter cover
crops
0%
31%
No of participants, shown as a percentage who
undertook planting of a winter cover crop mixes
(Saia oats, fodder rye, fodder radish, vetch,
fodder peas) from planting and crop monitoring
forms, completed for between 50-200
participants annually, across all three areas.
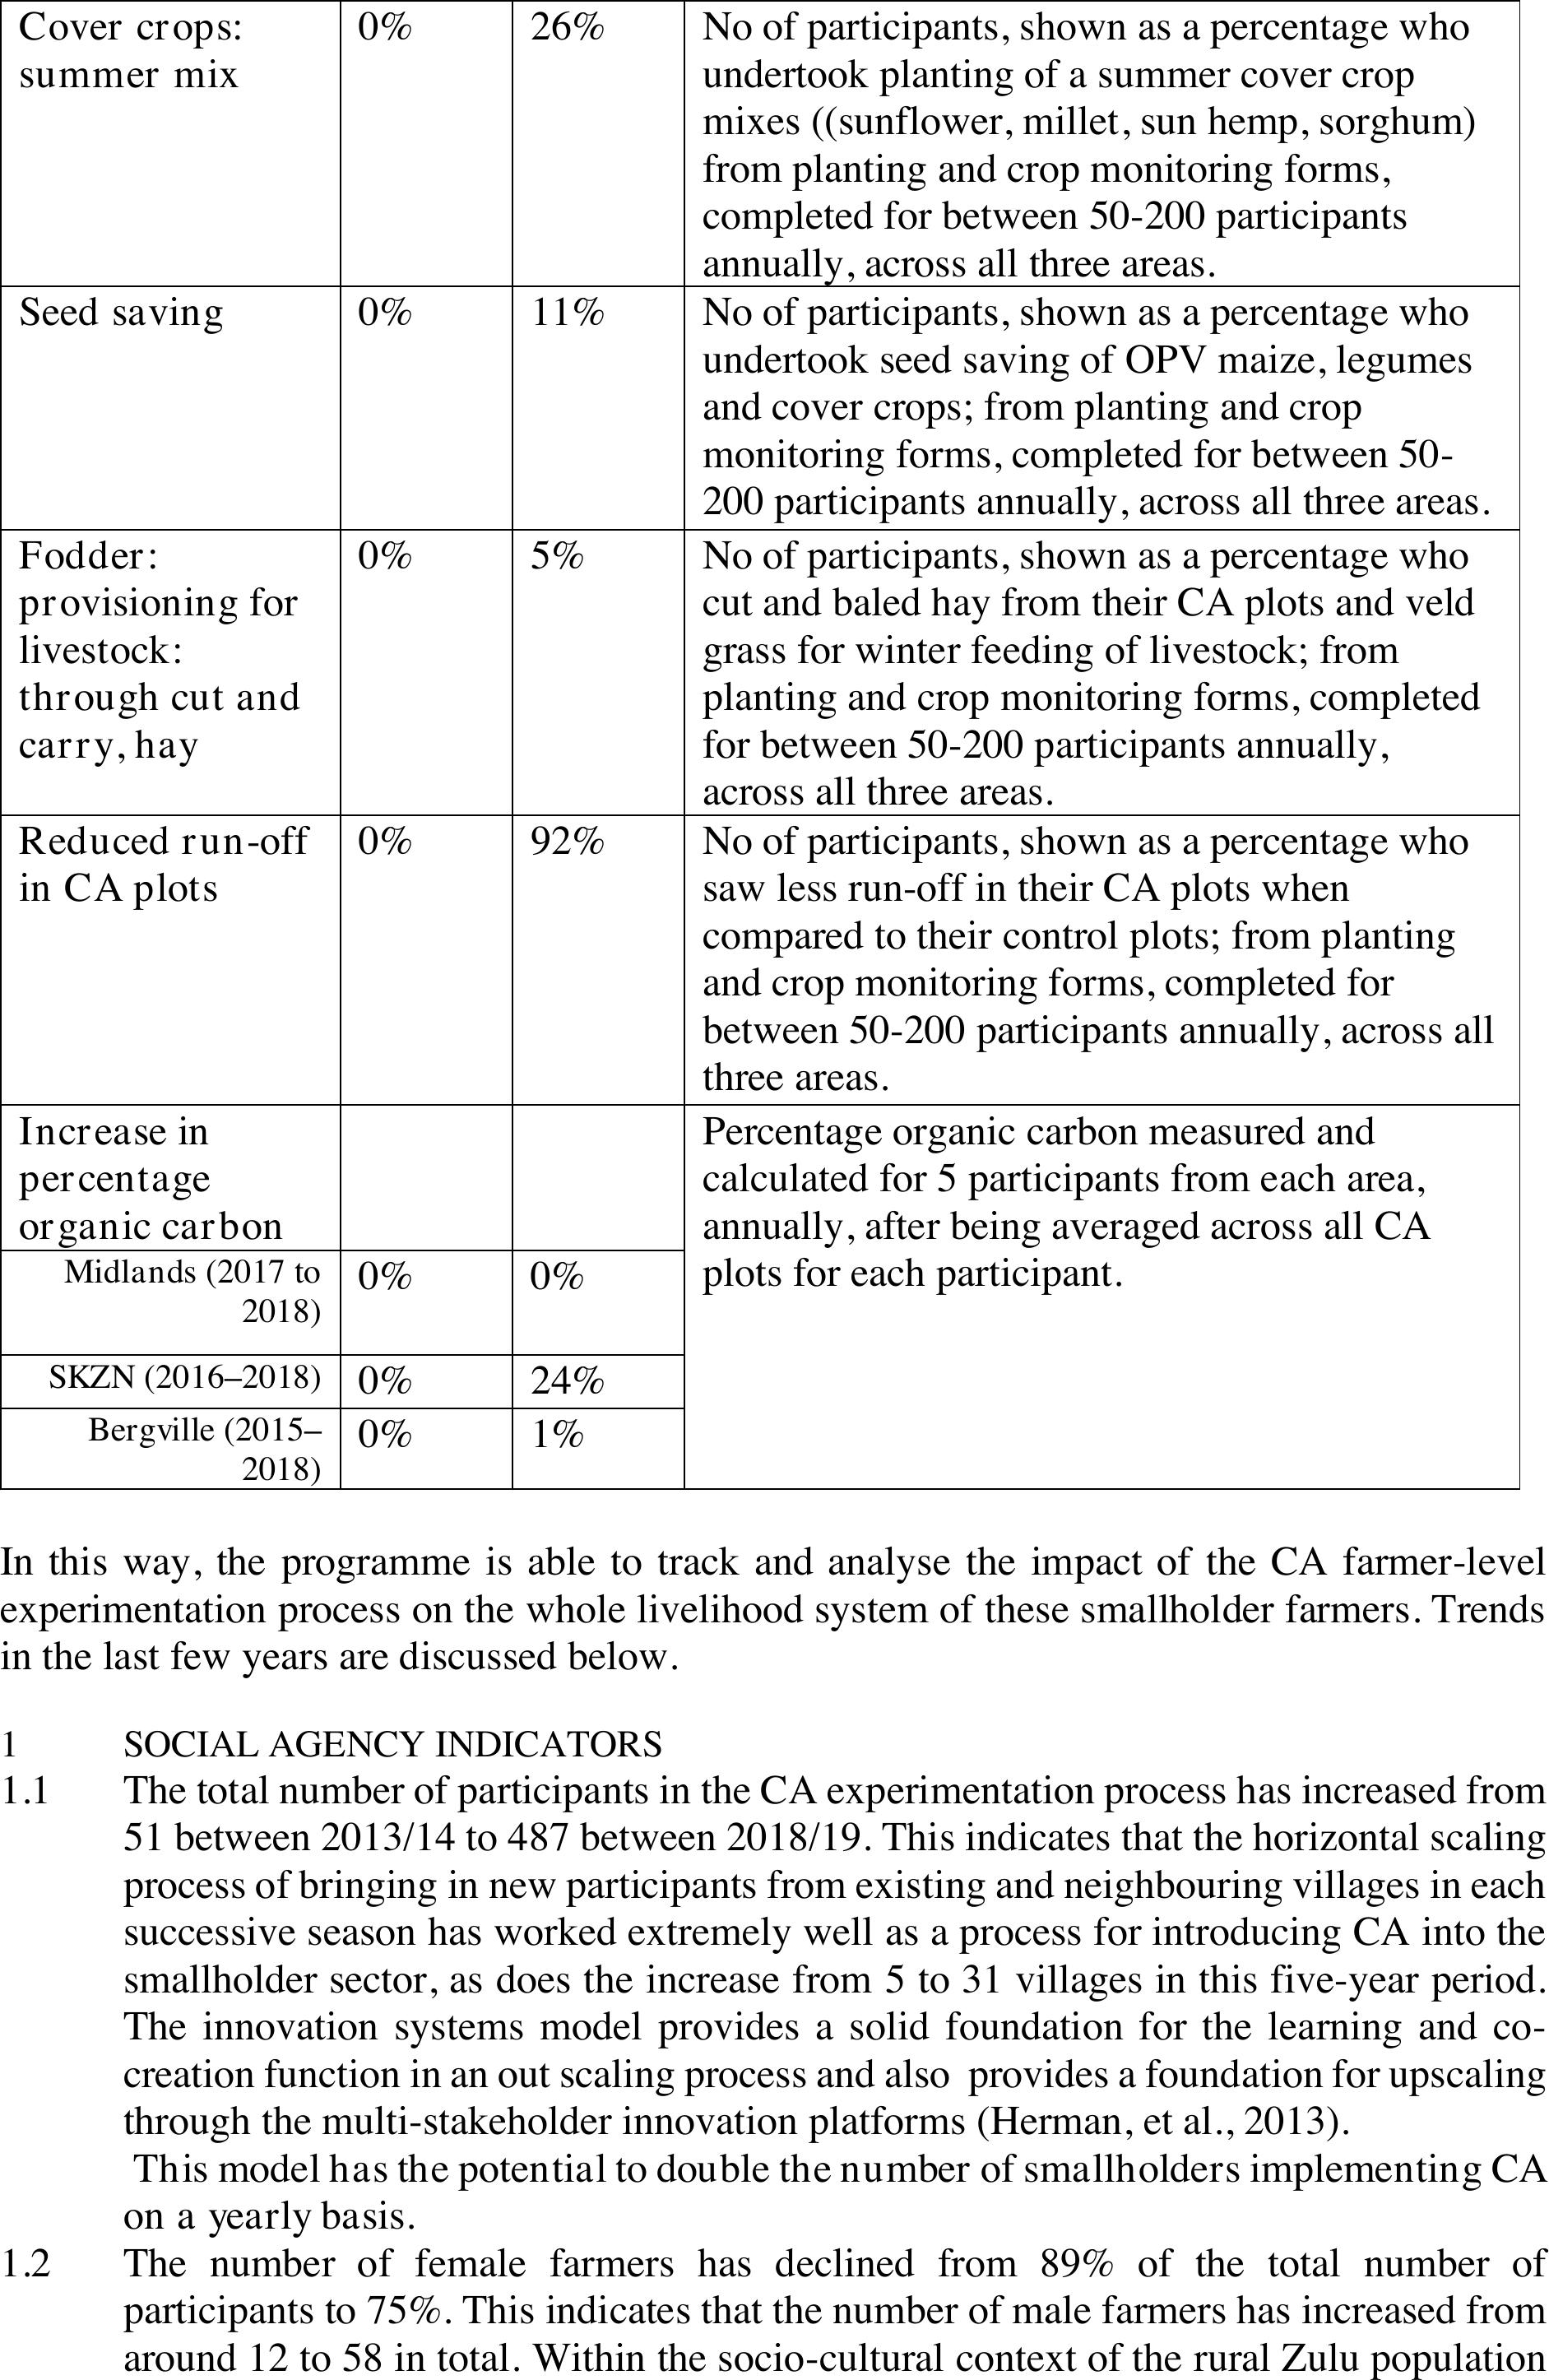
Cover crops:
summer mix
0%
26%
No of participants, shown as a percentage who
undertook planting of a summer cover crop
mixes ((sunflower, millet, sun hemp, sorghum)
from planting and crop monitoring forms,
completed for between 50-200 participants
annually, across all three areas.
Seed saving
0%
11%
No of participants, shown as a percentage who
undertook seed saving of OPV maize, legumes
and cover crops; from planting and crop
monitoring forms, completed for between 50-
200 participants annually, across all three areas.
Fodder:
provisioning for
livestock:
through cut and
carry, hay
0%
5%
No of participants, shown as a percentage who
cut and baled hay from their CA plots and veld
grass for winter feeding of livestock; from
planting and crop monitoring forms, completed
for between 50-200 participants annually,
across all three areas.
Reduced run-off
in CA plots
0%
92%
No of participants, shown as a percentage who
saw less run-off in their CA plots when
compared to their control plots; from planting
and crop monitoring forms, completed for
between 50-200 participants annually, across all
three areas.
Increase in
percentage
organic carbon
Percentage organic carbon measured and
calculated for 5 participants from each area,
annually, after being averaged across all CA
plots for each participant.
Midlands (2017 to
2018)
0%
0%
SKZN (2016–2018)
0%
24%
Bergville (2015–
2018)
0%
1%
In this way, the programme is able to track and analyse the impact of the CA farmer-level
experimentation process on the whole livelihood system of these smallholder farmers. Trends
in the last few years are discussed below.
1SOCIAL AGENCY INDICATORS
1.1The total number of participants in the CA experimentation process has increased from
51 between 2013/14 to 487 between 2018/19. This indicates that the horizontal scaling
process of bringing in new participants from existing and neighbouringvillages in each
successive season has worked extremely well as a process for introducing CA into the
smallholder sector, as does the increase from5 to 31 villages inthis five-year period.
The innovation systems model provides a solid foundation for the learning and co-
creation function in an out scaling process and also provides a foundation for upscaling
through the multi-stakeholder innovation platforms (Herman, et al., 2013).
This model has the potential to double the number of smallholders implementing CA
on a yearly basis.
1.2The number of female farmers has declined from 89% of the total number of
participants to 75%. This indicates that the number of male farmers has increased from
around 12 to 58 in total. Within the socio-cultural context of the rural Zulu population
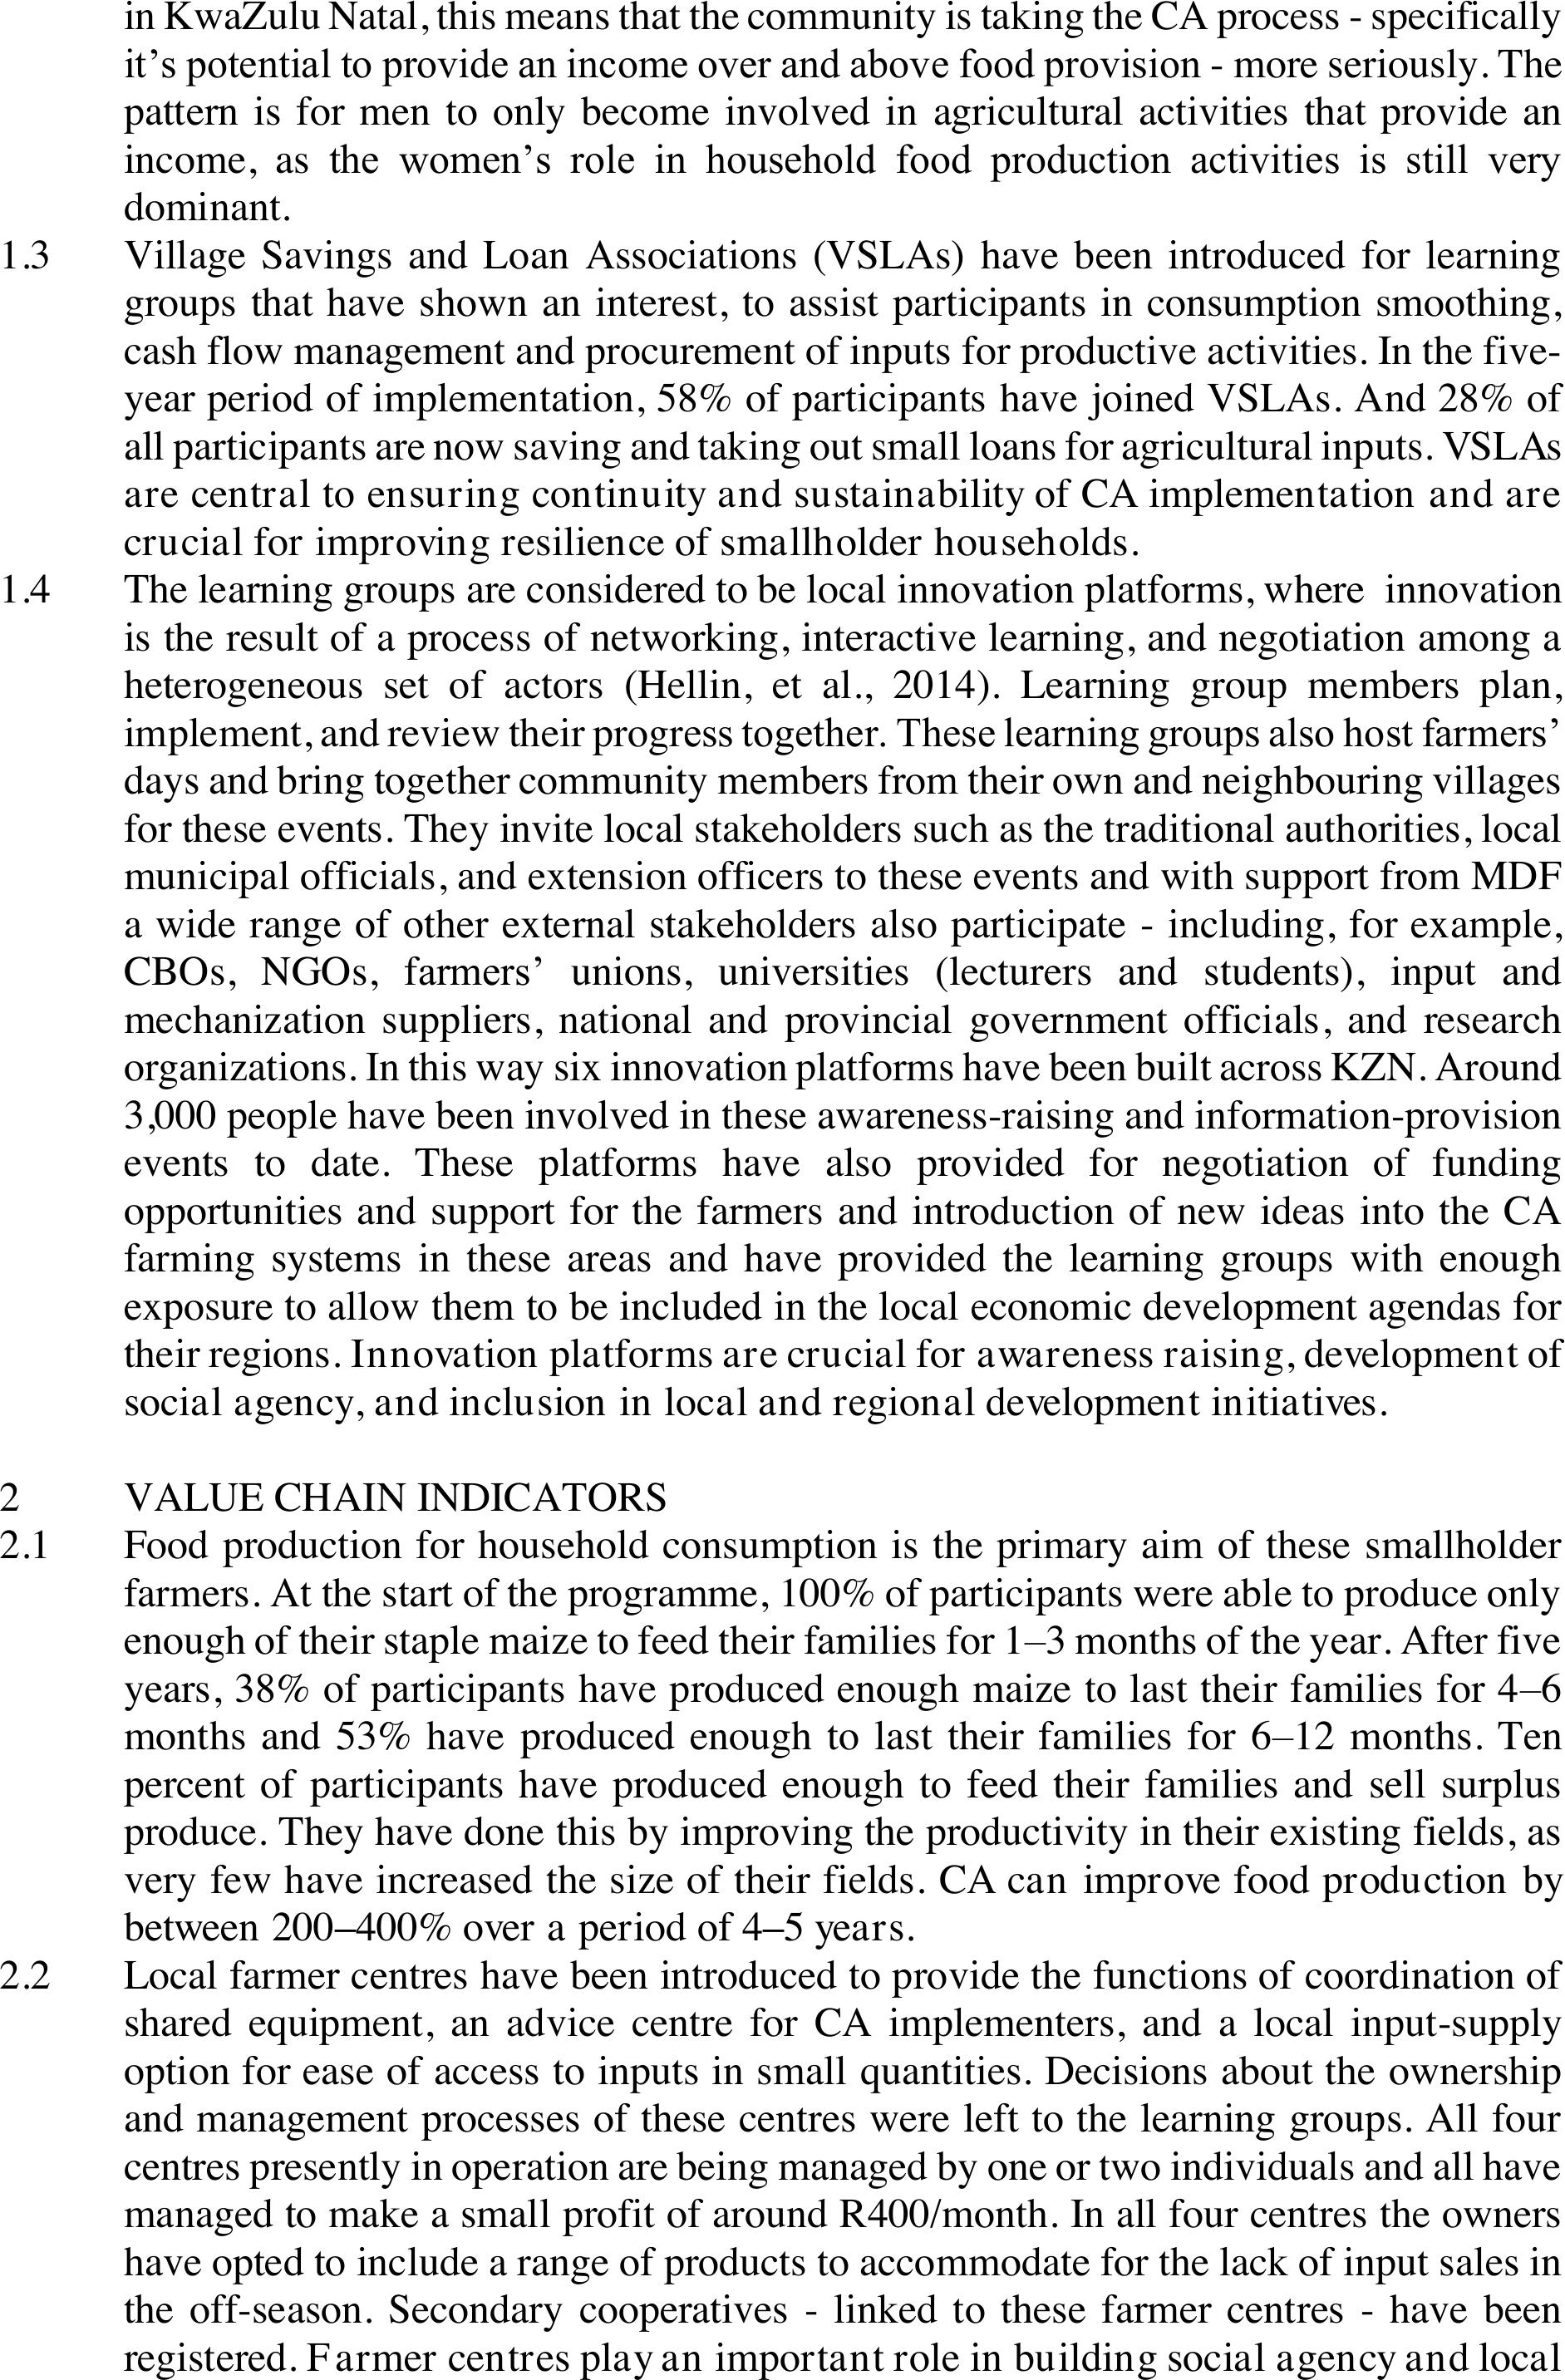
in KwaZulu Natal, this means that the community is taking the CA process - specifically
it’s potential to provide an incomeover and above food provision - more seriously. The
pattern is for men to only become involved in agricultural activities that provide an
income, as the women’s role in household food production activities is still very
dominant.
1.3Village Savings and Loan Associations (VSLAs) have been introduced for learning
groups that have shown an interest, to assist participants in consumption smoothing,
cash flow management and procurement of inputs for productive activities. In the five-
year period of implementation, 58% of participantshave joined VSLAs. And 28% of
all participants are nowsaving and taking out small loans for agricultural inputs. VSLAs
are central to ensuring continuity and sustainability of CA implementation and are
crucial for improving resilience of smallholder households.
1.4The learning groups are considered to be local innovation platforms, where innovation
is the result of a process of networking, interactive learning, and negotiation among a
heterogeneous set of actors (Hellin, et al., 2014). Learning group members plan,
implement, and review their progress together. These learning groups also host farmers’
days and bring together community members from their own and neighbouring villages
for these events. They invite local stakeholders such as the traditional authorities, local
municipal officials, and extension officers to these events and with support from MDF
a widerange of other external stakeholders also participate - including, for example,
CBOs, NGOs, farmers’ unions, universities (lecturers and students), input and
mechanization suppliers, national and provincial government officials, and research
organizations. In this way six innovation platforms have been built across KZN. Around
3,000 people have been involved in these awareness-raising and information-provision
events to date. These platforms have also provided for negotiation of funding
opportunities and support for the farmers and introduction of new ideas into the CA
farming systems in these areas and have provided the learning groups with enough
exposure to allow them to be included inthe local economic development agendas for
their regions.Innovation platforms are crucial for awareness raising, development of
social agency, and inclusion in local and regional development initiatives.
2VALUE CHAIN INDICATORS
2.1Food production for household consumption is the primary aim of these smallholder
farmers. At the start of the programme, 100% of participants were able to produce only
enough of their staple maize to feed their families for 1–3 months of the year. After five
years, 38% of participants have produced enough maize to last their families for 4–6
months and 53% have produced enough to last their families for 6–12 months. Ten
percent of participants have produced enough tofeed their families and sell surplus
produce. They have done this by improving the productivity in their existing fields, as
very few have increased the size of their fields.CA can improve food production by
between 200–400% over a period of 4–5 years.
2.2Local farmer centres have been introduced to provide the functions of coordination of
shared equipment, an advice centre for CA implementers, and a local input-supply
option for ease of access to inputs in smallquantities. Decisions about the ownership
and management processes of these centres were left to the learning groups. All four
centres presently in operation are being managed by one or two individuals and allhave
managed to make a small profit of aroundR400/month. In all four centres the owners
have opted to include a range of products to accommodate for the lack of input sales in
the off-season. Secondary cooperatives - linked to these farmer centres-have been
registered. Farmer centres play an important role in building social agency and local
economic development options in the villages and are crucial to supporting the CA
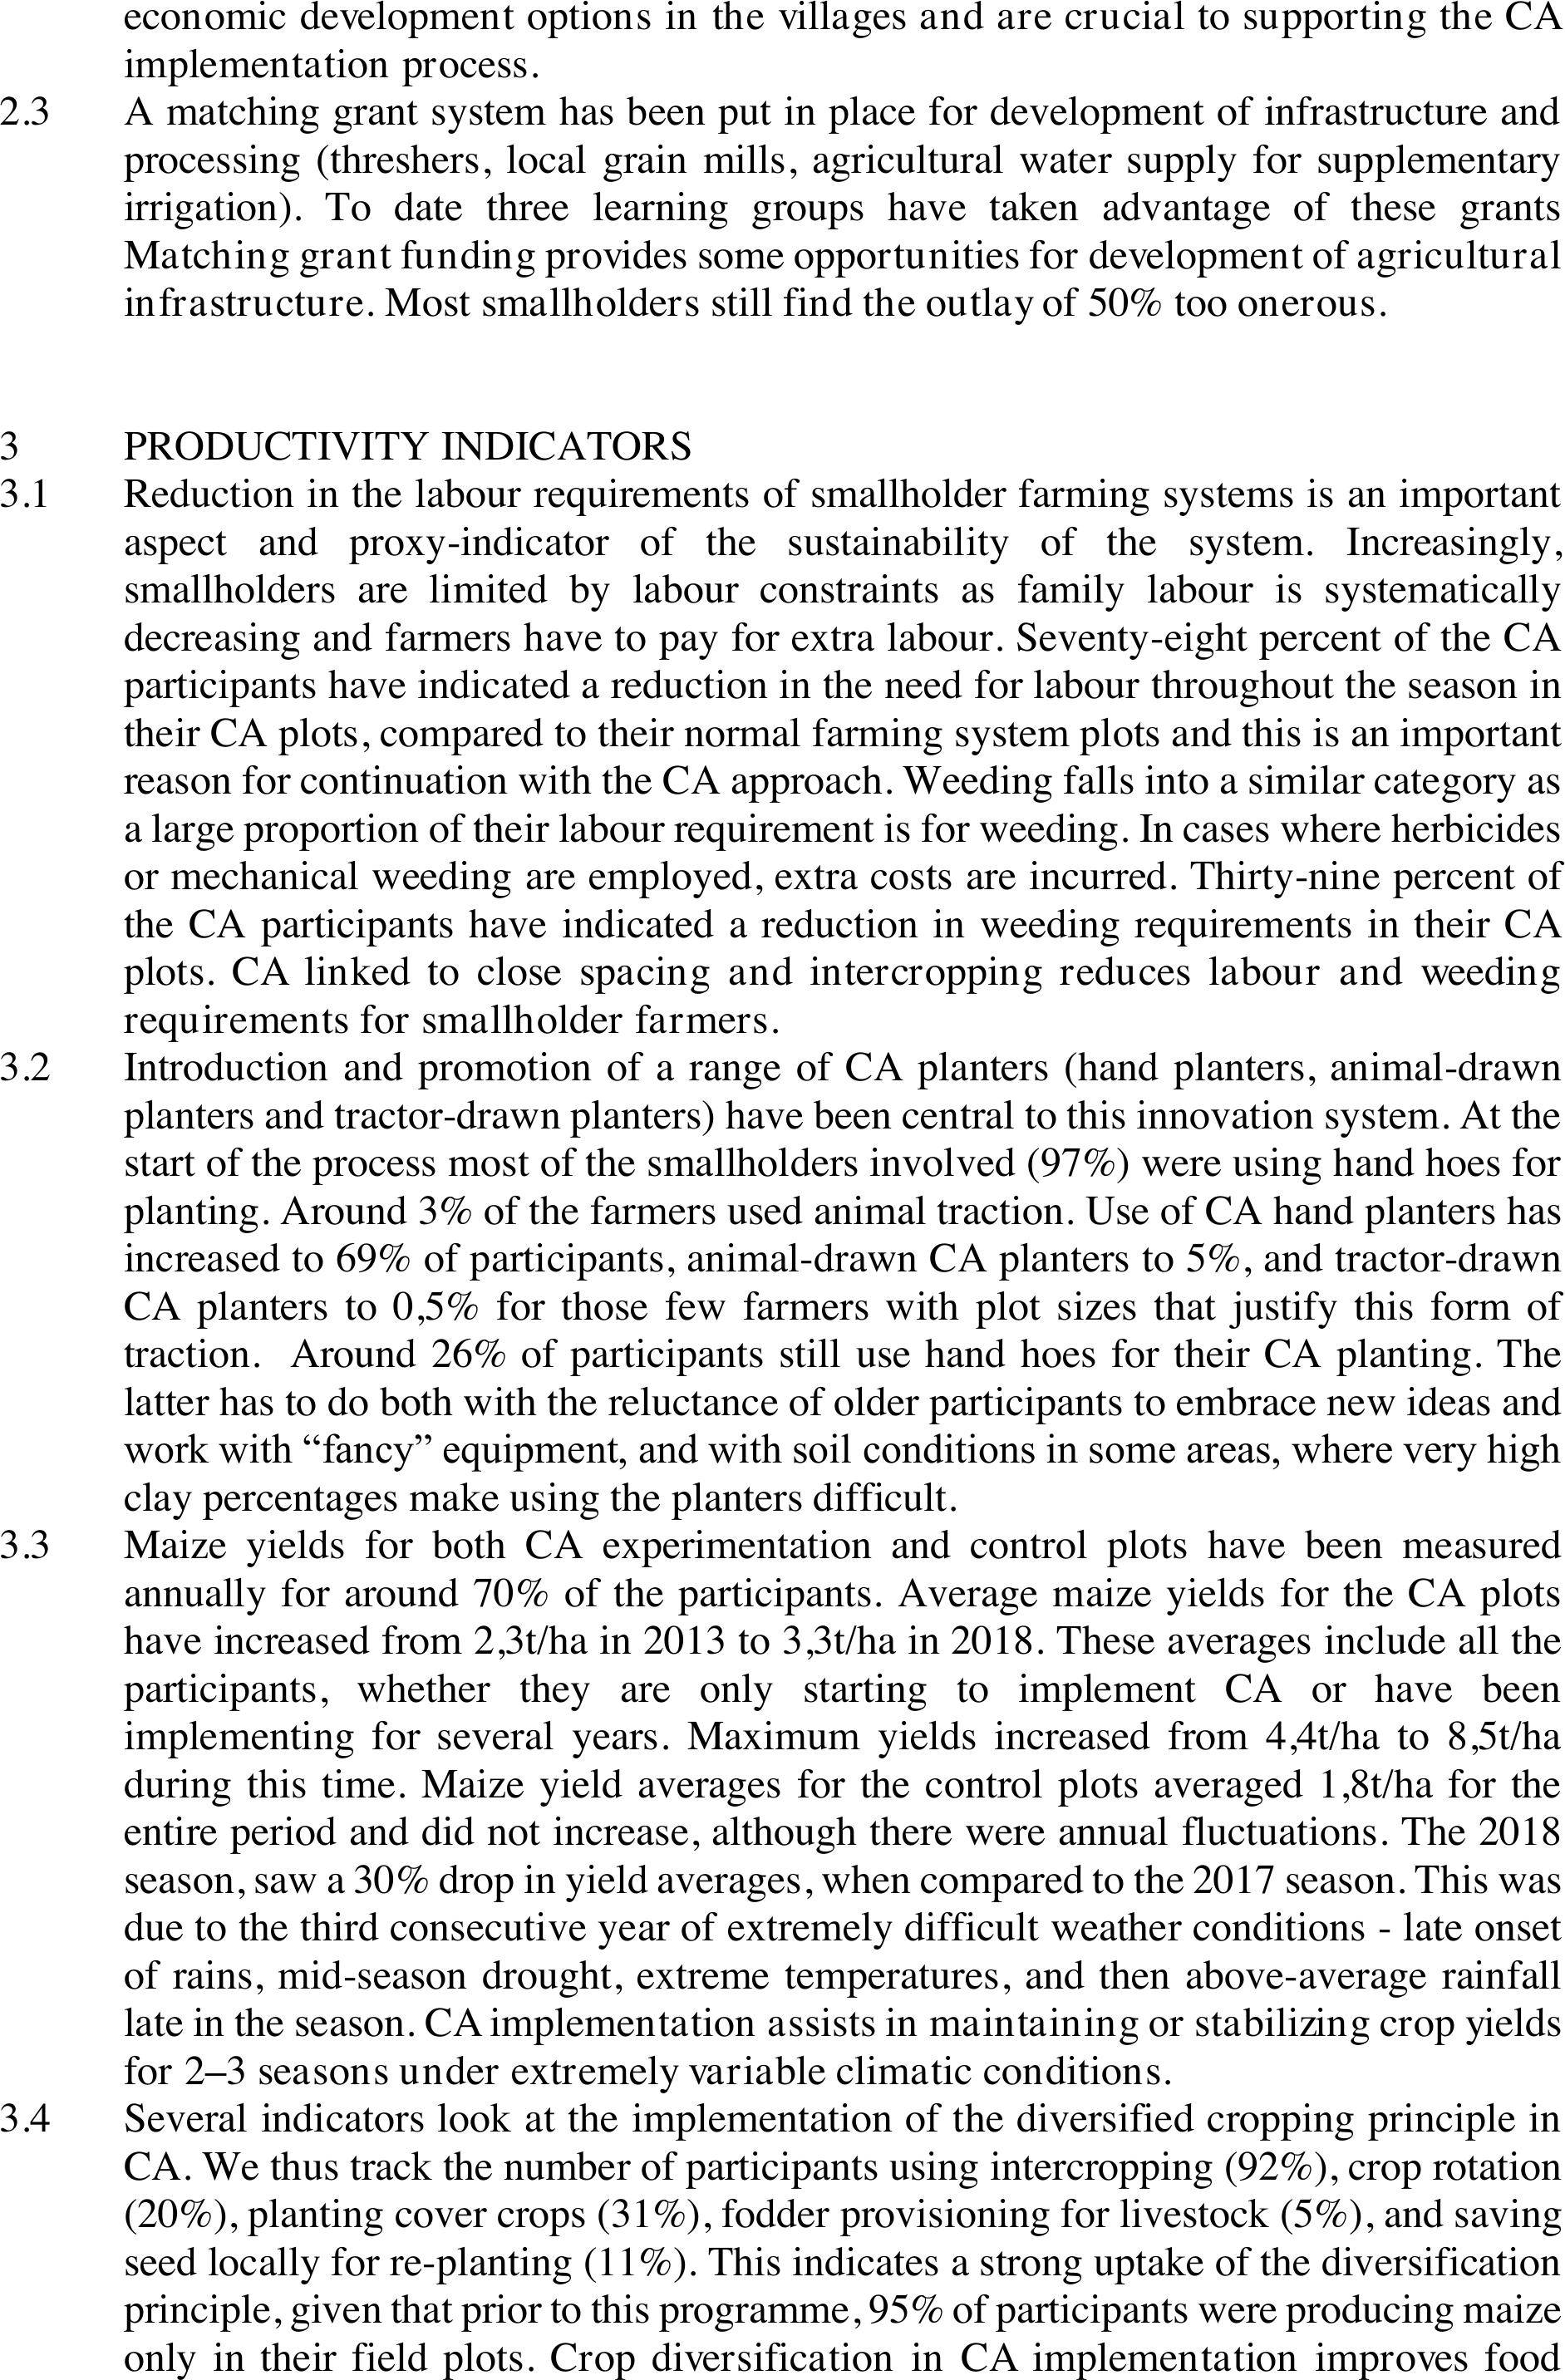
implementation process.
2.3A matching grant system has been put in place for development of infrastructure and
processing (threshers, local grain mills, agricultural water supply for supplementary
irrigation). To date three learning groups have takenadvantage of these grants
Matching grant funding provides some opportunities for development of agricultural
infrastructure. Most smallholders still find the outlay of 50% too onerous.
3PRODUCTIVITY INDICATORS
3.1Reduction in the labour requirements of smallholder farming systems is an important
aspect and proxy-indicator of the sustainability of the system. Increasingly,
smallholders are limited by labour constraints as family labour is systematically
decreasing and farmers have to pay for extra labour. Seventy-eight percent of the CA
participants have indicated a reduction in the need for labour throughout the season in
their CA plots, compared to their normal farming system plots and this is an important
reason for continuation with the CA approach. Weeding falls into a similar category as
a large proportion of their labour requirement is for weeding. In cases where herbicides
or mechanical weeding are employed, extra costs are incurred. Thirty-ninepercent of
the CA participants have indicated a reduction in weeding requirements in their CA
plots. CA linked to close spacing and intercropping reduces labour and weeding
requirements for smallholder farmers.
3.2Introduction and promotion of a range of CA planters (hand planters, animal-drawn
planters and tractor-drawn planters) have been central to this innovation system. At the
start of the process most of the smallholders involved (97%) were using hand hoes for
planting. Around 3% of the farmers used animal traction. Use of CA hand planters has
increased to 69% of participants, animal-drawn CA planters to 5%, and tractor-drawn
CA planters to 0,5% for those few farmers with plot sizes that justify this form of
traction. Around 26% of participants still use hand hoes for their CA planting. The
latter has to do both with the reluctance of older participants to embrace new ideas and
work with “fancy” equipment, and with soil conditions in some areas, where very high
clay percentages make using the planters difficult.
3.3Maize yields for both CA experimentation and control plots have been measured
annually for around 70% of the participants. Average maize yields for the CA plots
have increased from 2,3t/ha in 2013 to 3,3t/ha in 2018.These averages include all the
participants, whether they are only starting to implement CA or have been
implementing for several years.Maximum yields increased from 4,4t/ha to 8,5t/ha
during this time. Maize yield averages for the control plots averaged 1,8t/ha for the
entire period and did not increase, although there were annual fluctuations. The 2018
season, saw a 30% drop in yield averages, when compared to the 2017 season. This was
due to the third consecutive year of extremely difficult weather conditions - late onset
of rains, mid-season drought, extreme temperatures, and then above-average rainfall
late in the season. CA implementation assists in maintaining or stabilizing crop yields
for 2–3 seasons under extremely variable climatic conditions.
3.4Several indicators look at the implementation of the diversified cropping principle in
CA. We thus track the number of participants using intercropping (92%), crop rotation
(20%), planting cover crops (31%), fodder provisioning for livestock (5%), and saving
seed locally for re-planting (11%). This indicates a strong uptake of the diversification
principle, given that prior to this programme, 95% of participants were producing maize
only in their field plots. Crop diversification in CA implementation improves food
security by providing access to a wider range of food crops as well as feed and fodder
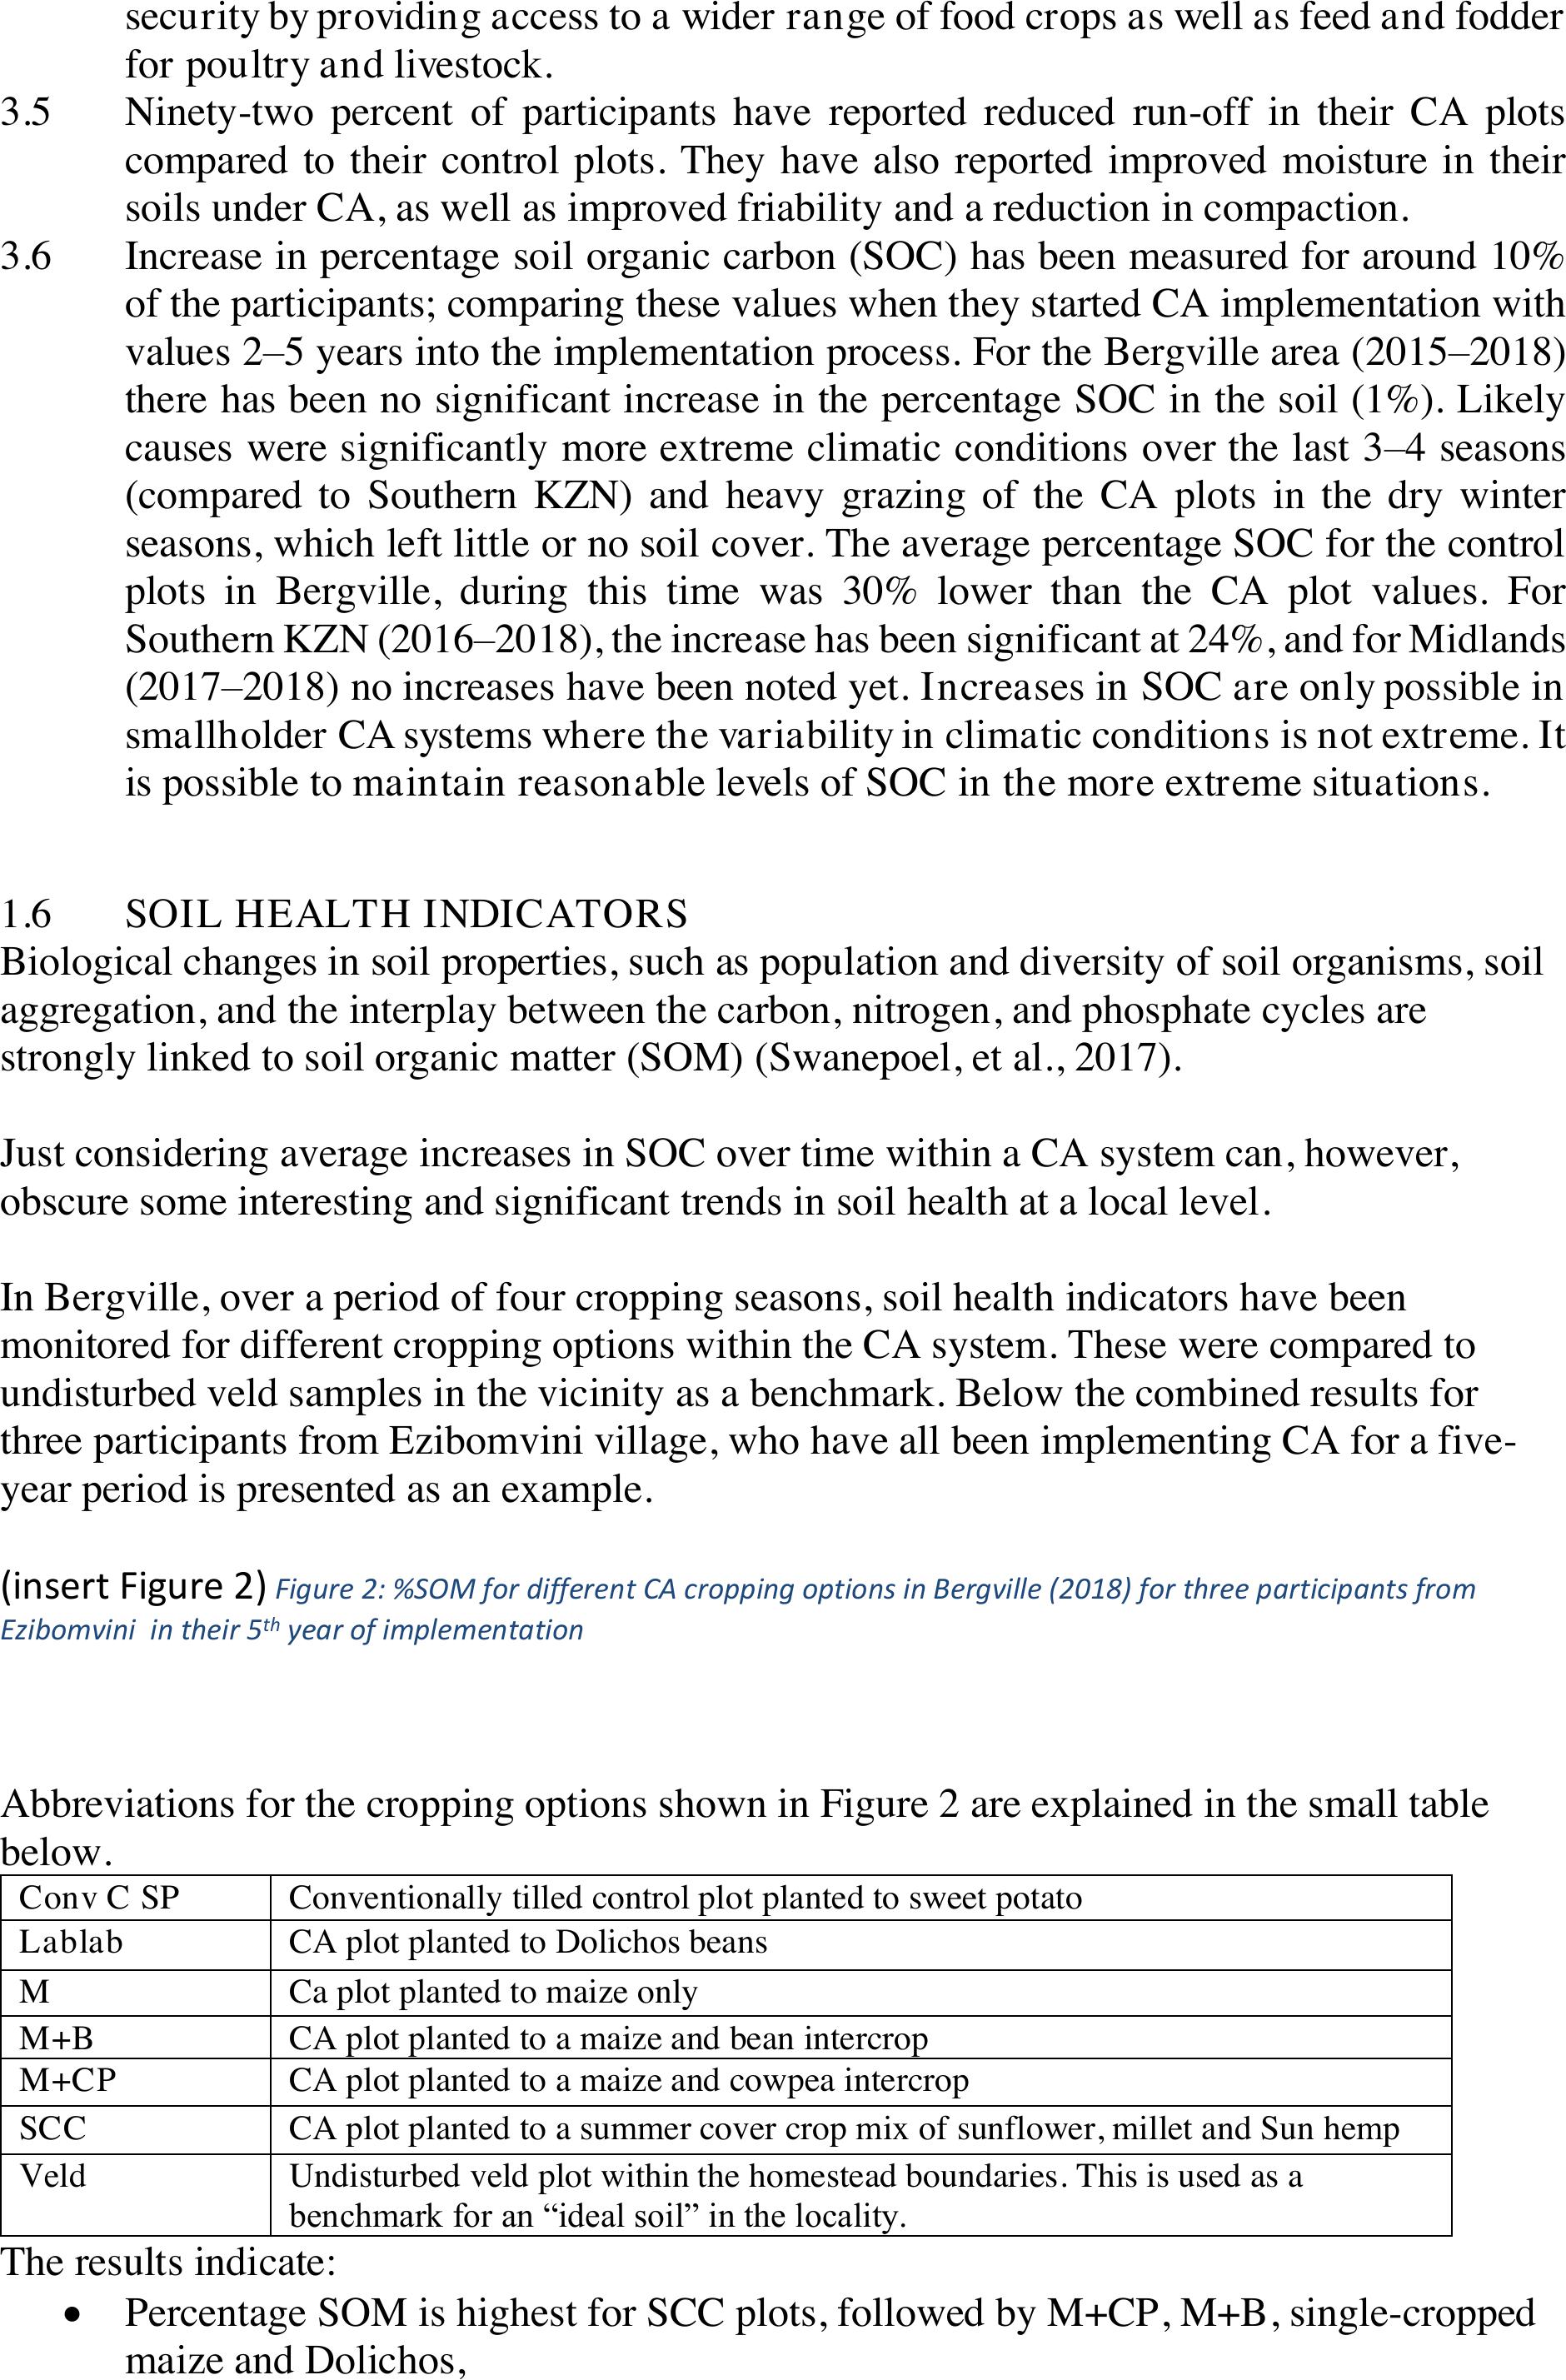
for poultry and livestock.
3.5Ninety-two percent of participants have reported reduced run-off in their CA plots
compared to their control plots. They have also reported improved moisture in their
soils under CA, as well as improved friability and a reduction in compaction.
3.6Increase in percentage soil organic carbon (SOC) has been measured for around 10%
of the participants; comparing these values when they started CA implementation with
values 2–5 years into the implementation process. For the Bergville area (2015–2018)
there has been no significant increase in the percentage SOC in the soil (1%). Likely
causes were significantly more extreme climatic conditions over the last 3–4 seasons
(compared to Southern KZN) and heavy grazing of the CA plots in the dry winter
seasons, which left little or no soil cover. The average percentage SOC for the control
plots in Bergville, during this time was 30% lower than the CA plotvalues. For
Southern KZN (2016–2018), the increase has been significant at 24%, and for Midlands
(2017–2018) no increases have been noted yet. Increases in SOC are only possible in
smallholder CA systems where the variability in climatic conditions isnot extreme. It
is possible to maintain reasonable levels of SOC in the more extreme situations.
1.6SOIL HEALTH INDICATORS
Biological changes in soil properties, such as population and diversity of soil organisms, soil
aggregation, and the interplay between the carbon, nitrogen, and phosphate cycles are
strongly linked to soil organic matter (SOM) (Swanepoel, et al., 2017).
Just considering average increases in SOC over time within a CA system can, however,
obscure some interesting and significant trends in soil health at a local level.
In Bergville, over a period of four cropping seasons, soil health indicators have been
monitored for different cropping options within the CA system. These were compared to
undisturbed veld samples in the vicinity as a benchmark. Below the combined results for
three participants from Ezibomvini village, who have all been implementing CA for a five-
year period is presented as an example.
(insert Figure 2) Figure 2: %SOM for different CA cropping options in Bergville (2018) for three participants from
Ezibomvini in their 5th year of implementation
Abbreviations for the cropping options shown in Figure 2 are explained in the small table
below.
Conv C SP
Conventionally tilled control plot planted to sweet potato
Lablab
CA plot planted to Dolichos beans
M
Ca plot planted to maize only
M+B
CA plot planted to a maize and bean intercrop
M+CP
CA plot planted to a maize and cowpea intercrop
SCC
CA plot planted to a summer cover crop mix of sunflower, millet and Sun hemp
Veld
Undisturbed veld plot within the homestead boundaries. This is used as a
benchmark for an “ideal soil” in the locality.
The results indicate:
•Percentage SOM is highest for SCC plots, followed by M+CP, M+B, single-cropped
maize and Dolichos,
•Carbon sequestration in the CA mixed crop plots is between 0,75-1,5t/ha more than
the single crop plots and
•Overall carbon sequestration is on average around 2-3t/ha for CA plots and 1,8t/ha for
the conventionally tilled plot.
This provides an indication of the advantages of multiple cropping options within the CA
system in the build-up of SOM and SOC over time, despite the fact that the average %SOM
for the area has not increased across seasons. It indicates the advantages of using multi-crop
cover crop options and intercrops with cowpea in building carbon in the soil.
1.7CLIMATE RESILIENCE INDICATORS
Resilience is the ability of a social or ecological system to absorb disturbances while
retaining the same basic structure and ways of functioning, the capacity for self-organization,
and the capacity to adapt to stress and change. (IPCC definition in Bizikova, et al., 2019)
Various frameworks have been suggested for developing indicators to assess agricultural
system resilience to climate change (Bizikova, et al., 2019). Indicator sets are divided into
five broad thematic areas; social, environmental services, economic, physical and
institutional. Specific indicators within these categories are flexible and dependent on the
local and policy context, as well as measurability (Engle, et al., 2014) (Bizikova, et al., 2019)
(Ellis, 2014). Frameworks used to develop the set of indicators used in this process are based
on vulnerability and adaptive capacity (OXFAM, 2012) (Ziervogel, et al., 2014), typically
used to assess the impacts of projects and processes (FAO, 2013) (Bizikova, et al., 2019).
Individual questionnaires have been developed that incorporate scales to provide weighted
answers for some of the indicators (Kruger, et al., 2019). Participatory impact assessments
(Catley, et al., 2014) have been designed for focus group discussions to augment the
information from interviews (Kruger, et al., 2019).
A combination of resilience snapshots and participatory impact assessments (PIAs) have been
used to build a picture in these villages of factors to assess for resilience and assessment of
improved resilience status for the programme participants, comparing their situations at the
start of their involvement with their situations 1–3 years later.
1.7.1Resilience snapshots
Resilience indicators appropriate to smallholder farmers have been developed in dialogue
with farmers over a period of 2–3 years. These are used to create snapshots of resilience,
understanding that building resilience is an ongoing process of adaptation and improvement.
Individual interviews with smallholders are conducted seasonally and then compiled in a
dashboard format of averaged and aggregated indicators. All aspects of their farming systems
are considered. An example for Bergville participants is shown below (April 2019).
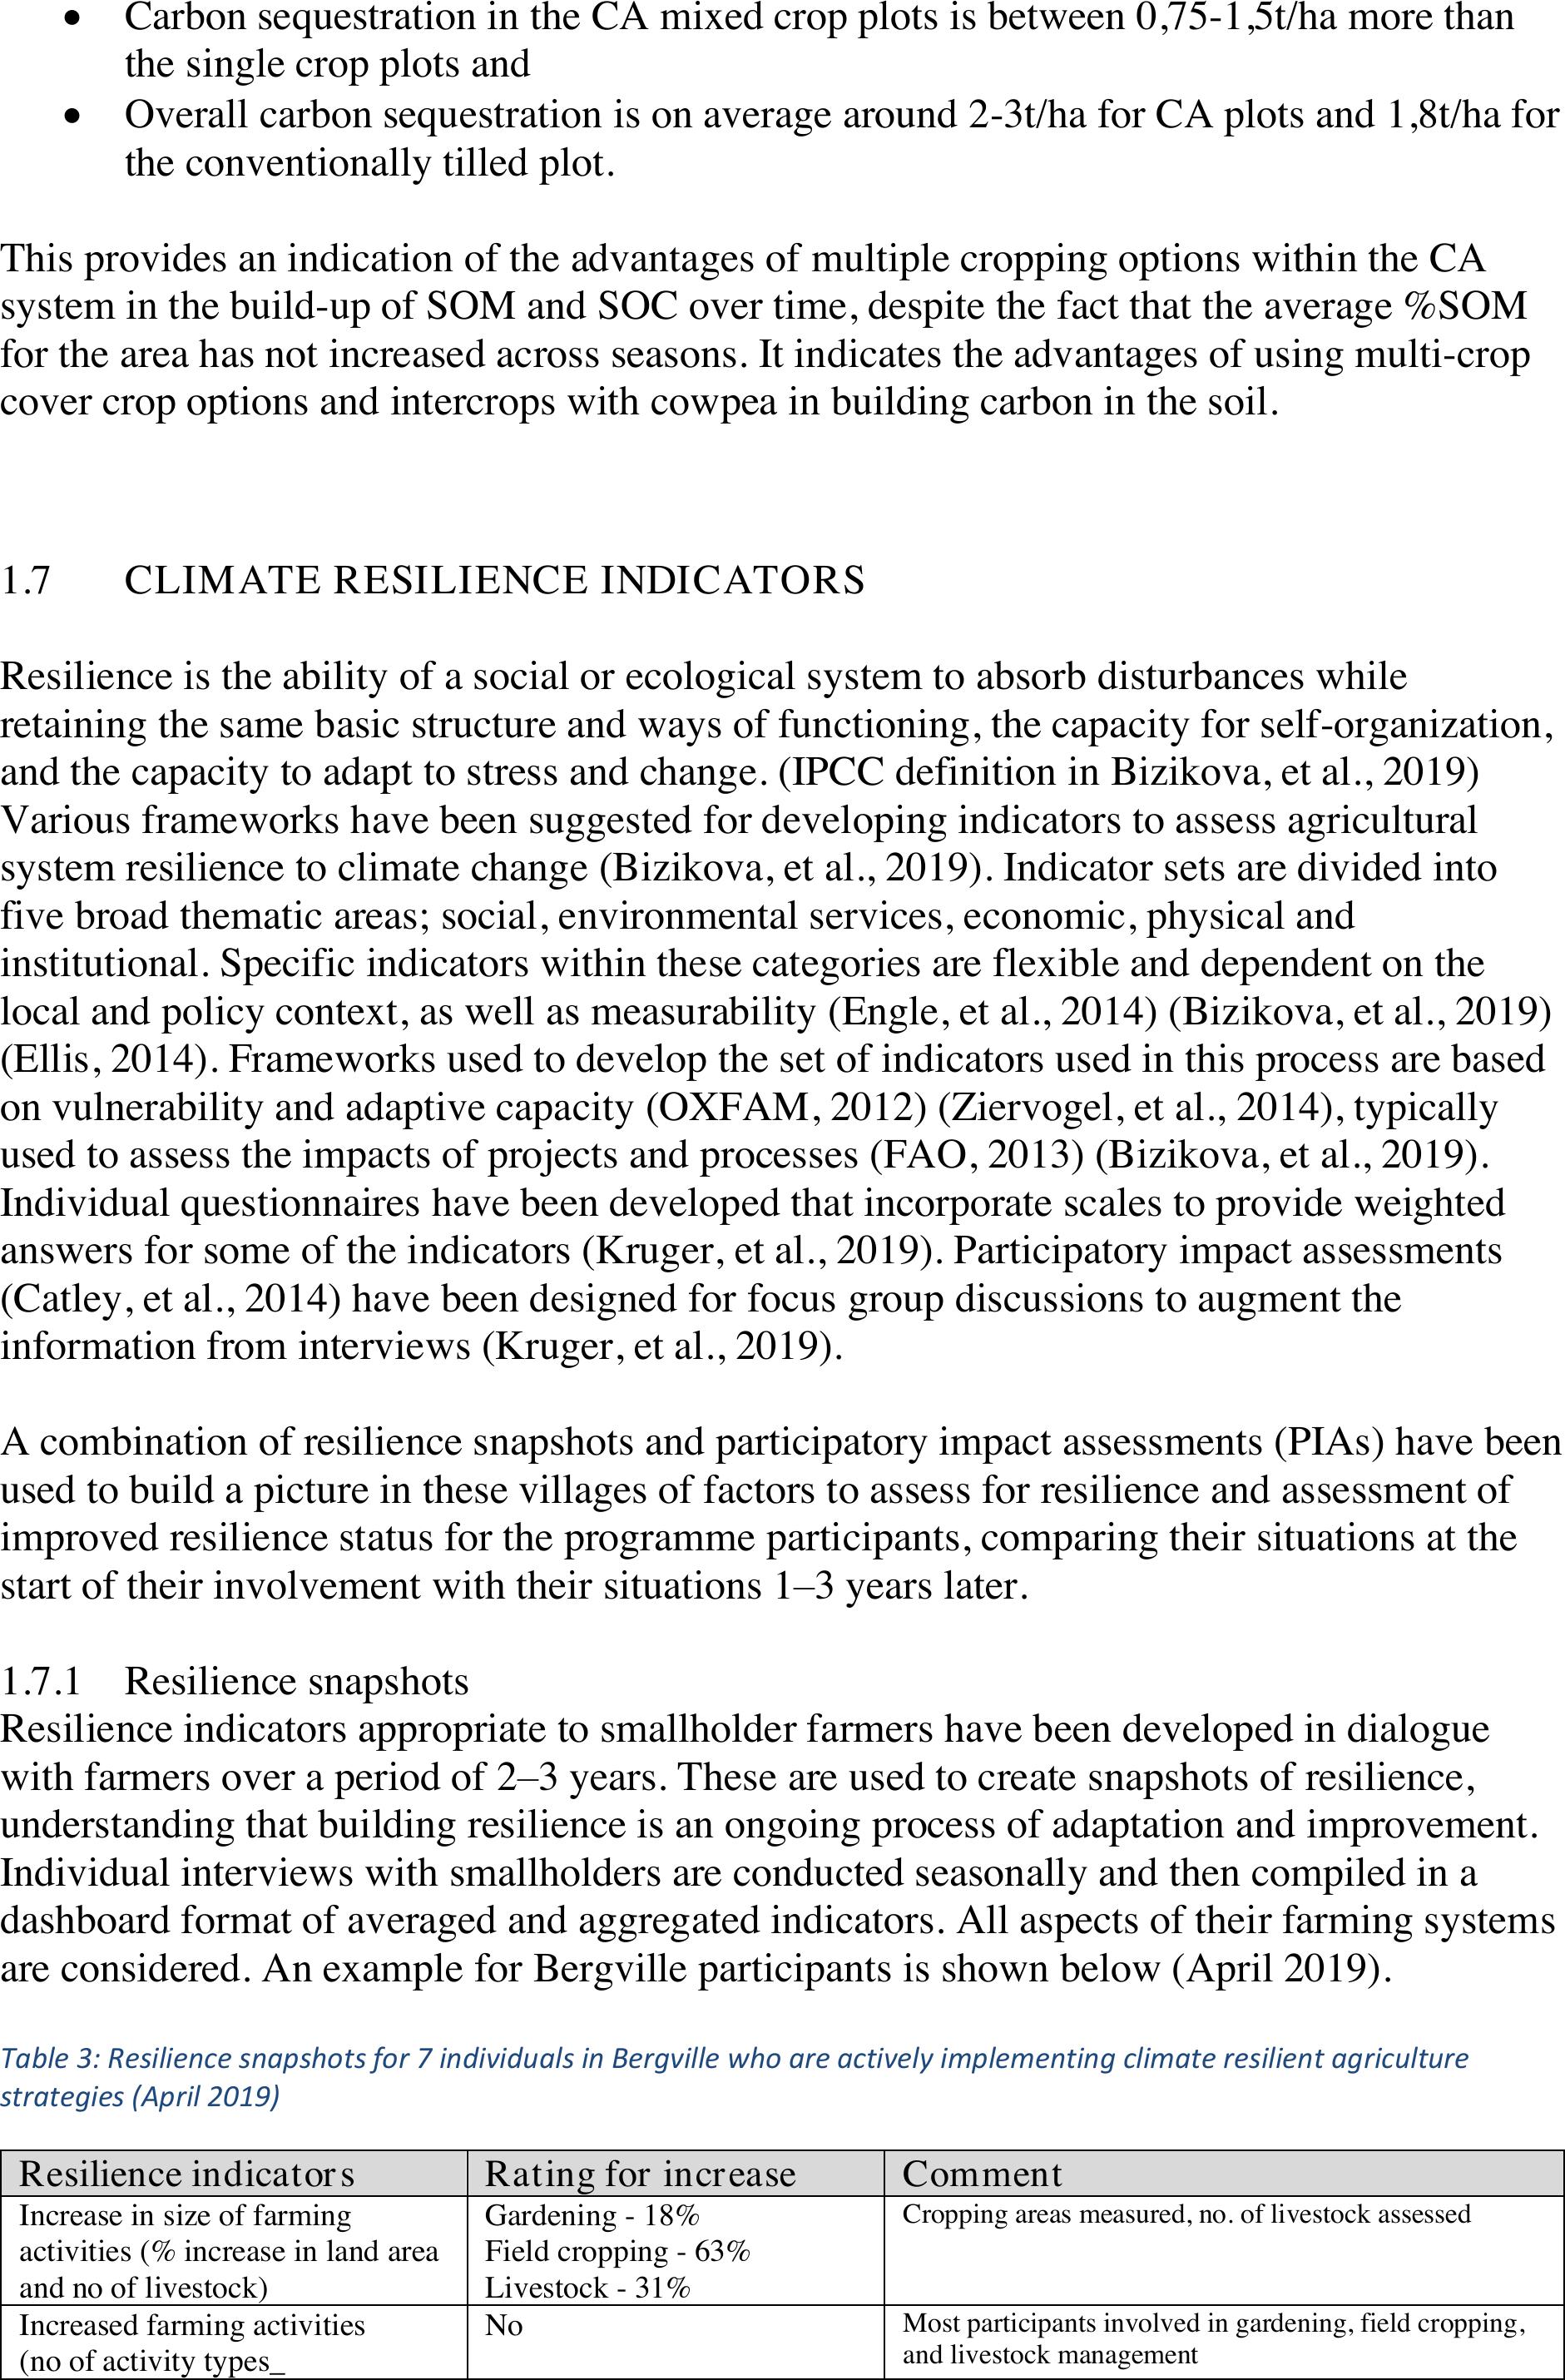
Table 3: Resilience snapshots for 7 individuals in Bergville who are actively implementing climate resilient agriculture
strategies (April 2019)
Resilience indicators
Rating for increase
Comment
Increase in size of farming
activities (% increase in land area
and no of livestock)
Gardening - 18%
Field cropping - 63%
Livestock - 31%
Cropping areas measured, no. of livestock assessed
Increased farming activities
(no of activity types_
No
Most participants involved in gardening, field cropping,
and livestock management
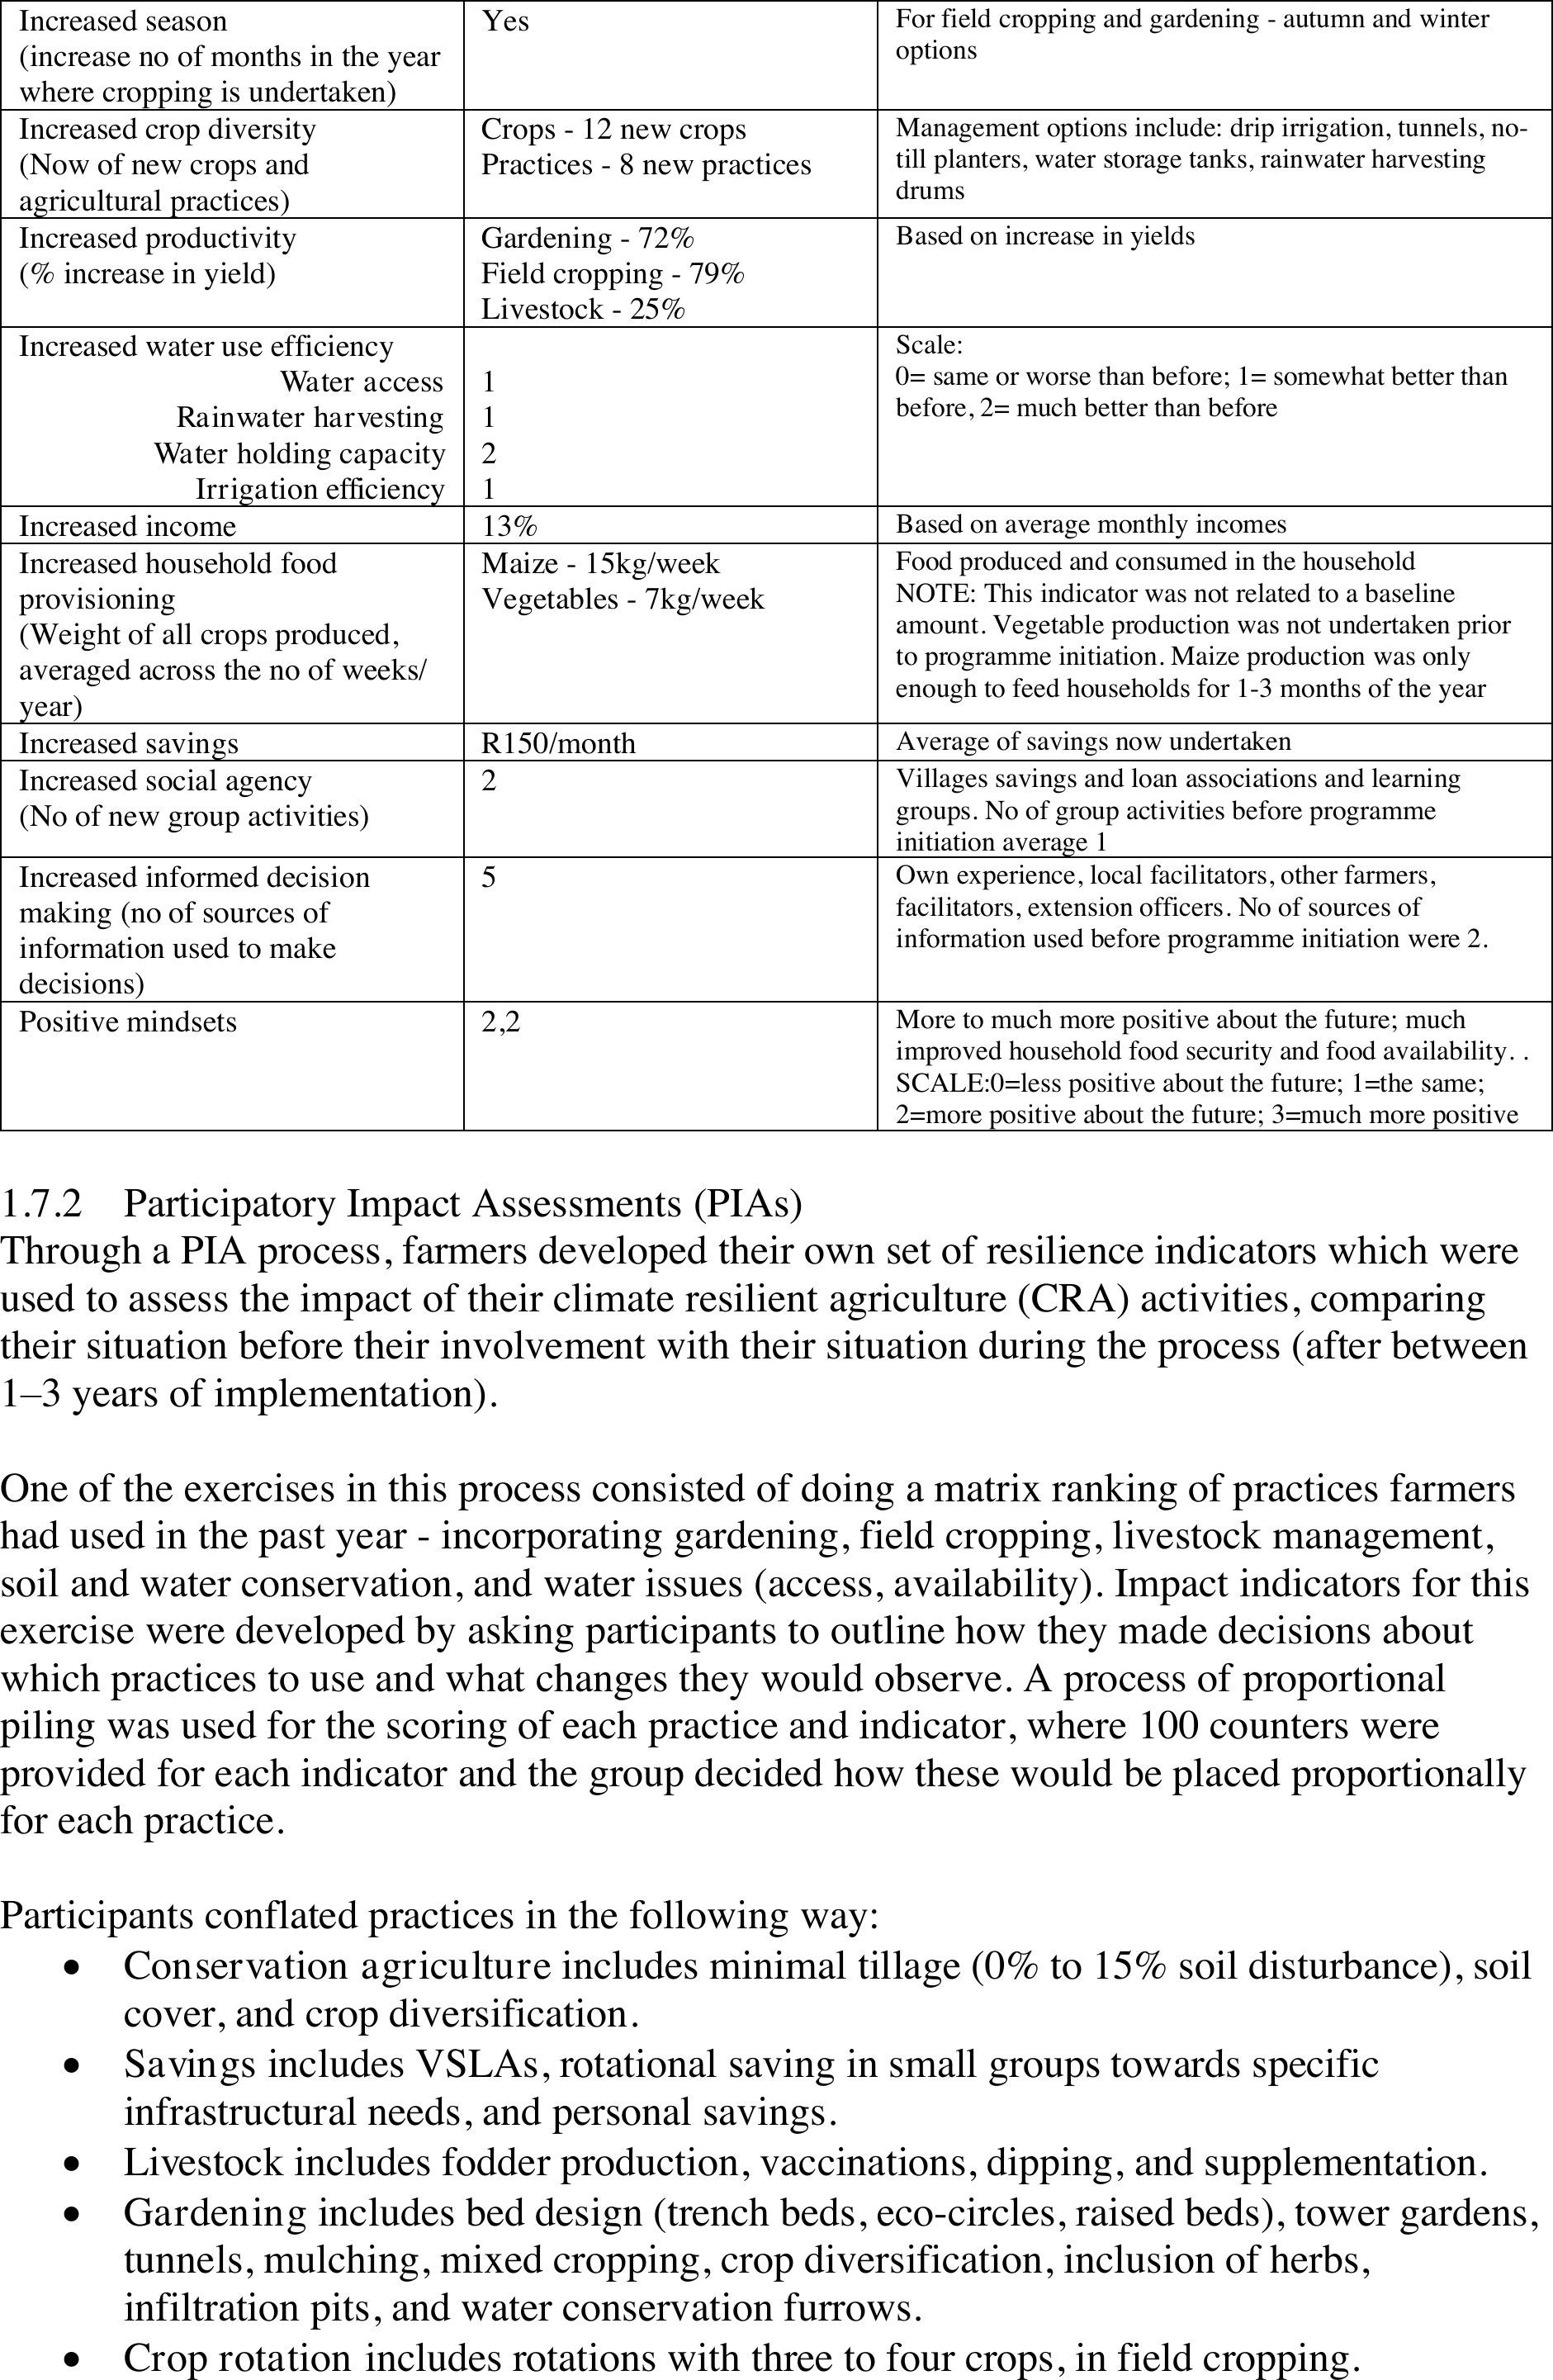
Increased season
(increase no of months in the year
where cropping is undertaken)
Yes
For field cropping and gardening - autumn and winter
options
Increased crop diversity
(Now of new crops and
agricultural practices)
Crops - 12 new crops
Practices - 8 new practices
Management options include: drip irrigation, tunnels, no-
till planters, water storage tanks, rainwater harvesting
drums
Increased productivity
(% increase in yield)
Gardening - 72%
Field cropping - 79%
Livestock - 25%
Based on increase in yields
Increased water use efficiency
Water access
Rainwater harvesting
Water holding capacity
Irrigation efficiency
1
1
2
1
Scale:
0= same or worse than before; 1= somewhat better than
before, 2= much better than before
Increased income
13%
Based on average monthly incomes
Increased household food
provisioning
(Weight of all crops produced,
averaged across the no of weeks/
year)
Maize - 15kg/week
Vegetables - 7kg/week
Food produced and consumed in the household
NOTE: This indicator was not related to a baseline
amount. Vegetable production was not undertaken prior
to programme initiation. Maize production was only
enough to feed households for 1-3 months of the year
Increased savings
R150/month
Average of savings now undertaken
Increased social agency
(No of new group activities)
2
Villages savings and loan associations and learning
groups. No of group activities before programme
initiation average 1
Increased informed decision
making (no of sources of
information used to make
decisions)
5
Own experience,local facilitators, other farmers,
facilitators, extension officers. No of sources of
information used before programme initiation were 2.
Positive mindsets
2,2
More to much more positive about the future; much
improved household food security and food availability. .
SCALE:0=less positive about the future; 1=the same;
2=more positiveabout the future; 3=much more positive
1.7.2Participatory Impact Assessments (PIAs)
Through a PIA process, farmers developed their own set of resilience indicators which were
used to assess the impact of their climate resilient agriculture (CRA) activities, comparing
their situation before their involvement with their situation during the process (after between
1–3 years of implementation).
One of the exercises in this process consisted of doing a matrix ranking of practices farmers
had used in the past year - incorporating gardening, field cropping, livestock management,
soil and water conservation, and water issues (access, availability). Impact indicators for this
exercise were developed by asking participants to outline how they made decisions about
which practices to use and what changes they would observe. A process of proportional
piling was used for the scoring of each practice and indicator, where 100 counters were
provided for each indicator and the group decided how these would be placed proportionally
for each practice.
Participants conflated practices in the following way:
•Conservation agriculture includes minimal tillage (0% to 15% soil disturbance), soil
cover, and crop diversification.
•Savings includes VSLAs, rotational saving in small groups towards specific
infrastructural needs, and personal savings.
•Livestock includes fodder production, vaccinations, dipping, and supplementation.
•Gardening includes bed design (trench beds, eco-circles, raised beds), tower gardens,
tunnels, mulching, mixed cropping, crop diversification, inclusion of herbs,
infiltration pits, and water conservation furrows.
•Crop rotation includes rotations with three to four crops, in field cropping.
•Intercropping includes grain-legume and grain-cover crop intercropping options in
field cropping.
•Small businesses include agricultural and non-agricultural businesses, sale of snacks
in schools, sewing, baking, poultry production, maize milling, etc.
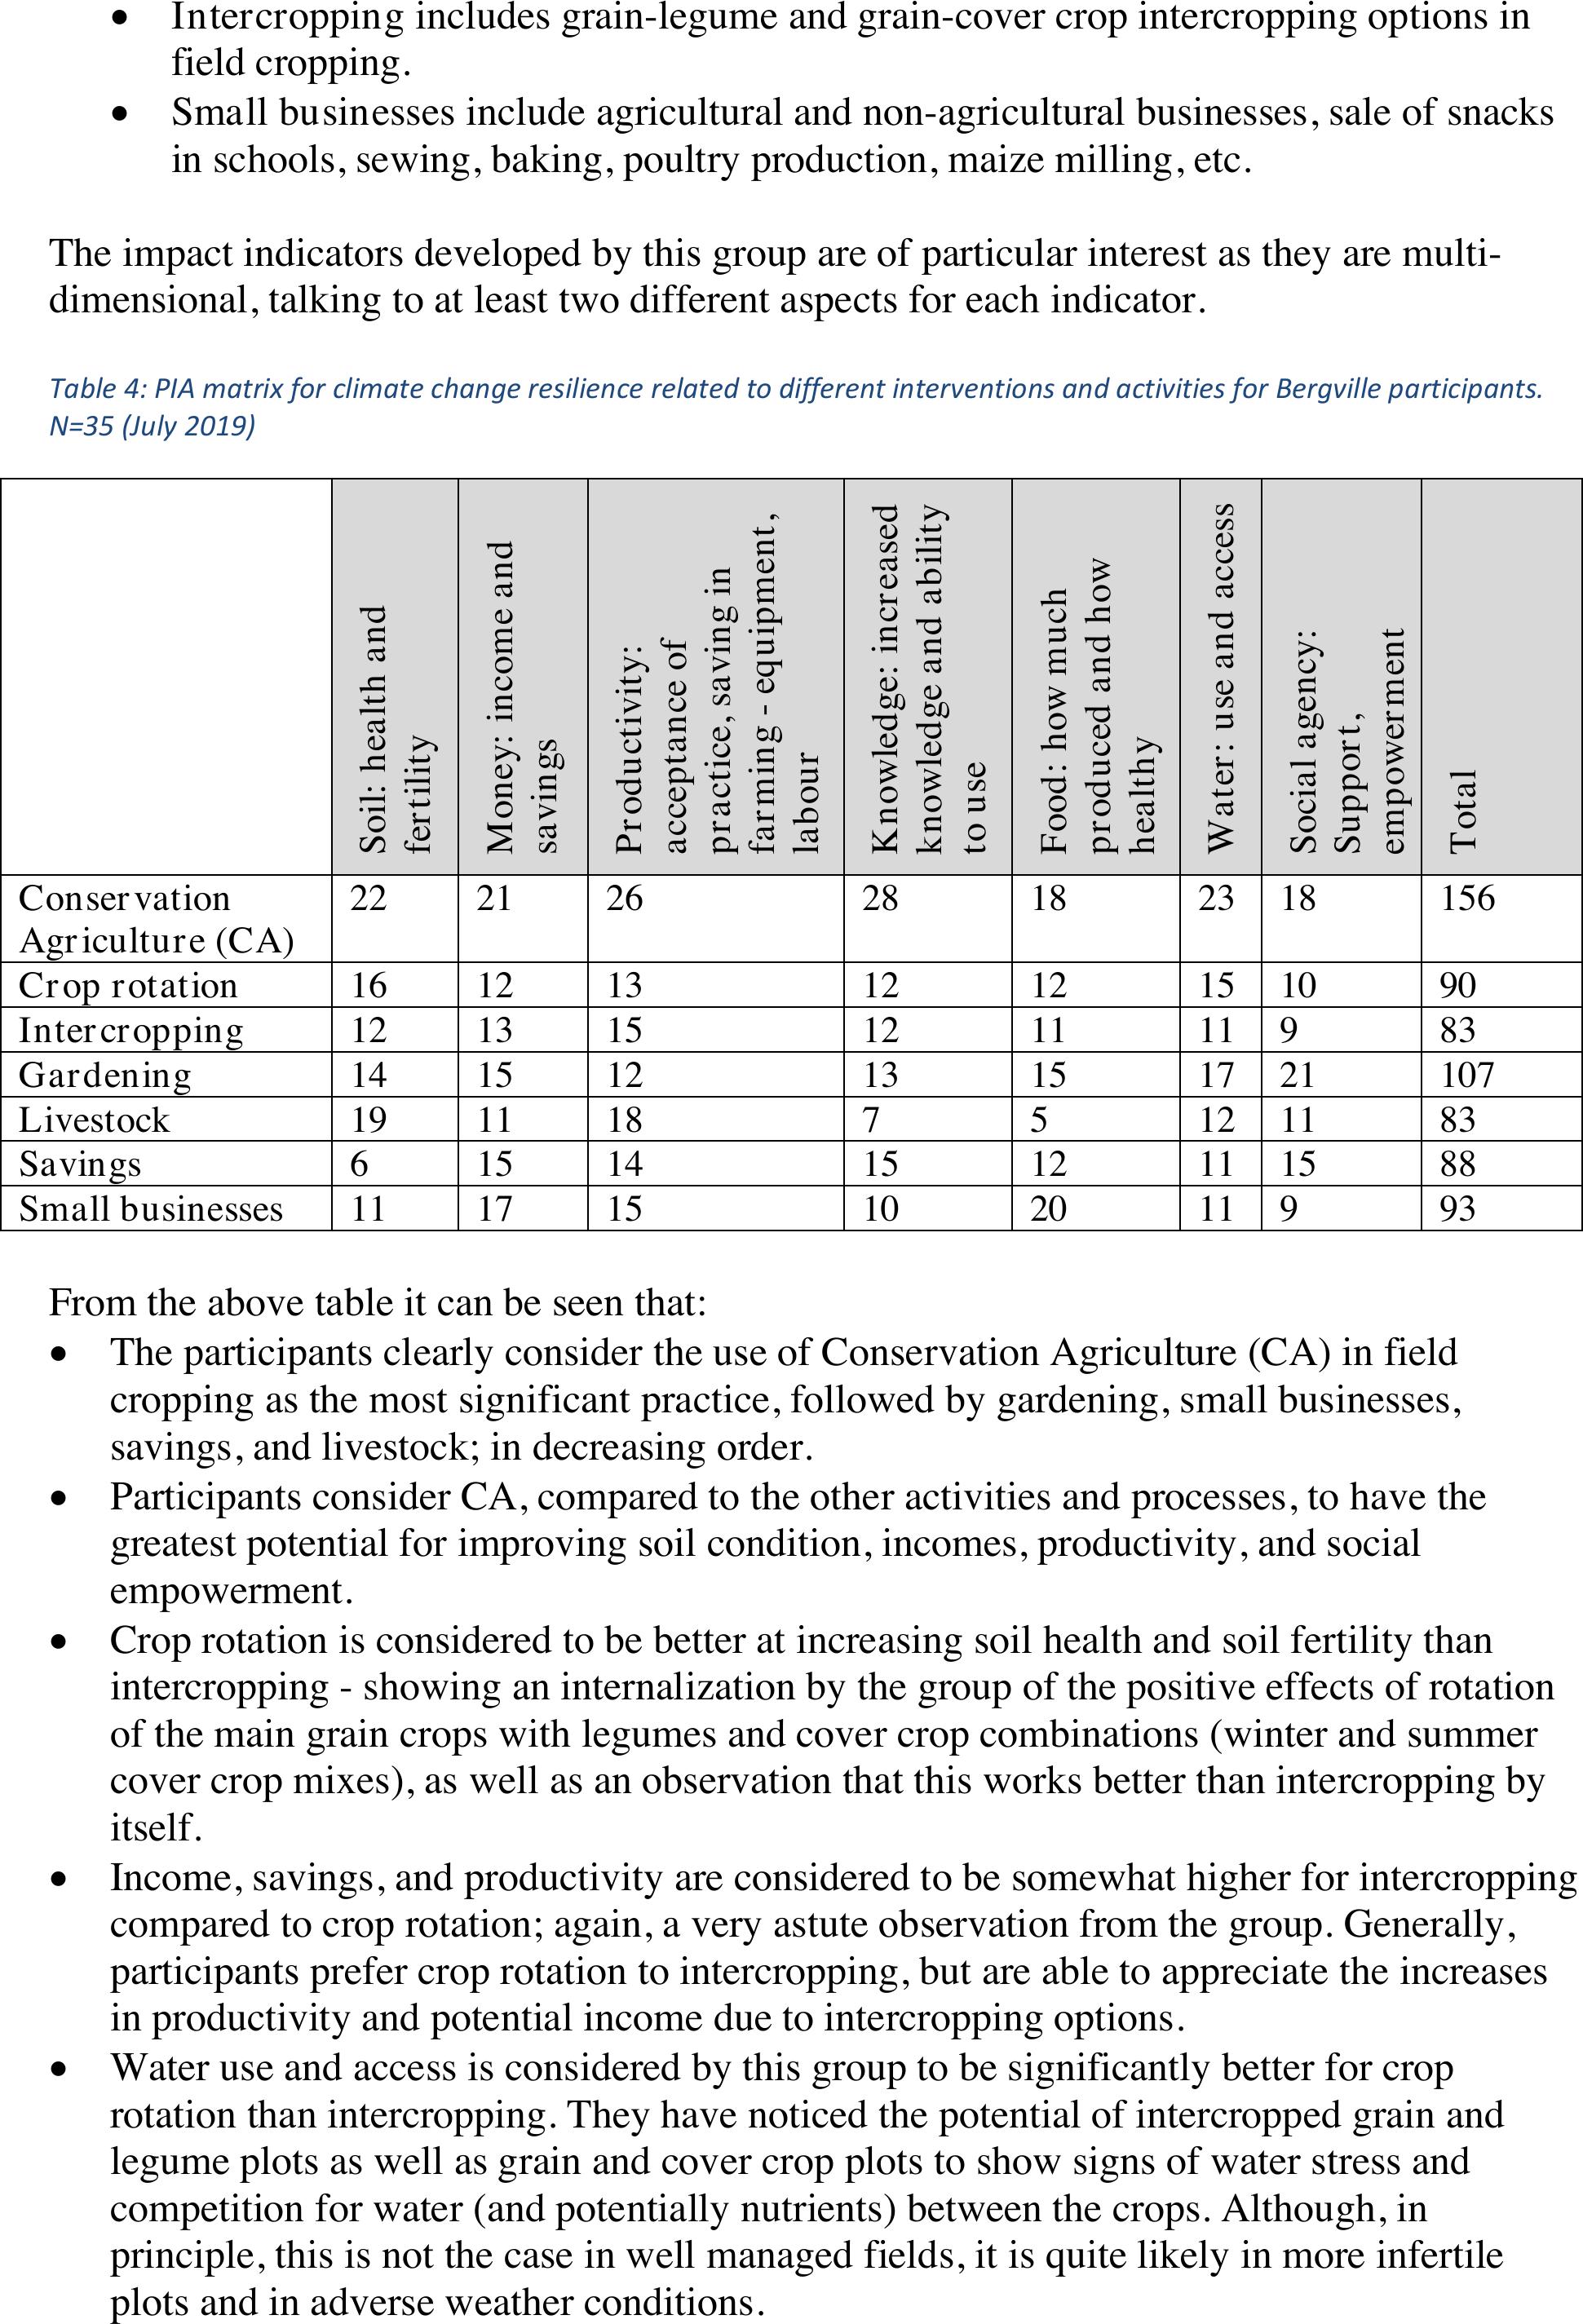
The impact indicators developed by this group are of particular interest as they are multi-
dimensional, talking to at least two different aspects for each indicator.
Table 4: PIA matrix for climate change resilience related to different interventions and activities for Bergville participants.
N=35 (July 2019)
Soil: health and
fertility
Money: income and
savings
Productivity:
acceptance of
practice, saving in
farming - equipment,
labour
Knowledge: increased
knowledge and ability
to use
Food: how much
produced and how
healthy
Water: use and access
Social agency:
Support,
empowerment
Total
Conservation
Agriculture (CA)
22
21
26
28
18
23
18
156
Crop rotation
16
12
13
12
12
15
10
90
Intercropping
12
13
15
12
11
11
9
83
Gardening
14
15
12
13
15
17
21
107
Livestock
19
11
18
7
5
12
11
83
Savings
6
15
14
15
12
11
15
88
Small businesses
11
17
15
10
20
11
9
93
From the above table it can be seen that:
•The participants clearly consider the use of Conservation Agriculture (CA) in field
cropping as the most significant practice, followed by gardening, small businesses,
savings, and livestock; in decreasing order.
•Participants consider CA, compared to the other activities and processes, to have the
greatest potential for improving soil condition, incomes, productivity, and social
empowerment.
•Crop rotation is considered to be better at increasing soil health and soil fertility than
intercropping - showing an internalization by the group of the positive effects of rotation
of the main grain crops with legumes and cover crop combinations (winter and summer
cover crop mixes), as well as an observation that this works better than intercropping by
itself.
•Income, savings, and productivity are considered to be somewhat higher for intercropping
compared to crop rotation; again, a very astute observation from the group. Generally,
participants prefer crop rotation to intercropping, but are able to appreciate the increases
in productivity and potential income due to intercropping options.
•Water use and access is considered by this group to be significantly better for crop
rotation than intercropping. They have noticed the potential of intercropped grain and
legume plots as well as grain and cover crop plots to show signs of water stress and
competition for water (and potentially nutrients) between the crops. Although, in
principle, this is not the case in well managed fields, it is quite likely in more infertile
plots and in adverse weather conditions.
1.8IN CONCLUSION
Introduction of CA and associated CRA practices within an innovation system approach and
using farmer-level experimentation and learning groups as the primary learning and social
empowerment processes has created a sustainable and expanding farming alternative for
smallholders that is improving their resilience to climate change substantially.
Through a knowledge co-creation process, smallholder farmers in the programme have
adapted and incorporated a wide range of practices into their farming system, including
minimum tillage, close spacing, improved varieties, judicious use of fertilizer, pesticides and
herbicides, crop diversification, intercropping and crop rotation as well as fodder production
and livestock integration. They have organised themselves into learning groups, local savings
and loan associations, water committees, farmer centres and cooperatives and in so doing
have created innovation platforms for local value chain development. They have built
ongoing relationships with other smallholders, NGO’s, academic institutions, Government
extension services, and agribusiness suppliers and have promoted CA tirelessly within their
local communities and social networks.
To date, this is the most successful model for implementation of CA in smallholder farming
in South Africa and through networking and upscaling activities, is being promoted
nationally as a strategic approach to smallholder adaptation and mitigation programming.
1.9REFERENCES
Bizikova, L., Larkin, P., Mitchell, S. & Waldick, R., 2019. An Indicator Set to Track
Resilience to Climate Change in Agriculture: A policy makter's perspective.. Land Use
POlicy, Volume 82, pp. 444-456.
Catley, A., Burns, J., Abebe, D. & Suji, M., 2014. Participatory Impact Assessment: A
Design Guide., Somerville, USA.: Feinstein International Centre. Tufts University..
Cousins, B., 2015. Through a glass darkly: towards agrarian reform in South Africa,. In: B.
Cousins & C. Walker, eds. Land Divided, Land Restored. Land Reform in South Africa for
the 21st Century.. Auckland Park, Pretoria: Jacana, pp. 250-269.
De Wit M, P. et al., 2015. Sustainable farming as a viable option for enhanced food and
nutritional security and a sustainable productive resource base. Synthesis report., Midrand:
Green Fund. Green Economy Research Report. Development Bank of Southern Africa.
Ellis, J., 2014. Climate Resilience Indicator Literature Review. Prepared as part of “Using
Columbia Basin State of the Basin "Indicators to Measure Climate Adaptation”, s.l.:
Columbia Basin Trust.
Engle, N. L., de Bremond, A. & Malone, E. L., 2014. Towards a resilience indicator
framework for making climate-change adaptation decisions. Mitig Adapt Strateg Glob
Change (2014) 19:1295–1312, Volume 19, pp. 1295-1312.
FAO, 2013. Climate Smart Agriculture Source Book. Rome,Italy: Food and Agriculture
Organisation of the United Nations.
Giller, K. E., Witter, E., Corbeels, M. & Tittonell, P., 2009. Review: Conservation agriculture
and smallholder farming in Africa; The heretic's view. Field Crops Research, pp. 23-34.
Hellin, T. et al., 2014. An innovation systems approach to enhanced farmer adoption of
climate-ready germplasm and agronomic practices. CAPRi Working Paper No. 116.,
Washington, D. C.: International Food Policy Research Institute.
Herman, F., Stuiver, M., Beers, P. J. & Kok, K., 2013. The distribution of roles and functions
for upscaling and outscaling innovations.. Agricultural Systems, Volume 115, pp. 117-128.
Kruger, E. et al., 2019. Development of indicators, proxies and benchmarks and knowledge
mediation processes. In WRC project no K5/2719/4 Dleveirable No 7. , Pretoria, South
Africa: The Water Research Commission.
Kruger, E. & Smith, H. J., 2019. Conservation Agriculture Farmer Innovation Programme
(CA FIP) for smallholders, Grain SA. Farmer Centred Innovation in Conservation
Agriculture in upper catchment areas of the Drakensberg, KwaZulu-Natal, Pretoria:
GrainSA.
OXFAM, 2012. Participatory capacity and vulnerability analysis; A practitioner's Guide. An
Oxfam Disaster Risk Reduction and Climate Change Adaptation Resource, s.l.: OXFAM.
Smith, H. J., Kruger, E., Knot, J. & Blignaut, J., 2017. Chapter 12: Conservation Agriculture
in South Africa: Lessons from Case Studies. Conservation Agriculture for Africa: Building
resilient farming systems in a changing climate.. s.l.:CAB International.
Smith, H. J. & Visser, M., 2014. A farmer-centred Innovation Systems Approach to stimulate
adoption of Conservation Agriculture in South Africa (Poster presentation).. Winnipeg,
Canada., World Congress on Conservation Agriculture,.
Swanepoel, C. M., Swanepoel, L. H. & Smith, H. J., 2017. A review of conservation
agriculture research in South Africa. South African Journal of Pland and Soil.
Thierfelder, C. et al., 2018. Complementary practices supporting conservation agriculture in
Africa. A review. Agronomy of Sustainable Development, Volume 38:16.
Ziervogel, G. et al., 2014. Climate change impacts and adaptation in South Africa. WIRE's
Clim change.