
Participatory Market SystemAnalysis
for Saving and Credit Groups around
Matatiele, Eastern Cape.
AUTHORS
Contact: Anton Krone, Erna Kruger
Tel: 082 8537812, 0828732289
P O Box 84, Pietermaritzburg 3201, South Africa
123 Jabu Ndlovu Street, Pietermaritzburg.
anton@saveact.org.za, www.saveact.org.za, erna@mahlathiniorganics.co.za
ABSTRACT
A participatory market chain assessment was initiated in 2010 in the Alfred Nzo District
Municipality of the Eastern Cape (Matatiele, Mount Fletcher), to augment the work of
SaveAct with the savings and credit groups (SCGs) in the area. A recent study on livelihood
strategies and enterprise development found a strong relationship between participation in
SCGs and enterprise development. Early indications are that SCGs show a natural
progression from saving for consumption to saving for productive activities as the groups
mature. Small agricultural enterprise expansion is constrained by market chain pressures such
as high input and transport costs, inefficient production techniques and lack of marketing
options.
The participatory market chain learning and action methodology laid a foundation for a joint,
systematic analysis of agricultural potential, production and marketing processes and options
for the SCG members. It helped catalyse institutional arrangements where farmers could
work together to take advantage of what they had learned.
Local market opportunities in the villages are extensive and demand for food is presently
much greater than supply. Six agricultural commodities were prioritised:poultry, potatoes,
sheep, livestock, vegetable greens and maize. Initial market maps were produced for each and
used as a basis to deepen stakeholder interactions and to address some of the most pressing
challenges and opportunities in the market systems.
Commodity interest groups (CIGs) were set up. These groups explore: production efficiency,
financial and business management skills and options for cooperative activities such as bulk
buying, management of group processes around loans and savings, consideration of joint
marketing and transport arrangements.
CIGs have progressed in a number of different ways, including setting up joint input
procurement systems, increased use of specific systems for saving for productive activities,
increased local marketing and exploration of value adding and marketing options.

Stakeholder interactions and building of positive relationships with commercial and
institutional role players remain important. An initial focus on private sector stakeholders and
membership based organisations has provided a good opportunity for interaction with
smallholders.
KEYWORDS
Value chain analysis, savings groups, financial services, , savings-led enterprise
development, microsavings, credit, smallholder agricultural innovation.
1. INTRODUCTION
SaveAct works with communities to establish self-selected savings and credit groups (SCGs),
where members meet monthly to save and allocate loans from the capital fund of
accumulated savings. At the end of a savings cycle (1 year), members benefit from a
substantial share-out of capital, with groups typically generating annual returns of more than
30% on savings through interest charged on internal lending. Many groups operate social
funds to cater for emergencies.
SaveAct uses a stepwise model, starting with group savings and credit then introducing
financial education and later enterprise development (see Figure 1 below).
Figure 1: A stepped approach for livelihood support offered through the SaveAct model
Groups are trained in the savings methodology and savings meetings are facilitated and
monitored by field staff and community-based promoters (CBPs)Mature groups are
‘graduated’ once they are working well and generally function independently after around 18

months. The stepped approach is based on the assumption that basic household financial
stability must be achieved before people are willing to risk engaging in enterprise activities,
which are also more likely to be successful when the household is able to meet basic needs.
SaveAct fosters economic literacy among participants in the SCGs (savings and credit
groups) and supports processes for increasing marketing efficiency and equity. Participatory
market chain assessment was thus set up in the Alfred Nzo and Joe Gqabi Districts (Matatiele
and Mount Fletcher) as a local concentration of SCGs (almost 246 groups and 37 graduated
groups) exists in that area.
A progression from savings and credit for consumption purposes to productive elements is
appears to be observed. Saving and credit for productive purposes is supported. This has
taken the form of addressing efficiencies in supply, (through for example bulk buying and
supply chain management), increased production (through training, mentoring, advice and
farming system development) and marketing (including elements of processing and local
trading). An emphasis on social systems that can support these processes is seen as important.
2. METHODOLOGY
Working within a participatory market chain learning and action methodology (PMCL)
provides an ongoing process platform for engagement amongst beneficiaries, business and
institutional stakeholders. The process followed is a combination of a few different
approaches in participatory market chain analysis, namely the Participatory Market Chain
Approach (PMCA) promoted by CGIAR and the International Potato Centre (CIP) in Peru, a
Market Mapping process promoted by Practical Action(Albu and Griffith, 2006) and a
marketing scoping process developed by the NRI (Bennet et al., 2005). This has more
recently evolved into the PMSD – participatory market systems development, with the
PMCA evolved into PMSA (participatory market systems analysis) (Griffith and Osorio,
2008).
These methodologies promote a qualitative approach to market chain analysis, working with
local farmer interest, problems and ideas. The approaches are demand orientated and market
driven and include the actual implementation of marketing innovations. They respond to
collectively identified business opportunities. Research and facilitation input and support is
important throughout. Emphasis is given to bringing together actors from different
backgrounds such as traders, farmers, processors and institutions, who may or may not have
been in contact previously.
2.1 Overview of the process
The diagnostic phase of the Participatory Market System Analysis was combined with an
analysis of production potential and present agricultural activities and production in the area,
to provide the joint analysis for action within the savings and credit groups.
The market maps and prioritised agricultural commodities were then used to initiate joint
activities through the commodity interest groups that were set up. This involved negotiation

with market chain stakeholders, training and mentoring in agricultural and business
management and more efficient input supply options.
2.2 Description of methodology and process
The following steps were followed in building participation amongst farmers from SCGs: an
agricultural assessment, the diagnostic phase of participatory market system analysis,
commodity interest groups and a livelihoods strategies assessment. Each step is outlined
below.
Agricultural assessment Analysis of land capability and resource use including:
➢ Summarised information from the KZN Department of Agriculture Bioresource
Programme , Bioresource Units (BRUs)
➢Information on local markets, producer capacity, access to support and
➢Information on present production systems and capacity.
Methods and tools:
Desktop study, individual and group interviews.
PMSA-Diagnostic phase: Investigation of targeted market chains and their actors and
identification of potential innovations (commercial, technical, institutional) based on the
shared interests of the stakeholders involved. Activities in the diagnostic phase included:
➢Scouting in the area to identify nodes, farmers and potential market systems, to set up
initial interactions with relevant stakeholders and to include available reports and
desktop information.
➢Identifying commodities and market chains.
➢Market scoping and mapping exercise on community level - based on nodes and
proximity to specific towns (Matatiele, Mount Fletcher and Kokstad).
➢Preliminary market maps for chosen commodities outlined: including community
process, qualitative interviews with farmers for each node and qualitative interviews
with marketing stakeholders, NGOs, government institutions.
➢Overview of thematic opportunities – to be used in subsequent workshops and
presentation of results.
Methods and tools:
Market Scoping (Bennet 2002) – To help people understand their marketing
environment. This involved market mapping, , marketing system analysis,
commodity ranking and participatory value chain analysis.
oMarket Mapping: To identify market chain actors and linkages, factors
enabling the business environment, business and extension service providers
(Practical Action 2008). The market maps provide a framework for

conceptualisation of a market literacy approach as a component of rural
livelihoods interventions.
oCommodity ranking: A group exercise using locally defined criteria to rank
profitable commodities for the area.
oParticipatory value chain analysis: To help individuals and groups to analyse
and assess their best points of intervention for positive change in specific
commodity chains that they are involved in. They identify inefficiencies,
inequities and losses which could be remedied or added value which could be
captured.
Commodity Interest Groups (CIGs): Groups are set up to include members of SCGs in the
same locality interested in the particular commodity in order to:
➢Further analyse the commodity chain
➢Design appropriate actions and processes for the groups, and
➢ Set in motion actions around input supply, production efficiency and market
development and linkages.
Methods and tools:
oTraining and mentoring in: Small business development(Isiqalo,meaning
‘step up’) and aspects of production to improve efficiency and profitability
oDevelopment of input supply systems: Bulk buying systems and support,
transport, cooperation among group members, small business initiation and
support
oExploration of market system and opportunities: Explore local
cooperation to improve informal marketing systems.
Livelihoods strategies assessment to generate data (optional): consisting of the following
processes:
➢Questionnaire based interviews for approximately 150 SCG members,
➢Nine group discussions using Participatory Rapid Appraisal (PRA) tools;
➢Semi-structured interviews with key informants (2 in Matatiele); and
➢Case studies with local agricultural entrepreneurs in SCGs (8 in Matatiele)
Methods and tools:
oQuestionnaire based interviews, group discussions and case studies.

3. RESULTS AND DISCUSSION
3.1 Agricultural assessment
The areas around Matatiele and Mt Fletcher fall into different Bio-Resource Units (BRUs)
that broadly fall within one larger Bio-Resource Group (BRG) known as ‘Dry Highland
Sourveld’ (BRG 9) (Camp, K.G.T, 1999).
The area lies in a temperate summer rainfall region, with approximately 75% of rainfall
between October and March. The mean annual rainfall ranges between 700mm and 850mm,
mainly in the form of summer thunderstorms. Mean annual run-off is very high, estimated to
be between 1600 - 3200 million m3.
Temperatures in summer range between 21°C and 28°C during the day and 18 °C -2 °C at
night. The area experiences cold winters with frequent frost and limited snow. This limits the
type of crop potential to summer and frost resistant types, taking into account late and early
frost threats, and a reduction in available heat units for optimal growth.
The area is generally high lying, between 1350 and 1750m and the topography is
predominately influenced by the geology of the basalt Drakensberg group, with some basalt
and sandstone outcrops. The majority of the terrain can be described as rolling with steep
hills and deep valleys along the escarpment to the north. Relatively flat areas are located on
the lower lying base of the foothills below the escarpment with Lesotho, which are wide
alluvial plains often dotted with permanent wetlands. The soil is generallywell drained in the
higher lying portions of the basin formed by the upper Umzimvubu drainage area. A mixture
of clay and loam soil dominates the area and is rich in organic matter deposits. This makes
for fairly good soil for general crop production. High potential soils are not common, making
up around 7-10%. Arable soils for dry land crops are found in 15-20% of the area. Around
50% provides high potential grazing land. Irrigation is possible, but more suitable for
perennial crops than annual crops with around 20% of soils in the area being suitable.
Trees are limited in the natural grassland, and consist of exotic species planted for firewood
and material supply purposes, in the form of Eucalypt and wattle stands. There are no
indigenous forests but small pockets of mist belt forest tree species occur in the higher lying
protected kloofs and ravines.
Overall, livestock production is to be favoured.Goats are not recommended as they have
heavy impacts on an already overtaxed resource base. Tree crops such as fruit, nuts and
timber are a good idea. Perennial crops such as pastures are also suitable, more so dry land
pastures. Annual cropping and specifically irrigated annual cropping is more limited to
suitable soils in the flood plain areas, where there is good potential. Attention needs to be
given to soil management and erosion control practices throughout - such as appropriate
contour protection.
Yield models for certain of the more well known crops suitable in this area are available
(Whitwell and Mitchell, 2010). Below, a table is provided to give an idea. The yield values
should be considered as a 10 year average. Accurate yield predictions are not possible
without comprehensive soil and land capability assessments.

TABLE1:CROP PRODUCTION POTENTIAL
Crop Name: Common crops
Average yield
(tons/ha)
Crop name: Alternative crops
Cabbage: Transplant Oct-Nov
87
Lettuce, Chicory
Cabbage: Transplant Jan
74
Barley
Carrot: Sow Nov
58-65
Apple, pear, peach and nectarines
(med chill cultivars)
Carrot: Sow Feb
30-40
Lemon, navel oranges, grapes, olives
Tomato: Transplant Oct
63
Blackberry, Raspberry
Dry beans
0.8
Lima beans, Lentils
Maize dry land
2.8-3.1
Chinese cabbage, mustard, swiss chard
Oats dry land
3.2
Sweet potatoes
Potatoes (Oct-Feb) dry land
26.3
Sage, Thyme,Pyrethrum
Wheat, irrigated
3.3
Walnut
Lucerne, irrigated
10
Cherry
Nodes or villages were identified within the region with the following criteria in mind:
•Established and new groups (SCGs)
•Concentration of groups for later clustering
•Different agro ecological zones (here defined as bio resource groups and units)
•Proximity to different centres or towns
•Potential for different farming styles:
oIntensive homestead production; diversity of vegetables and cereals, fruit
small livestock (chickens, ducks...)
oGroup projects; e.g. vegetable production, poultry, eggs,
oIndividual ‘emergent commercial’ farmers; cropping, livestock.
3.2 Participatory market assessment – diagnostic phase
Market Scoping: The process employed was to engage SCG members in a broader
community meeting in their area, in 4 nodes/villages (Khubetsoana, Mpharane, Nkau and
Masupa). As an example an overview of local market chains was developed in Khubetsoana
with a group of around 64 people. This is summarised below:
oNo formal or organised marketing processes exist in the village or the local area. In
the past there were livestock auctions (cows, sheep) at Queens Mercy nearby. These
have however been discontinued.
oThe only marketing that does occur is informal marketing by individuals. Produce is
sold to other individuals in and around the village. Competition is not a big problem
in the area, as demand outstrips supply in most cases. Otherwise individuals will
cooperate in terms of sales.
oPeople from outside Khubetsoana come to the village occasionally to purchase
cabbage, turnip, imifino (vegetable greens), potatoes, wool and thatching grass. The
price is lower for these customers considering transport and the fact that they buy in
bulk.

oSome people in the community transport imifino (especially turnip) to town and sell
there. Occasionally individuals group themselves together to facilitate transport to
sell maize or potatoes in town.
oSome community members have tried to form co-operatives to produce sheep, cattle
and maize on a commercial level. They have worked with the DoA and SEDA but
are still struggling to get registered in order to access funds available for co-
operatives.
oCrop production consists mostly of spinach, turnips, rape, cabbage, carrots and
imifino/ morogo (vegetable greens) in winter and maize, pumpkins, beans and carrots
in summer. Individuals sell surplus after providing food for themselves.
This picture was similar for all villages where the participatory market chain analysis was
conducted. This led to one of the primary recommendations of the process: to focus on local
and informal marketing opportunities and systems.
Commodity ranking: A participatory process of identifying agricultural commodities being
produced and sold in the area (Khubetsoana) was followed by ranking these commodities
using a list of criteria defined by the group. These commodities formed the basis for forming
and supporting commodity interest groups (CIGs) in the different villages.
TABLE 2:LOCAL MARKET CHAINS AND THEIR RELATIVE IMPORTANCE
Product
Criteria 1:
Demand
Criteria 2: Production costs
Criteria 3:
Disease or pests
Criteria 4:
Profitability
Total
Checks
No of
people
present
who sell
Estimated no
of people in
village who
sell
✓✓✓- always
high
✓✓-
seasonally
high
✓- seasonal
and not so
high
✓✓✓- does not cost a lot and
not too much labour or other
resources required
✓✓-fewer inputs, but high
labour requirement
✓- very expensive, includes
the need for a lot of different
inputs and lots of water and a
lot of labour
✓✓✓- Very few
diseases and pests,
easy to deal with
and cheap
✓✓- average
diseases and pests
✓- more diseases,
difficult to deal
with, expensive
✓✓✓- always
high
✓✓- seasonally
high
✓- seasonal and
not so high
Chickens
(white and
indigenous)
✓✓✓
✓
✓
✓✓✓
8
9
Imifino
(spinach,
greens)
✓✓✓
✓✓Doesn’t need to many
inputs
✓✓
✓✓✓
10
12
Sheep
(igusha)
✓✓✓
Local demand
is very high;
sheep are used
in all
ceremonies
and are even
more
important than
goats and
cows
✓
✓
✓✓✓
8
6
Pigs (Ihagu)
✓✓
✓✓✓
✓✓✓
✓✓✓Genera
lly easy to
manage but can
get swine flu
leading to
heavy losses
11
15
Cattle
✓✓
✓✓
✓✓
✓✓✓
9
2

Goat
(ibhokhwe)
✓
✓✓✓
✓✓✓
✓✓
9
7
Cabbage
✓✓(esp
July-Nov)
✓Needs lots of things,
expensive and needs a lot of
water
✓
✓✓
6
3
Potatoes
✓✓✓
✓Easy to grow- main cost is
labour in harvesting
✓✓
✓✓✓
9
26
Firewood
✓✓✓
✓✓✓
✓✓✓
✓✓✓
12
2
50
Thatching
grass
✓✓Supply
is limiting-
high local
demand
(disasters such
as fires, or
short grass can
b a big
problem)
✓✓No inputs costs, but
takes time to cut and prepare
✓✓
✓✓✓
9
4
50
Maize (dry
and green)
✓✓✓
✓
✓
✓✓People eat
a lot of maize;
local demand is
high
7
10
50
Wool
✓
✓✓sell without weighing,
classing or cleaning
✓✓✓
✓✓Under-
graded
sometimes in
Cedarville;
labour;
transport to Co-
op
8
5
5
The ranking achieved in the table above was discussed and changed to include an additional
criterion of number of people in the village involved in the enterprise and general demand in
the area. The commodities were thus ranked as follows:
1. Indigenous Chickens and commercial chickens (eggs and meat), 2. Potatoes,
3.Sheep (meat and wool), 4. Cattle and Goats and 5. Cabbage.
Rankings from other group discussions and villages were combined to form a more
generalised listing of important market or commodity chains for local marketing:
1. Poultry (meat and eggs), 2. Potatoes, 3. Sheep (meat and wool), 4. Livestock, 5.
Vegetable greens (imifino including turnips, spinach and cabbage) and 6. Maize
(included here as many smallholders grow maize, irrespective of profitability)
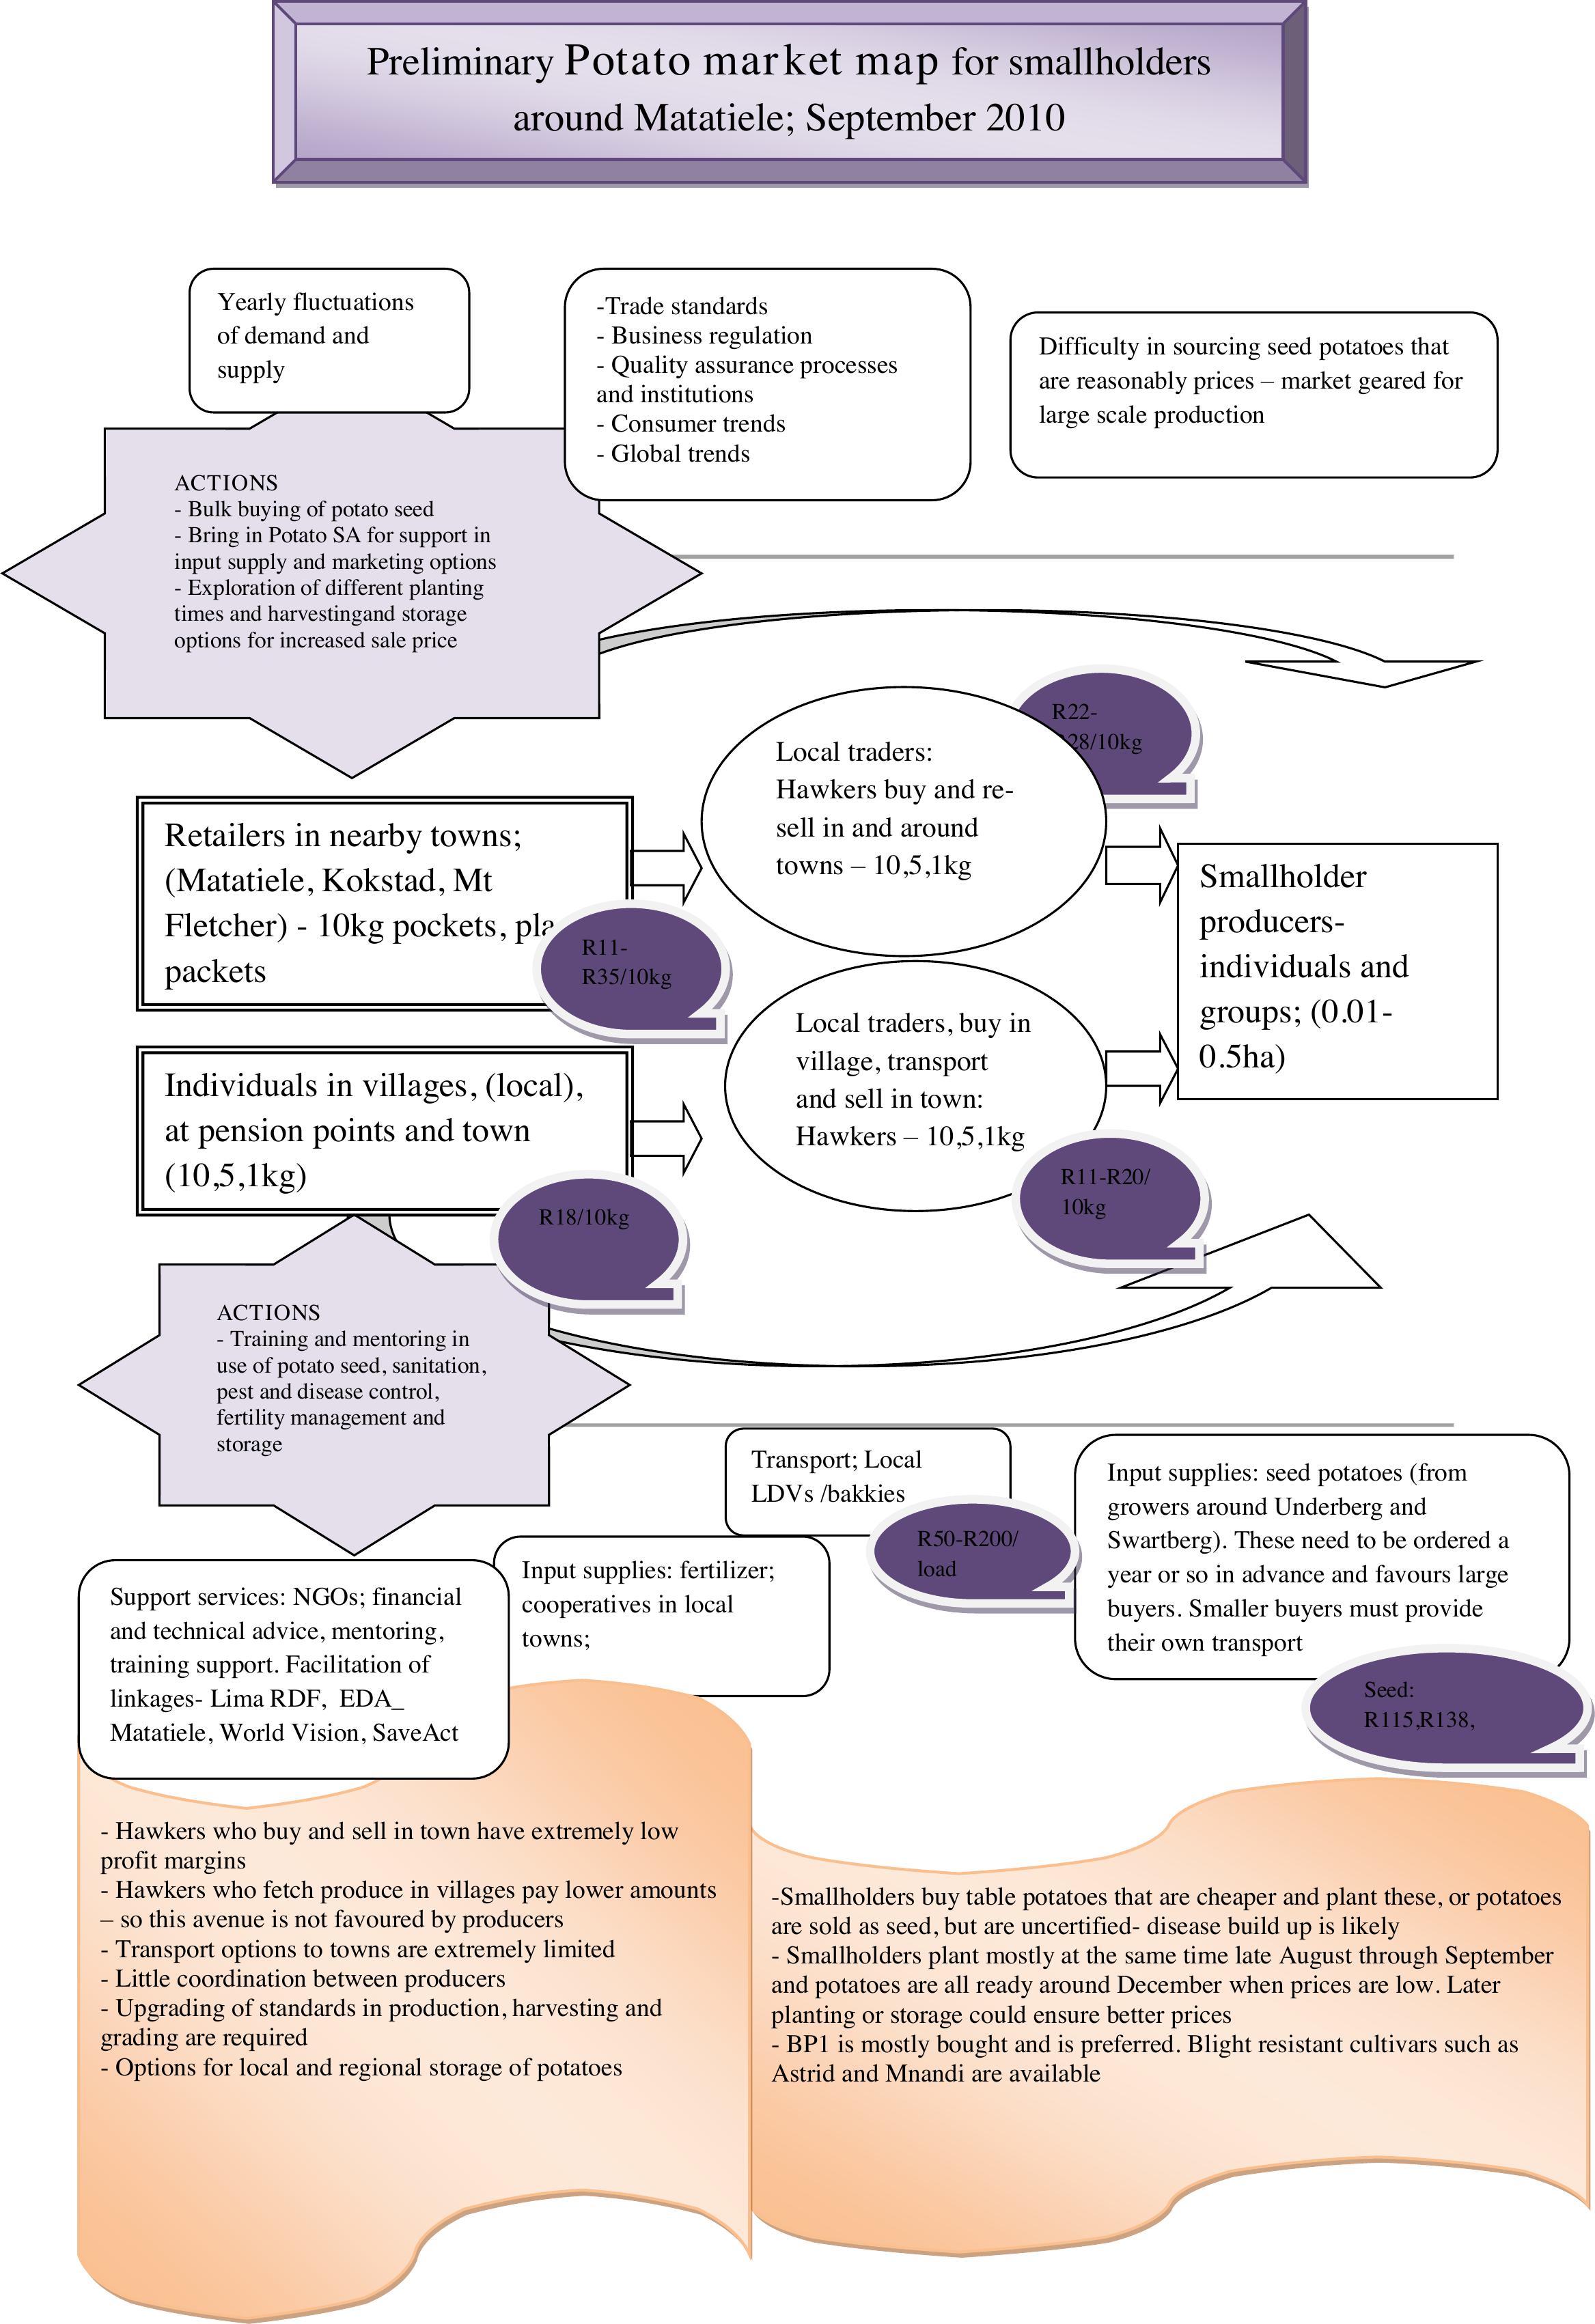
Market mapping: Market maps were produced for the 6 prioritized commodities (above),
after further interviews with stakeholders along the value chain in the region. Below, market
maps for poultry and potatoes are shown as examples.
The top 3rd of the map considers enabling business environment factors.
The middle 3rdof the map details market chain actors and their linkages. A ‘start’
insert summarises needed actions in this sphere.
The bottom 3rd of the map sets out business and extension service providers and a
‘start’ insert again summarises needed actions.
‘Flag’ inserts at the bottom of the page outlines key issues and constraints in the
market chain of this commodity.

ACTIONS
- Technical and management training
- SCG support in input supply and
marketing
- Strategic supply and marketing
arrangements facilitated through
membership organisations such as SA
Poultry
ACTIONS
- Bulk buying of feed.
- Better distribution network for
day old chicks
- Chicken abattoir
- Production and sale of 2 week
old chicks locally
Smallholder producers-
individuals and groups
- broilers and
layers(supported by
organisations – DSD,
World Vision, Lima,
DoA.......
Individuals in villages, (local), at
pension points and town buy eggs
and live chickens
Local traders: Hawkers
(buy and resell in and
around towns
Large hatcheries: National
Chicks and Stonor in KZN
Day old chicks –
R450-R490/box of
100
Point of lay hens:
R70-75/Hen
Feed: – large feed producers (Kokstad,
PMB),
- Cooperatives and retailers (bagged feed)
- Retailers – small quantities of bagged
feed, sometimes delivered
(Generally 60% more than bulk)
Smaller businesses; Distribution
e.g. Express Poultry. Small
hatchery in Swartberg.
Production: Laying hens,
multipurpose breeds
- Smaller numbers of laying hens not delivered – sources far
- Day old chicks are often very weak by the time they finally reach
smallholder farmers
- Bagging of feed through co-ops and then supplythrough retailers
makes it very expensive
-Large interest in poultry production, but groups not supported by
institutions often do not have the know how
- Inefficiencies in management, combined with high input costs
preclude a profit in many cases
Finisher: R240/50kg + R20/bag
transport
Laying mash: R190-R200/50kg
bag/ Transport: R80.00/5 bags
Live weight R60-
F80/chicken
Eggs R30/ tray 2.5
dozen or
R10.80/dozen
- Involvement of smallholders in commercial value chain
limited due to issues of scale, registration and economic
efficiency
-Local market opportunities are generally good.
- Potential for small speciality concerns that deal with 2
week old chicks, spent hens ....
SA Poultry; support for
smallholders – national sanitation,
disease monitoring, marketing,
supply chain management , policy
and global + local trends etc
Preliminary Poultry market map for smallholders
around Matatiele; September 2010
Requirements around slaughtering of
poultry preclude smallholders from
this market. No local poultry abattoir
Introduction of hardy multi-purpose
breeds and indigenous chickens
becoming more popular among service
providers
Other supplies; equipment,
medicines – are available through
cooperatives but generally
considered too expensive and are not
extensively used.
Information, mentoring and training;
organisations are present that can
support. Most smallholders work
withvery limited knowledge and
need a lot ofsupport
Local retailers e.g. Boxer
buy eggs. Also schools and
other institutions
Live weight R60-
F80/chicken
Eggs R27/ tray of
30
Spent laying
hens sold at
R30 ea.
R22-R28/10kg
ACTIONS
- Training and mentoring in
use of potato seed, sanitation,
pest and disease control,
fertility management and
storage
ACTIONS
- Bulk buying of potato seed
- Bring in Potato SA for support in
input supply and marketing options
- Exploration of different planting
times and harvestingand storage
options for increased sale price
Smallholder
producers-
individuals and
groups; (0.01-
0.5ha)
Individuals in villages, (local),
at pension points and town
(10,5,1kg)
Retailers in nearby towns;
(Matatiele, Kokstad, Mt
Fletcher) - 10kg pockets, plastic
packets
Input supplies: seed potatoes (from
growers around Underberg and
Swartberg). These need to be ordered a
year or so in advance and favours large
buyers. Smaller buyers must provide
their own transport
Seed:
R115,R138,
R160/25kg
Input supplies: fertilizer;
cooperatives in local
towns;
Transport; Local
LDVs /bakkies
-Smallholders buy table potatoes that are cheaper and plant these, or potatoes
are sold as seed, but are uncertified- disease build up is likely
- Smallholders plant mostly at the same time late August through September
and potatoes are all ready around December when prices are low. Later
planting or storage could ensure better prices
- BP1 is mostly bought and is preferred. Blight resistant cultivars such as
Astrid and Mnandi are available
R50-R200/
load
Local traders, buy in
village, transport
and sell in town:
Hawkers – 10,5,1kg
R11-R20/
10kg
- Hawkers who buy and sell in town have extremely low
profit margins
- Hawkers who fetch produce in villages pay lower amounts
– so this avenue is not favoured by producers
- Transport options to towns are extremely limited
- Little coordination between producers
- Upgrading of standards in production, harvesting and
grading are required
- Options for local and regional storage of potatoes
Yearly fluctuations
of demand and
supply
Difficulty in sourcing seed potatoes that
are reasonably prices – market geared for
large scale production
-Trade standards
- Business regulation
- Quality assurance processes
and institutions
- Consumer trends
- Global trends
R22-
R28/10kg
R22-
R28/10kg
Local traders:
Hawkers buy and re-
sell in and around
towns – 10,5,1kg
R11-
R35/10kg
R18/10kg
Support services: NGOs; financial
and technical advice, mentoring,
training support. Facilitation of
linkages- Lima RDF, EDA_
Matatiele, World Vision, SaveAct
Preliminary Potato market map for smallholders
around Matatiele; September 2010

3.3 Participatory value chain analysis
A value chain analysis was done for each commodity, with the intention of deepening
understanding, providing some input from the facilitators and building a stronger basis for
joint decision making around bulk buying for example. In this discussion, specific attention
was given to advice, mentoring and training support required. Emphasis was given to what
individuals and group members could do for themselves, as opposed to waiting for funding
and government support. Below is an example of a value chain analysis conducted and
summarised for two villages: Nkosana and Jabulani.
TABLE3:POUTLRYVALUECHAINANALYSIS
Poultry Value Chain for Nkosana and Jabulani
ACTIVITIES
COSTS ea activity
ISSUES
INFORMATION
REQUIRED
POSSIBLE
SOLUTIONS
Preparation of the
room where chicks
will be kept. The
floor is insulated
with soft grass or
sawdust.
Day old chicks: R5.00
at Matatiele. People
buy 20 - 100 chicks.
-20 chicks: R100.00
- 100 chicks: R500.00
Starter and Finisher
Mash:
5KG:R25.00 / R30.00
10KG:R50.00
50KG:R240.00
Transport: R15/bag in
the bus and R40/bag
in taxi
Two week old chicks:
R15-20.00
Feeds are very
expensive. There is
always risk of over-
feeding chickens
and they die as a
result.
Medication
Chicken growing
skills
Bulk buying of inputs
is very attractive and
can be done through
the SCGs- those in the
different groups that
are interested can
come together.
On arrival chicks
are given water
with medication.
Medication:
Teramicin (R20.00
per packet). The other
medication is Lasota.
Chicks and chicken
get sick very easily.
Common diseases
include worms,
influenza and sores.
Currently people use
care and traditional
herbs.
After two hours
chicks are fed with
Starter Mash.
Hardware/equipment:
R90.00 and R80.00
On week three the
chicks are given the
Finisher Mash.
Paraffin for lighting
On week five the
finisher Mash is
mixed with crushed
maize. This is done
to balance weight
and to make
chicken taste like
indigenous free
range chicken.
The addition of
crushed maize also
helps to make feed
cheaper.
On week six
chickens are given
both Finisher Mash
and raw maize.
They are ready for
the market /sale.
Most people
(farmers) feed
chickens beyond six
weeks mark. Local
customers buy on
credit. They are bad
payers. One can sell
between two and
Pricing
Establishing of
local markets.
Giving credit is one
strategy of avoiding
over-feeding chickens.
We can try joint
selling in SCGs, and
selling at pension
payout points.

three chickens per
month.
Those who have
deep-freezers are
able to slaughter
them and sell them
prepared.
SUPPORT NEEDED:
Access government subsidies (fencing and
other inputs)
Access to bigger loans and extended loan
terms (not the Women’s Development
Business, maybe UVIMBA and EC
Government Programme)
Facilitation of bulk buying (chicks and
feeds).
It became clear working in the villages with the SCGs that issues were broader and that work
would have to include different local SCGs. The idea for commodity interest groups
emanated from these discussions.
3.4 Commodity interest groups
Interest groups were set up in a number of the villages consisting of SCG members from
those areas. These groups considered the following potential actions:
oCollective or joint buying of input supplies coordinated across groups and villages
through a linkage person or organisation as a precursor to bulk buying.
oAdjusting the saving and pay-out processes in their group to accommodate
agricultural activities. It is possible to schedule annual share outs of capital to
coincide with the planting season.
oPrioritizing and coming together for learning events and information sessions.
oWorking together in groups or as groups of individuals to streamline agricultural
production and marketing.
Collective buying of inputs and learning and information events were prioritized. The
progress of group members were periodically tracked and monitored. A large public event in
the form of a Potato Information day was held in September 2010, where stakeholders such
as Potato SA, the Provincial Department of Agriculture, the local municipality’s Local
Economic Development section, NGOs such as World Vision and Lima RDF, community
members, commercial potato growers and commercial interests such as Sasol and Sanlam
were represented. From here a Potato Forum was formed to create the linkage for further
contact with Potato- SA and research and training possibilities, but mainly to coordinate bulk
buying activities for the NGOs and Department of Agriculture in the Matatiele area.
The potential of joint buying was illustrated by the order of vegetable seedlings and potato
seed that the Khaue and Jabulani villages asked SaveAct to place in 2011. This occurred even
though there had been no follow up in the communities since the previous initiative in 2010.
The seed potato order for 2012 has been substantial. In 2010 there were 15 x 30kg bags and
progressing to around 450 bags for the coming season. A summary of discussions with CIGs
around progress follows below:
1.In the first year people ordered on average 0.5 bags of potato seed each. These
potatoes did very well. They grew better and were bigger and healthier than before.

2.The advice regarding planting practises helped a lot as did the new variety of
potatoes, BP1.
3.Novuyani (from Khaue) said; “From 50kg of seed I made R2,500.00 selling the
potatoes. I charge R25/10kg bag .There was a great demand for the good quality
large potatoes and no one struggled to sell potatoes even though many of us had some
to sell.”
4.Groups chose prices that matched those in shops in Matatiele at the time. They felt it
was possible to add a little to that price as people do not need to go to town to buy;
5.Some of the potatoes were left in the field to harvest periodically over time. This is
the habit in the area. The potatoes grown from potato seed stayed fresh and
unblemished. “We cannot do this when we plant table potatoes as they rot in the
ground.”
6.Most members kept some for replanting, some for eating and some for selling.
7.In the following two years the members ordered and planted more seed; on average 1-
2 bags each.
8.They also mentioned that “It works well for us to coordinate our orders through
SaveAct. The Department of Agriculture is not reliable and it would be difficult to
work through them.”
Contribution of SCGs - It is understood that the SCGs assist members in term of savings
and loans for consumption and productive activities. The points below illustrate the nature of
the support from savings and credit using outcomes from the livelihoods assessment (Delany
and Storchi, 2012).
1.Members earn a significant income (2nd only to social grants) from their small
enterprise activities. See figure 2 below. The studywas conducted both in Matatiele
(n=60) in the Eastern Cape and in Bergville in KZN (n=74).
Earnings from Enterprise
Bergville
Matatiele
Last month1
R867 (range: R0 to R4 000)
R1 252 (range R0 to R10 000)
Good month2
R1 758 (range: R90 to R7 000)
R2 108 (range: R25 to R12 000)
Bad month3
R672 (range: R0 to R4 000)
R566 (range: R0 to R6500)
Figure 2: Earnings from small enterprises for SCGs members in the Eastern Cape and
KwaZulu-Natal
2.Members use loans from SCGs for starting and supporting their enterprise activities.
Figure 3a below indicates that 59% of respondents in Matatiele (n=147) used at least
one loan in the previous saving cycle for their enterprises (Delany and Storchi, 2012).
Overall around 9% of the money loaned has been used for agricultural enterprise development
in Matatiele, see Figure 3b.
1
Despite the recent time period, a number were not able to provide this information. No income estimates
were given or the SCG member did not know the amount in 23 of 94 cases in Bergville and 13 of 73 in
Matatiele.
2
No estimates were given in 19 of 94 cases in Bergville and 12 of 73 in Matatiele.
3
No estimates were given in 22 of 94 cases and 13 of 73 in Matatiele.

One respondent noted the following:“Members would borrow money to improve their
businesses and they know that they can borrow money from the group if anything in their
business is lacking…it is a two way process because [when]I have sold things, I take the
profit and save it to the saving scheme.”
Figure3a: Use of small loans from SCGs to support enterprise activities in Matatiele and
Bergville and Figure 3b: Overall use of loans for agricultural enterprises in Matatiele.
3.Loans taken in the SCGs are repaid primarily using income from grants (65%) and
from the small enterprises being undertaken (34%), as shown in Figure 4 below
(Delany and Storchi, 2012)
Figure 4: Sources of money for
repaying loans in the Matatiele SCG
membership.
4.Figure 5 below indicates the uses of share-out monies by SCG members in the
Matatiele area. These are lump sums that are available once a year. Around 7 % of
SCG members use their share out money for supporting their agricultural activities
(Delany and Storchi, 2012). Investment in inputs such as seeds, fertilizers, day old
chicks and chicken feed are common. Some members have fenced their fields, others
have bought tanks for water storage.
3% 4%
19%
37%
78%
59%
0%
20%
40%
60%
80%
100%
Bergville Matatiele
Used at least one
SCG loan to support
enterprise activities
Did not use an SCG
loan to support
enterprise activities
Not indicated
Non-
investment
, 30%
Household
, 35%
Enterprise,
5%
Agriculture
, 9%
Education,
21%
Investment
, 70%
Use of loans (Matatiele)
1%
10%
0%
1%
13%
2%
5%
26%
34%
65%
0%10% 20% 30% 40% 50% 60% 70%
Friends
Other relatives
Other external loan
Other SCG loan
Own savings
Another HH member
Employment
Spouse
Own enterprise
Grants
Matatiele (n=147)

Figure 5: Uses of yearly share out lump sums obtained through the SCGs in Matatiele
5.Levels of savings increase in the groups with length of membership, as shown in
Figure 6 below. Sources of money for saving are mainly grants. Income from
enterprises play a significant role as a source of money for savings and members saw
this as second only to grants. 41% of respondents mentioned using income from
enterprises as a source of savings (Delany and Storchi, 2012).
Figure 6: Changes in levels of savings between the 2010 and 2011 yearly savings cycles in
SCGs in the Matatiele area, compared with Bergville
Changes in SCGs
Some strategies for increasing productive activities may include changes in the focus and
management of the SCGs. Ideas that have developed internally have included:
1.Setting dates for monthly meetings to coincide with grant payouts; this is commonly
done.
2.Setting share out dates in October to coincide with need to buy agricultural inputs
3.Setting up SCGs specifically for the purpose of savings for agricultural inputs
4.Having membership in more than one group and having a slightly different focus for
savings and loans in each for these groups. From Figure 7 below it can be seen that
around 74% of members belong to one group only, 12% belong to 2 groups, 4 %
belong to 3 groups and 15 respectively belong to 4 -6 groups.
2%
3%
3%
3%
4%
7%
7%
7%
8%
9% 20%
20% 29% 58%
0%10% 20% 30% 40% 50% 60% 70%
Medical expenses
Other
Social or cultural purposes
Hired labour
Saved
Bought clothes
Bought food or groceries
Matatiele (N=147)
63%
18% 19%
89%
5% 6%
0%
50%
100%
IncreasedSame Decreased
Trend in Level of Savings
Bergville (n=62)Matatiele (n=62)

Figure 7: Membership of multiple SCGs among respondents in Matatiele
5.Planning joint marketing processes through the SCGs; such as selling produce at the
monthly meetings or jointly hiring transport for input supply or produce.
6.Working with SCG members as a specific client grouping for marketing particular
products.
7.Setting up small enterprises within the SCG membership that will support the
enterprises of the other members. An example here is to set up one member to rear
day old broiler chicks to two weeks of age and then sell them on to other members
who do broiler production and sale.
8.Buying and managing agricultural infrastructure together. One group has been
thinking of buying a second hand tractor together from their share-out payment and
then to hire this tractor from their group and also hire it out to other individuals.
SUMMARY
Members of savings and credit groups in Matatiele follow a stepped process of consumption
smoothing and investment in household and education needs before moving into investment
into small enterprises. Both loans and yearly share-out amounts are invested in enterprises,
mainly in the form of inputs. Income from the enterprises are ploughed back into the groups
in the form of savings. These groups are sustainable, offering unique access to financial
services to people living even in the most remote rural villages. This is having a powerful
influence on their motivation and capacity to engage in enterprise development and
agriculture.
The initial impetus for the formation of CIGs was the facilitation of a participatory value
chain analysis facilitated by SaveAct. This process of enquiry into local economic
opportunities and constraints inspired participants to form these interest groups to work
together to secure cheaper inputs and consider other strategies to strengthen their value
chains. These groups have formed a platform for collective action and innovation that have
included cooperation in productive and marketing activities, as well as input supply and
transport arrangements.
Furthermore, partnership with other organisations working in these areas that have more of an
agricultural focus has enabled members to access further agricultural training and mentoring
support.
9%
74%
12% 4%
1%
1%
Matatiele
Not indicated
1 group
2 groups
3 groups
4 groups
6 groups

SCG members indicated that one of the benefits of being part of an SCG is the support that
they receive from other group members. This helps them to become more confident in
starting or running an enterprise because they are able to share their problems and
knowledge.
ACKNOWLEDGEMENTS
SaveAct wishes to acknowledge the Vesper Society of California, USA for the funding for
the PMSA study. The wider LEAP programme also receives funding from the European
Union through Thina Sinako, a programme of the Eastern Cape Government and from the
National Development Agency.
SaveAct also wishes to acknowledge the FinMark Trust for financial support to conduct the
livelihoods assessment and small enterprise development study conducted in the Eastern
Cape and KZN.
REFERENCES
ALBU, M. and GRIFFITH, A. June 2006. Mapping the market: participatory market chain
development in practice. Small Enterprise Development. Vol.17 No 2.
ALMOND, F. and Hainsworth, S. (editors) (2005) Beyond Agriculture – making markets
work for the poor. Proceedings of an international seminar, CPHP, March 2005, London, UK.
BENNET, B. October2002. Market Scoping: methods to help people understand their
marketing environment. PLA Notes 45. Reading no 15.
Camp, K.T.G. 1999. Guide to the use of the Bio resource Programme. Cedara Report No
N/A/99/1. KZN Department of Agriculture.
Delany, A and Storchi, S. 2012. SaveAct Savings and Credit Groups and Small Enterprise
Development: Understanding Strategies and Opportunities to Promote Livelihoods Strategies
and Small Enterprise Development, including in Agriculture, through Savings Groups in a
Rural Setting. A Report for FinMark Trust, SaveAct.
Griffith, A. and Osorio,L.E. September 2008. Participatory market system development: Best
practices in implementation of value chain development programs.. USAID. Best practice in
implementation paper series. microREPORT#149.
McCleod, N: 2010 SaveAct/LEAP agro-project development support. Environmental and
spatial pointers for land based production initiatives for SCGS in the Matatiele area.
Environmental and Rural Solutions cc. PO Box 14 Matatiele.
PMCA user guide. Available from http://www.cipotato.org/pmca/11phase1.htm (Accessed
25 May 2010).

PRACTICAL ACTION. 2008. Mapping the market: A framework for rural enterprise
development policy and practice. Available from http://practicalaction.org/markets-and-
livelihoods/mapping_the_market (Accessed 25 May 2010).
Whitwell, P and Mitchell, F. 2010. Bio resource Programme: A natural resources
classification system for KwaZulu-Natal. Version 9 – printed 29/06/2010.
Wright,J. and Ng’habi,S. November 2009. Participatory Market Analysis. Hillside
Conservation Agriculture for Smallholder Farmer Livelihood Improvement Project (HICAP)
Conservation Agriculture Project, South Uluguru, Morogoro. CARE.