
1
Matatiele Livelihoods Assessment
September 2014:Emerging data
Brief overview of outcomes
Savings and Credit Groups (SCGs) are key within the SaveAct model in assisting the rural poor and specifically
women to engage actively in productive activities such as agricultural enterprises. The commodity interest group
(CIG) focus for agricultural enterprises assists substantially in providing cheaper inputs, improving production and
gaining knowledge for their enterprises. In interviews conducted with participants, of a sample of 100 , all CIG
participants have mentioned trying out new ideas introduced in the CIG meetings and learning workshops. Around
48% of CIG participants have made use of the bulk buying processes set up.
Currently, there is a growing demand for production training in poultry and vegetables, training and support in
rainwater harvesting, and Isiqalo (business start up) training. Further support in bulk buying and access to inputs has
been requested.
Most of the SCG and CIG participants are women, the majority of whom are older women. Their overall average
incomes are extremely low at around R1 800/month. People spend around 15% of their incomes on their
agricultural enterprises, using primarily SCG loans and share-outs for these activities. Basic needs, home
improvements, education and consumption smoothing
1
take up the largest proportion of their expenditure.
Of the 85% of respondents in a survey of CIG participants involved in agricultural enterprises close to 50% do not
make an income from these activities, but produce food for their households.
Introduction and background
SaveAct has been operating in Matatiele for around five years. In this time the SCGs have expanded dramatically and
support has been provided for local economic development.
A PMSA (participatory market system analysis) was done for the Matatiele, Mt Fletcher area towards the end of
2010. The process led to the development of the agricultural enterprise support model which includes a VCA
(participatory value chain assessment) for interested SCG members in a locality, the creation of CIGs (Commodity
Interest Groups) around locally prioritized commodities/ agricultural enterprises, training in business start-up skills
(Isiqalo) for interested CIG members and ongoing mentoring support in input supply, production aspects and
marketing within the CIGs.
In 2013 more coherent support for Isiqalo training and CIGs was provided. The table below summarises the
participation in these processes.
Isiqalo training summary; Matatiele 2013
No
Isiqalo trainee days
102
Improvement of current business (according to business plans submitted)
40 (n=69)
New businesses (Acc to new business plans submitted)
16 (n=69)
Isiqalo themes per training group:
Poultry; broiler production
1
Sheep; meat and wool
1
Vegetable production and sheep management
1
1
Consumption smoothing relates to a person’s abilities to cover their monthly expenses and basic needs such as food, shelter, health,
educational and cultural needs and the like and also to reducing indebtedness
2
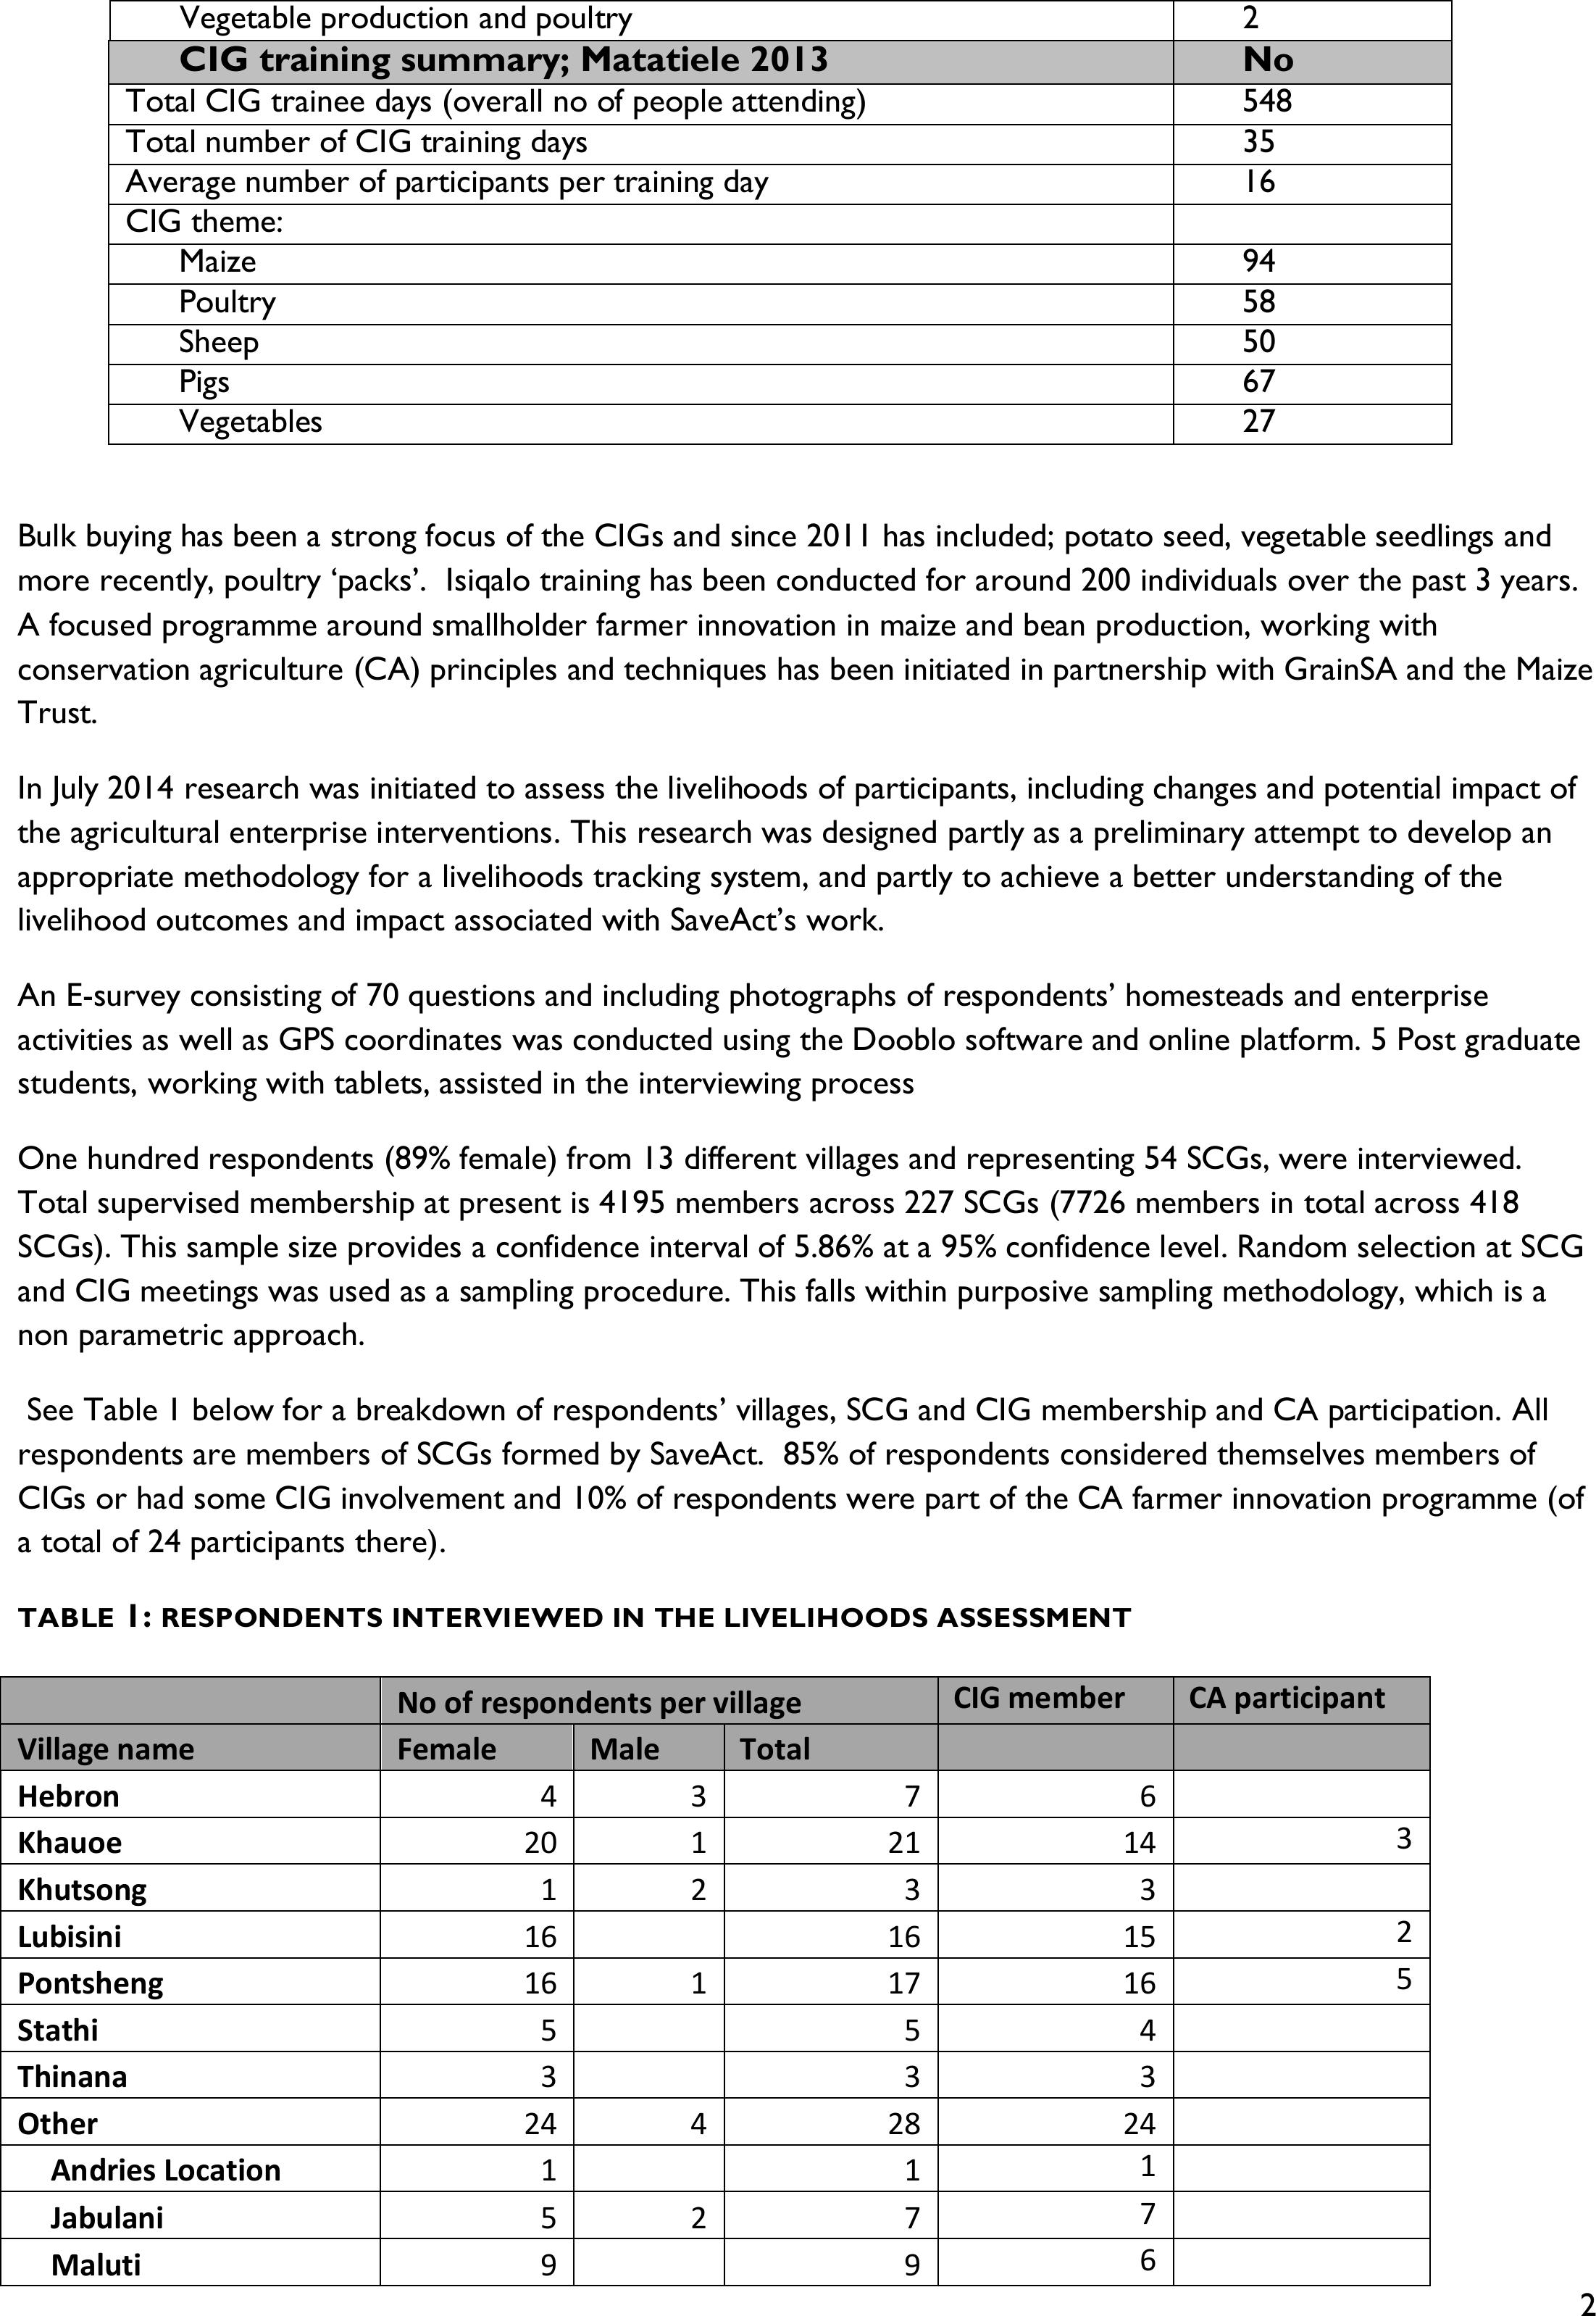
Vegetable production and poultry
2
CIG training summary; Matatiele 2013
No
Total CIG trainee days (overall no of people attending)
548
Total number of CIG training days
35
Average number of participants per training day
16
CIG theme:
Maize
94
Poultry
58
Sheep
50
Pigs
67
Vegetables
27
Bulk buying has been a strong focus of the CIGs and since 2011 has included; potato seed, vegetable seedlings and
more recently, poultry ‘packs’. Isiqalo training has been conducted for around 200 individuals over the past 3 years.
A focused programme around smallholder farmer innovation in maize and bean production, working with
conservation agriculture (CA) principles and techniques has been initiated in partnership with GrainSA and the Maize
Trust.
In July 2014 research was initiated to assess the livelihoods of participants, including changes and potential impact of
the agricultural enterprise interventions. This research was designed partly as a preliminary attempt to develop an
appropriate methodology for a livelihoods tracking system, and partly to achieve a better understanding of the
livelihood outcomes and impact associated with SaveAct’s work.
An E-survey consisting of 70 questions and including photographs of respondents’ homesteads and enterprise
activities as well as GPS coordinates was conducted using the Dooblo software and online platform. 5 Post graduate
students, working with tablets, assisted in the interviewing process
One hundred respondents (89% female) from 13 different villages and representing 54 SCGs, were interviewed.
Total supervised membership at present is 4195 members across 227 SCGs (7726 members in total across 418
SCGs). This sample size provides a confidence interval of 5.86% at a 95% confidence level. Random selection at SCG
and CIG meetings was used as a sampling procedure. This falls within purposive sampling methodology, which is a
non parametric approach.
See Table 1 below for a breakdown of respondents’ villages, SCG and CIG membership and CA participation. All
respondents are members of SCGs formed by SaveAct. 85% of respondents considered themselves members of
CIGs or had some CIG involvement and 10% of respondents were part of the CA farmer innovation programme (of
a total of 24 participants there).
TABLE 1:RESPONDENTS INTERVIEWED IN THE LIVELIHOODS ASSESSMENT
No of respondents per village
CIG member
CA participant
Village name
Female
Male
Total
Hebron
4
3
7
6
Khauoe
20
1
21
14
3
Khutsong
1
2
3
3
Lubisini
16
16
15
2
Pontsheng
16
1
17
16
5
Stathi
5
5
4
Thinana
3
3
3
Other
24
4
28
24
Andries Location
1
1
1
Jabulani
5
2
7
7
Maluti
9
9
6
3
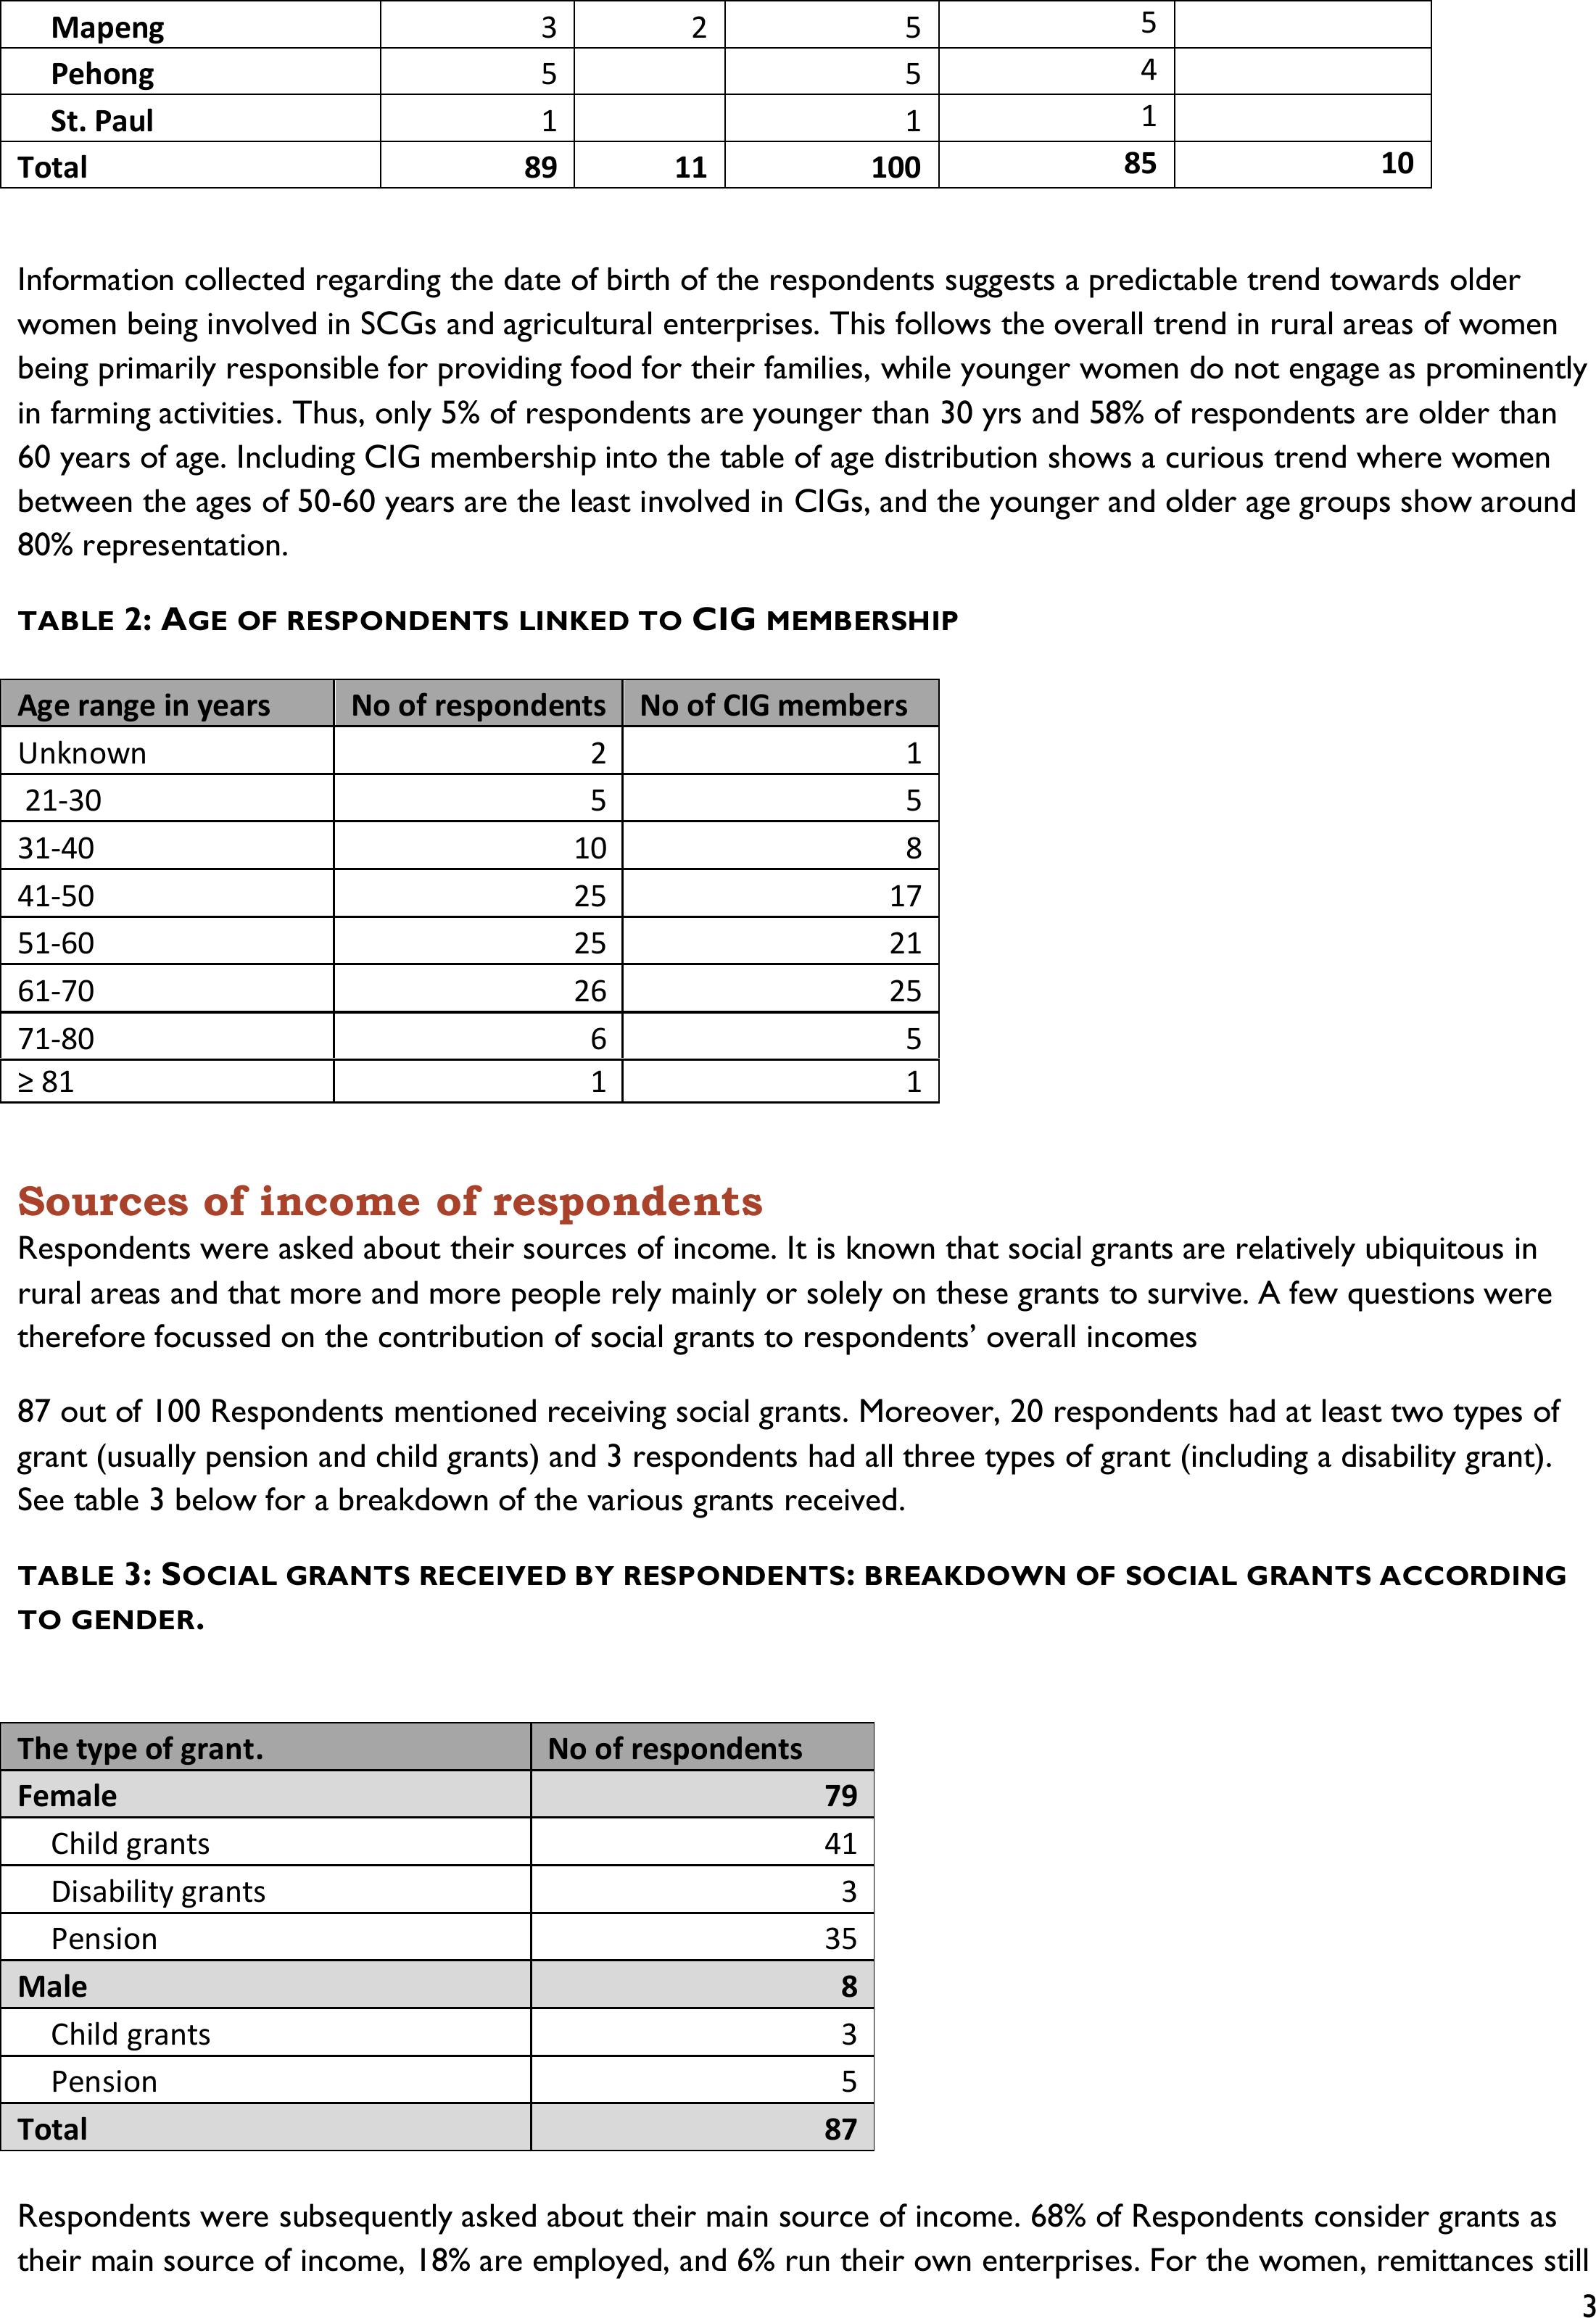
Mapeng
3
2
5
5
Pehong
5
5
4
St. Paul
1
1
1
Total
89
11
100
85
10
Information collected regarding the date of birth of the respondents suggests a predictable trend towards older
women being involved in SCGs and agricultural enterprises. This follows the overall trend in rural areas of women
being primarily responsible for providing food for their families, while younger women do not engage as prominently
in farming activities. Thus, only 5% of respondents are younger than 30 yrs and 58% of respondents are older than
60 years of age. Including CIG membership into the table of age distribution shows a curious trend where women
between the ages of 50-60 years are the least involved in CIGs, and the younger and older age groups show around
80% representation.
TABLE 2:AGE OF RESPONDENTSLINKED TOCIGMEMBERSHIP
Age range in years
No of respondents
No of CIG members
Unknown
2
1
21-30
5
5
31-40
10
8
41-50
25
17
51-60
25
21
61-70
26
25
71-80
6
5
≥ 81
1
1
Sources of income of respondents
Respondents were asked about their sources of income. It is known that social grants are relatively ubiquitous in
rural areas and that more and more people rely mainly or solely on these grants to survive. A few questions were
therefore focussed on the contribution of social grants to respondents’ overall incomes
87 out of 100 Respondents mentioned receiving social grants. Moreover, 20 respondents had at least two types of
grant (usually pension and child grants) and 3 respondents had all three types of grant(including a disability grant).
See table 3 below for a breakdown of the various grants received.
TABLE 3:SOCIAL GRANTS RECEIVED BY RESPONDENTS: BREAKDOWN OFSOCIAL GRANTS ACCORDING
TO GENDER.
Respondents were subsequently asked about their main source of income. 68% of Respondents consider grants as
their main source of income, 18% are employed, and 6% run their own enterprises. For the women, remittances still
The type of grant.
No of respondents
Female
79
Child grants
41
Disability grants
3
Pension
35
Male
8
Child grants
3
Pension
5
Total
87

4
play a role and 7% receive these as their main source of income. Table 4 below compares the main source of
income with the average monthly income as set out by respondents.
For those with social grants as their main source of income, around 19% receive R501-R1 000, 51% receive between
R1001-R2 000/month and 20,5% receive between R2001-R3 000.
TABLE 4:MAIN SOURCE OF INCOME OF RESPONDENTS,INDICATING INCOMES EARNEDACCORDING TO
GENDER
Main source of income
for your household
>R6 000
Don't
know
R1001-
R2000
R1-R500
R2 001-
R3000
R3001-
R4000
R4001-
R6000
R501-
R1000
Total
Female
2
1
42
4
18
4
1
17
89
Employment
1
1
8
3
1
1
2
17
Own enterprise
2
1
1
4
Remittances
1
2
1
1
2
7
Social Grants
30
4
13
1
13
61
Male
1
2
5
1
1
1
11
Employment
1
1
Other
1
1
Own enterprise
1
1
2
Social Grants
1
5
1
7
Total
3
3
47
4
19
4
2
18
100
CIGS (%)
2
2
55
5
17
4
1
14
100
A visual representation of the above table is found in Figure 1 below. It indicates that income potential is generally
similar for people whether they get their income from grants, own enterprises, remittances or employment. Income
averages for most people between R1 001-R2 000 per month.
The sample distribution is as follows:
Income range
No of respondents (N=97)
%
R1-R1000
22/97
23%
R1001-R2000
47/97
48%
R2 001- R3 000
19/97
20%
R3 001-R4 000
4/97
4%
>R 4 000
5/97
5%
0
5
10
15
20
25
30
35
40
Employment
Other
Own enterprise activity
Remittances
Social Grants

5
FIGURE 1:DISTRIBUTION OF INCOMEEARNED RELATED TO INCOME SOURCES.
Figure 2 below gives an indication of the breakdown of income categories for those respondents belonging to
commodity interest groups (CIGs). All income groups are well represented, with a slightly higher representation of
the lower income groups in the CIGs. 74% earn between R1-R2 000 compared to 69% in the overall group.
FIGURE 2:DISTRIBUTION OF INCOMEEARNED RELATED TO CIG MEMBERSHIP
Agricultural Enterprises
Respondents were asked which enterprises they are involved in, in order of their importance. This will differ for
each individual, but does give a broad indication of involvement in agricultural enterprises for all respondents. This
shows that around 41% of respondents are involved in potato production, 16% in maize production and 13% in
poultry and vegetable production respectively.
TABLE 5:INVOLVEMENT IN AGRICULTURALENTERPRISES
Agricultural
enterprise
CIG member;
Main enterprise
Non
member
Total
Single
enterprise
Multiple enterprises
and CIG members
Maize
16
16
1
47
None
1
14
15
15
Potato
40
1
41
3
41
Poultry
13
13
11
42
Sheep
2
2
2
12
Vegetables
13
13
8
53
Pigs
-
-
-
-
15
Total
85
15
100
25
Most respondents are involved in a number of different agricultural enterprises; mostly between 2 and 4. This is
shown in the small synopsis table above. Those involved in only one agricultural enterprise are proportionally few
(25 of 85 CIG members) compared to those involved in 2 or more enterprises (70% of respondents).
>R6 000
2%
Don't know
2%
R1001-R2000
55%
R1-R500
5%
R2 001-R3000
17%
R3001-R4000
4%
R4001-R6000
1% R501-R1000
14%

6
Table 6 below gives an indication of the combination of enterprises respondents are involved in. It has been
constructed for a series of 3 enterprises to illustrate the trend. If one looks for example at those respondents that
grow maize, 1 of the 16 respondents grows maize only, 8 simultaneously keep poultry, 8 also grow vegetables, 3 also
keep sheep, 2 have pigs and 1 has cattle.
TABLE 6:COMBINATION OF AGRICULTURAL ENTERPRISES
Enterprise1
Enterprise 2
Enterprise 3
Total
Maize
1
Maize
Poultry
3
Maize
Poultry
Pigs
2
Maize
Poultry
Sheep
1
Maize
Vegetables
4
Maize
Vegetables
Cattle
1
Maize
Vegetables
Poultry
2
Maize
Vegetables
Sheep
2
Sub-Total
16
Potato
Maize
1
Potato
Maize
Poultry
1
Potato
Maize
Vegetables
29
31
Total Maize producers
47
This analysis indicates that most participants engage in a number of different agricultural activities/enterprises and
that each person prioritises their enterprises within their own household and economic context. Most participants
do have a ‘main’ enterprise or activity that they focus on.
CIG Membership
Potatoes
Table 7 below indicates that the CIGs for potatoes were started in 2010. In 2011 very few people joined. A steady
increase was shown in 2012 and 2013.
Similar trends are apparent for all the CIGs, mostly because in 2011, very little focus was given to this work. For
2012 and 2013 a steady increase in membership is shown.
TABLE 7:POTATO CIG MEMBERSHIP ACROSSVILLAGES
Year of
joining
Hebron
Khauoe
Khutsong
Lubisini
Other
Pontsheng
Stathi
Total
2010
1
2
1
3
5
12
2011
2
2
1
5
2012
2
5
3
1
11
2013
1
2
1
4
2
3
13
2014
1
1
Total
3
8
2
4
12
12
1
42
Respondents were asked about the incomes they have earned from each of their agricultural enterprises, including
potato production. Incomes have been summarised for the main enterprise mentioned by respondents. The two
figures below indicate the incomes generated from potato production.
41 Respondents participated in potato production. Of these 23 did not earn an income from their production (56%).
Thismeans that the harvest was used for household consumption. 15 Respondents (30%) earned between R1-

7
R1 000. A small percentage of respondents earned a reasonably substantial income of more than R2 000 and in one
case around R8 000 form their potato production.
FIGURE 3: INCOME EARNED FROM POTATO PRODUCTION .
Maize
Maize is produced mainly for household consumption and also in quite small plots of land as people now are using
primarily their homesteads lots for production and not the larger fields generally situated much further away from
the homesteads. Two respondents made an income of between R501-R1 000 and one respondent made an income
of R1 001-R1 500.
FIGURE 4: INCOME EARNED FROM MAIZE PRODUCTION
Potato
member I
don't
know
3%
Potato
member
R0
56%
Potato
member
R1501-
R2000
5%
Potato
member
R1-R200
10%
Potato
member
R2001-
R2500
2%
Potato
member
R201-R500
15%
Potato
member
R501-
R1000
5%
Potato
member
R8 001-
R10 000
2%
Potato non
member
R0
2%
Potatoes
0510 15 20 25
Potato member I don't know
Potato member R0
Potato member R1501-R2000
Potato member R1-R200
Potato member R2001-R2500
Potato member R201-R500
Potato member R501-R1000
Potato member R8 001-R10 000
Potato non member R0
Income from potato production
Total
0510 15
R0
R501-R1000
Maize
Income from maize
production
Total
Maize R0
81%
Maize
R1001-
R1500
6%
Maize
R501-
R1000
13%
Maize
8
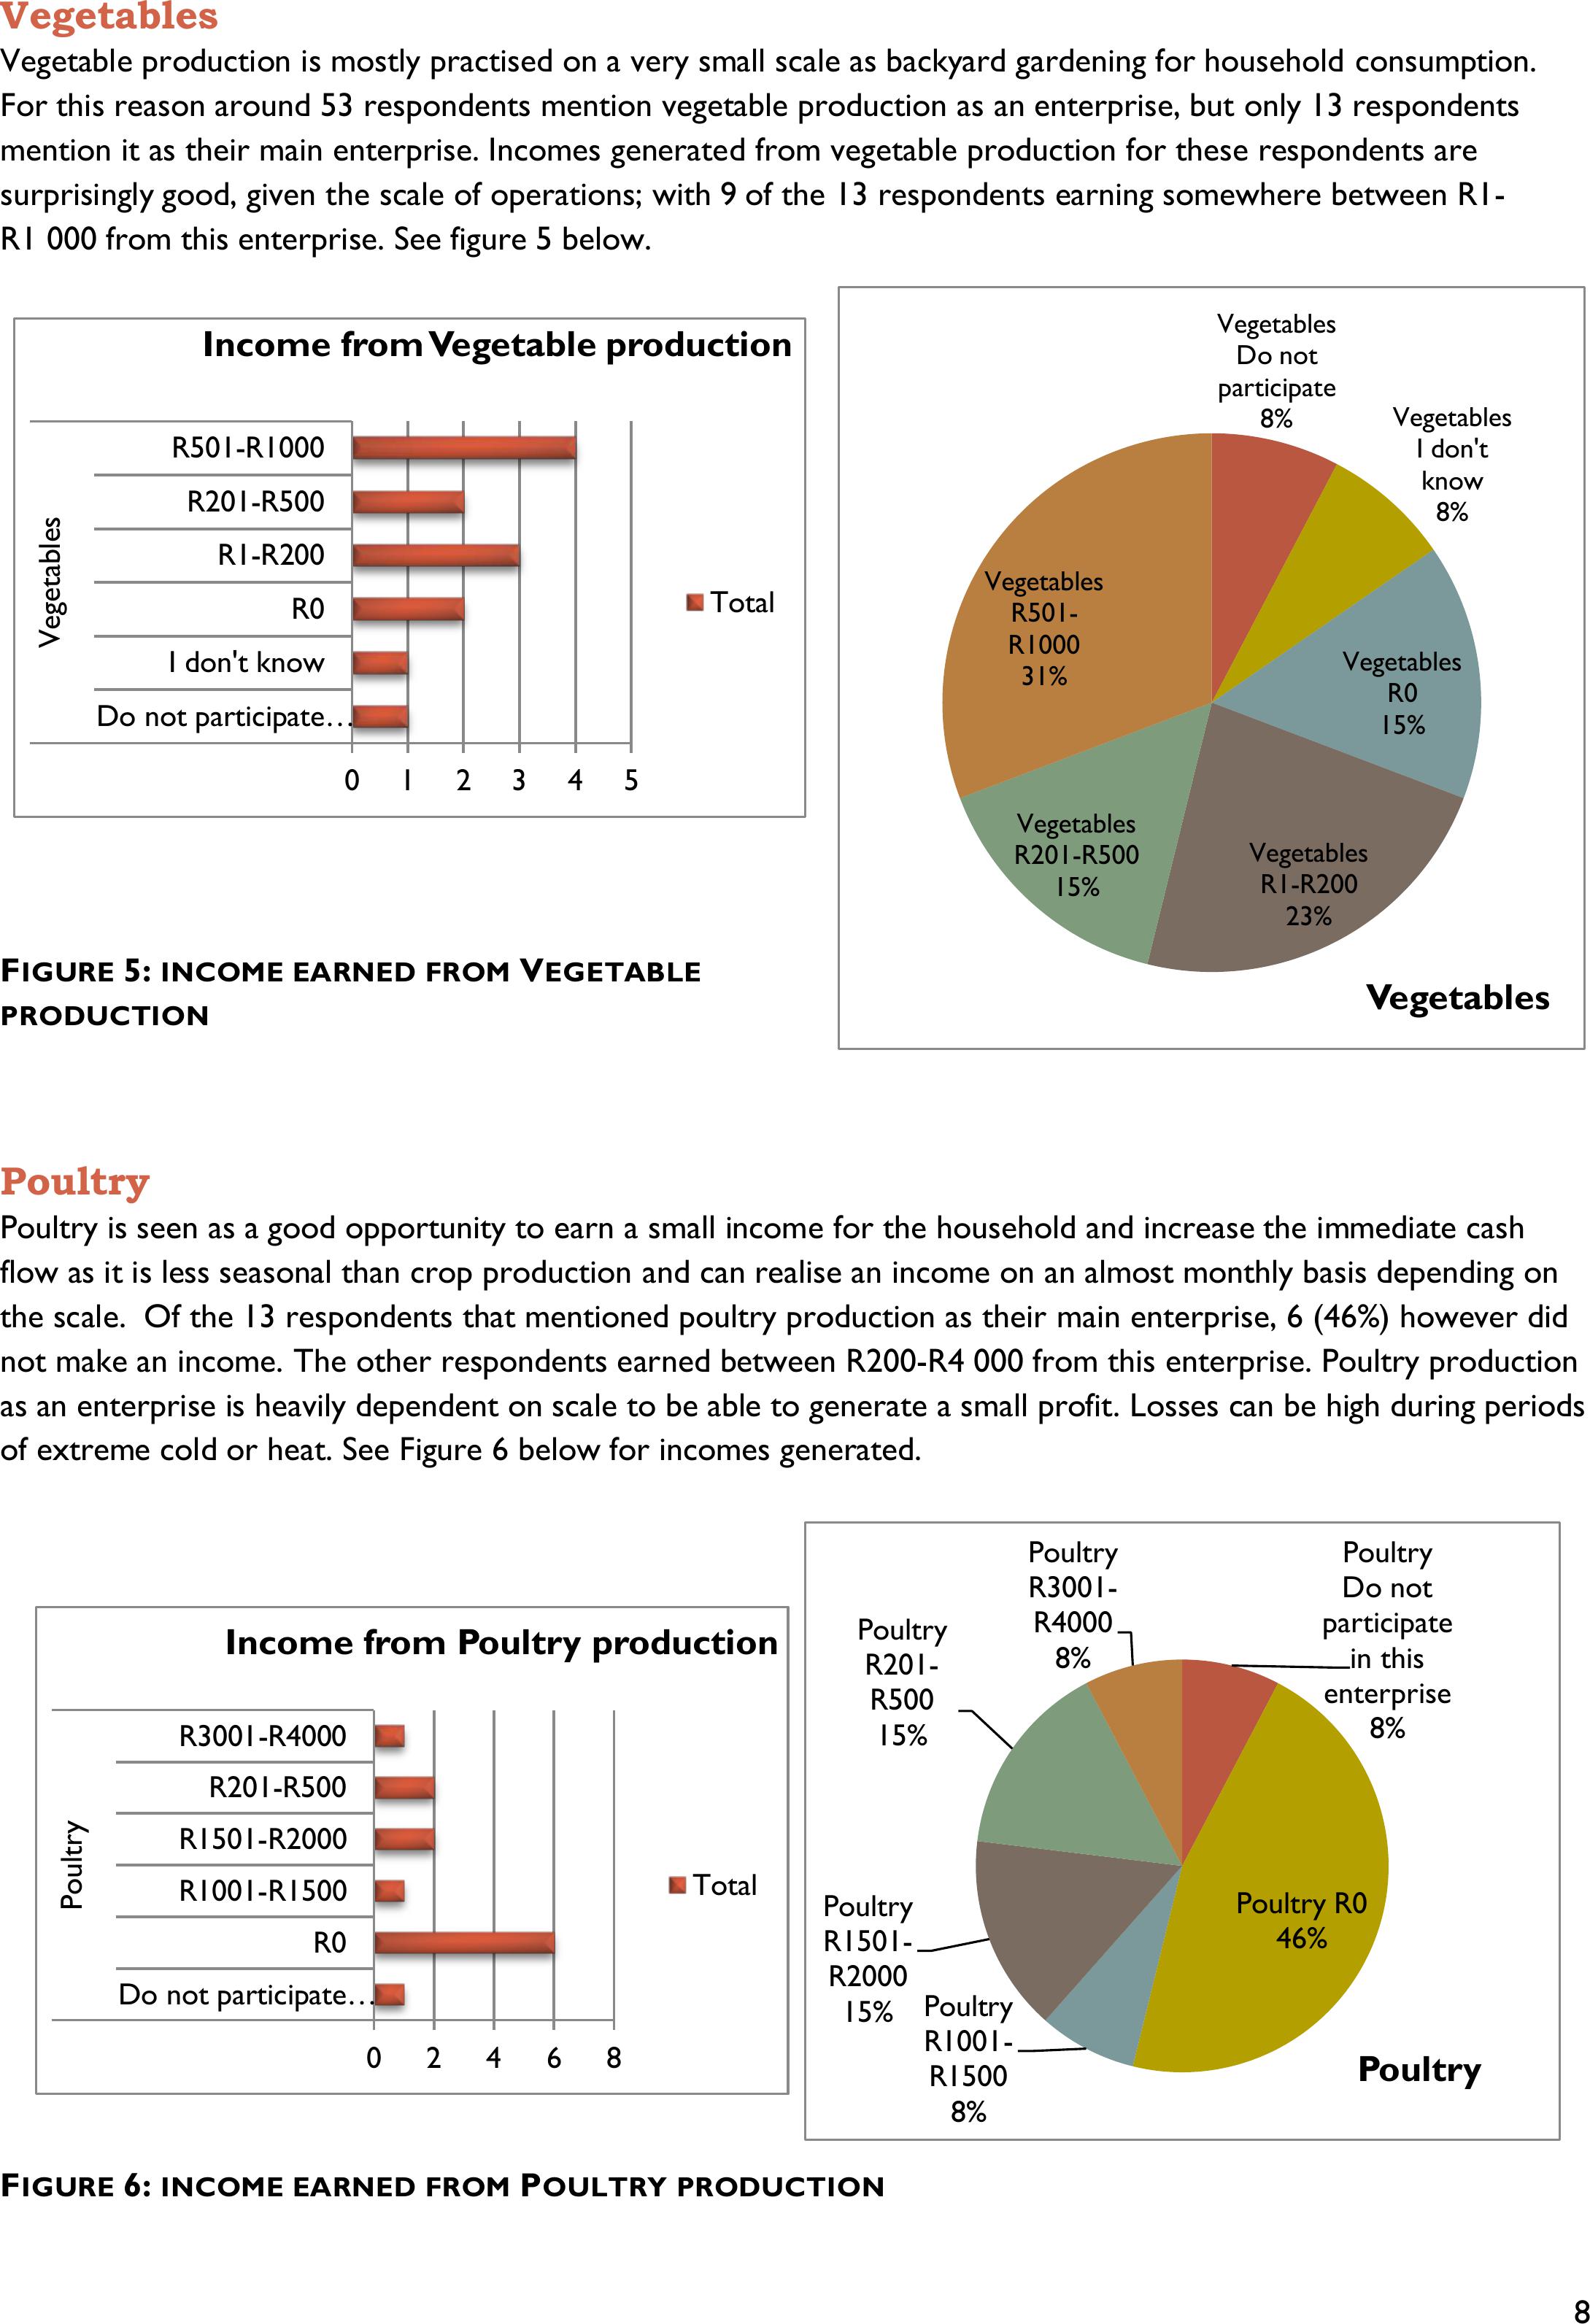
Vegetables
Vegetable production is mostly practised on a very small scale as backyard gardening for household consumption.
For this reason around 53 respondents mention vegetable production as an enterprise, but only 13 respondents
mention it as their main enterprise. Incomes generated from vegetable production for these respondents are
surprisingly good, given the scale of operations; with 9 of the 13 respondents earning somewhere between R1-
R1 000 from this enterprise. See figure 5 below.
FIGURE 5: INCOME EARNED FROM VEGETABLE
PRODUCTION
Poultry
Poultry is seen as a good opportunity to earn a small income for the household and increase the immediate cash
flow as it is less seasonal than crop production and can realise an income on an almost monthly basis depending on
the scale. Of the 13 respondents that mentioned poultry production as their main enterprise, 6 (46%) however did
not make an income. The other respondents earned between R200-R4 000 from this enterprise. Poultry production
as an enterprise is heavily dependent on scale to be able to generate a small profit. Losses can be high during periods
of extreme cold or heat. See Figure 6 below for incomes generated.
FIGURE 6: INCOME EARNED FROM POULTRYPRODUCTION
0 1 2 3 4 5
Do not participate…
I don't know
R0
R1-R200
R201-R500
R501-R1000
Vegetables
Income from Vegetable production
Total
Vegetables
Do not
participate
8% Vegetables
I don't
know
8%
Vegetables
R0
15%
Vegetables
R1-R200
23%
Vegetables
R201-R500
15%
Vegetables
R501-
R1000
31%
Vegetables
02468
Do not participate…
R0
R1001-R1500
R1501-R2000
R201-R500
R3001-R4000
Poultry
Income from Poultry production
Total
Poultry
Do not
participate
in this
enterprise
8%
Poultry R0
46%
Poultry
R1001-
R1500
8%
Poultry
R1501-
R2000
15%
Poultry
R201-
R500
15%
Poultry
R3001-
R4000
8%
Poultry

9
For sheep production, there were only two respondents who mentioned this as their main enterprise. One
respondent did not make an income and the other made an income of between R501-R1 000.
Use of small loans from SCGs for agricultural enterprises
Saving and Credit group (SCG) members take out small loans on a monthly or bi monthly basis, in their groups.
These loans can not be more than double their present savings in the group and are agreed to unanimously by the
whole group prior to being awarded. Interest of ≤ 10% is charged on these small loans and they are apdi pack on a
regular basis within the saving cycle of 12 months. At the end of the yearly saving cycle people receive thier shar
out- which is a combination of their savings ofr hte year and a proportion of the interest earned by the group from
small laons.
Particpants use the small loans for a number of different purposes, including thier agricultural and other small
enterprises.
Most respondents (78%) took between 1 and 3 small loans in their previous savings cycle in their SCGs. See Table 8
below.
TABLE 8:NUMBER OF SMALL LOANS TAKEN BY RESPONDENTS IN THEIR PREVIOUS SAVINGS CYCLE
No of loans during the PREVIOUS cycle
CIG member
Non member
Total
1
16
4
20
2
26
6
32
3
26
26
4
2
2
5
2
1
3
6
2
2
More than 8
1
1
None
10
4
14
Total
85
15
100
Table 9 below indicates the frequency of expenditure type per loan. Around 21% of the small loans taken in the
previous savings cycle (2013) were taken for agricultural enterprises, 27% for basic needs and house improvements
respectively, 14% for education and only 3% for non agricultural enterprises. Other categories for which small loans
were taken include starting enterprises and paying off debts, as well as traditional ceremonies, paying off vehicles,
buying a water tank, etc.
TABLE 9:FREQUENCY OF EXPENDITURE TYPE PERLOAN
Frequency of Expenditure Type Per Loan
Agric
Enterprise
Basic
Needs
Education
House
Improvements
Non-
agricultural
enterprise
Other:
start
enterprise
Other:
Pay off
debt
Other
Total
Loan 1
17
15
14
16
3
2
2
6
75
Loan 2
16
17
10
32
2
0
0
3
80
Loan 3
7
13
5
6
1
0
0
2
34
Loan 4
1
6
0
1
0
0
0
1
9
Loan 5
1
4
0
1
0
0
0
0
6

10
Sub total
42
55
29
56
6
2
2
12
204
%
21%
27%
14%
27%
3%
1%
1%
6%
A visual representation of the information in the above table is shown below.
FIGURE 7:USE OF SMALL LOANS IN SCGS FOR DIFFERENT ACTIVITIES
Looking at the amounts spent on small loans for the main activities, those taken for house improvements are the
largest and most common with 25% of the loans being between R3 001-R5 500 and the other 75% being below
R2 000. This is followed by agriculture where 76% of the small loans are below R2 000 for the year, 185 are
between R2 501-R3 000 and 6% are above R3 000. The small loans for basic needs are predictably smaller with 87%
of the small loans being less than R2 000 for the year.
TABLE 10:AVERAGE SIZE OF SMALL LOANS TAKEN BY RESPONDENTS IN THE PREVIOUSSAVINGS CYCLE
(2013)
Size of small loans
Agric Entrprises
Basic Needs
House
improvements
Education
R1-R500
4(27%)
1
R501-R1 000
5(29%)
5(33,5%)
12(37,5%)
4
R1 500- R2 000
8(47%)
4(27%)
12 (37,5%)
3
R2 500-R3 000
3(18%)
2(13,5%)
3
R3 001-R5 500
1(6%)
8(25%)
4
17
15
32
15
19,7%
17,4%
37,2%
17,4%
Considering the overall amounts of the loans taken a similar percentage as the number of loans comes to the fore,
with around 21,5% of the overall loans of R372 403 for agricultural enterprises (R80 100). For home improvements
the amount taken for loans (R108 825) is 29,2% of the overall amount and that for basic needs was 22,1% of the
overall total. See table 11 below.
TABLE11:RAND VALUE OF SMALL LOANS FOR DIFFERENT ACTIVITIES COMPARED TO THE TOTAL
AMOUNT
Agric ent
Basic needs
Education
House improve
Non-agric ent
Other
Grand
Total
Loan 1
32400
19500
29330
61800
3500
12500
159030
0
5
10
15
20
25
30
35
Loan 1
Loan 2
Loan 3
Loan 4
Loan 5

11
Loan 2
31700
25700
22500
33500
4100
12000
129500
Loan 3
13700
24300
13000
11025
800
3500
66259
Loan 4
800
8200
1000
9908
Loan 5
1500
4800
1500
7706
Total
R80100
R82500
R64830
R108 825
R8 400
R28000
R372 403
Total Agricultural Enterprise
Loans in Previous Cycle – 2013
21,5%
Total House improvements
Loans in Previous Cycle – 2013
29,2%
Total Basic Needs Loans in
Previous Cycle – 2013
22,1%
Total Education in Previous
Cycle – 2013
17,4%
Use of share-outs for agricultural enterprises
Share-out amounts for the last saving cycle (2013) ranged from R801-R21 000 for the 100 respondents. The
average amount for the respondents was R4 344, with the largest number of respondents, 17% receiving
between R2 001-R3000. 56% of respondents used some of their share-out money for their enterprises,
with a larger proportion of CIG members (58%) using share-out monies for their enterprises than non-CIG
members (47%).
TABLE12:USE OF SHARE-OUTS FROM SCGS FOR ENTERPRISES OFCIGAND NONCIG MEMBERS
RESPECTIVELY
Use some of your share-out money from the
previous cycle for your enterprise?
No
Yes
Total
CIG member
36
(58%) 49
85
non member
8
(47%) 7
15
Total
44
56
100
Of those that used share-out money towards agricultural enterprise, 49% spent between R1-R500. 32,5% used
between R501-R1000 and 7,5% used more than R1000. See Figure 8 below.
FIGURE 8:AMOUNT OF PREVIOUS CYCLE (2103)SHARE-OUTS SPENT ON AGRICULTURAL ENTERPRISES
(N=100)
I don't
know R 0
R1001
-
R1500
R1-
R200
R201-
R500
R3001
-
R4000
R501-
R1000
member 2 43 1 1410 2 13
non member15
0
10
20
30
40
50
No of respondents
Amount of previous share out spent on
agricultural enterprises

12
Use of other financial resources for agricultural enterprises
Respondents were also asked about their use of financial resources outside of their SCGs for agricultural
enterprises. Rural people often have a wide variety of income sourcesoutside of their ‘Main incomes’ (day labour,
some remittances even if not regular, small incomes from sales. etc) and this question is an attempt to get an
indication of the contribution of these other financial resources both to their overall income and to their agricultural
enterprises.
The table below indicates the amounts spent by respondents from other resources related to their expressed
average monthly income. The amounts spent from other financial resources is a yearly amount and thus incomes
have been expressed as yearly amounts for the purposes of this table.
TABLE13:RESPONDENTS’USE OF OTHER FINANCIAL RESOURCES FORTHEIR AGRICULTURAL
ENTERPRISES, RELATED TO THEIR AVERAGE YEARLY INCOME
Expenditure on Agric Enterprises
from Other Financial Resources
Employment
Other
Own
enterprise
activity
Remittances
Social
Grants
Grand
Total
>R72000
2
1
3
No other financial resources
1
1
2
R201-R500
1
1
Don't know
1
1
1
3
More than R2 000
1
1
No other financial resources
1
1
R1-R200
1
1
R12 001-R24 000
8
2
2
35
47
More than R2 000
2
2
No other financial resources
5
1
13
19
R1-R200
2
15
17
R201-R500
1
4
5
R501-R1 000
1
1
1
1
4
R1200-R 6 000
4
4
No other financial resources
1
1
R1-R200
1
1
R201-R500
2
2
R24 001-R36 000
3
1
1
14
19
No other financial resources
2
8
10
R1-R200
1
1
3
5
R201-R500
2
2
R501-R1 000
1
1
2
R36 001-R48 000
1
1
1
1
4
No other financial resources
1
1
2
R1 001-R2 000
1
1
R1-R200
1
1
R48 001-R72 000
1
1
2
No other financial resources
1
1
2
R6 001-R12 000
2
1
2
13
18
No other financial resources
1
2
7
10
R1 001-R2 000
1
1
R1-R200
1
4
5
R201-R500
1
1

13
Expenditure on Agric Enterprises
from Other Financial Resources
Employment
Other
Own
enterprise
activity
Remittances
Social
Grants
Grand
Total
R501-R1 000
1
1
Total
18
1
6
7
68
100
The table above can be conveniently summarised asfollows.
TABLE14:SUMMARYOF AVERAGE YEARLY INCOMES RELATED TO OTHER FINANCIAL RESOURCESUSED
FOR AGRICULTURAL ENTERPRISES IN MATATIELE
Avg yearly
income→
Other financial
resrouces↓
R1-R12
0000
(N=22)
R12 001-
R24000
(N=47)
R 24001-
R36 000(N=19)
R36000 –
R48
000(N=4)
>R48 001
(N=5)
% of overall
respondents
(N=97)
None
11/22 (50%)
19/47 (40%)
10/19 (53%)
2/4 (50%)
4/5 (80%)
47%
R1-R1000
10/22 (45%)
26/47 (55%)
9/19 (47%)
1/4(25%)
1/5 (20%)
48%
R1001-R2 000
1/22 (5%)
1/47 (2%)
1/4 (25%)
3%
>R2 000
2/47 (3%)
2%
This table indicates that around 53% of the respondents use other resources outside of their SCGs and main
incomes for their agricultural enterprises, across the five different ranges of income. Of these the largest proportion
(48%) use between R1-R1 000 per year.
The use of small loans and share-outs in SCGs was then linked to the use of other financial resources to get an
indication of overall expenditure by respondents on their agricultural enterprises. Respondents from all five of the
income groups mentioned above took loans of similar sizes. There was no trend for smaller loans, or fewer for that
matter, for respondents in the lower income groups, as might have been expected. From Table 15 below it can be
seen that 47% of respondents use only SCG loans for their agricultural enterprises and no other financial resources.
74% of the respondents who take SCG loans use between R1-R2 000 per year, 16% use between R2 001-R3000/
year and 10% use more than R3 000.
TABLE15:SUMMARY OF SCG LOANSUSED FOR AGRICULTURAL ENTERPRISES IN MATATIELE
Value of small loans taken – across all income
groups
Overall percentage of respondents
R1-R1 000
38%
R1 001-R2 000
36%
R2 001-R3 000
16%
R3 001-R4 000
7%
>R4 000
3%
Adding all the finances used for agricultural enterprises together the following averages can be calculated:
TABLE16:SUMMARYOF ALL EXPENDITURE RELATED TO AGRICULTURAL ENTERPRISES LINKED TO
AVERAGE YEARLY INCOME IN MATATIELE.
Financial source for Agricultural enterprises
Average in Rands

14
SCG loans (2013)
R1 500
Money from share out (2013)
R 750
Other financial resoruces
R1 000
Total average
R3250
Average monthly income
R1800
Average yearly income
R21 600
% of income spent on agricultural enterprises
15%
This means that people take out the same size loans even if their incomes are higher. This potentially relates to the
structure of the SCG and how shares are bought and loans provided. Overall participants spend an average of 15%
of their incomes on agricultural enterprises, across the five income groups specified.
Involvement in CIGs
Respondents were asked what activities they have been involved in through their CIGs. Mostly they mentioned the
learning sessions and meetings as shown in the small table below.
TABLE17:SPREAD OF CIGPARTICIPANTS ACROSS ACTIVITIES
Activities in CIGs
Implementation
1
Learning sessions
42
Marketing
1
Meetings
56
Total
100
They were also asked to describe new activities they have been involved in through their involvement with SaveAct
and with the CIGs. Here the research shows that respondents have tried out new ideas in their agricultural
enterprises through their meetings and learning sessions.
FIGURE 9NEW ACTIVITIES UNDERTAKEN THROUGH CIGSIN MATATIELE (N=40)
None
Savings
and
credit
Maize and
bean
productio
n:
Conserva
tion
Agricul…
Poultry
productio
n
Vegetable
productio
n
Potato
productio
n
Pig
productio
n
Sheep
productio
n
Disease
control in
cattle
Goats
Series1 2630198 6 3 3 1 1 1
0
5
10
15
20
25
30
35
No of people
New Activities involved in through CIGs

15
Participation in bulk buying
40 of the respondents interviewed participated in bulk buying. Respondents spent mostly between R1-R200 on bulk
buying, purchasing vegetable seedlings (19) and potato seed (13) through this system. Five respondents participated
in the poultry bulk buying process and three in buying breeding stock of sheep.
FIGURE 10:BULK BUYING ACTIVITIES INMATATIELE (N=40)
Improvement in business since involvement in CIGs
This question gives an indication of whether and how participants’ enterprises have improvedbecause of their
involvement in CIGs.29% of respondents felt that their inputs are now cheaper, 19% felt that production is better,
14% that they have gained knowledge and 5%felt that their incomes have improved. A small percentage have found
markets and have found inputs easier to access. 16% of respondents felt that their businesses have not improved.
FIGURE 11:BUSINESS IMPROVEMENT THROUGH INVOLVEMENT IN CIGS;MATATIELE (N=85)
R1-R200 R201-
R500
R501-
R1000
R1001-
R2000 >R2000
Seed Potato12 100
Vegetable Seedlings14 500
Poultry Package0 2 2 1
Breeding Stock02001
0
2
4
6
8
10
12
14
16
No of people
Bulk buying; Matatiele N=40
Has not
improved
16%
Income
improved
5%
Inputs
cheaper
29% Input
s
easier
to
acces
s
Knowledge
gained
14%
Markets
found
3%
Other
7%
Production
better
19%
Working
together
with
community
members
5%
Business improvement through
involvement in CIGs; Matatiele N=85

16
Present issues in enterprises and small business development
For the most part inputs are still the main problem for respondents, with 25% mentioning this as an issue.
Respondents wouldlike to be provided with inputs for free as part of projects. This was followed by the weather
(19%) and production factors (18%) such as poor soil fertility and lack of infrastructure. A small percentage of
respondents mentioned the need for markets (4%) and credit (3%).
18% of respondents mentioned that they have no issues and are satisfied with how their small businesses are going.
FIGURE 12:PRESENT BUSINESS ISSUES;MATATIELE (N=85)
Other issues mentioned consistently include a shortage of water, and pest problems on crops (such as cutworms
and moles). Issues such as diseases in chickens, animals eating crops, and lack of soil fertility were also mentioned, as
was the need for more information on goats and cattle. In terms of business related issues respondents mentioned
selling on credit and then running into trouble as people did not repay them, stock theft, late delivery of seedlings
and finding more people willing to be part of bulk buying activities.
Further support required/ requested
To get an indication of the most appropriate, needed and or desired interventions, respondents were asked what
further support they would need to effectively improve their agricultural enterprises. Table 18 below gives a
summary of their responses.
20% of respondents are satisfied with their present support. Most of the other respondents asked for more training
and information specifically in vegetable and poultry production. They also wanted training and support in water
harvesting and acquiringJo-Jo tanks (9%) and wanted to be provided with free agricultural inputs and infrastructure
(16%). There were also requests for easier access to day old chicks, herbicides and hand planters as well as support
for setting up bulk buying in their groups.
TABLE18:SUMMARYOF FURTHERSUPPORT REQUESTED BY RESPONDENTS IN MATATIELE.
Further support in:
No of responses
Satisfied with present support
20
Training and information in the following
Marketing and input supply
Poultry production
Vegetable production and pest control
Sheep rearing
Potato production
2
17
23
4
4
Credit
3%
Inputs
25%
Knowledge
1%
Market
4%
No issues
18%
Other
12%
Production
factors
18%
Weather
19%
Present business issues; Matatiele,N=85

17
Maize production
4
Water harvesting and Jo-Jo tanks
9
Agricultural support and inputs (free)
Fencing
Tractors
10
5
1
Easier access to
Day old chicks
Weed chemicals
Hand planters
3
4
2
Access to more credit
2
Follow up on enterprises
1
Bulk buying
5
Timely deliveries of seedlings
2
Isiqalo training
18 respondents receivedIsiqalo or business start-up training. 14 of the 18 filled in their business plans. Business plans
were filled in for the following commodities: maize (2) and vegetable production (7), poultry (6), sheep (2) and pigs
(1).
A question was also asked about the incomes respondents realised fromtheir enterprises. This was specifically for
respondents who received training and wrote out their business plans. There is no direct correlation between
respondents receiving Isiqalo training and doing theirbusiness plans, and them earning higher incomes from their
enterprises compared to other respondents participating in those enterprises. The range of incomes realised from
these small businesses are very similar to the incomes realised for all respondents involved in agricultural
enterprises.
More detailed follow up will need to be done on an individual basis to ascertain whether incomes and efficiency in
the small businesses have increased due to the training. Even then adirect correlation will be difficult due to other
factors that could have an impact, such as disease, weather, unfavourable market prices, etc.
FIGURE 13:ISIQALO TRAINING, BUSINESS PLANS AND INCOME FROM BUSINESS;MATATIELE (N=85)
-1 R 0R1001-
R1500
R1501-
R2000 R1-R200 R2501-
R3000
R501-
R1000
No Yes
Maize 1 1
Pigs 1
Poultry 2 1 12
Sheep 1 1
Vegetables 1 33
0
0.5
1
1.5
2
2.5
3
3.5
No of people
Isiqalo training, business plans and
income from business