
Learning Conservation Agriculture the Innovation Systems way
Grain-SA Smallholder Farmer Innovation Programme
Erna Kruger, Ngcobo P, Dlamini M and Smith H

CA-Farmer Innovation Programme
Key objectives and activities
Farmer-centred
Innovation
System
Awareness raising and
Access to Information
Incentives and
Market Based
Mechanisms
On-farm,
farmer-led
Research
Education
and Training
Farmers days,
symposiums, cross
visits, conferences,
popular articles
Subsidies, Village
Saving and Loan
Associations, farmer
centres, group based
access to equipment
and infrastructure
Farmer experimentation;
intercropping, crop
rotation, cover crops,
livestock integration.
Learning groups;
practical
demonstrations,
workshops, field
assessments
Stakeholder interaction,
partnerships, horizontal
and vertical scaling

CA Farmer led Trial summaries
Midlands
Bergville
EC, SKZN
Season
2017 2013
2014
2015 20162017
2013
2014
2015
2016
2017
No of villages
639 11 1718 410 88 13
No of trial participants
4228837321225923
16
43 5493
Area planted (trials)
-ha 1,362,87,2 5,913,517,4
0,36
0,3
0,37
1,18
3,58
Average yield maize (t/ha)
2,043,74 3,634,125,035,7
0,95
0,7
1,37
2,52
2,17
Min and max yield maize
(t/ha)
0,4-7,12-4,3 1-
6,7
0,6-7,4
0,3
-
11,7
0,5
-
12,2
0,3
-
1,7
0,3
-
1,8
0,5
-
4,4
1,1
-
5,2
0,2
-
6,7
Average yield beans (t/ha)
0,621,24 0,260,791,051,22
1,26
0,34
0,69
1,28
0,35
Trialsummaries over 5 seasons; Bergville,SKZN and EC
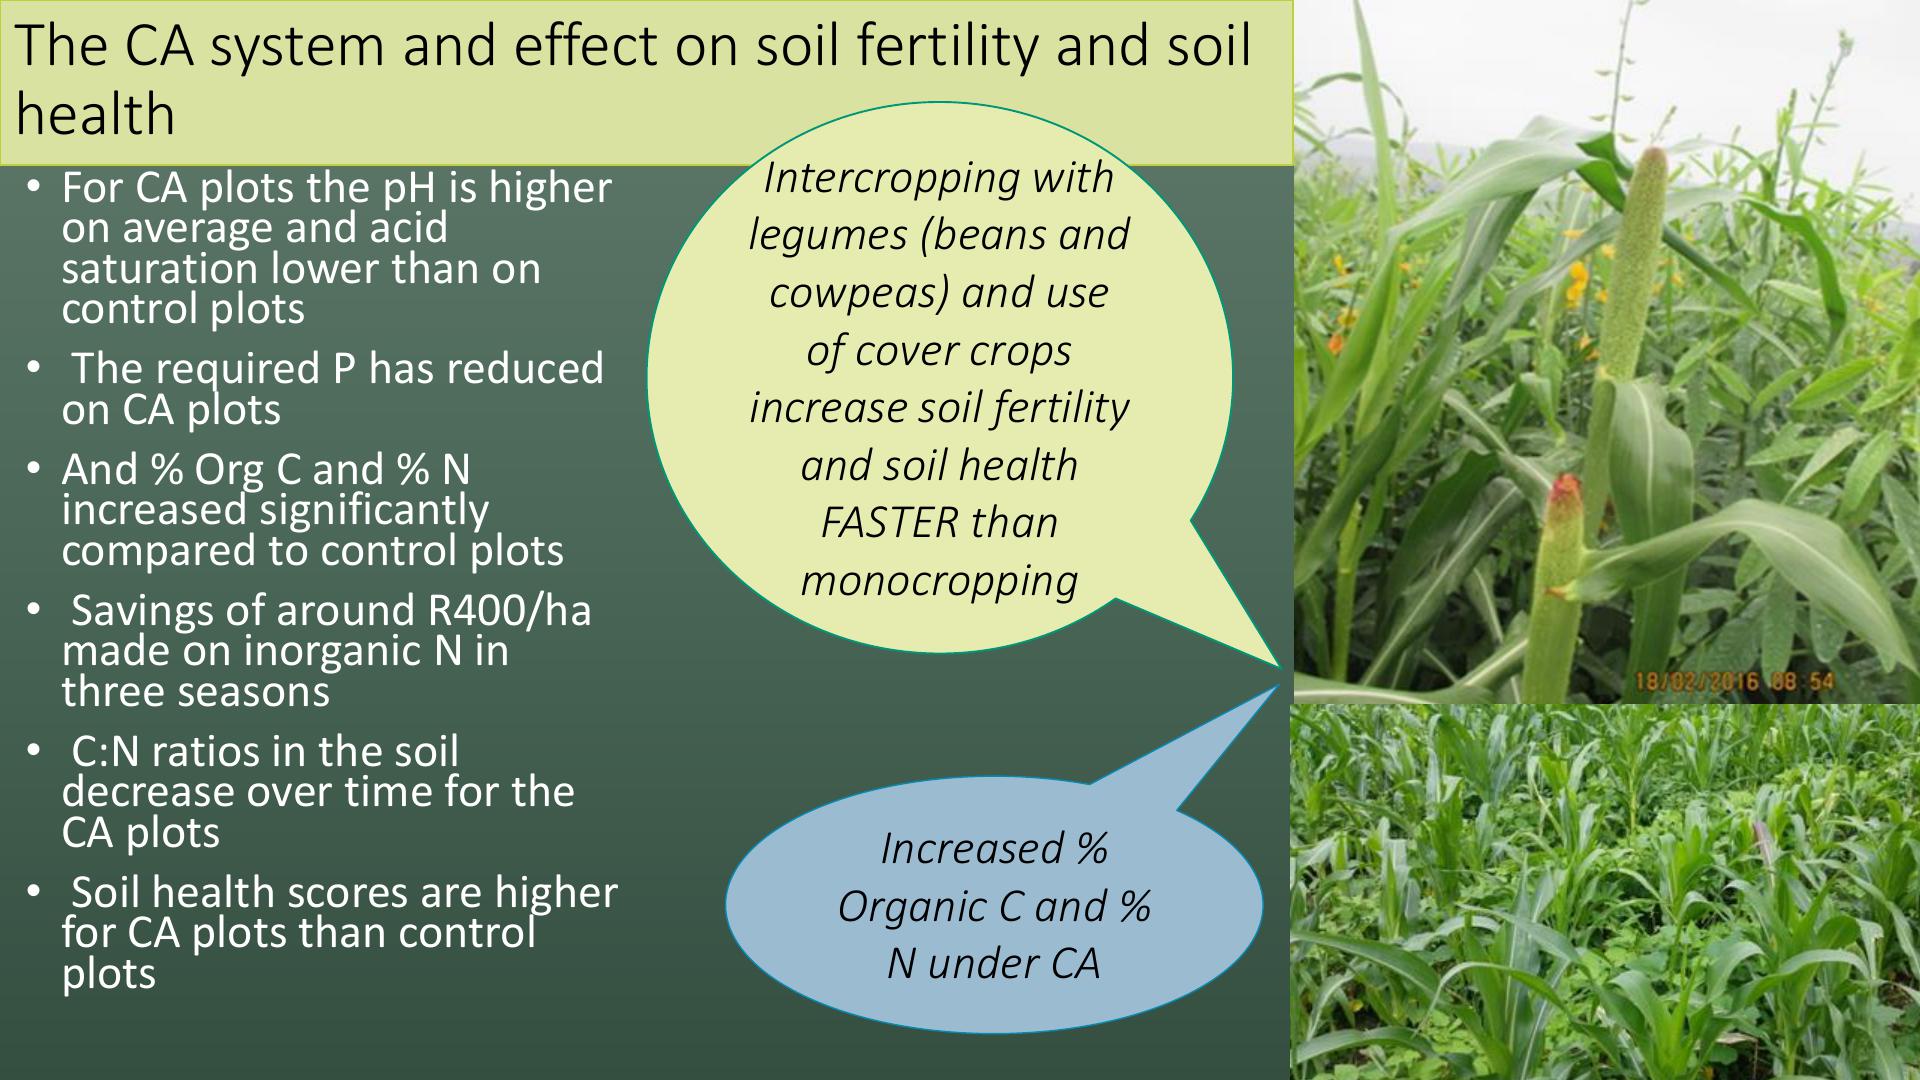
•For CA plots the pH is higher
on average and acid
saturation lower than on
control plots
•The required P has reduced
on CA plots
•And % Org C and % N
increased significantly
compared to control plots
•Savings of around R400/ha
made on inorganic N in
three seasons
•C:N ratios in the soil
decrease over time for the
CA plots
•Soil health scores are higher
for CA plots than control
plots
The CA system and effect on soil fertility and soil
health
Intercropping with
legumes (beans and
cowpeas) and use
of cover crops
increase soil fertility
and soil health
FASTER than
monocropping
Increased %
Organic C and %
N under CA

•Visual and quantitative indicators
•Visual Soil Assessments: soil cover, soil
structure, run-off, crusting,
earthworms, root size, soil porosity,
soil texture
•Measurements: infiltration, run-off
plots, weather stations
•Soil health analysis
Soil health; methods

•WEOC –sugars from root exudates,
plus organic matter degradation
•CO2–microbial activity/respiration
•WEON –Atmospheric N2sequestration
from free living N fixers, plus SOM
degradation
•C/N –Balance between WEOC and
WEON
•MAC% - efficiency of cycling of WEOC
(WEOC/CO2-C)
Soil health(SH) scoresCO2/10+WEOC/50
+WEON/10 =SH
score
Joining soil science and
ecology into a new
science of soil health
•Developed by Rick Haney –to
accommodate for and include the
organic fractions of nutrients in soil
sample analysis
•Recognising that soil health is a
dynamic process of cycling of nutrients,
microbial activity and degradation of
organic matter
•And the plant roots are active
participants in the cycling providing
carbonsugars as root exudates to
supply microbes with food

•C:N ratio is determined by soil chemical
properties and micro organisms present in
the soil.
•The lower this ratio is, the more organisms
are active and the more available the food is
to the plants. Good C:N ratios for plant
growth are <15:1.
•You can have a low or optimum C:N
(WEOC/WEON) within a range of values of
available organic carbon in the soil. (WEOC)
•If this value is low, it will reflect in the C02
evolution, which will also be low. So less
organic carbon means less respiration from
microorganisms, but again this relationship is
unlikely to be linear.
•The Microbially Active Carbon (MAC = WEOC
/ ppm CO2) content is an expression of this
relationship. If the percentage MAC is low, it
means that nutrient cycling will also be low.
One needs a %MAC of at least 20% for
efficient nutrient cycling.
•The SH score ranges between 0-50. the scale
is generally 0-3; 3-7; 7-15; 15-25; 25-50
Test results
ppmCO2-C
N-Mineralisation Potential
Biomass
>100
High-N potential soil. Likely
sufficient N for most crops
Soil very well supplied with organic
matter. Biomass>2500ppm
61-100
Moderately-high. This soil has
limited need for supplemental N
Ideal state of biological activity and
adequate organic matter
31-60
Moderate. Supplemental N
required
Requires new applications of stable
organic matter. Biomass<1,200ppm
6-30
Moderate-low. Will not provide
sufficient N for most crops
Low in organic structure and microbial
activity. Biomass<500ppm
0-5
Little biological activity; requires
significant fertilization
Very inactive soil. Biomass<100ppm.
Consider long-term care
What the values meanCONVENTIONAL SYSTEM: Mostly
decomposerfungi –small hyphal
networks, NB forsoil fertility, minor
role in carbon storage
CA SYTEM: Mostly Mycorrhizal fungi
–large hyphal networks, major role
in carbon storage
Mycorrhizal fungi get their
energy in a liquid form, as soluble
carbon directly from actively
growing plants. They access and
transport water- plus nutrients
such as phosphorus, nitrogen and
zinc - in exchange for carbon from
plants.
Soluble carbon is also channelled
into soil aggregates via the
hyphae of mycorrhizal fungi and
can undergo humification, a
process in which simple sugars
are made up into highly complex
carbon polymers.
Below: Mycorrhizal fungi grow very closely
associated with plant roots and create
networks of filaments (hyphae) within the soil)

Reserve Organic, 0
Release from Orga,
19.40
NO3, 1.10
NH4, 10.40
Total Inorganic, 11.5
Distribution of the Nitrogen components ppm
Reserve Organic, 7.4
Release from Orga,
1.00
NO3, 83.20
NH4, 2.80
Total Inorganic, 86
Distribution of the Nitrogen components ppm
BIOLOGICAL ANALYSES
Sample #
SOLVITA
CO2 Burst
WATER EXTRACT
C/N
Soil
Health
Calculatio
n (Index)
Commen
t
CO2 -
C,
ppm C
Organic C
ppm C
Organic N
ppm N
ENZV 206.1379 19.419.5 24.2
Excellent
BIOLOGICAL ANALYSES
Sample #
SOLVITA
CO2 Burst
WATER EXTRACT
C/N
Soil
Health
Calculatio
n (Index)
Commen
t
CO2 -
C,
ppm C
Organic C
ppm C
Organic N
ppm N
7.1 129 8.415.4 2.6
Soil Organic Matter
% 6.2
Microbial Active C (MAC)
%54.4
Soil Organic Matter
% 1.3
Microbial Active C (MAC)
%5.5
Comparing the nitrogen profile of natural “veld” with an intensively chemically farmed plot.

Comparing the nitrogen profile of natural “veld” with CA diverse cropped plot; Bergville, 2016/17.
BIOLOGICAL ANALYSES
Sample #
SOLVITA
CO2 Burst
WATER EXTRACT
C/N
Soil
Health
Calculatio
n (Index)
Commen
t
CO2 -
C,
ppm C
Organic C
ppm C
Organic N
ppm N
EPHV 81,6326 18,417,716,5
Excellent
Reserve Organic, 0
Release from
Orga, 18.40
NO3, 0.30
NH4, 2.70
Total Inorganic, 3
Distribution of the Nitrogen components ppm:
Veld (P Hlongwane)
Soil Organic Matter
% 4
Microbial Active C (MAC)
%25
Reserve Organic,
4.2
Release from Orga,
21.20
NO3, 12.90
NH4, 4.30
Total Inorganic,
17.2
Distribution of the Nitrogen components ppm;
Maize + Cowpea intercrop (P Hlongwane)
BIOLOGICAL ANALYSES
Sample #
SOLVITA
CO2 Burst
WATER EXTRACT
C/N
Soil
Health
Calculatio
n (Index)
Commen
t
CO2 -
C,
ppm C
Organic C
ppm C
Organic N
ppm N
EPHMCP
61,829625,4 11,7 14,6
Excellent
Soil Organic Matter
%3,3
Microbial Active C (MAC)
%20,9

Comparing the nitrogen profile of Mono-cropped Maizewith CA diversecropped plot; Bergville, 2016/17.
Reserve Organic,
4.2
Release from Orga,
21.20
NO3, 12.90
NH4, 4.30
Total Inorganic,
17.2
Distribution of the Nitrogen components ppm;
Maize + Cowpea intercrop (P Hlongwane)
BIOLOGICAL ANALYSES
Sample #
SOLVITA
CO2 Burst
WATER EXTRACT
C/N
Soil
Health
Calculatio
n (Index)
Commen
t
CO2 -
C,
ppm C
Organic C
ppm C
Organic N
ppm N
EPHMCP
61,8296 25,411,714,6
Excellent
Soil Organic Matter
%3,3
Microbial Active C (MAC)
%20,9
Reserve Organic,
1.5
Release from
Orga, 21.70 NO3, 16.10
NH4, 2.30
Total Inorganic,
18.4
Distribution of the Nitrogen components ppm;
CA Maize control (P Hlongwane)
BIOLOGICAL ANALYSES
Sample #
SOLVITA
CO2 Burst
WATER EXTRACT
C/N
Soil
Health
Calculatio
n (Index)
Comme
nt
CO2 -
C,
ppm C
Organic C
ppm C
Organic N
ppm N
EPHC 59,6254 23,210,913,4
Excellent
Soil Organic Matter
% 3
Microbial Active C (MAC)
%23,5

•4-5 years: Reduced need for herbicide -no spraying on trial
plots this season
•Increased organic matter, reduced fertilizer requirements -
No basal fertilizer applied- only top dressing
•Reduced runoff
•Increased yields and diversity
Bergville: Case studyMphumelele Hlongwane- Ezibomvini

t/ha
2016
2017
Maize (Control)
-CA
7,8
9,7
Maize Trial CA
- combined
6,93
8,3
Beans
0,25
1,81
Sunflower
0,3
0,8
•EXPERIMENTS: Inter- cropping, crop
rotation, legumes, SCC, WCC
•Runoff plots: CA (1,1mm/event) vs
Conventional control (3,1mm/event)
•Infiltration: CA (247mm/hr) vs Control
(50mm/hr)
•Soil health 2016, 2017:
•Build-up of organic soil carbon and nitrogen in
the trial, with more microbially available carbon
and thus a much higher soil health score.
•Lower C:N ratios in CA plots (CCs and legumes
•AGGREGATE STABILITY: CA (43%-55%) CA
Control (33%) -higher aggregate stability for
the plots with crop diversification- highest for
inclusion of SCC mixes andLab-Lab
•% OM: CA average (3 ,47%), Veld Baseline
(2,5%) –accumulation of organic matter in CA
plots- now higher than veld baseline benchmark
(10)
M + B
(5)
LL
Control plot
(8)
M + B
(6)
M +LL
(3) M + SCC
+WCC
Contro
l plot
(9)
M + CP
(7)
M + CP
(4)
M + B
(2)Sunn
hemp,
millet and
sunflower
(1)
M + B
Legend: M –Maize; B –Beans; CP –Cowpea; LL –Lab Lab; SCC –summer cover crop WCC –
winter cover crop
Bergville: Case study-continued

4 Participants over 3 seasons-
crop diversity (intercropping and
cover crops) and crop rotation to
a lesser extent. AVERAGE FOR ALL
TRIAL PLOTS SHOWN
•The Organic Carbon content
has INCREASED for all 4
participants
•The Organic Nitrogen content
has INCREASED for all 4
participants
•C:N ratios have decreased for
Phumelele Hlongwane only –as
she has most coherently
implemented the diverse
cropping and crop rotation
process (including legumes).
•Soil health scores have
increased significantly between
2016 to 2017
Soil health Test results: 3 seasons 2015-2017

Average values of
different cropping
options across three
seasons for 9
participants
•If one compares
single crops (maize
only) to the mixed
crop options
(intercrops and cover
crops) then
-Organic Carbon and
Organic Nitrogen are
HIGHER
-C:N ratios are LOWER
-Soil health scores are
HIGHER
for all the mixed
cropping options - except
for maize and bean
intercrop option
Soil health Test results: Different Cropping options 2015-2017

•3-4 years: Animal drawn traction –larger plot –very sandy
, extremely low organic matter (0,6%).
•Germination, growth and yields have increased –albeit
slowly; Maize 0,78-1,4t/ha, beans stable at 0,16t/ha
•Increased diversity –legumes and cover crops
•Reduced run-off and erosion
•Reduced weeds
•Increased soil health
Eastern Cape: Matatiele Case study Tsoloane Mapheele–Khutsong- Matatiele

•EXPERIMENTS: single crops, Inter-cropping,
legumes, SCC, WCC, Lucerne
•Soil health 2016-2017:
•Reduction in C:N ratio and increase in organic N in his intercropped
trial plots as compared to his Maize only control plot, indicating an
increase in soil health.
•Soil health scores for the trial plots are higher than the control
plots, but still below average given the extremely sandy and
infertile soils he is working on.
Case study continued
Cont (M)TrialveldTrial
2016 2017
Average of %OM0.6 0.710.6
Average of CO2 - C, ppm C16.8 14.6 19.2 14.6
Average of Organic C ppm C118 116 14573
Average of Organic N ppm N7.58.5 12.4 12.1
Average of C:N ratio15.7 13.6 11.76.0
Average of Soil health Calculation3.0 3.1 4.3 4.0
0
20
40
60
80
100
120
140
160
Indicators
Soil Health Indicators Tsoalone Mapheele; 2016-2017

•In Matatiele (EC) soils are generally poor and veld
benchmark values tend to be lower than the CA trial
values
•The increasein available nitrogen (2016-2017)
amounts to an average Rand value of about R150
more than the veld samples. This indicates a
potential saving on bought fertilizer of around 14%
•In addition Immediate release N has increased
substantially over the veld bench mark values and is
higher for 2017; indicating a cropping pattern under
the CA trialsthat builds organic nitrogen in the soil.
•In Bergville the picture is a bit different. Soils are
good and veld benchmarks are high –excellent
•Here only the trials in Ezibomvini have higher total
Nitrogen amounts than the veld. The Rand value of
available organic N here is R64 more than the veld
benchmark, indicating a potential saving on bought
fertilizer of around 6%.
Nutrient cycling- Nitrogen; Comparison EC and Bgvl
2016 2017 2016 2016 2017 2016 2016 2017 2016
Trial Veld Trial Veld Trial Veld
KhutsongNkau Sehutlong
Average of N(kg/ha) Total21584151 308 422 280 325 378 280
Average of R value of Org
N103 243 175 263 353 129 162 24384
Average of N Immediate
release 622 10 16 31810 225
0
50
100
150
200
250
300
350
400
450
Matatiele; Nitrogen 2016- 2017

•Intercropping and use of
cover crops is very
important for building soil
fertility and soil health
•Crop rotation aids in
stabilising high soil health
scores over time
•The more crops you use
and rotate the better
•Having legumes in the mix
speeds up the process
Soil Health Summary
Crop diversity is
crucial
Crop rotation in
combination with
crop diversity
supports this
process
Lab-Lab and SCC
provide for very
high organic C
and N values
Lower C:N ratios are
found in crop mixes
that contain legumes
–cowpeas, Lab-Lab