
Grain-SASmallholderfarmerinnovationprogramme
Optimising the ConservationAgriculturesystemfor non-commercial and
semi-commercial smallholders 2013-2017

ErnaKruger,MazwiDlamini,SylvesterSelala, ThabaniMadondo,PhumzileNgcobo
Newstaffmember:TemakholoMathebula
Interns:KhethiweMthethwa,NonKanyisoZondiandSandlieMadlala
17 villages, 11 Savings and credit
groups, 10 Local facilitators,2 farmer
centres
Matatiele; 4 villages, 3 savings and
credit groups, 1 Local facilitator
Ixopo: 4 villages, 4 Local facilitators
Creighton and Umzimkhulu
Nkandla, Cornfields, Emhlopeni
New study
area: EC and
Southern KZN-
70
Smallholders-CA study areas and team
New study
area: KZN
Midlands- 32
Study area:
Bergville –263

Socio-economicsituation-Bgvl
65%of participants are female. -increase in no of
male participants over time
Average hh size is 5
Ages range from 18 to >70 years. Around 60% of
participants are between 36-55 yearsof age
Income sources are social grants (72%),
employment (11%) and farming(10%)
Overall incomes per household are extremely low,
with 75% of households earning between R0-
R2000/month. The remaining 25% earn >R3 000
/month. The average income is R1875/hh/month
–a reduction from last year which was around
R2450/hh/month
Maize and beans used for hh food supply; 53% of
participants now enough for 7-12months,
increased from around 33% last season
Child support
grant
55%
Pension
17%
Employment
11%
Remittances
7%
Farming
10%
SOURCES OF INCOME
1-3months
8%
4-6months
39%
7-9months
38%
10-12months
15%
HOUSEHOLDFOOD SUPPLYTHROUGH CA

Partnership: MDF, KZN DARD, Lima RDF, SiyazisizaTrust,KwaNalu,
StratAct, Ubuhlebezweand Mtshezi Municipality
Villages savings and loans assocationsand organised farmers
organisations and cooperatives to work within the whole value
chain; inputs- production- storage- marketing.
Horizontal scaling model starting with a nodal village in each area
and expanding within and between villages:
2013: 3 Villages EC and 3 in Bergville (total trial participants: 50)
2014: 7 villages EC, 9 villages Bergville (Total trial participants:
100)
2015: 8 villages EC, 10 Bergville, 2 Nkandla (total trial
participants: 210)
2016: 8 Villages EC; 2 Midlands, 17 Bergville
Local capacity - Farmer volunteers, local facilitators, farmer
centres (for each node surrounded by 3-5 villages close by for
equipment and input provision awaproduction advice)
Description of Model and Process

Awareness raising events and farmers days spread across the regions
and including many different stakeholders; research , government and
agribusiness included
Presentationsat conferences, papers, book chapters,
Farmer experimentationlinked to largerlearning groups using the
Farmer Field School approach. People work together in teams, belong
to savings groups, do bulk buying and support each other with food
and marketing
Awareness raising and community learning

Farmerlevelexperimentation
Year1: Predefined with theresearch team:
Choice of planting method; hand hoes, hand planters, animal
drawn planters
Year2: Choicesand options withinthe same overall design:
Different varieties maize (white yellow, OPV, hybrid)
Different varieties and types of legumes
Early planting
Manure and fertilizer combinations
Targeted fertility regimes and pest control measures
Year3 +: Own designof experiments by participants:
Intercropping vs crop rotation options
Summer and winter cover crops
Mulching
Organic options
Different herbicide and pesticide spray regimes
Different planting times
As wellas options for year 2.
Incremental change in yr 1,2,3

Minimal soil disturbance
Soil cover
Diversity
Clockwise: Animal drawn no till
planter. ‘Weeding
wheel’.Matraccajab planter,
MBLI planter
Below: Planters
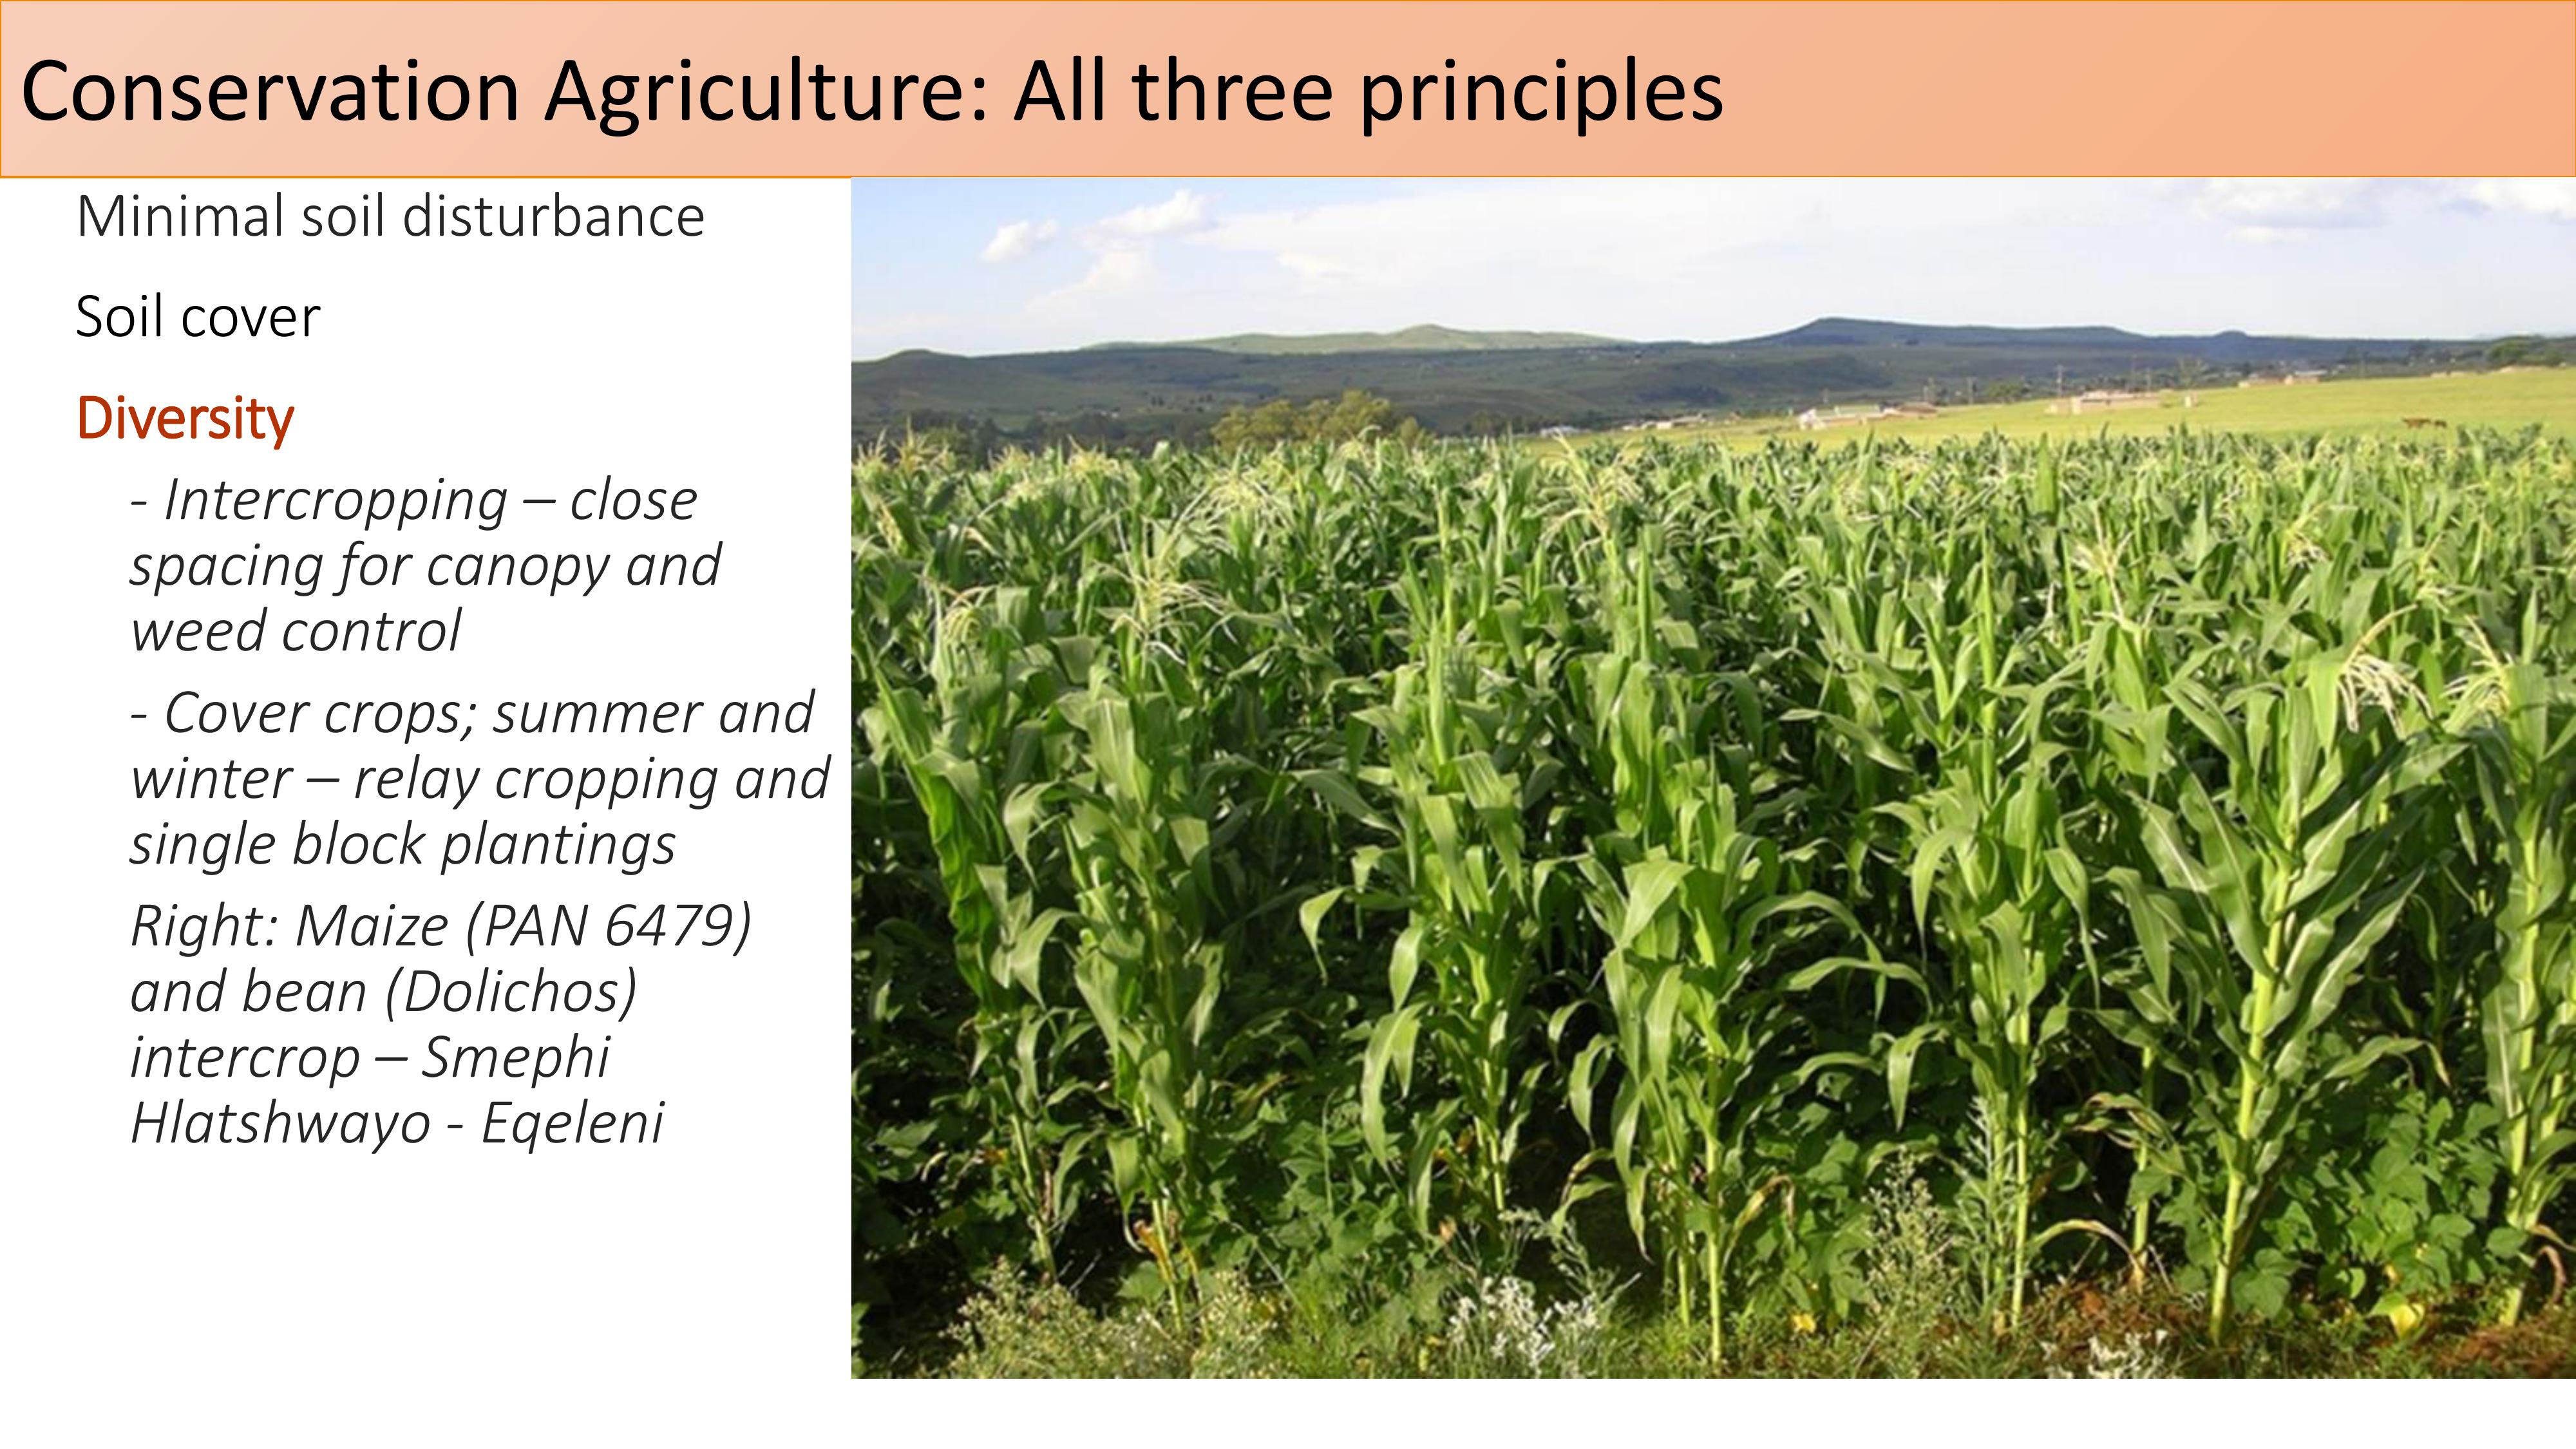
Conservation Agriculture: All three principles

Soil cover
Below: A 3year old CA plot with developing cover Far right: A ploughed
plot with no soil cover
Left: Assessing soil cover, Mulching…..
Conservation Agriculture: All three principles
Runoff muddy (195mm)
Runoff clear (42mm)
Minimal soil disturbance
Soil cover
Diversity
- Intercropping –close
spacing for canopy and
weed control
- Cover crops; summer and
winter –relay cropping and
single block plantings
Right: Maize (PAN 6479)
and bean (Dolichos)
intercrop –Smephi
Hlatshwayo -Eqeleni
Conservation Agriculture: All three principles

•Pre-spray with post emergent and contact herbicides (Round Up
and Gramoxone). Include pre-emergent herbicide such as Dual
Gold for grasses such as nutsedge
•Close spacing of tramlines: 50x50 maize, 25x10 beans
•One weeding is enough before canopy cover is reached. Must be
early weeding: 2-3 weeks.
•Cover is reached from 4-5 weeks onwards.
Intercropping and close spacing

PAN53intercropwithPAN148orUkulinga
PAN 53 –Not yet
tasselling- medium
season well adapted to
Bergville conditions
PAN 148: good cover
less dense -
Ukulinga: A bit more
rust more semi
determinate –more
volume
Mr Khulekani Dladla, Stulwane,

To ensure soil organic
matter build up
Improve soil fertility
Improved soil structure and
soil health
Reduce prevalence and
types of weeds
Management of pests and
disease
incidence and severity
Summer and wintermixes
used in relay and separately
Covercropmixes;summerandwinter
Mrs Phumelele Hongwane, scc, Ezibomvini.
Bergville
Mr TsoloaneMapheele, Khutsong,
Matatiele.

Trial summaries
Bergville
EC, SKZN
Season
2013
2014
2015
2016
2013
2014
2015
2016
No of villages
3
9
11
17
4
10
8
8
No of trial participants
28
83
73
212
23
16
43
54
Areaplanted (trials)
-
ha
2,8
7,2
5,9
13,5
0,36
0,3
0,37
1,18
Averageyield maize
(t/ha)
3,74
3,63
4,12
5,03 (3,09)
0,95
0,7
1,37
2,52
Min and max yield
maize (t/ha)
2-
4,3
1-
6,7
0,6-
7,4
0,3-
11,7
0,3-
1,7
0,3-
1,8
0,5-
4,4
1,1-
5,2
Actual amount of maize
pp
233kg
576kg
654kg
487kg
15kg
64kg
125kg
161kg
Rand replacement value
(maizemeal)
R 1 600
R 4 500
R5 500
R4 900
R103
R 500
R1 000
R1 700
Averageyield beans
(t/ha)
1,24
0,26
0,79
1,05
1,26
0,34
0,69
1,28
Trial summaries over 4 seasons; Bergville,SKZN and EC

Control averagetrial average
Average of pH3,75 4,06
Average of Acid sat (%)33,56 28,33
Average of P req
(Kg/ha) 37,50 29,44
Average of Lime req
(t/ha) 6,00 4,03
Average of Org. C %2,39 2,43
Average of N %0,14 0,15
0,00
5,00
10,00
15,00
20,00
25,00
30,00
35,00
40,00
Stulwane,2016: Soil fertility averages for control and
trial plots
•Soil samples taken for all participants when
they start; fertilizer and liming
recommendations made
•Comparison in later years to see changes
•For CA plots the pH is higher on average and
acid saturation lower than on control plots
•The required P has reduced on CA plots
•And % Org C and % N increased slightly
compared to control plots
Soil fertility results and changes over time
CA reduced the
need for fertilizer
application over
time as compared
to conventional
tillage Increased %
Organic C and
% N under CA

0,0
20,0
40,0
60,0
80,0
100,0
120,0
140,0
160,0
180,0
200,0
Bulelwa Dzinga
Dlezakhe Hlongwane
Khonzaphi Hlongwane
Mamolekeng Lebeoua
Mtholeni Dlamini
Smephi Hlatshwayo
Matsepo Futo
Simon Tsoloane
Bulelwa Dzinga
Mamolekeng Lebeoua
Matsepo Futo
Simon Tsoloane
Mtholeni Dlamini
CA intercropCA intercrop with
cc
Control Veld
baseline
Comparison of Solivata test results and soil health scores across two years
Average of CO2 - C, ppm C (yr1)
Average of Soil health Calculation (yr 1)
Average of CO2 - C, ppm C (yr2)
Average of Soil health Calculation (yr2)
•All the Solvitatest results and the Soil Health Scores-for Control plots, CA trials and Veld baselines-
were substantially higher in the first season than the second.
•Solvitatest results and Soil Health Scores are much higher for the CA trial plots than the control
plots –for both seasons
•It works well to compare practices against each other in one season but not that well to compare
across seasons- due to the variability brought about by weather conditions
Soil health Test results: 2 seasons 2014-2015, 2015-2016

Average Maize price 2017:
R2 500/ton
Break even yield:
3,9 t/ha
Average yield:
1,4 - 4,2t/ha
Average price sugar beans;
R8 000/ton
Average yield 0,8-1t/ha
Costs of inputs
What does this
mean??
CONSERVATION AGRICULTURE PLOTS, KZN 2016
-2017
0.1= Ha PLOTS
Events
CostCosts (1ha)-2015Costs (1ha) –2016
INPUTS
ha
lit / kg
( R / kg,l)
Seeds
-
maize (PAN 6479)
0,075
25
1
104
R 195,00
R 216,45
Seeds
- drybeans
(PAN 148
or
Gadra)
0,05
75
1
42,6
R 159,75
R 177,32
Fertilizer MAP
0,1
250
1
9,2
R 230,00
R 255,30
Fertilizer LAN
0,1
150
1
5
R 75,00
R 83,25
Lime
0,1
1000
1
1
R 100,00
R 111,00
Pesticides (
Decis Forte)
0,1
0,1
3
875
R 26,25
R 29,14
Herbicides: Roundup
0,1
3
2
109
R 65,40
R 72,59
Herbicides: Dual Gold
0,1
1,2
1
250
R 30,00
R 33,30
Summit/surfactant
0,1
0,2
1
296
R 5,92
R 6,57
Input costs per 0.1 ha
R 887,32
R 984,93
Input costs per 1 ha
R 8 873,20
R 9 849,25
We need more
than 4 tons/ha
maize to make a
profit

Biggest cost is fertilizer…. Even when micro-dosing
Need ways to reduce fertilizer needs
The next cost is seed (Here Hybrid, plus legume)
Carefully weigh up different seed types against other costs and yields.
Labour costs for weeding; ~R250/0,1ha (R50pppd x 5days), ploughing
~R500/0,1ha
Compare these prices (herbicides and pesticides)with ploughing and labour for weeding
O,1ha cost summaries
SEEDPRICES
25kg
Pesticides, herbicides
R 141,60
OPV
R 400,00
Fertilizers
R 449,55
Hybrid(generic)
R 1 150,00
Seed
R 393,77
GM
R 2 700,00
Cost summaries; How to deal with rising costs
Not ploughing
saves a lot of
money,
Seed costs
need to be
weighed
against yield
increase
Reduce
fertilizer and
chemical use
to a minimum
Ways to
improve soil
health

VillageSavingsandloanassociations(VSLAs)
Around 15 VSLAs established across a total
of 26 villages where CA is being
implemented; so roughly 61%
Savings are for consumption smoothing,
household expenses and saving for inputs
(28%)
Overall savings is R100-R500 per person
per month.
Notwithstanding these very low incomes
participants save for inputs. Generally
these savings amount to around 10-15% of
their income
Savings groups
(inputs) Yes
28%
Savings groups
(inputs) No
72%
MEMBERS SAVING FOR INPUTS
R0-R1000
78%
R1001- R2000
R2001-R 3000
11%
R 3001-over
11%
AMOUNT SAVEDFOR INPUTS
No.
Name of Village
Name of Group
No. Of
Members
Years
active
Total monthly
saving
Total Monthly
Repayments
Total monthly
loans
Cumulative No. of
shares (3-6months)
CREIGHTON
1
Madzikane
Masibambane
15
1
R5,000.00
R10,280.00
R4,440.00
R18,800.00
NKANDLA
2
Nkandla
Maphotho
21
2
R1,900.00
R0.00
R16,200.00
R13,300.00
BERGVILLE
3
Ezibomvini
eZibomvini
23
2
R5,300.00
R3,020.00
R0.00
R38,500.00
4
Ezibomvini
Ukuzama
10
1
R16,300.00
R2,950.00
R4,330.00
R18,500.00
5
Eqeleni
Masithuthuke
20
4
R3,700.00
R2,840.00
R4,000.00
R31,400.00
6
Eqeleni
Masibambane
25
3
R5,700.00
R3,050.00
R6,000.00
R40,800.00
7
Stulwane
uMntwana
40
4
R7,700.00
R7,330.00
R6,600.00
R48,400.00
8
Mhlathuze
Siyaphambili
17
1
R2,600.00
R2,990.00
R5,500.00
R13,500.00
9
Acton Homes
Siyazama
20
1
R4,500.00
R11,085.00
R13,700.00
R8,400.00
10
Bethany
Gudlintaba
19
1
R2,600.00
R5,140.00
R2,500.00
R19,500.00
11
Bethany
Amangwe
19
1
R6,000.00
R8,380.00
R4,100.00
R25,200.00
12
Ndunwana
Phelandaba
20
1
R2,000.00
R0.00
R2,940.00
R15,500.00
13
Ngoba
Sakhokuhle
21
1
R4,000.00
R3,345.00
R8,800.00
R0.00
TOTAL
270
R67,300.00
R60,410.00
R79,110.00
R291,800.00
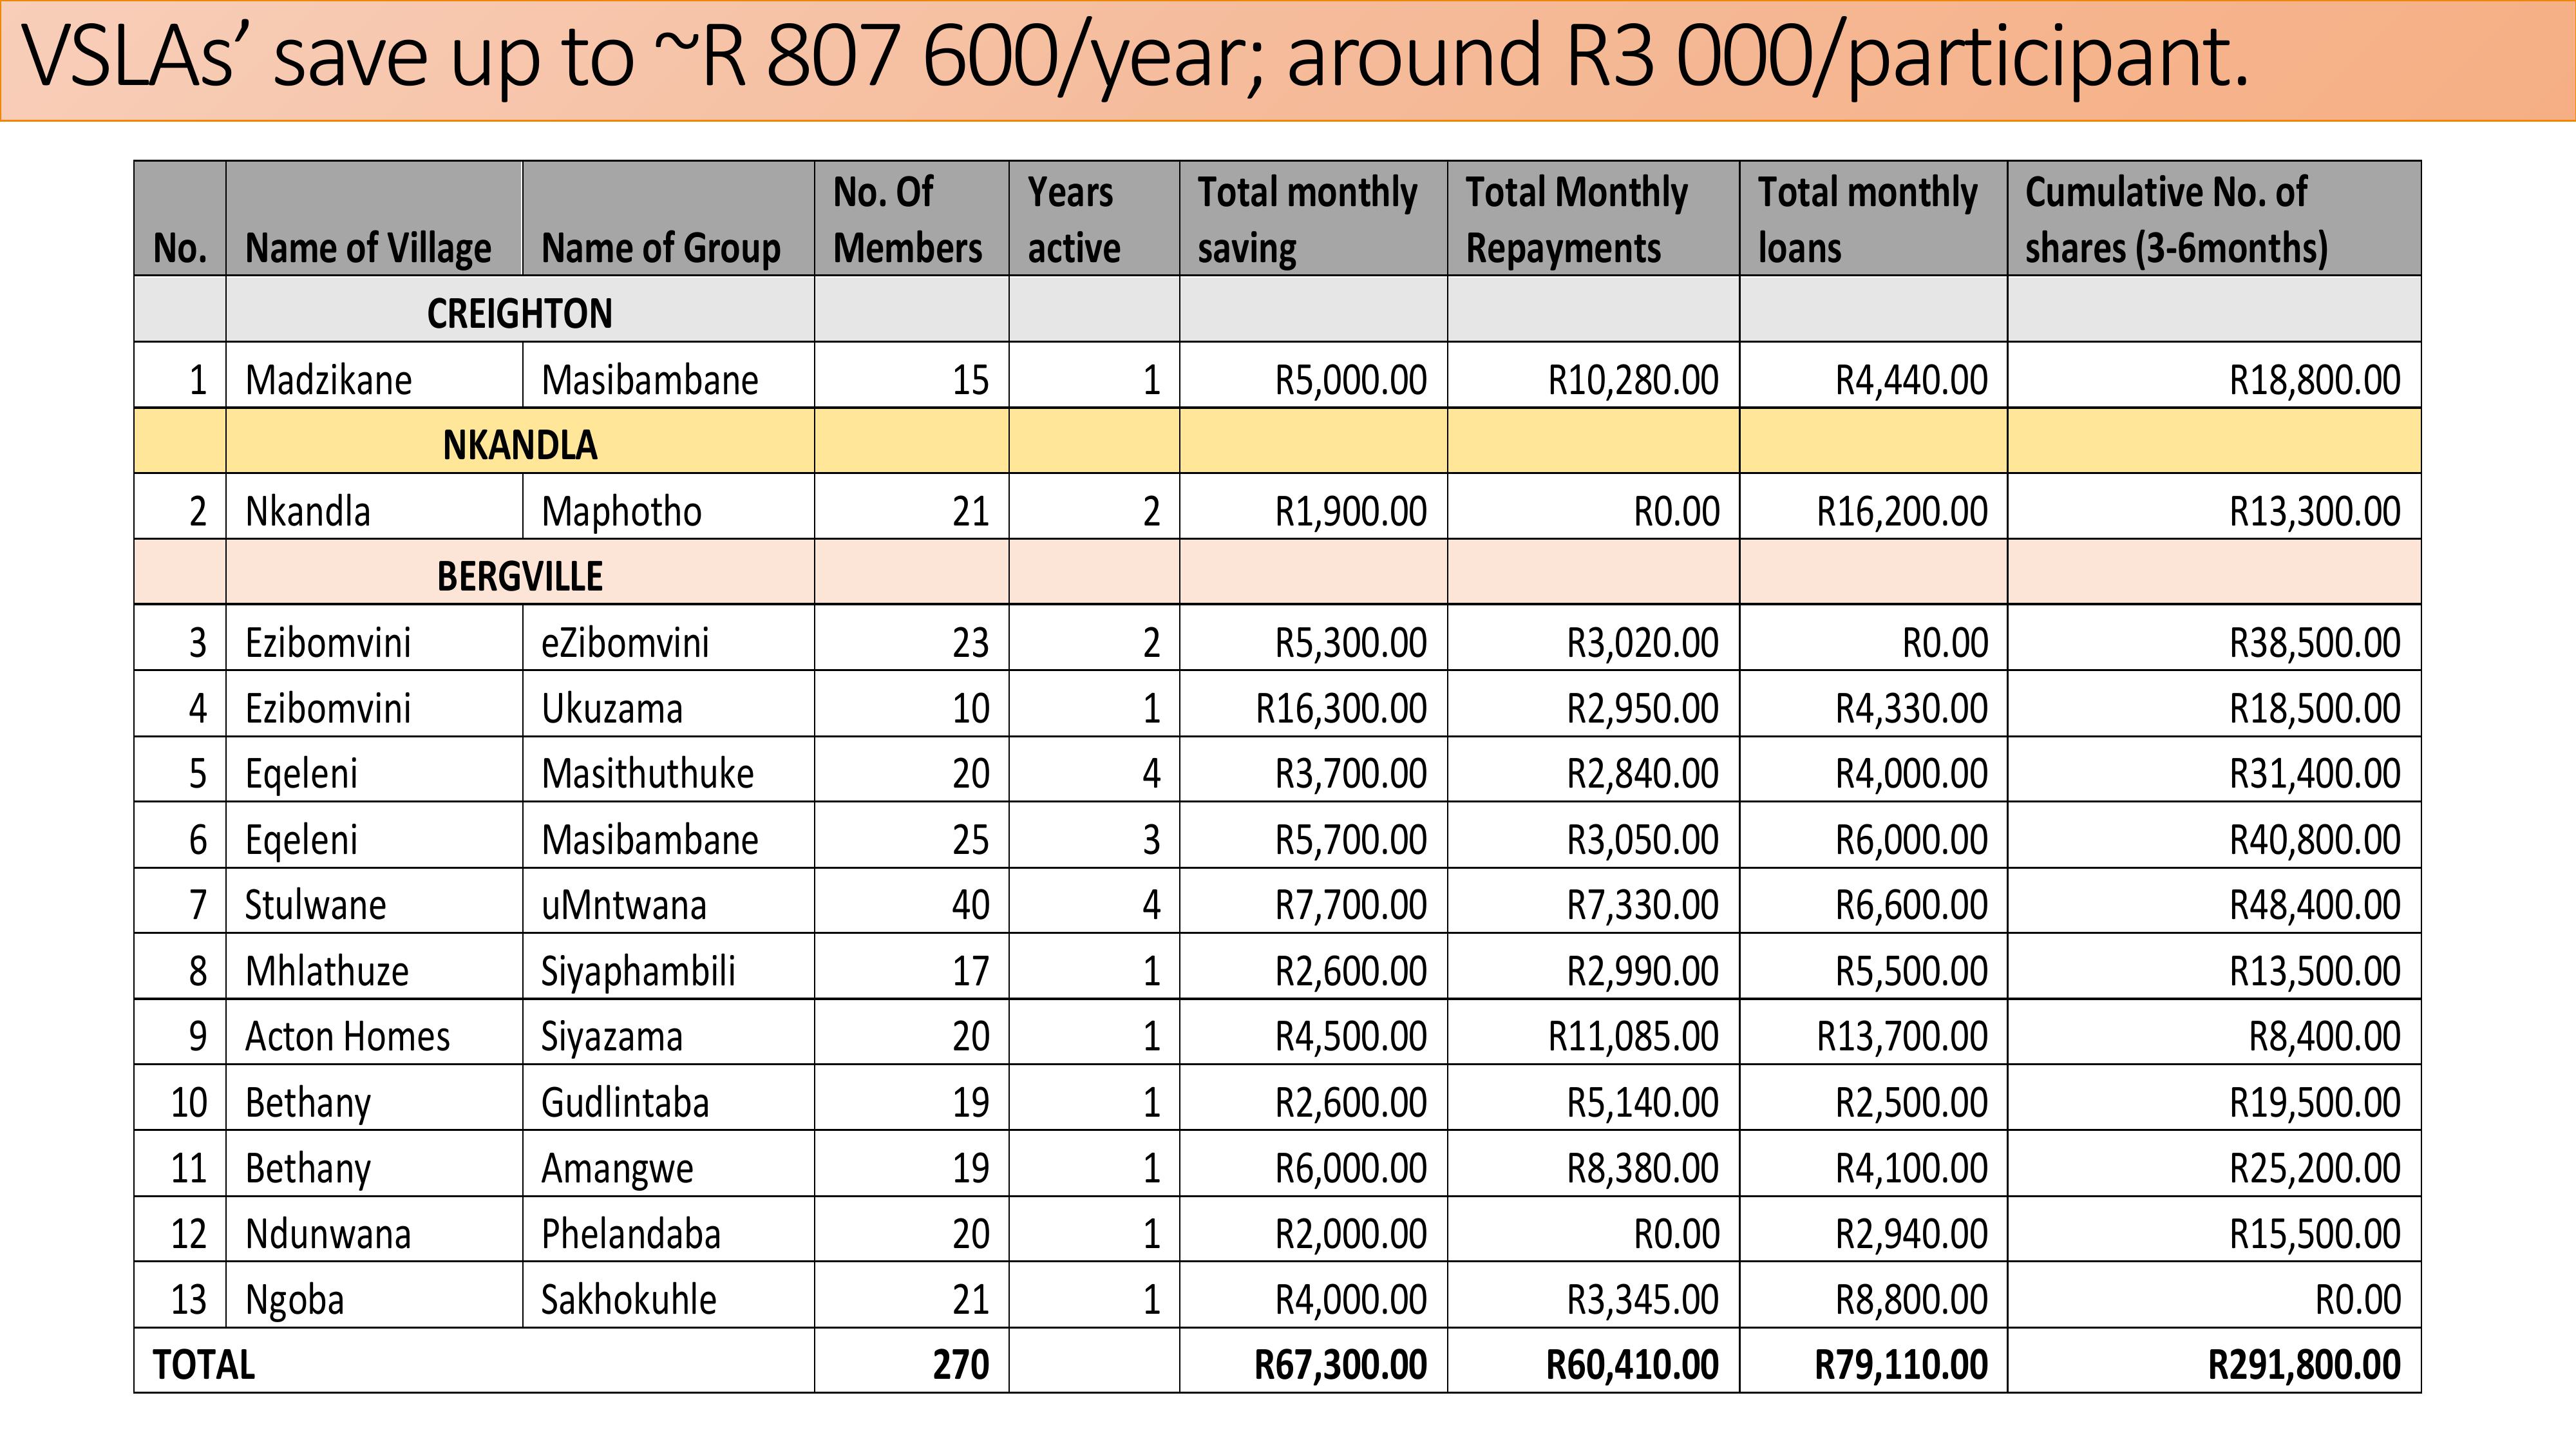
VSLAs’saveupto~R807600/year;aroundR3000/participant.

Now many smallholders involved
Working with Local Facilitators and
farmer centres important
Some participants 4 years under CA
Bergville KZN: farmer centresWe prefer to do crop rotation as the
intercrop plots are difficult to weed and the
bean yields are lower. Cowpeas are not
generally preferred. The cover crops are
great for soil health, but still struggling to
keep seed. Growing separate plots for this
now.
Seedfunding
Payment by
Centre
Inputs bought
Date
Potential profit(at
12,5% mark up)
R2900.00
8x50kg 3:2;1
2016/11/11
R1345.00
2x50kg 3:2:1,
5x50kg PAN 413
2016/11/30
R1364.30
9x50kg Pan413
2016/11/23
R1333.20
2x50kg 3:2:1,
3x50kg LAN
2016/12/06
Moneyin hand
R1666.80
2016/12/07
TOTAL
R6942.50
R850.00

3-4 years: Reduced need for herbicide no spraying on trial
plots this season
Increased organic matter, reduced fertilizer requirements -
No basal fertilizer applied-only top dressing
Reduced runoff
Increased yields and diversity
Bergville_Case studyMphumeleleHlongwane- Ezibomvini
t/ha
2016
2017
Maize (Control)
-CA
7,8
9,7
Maize Trial CA
- combined
6,93
8,3
Beans
0,25
1,81
Sunflower
0,3
0,8
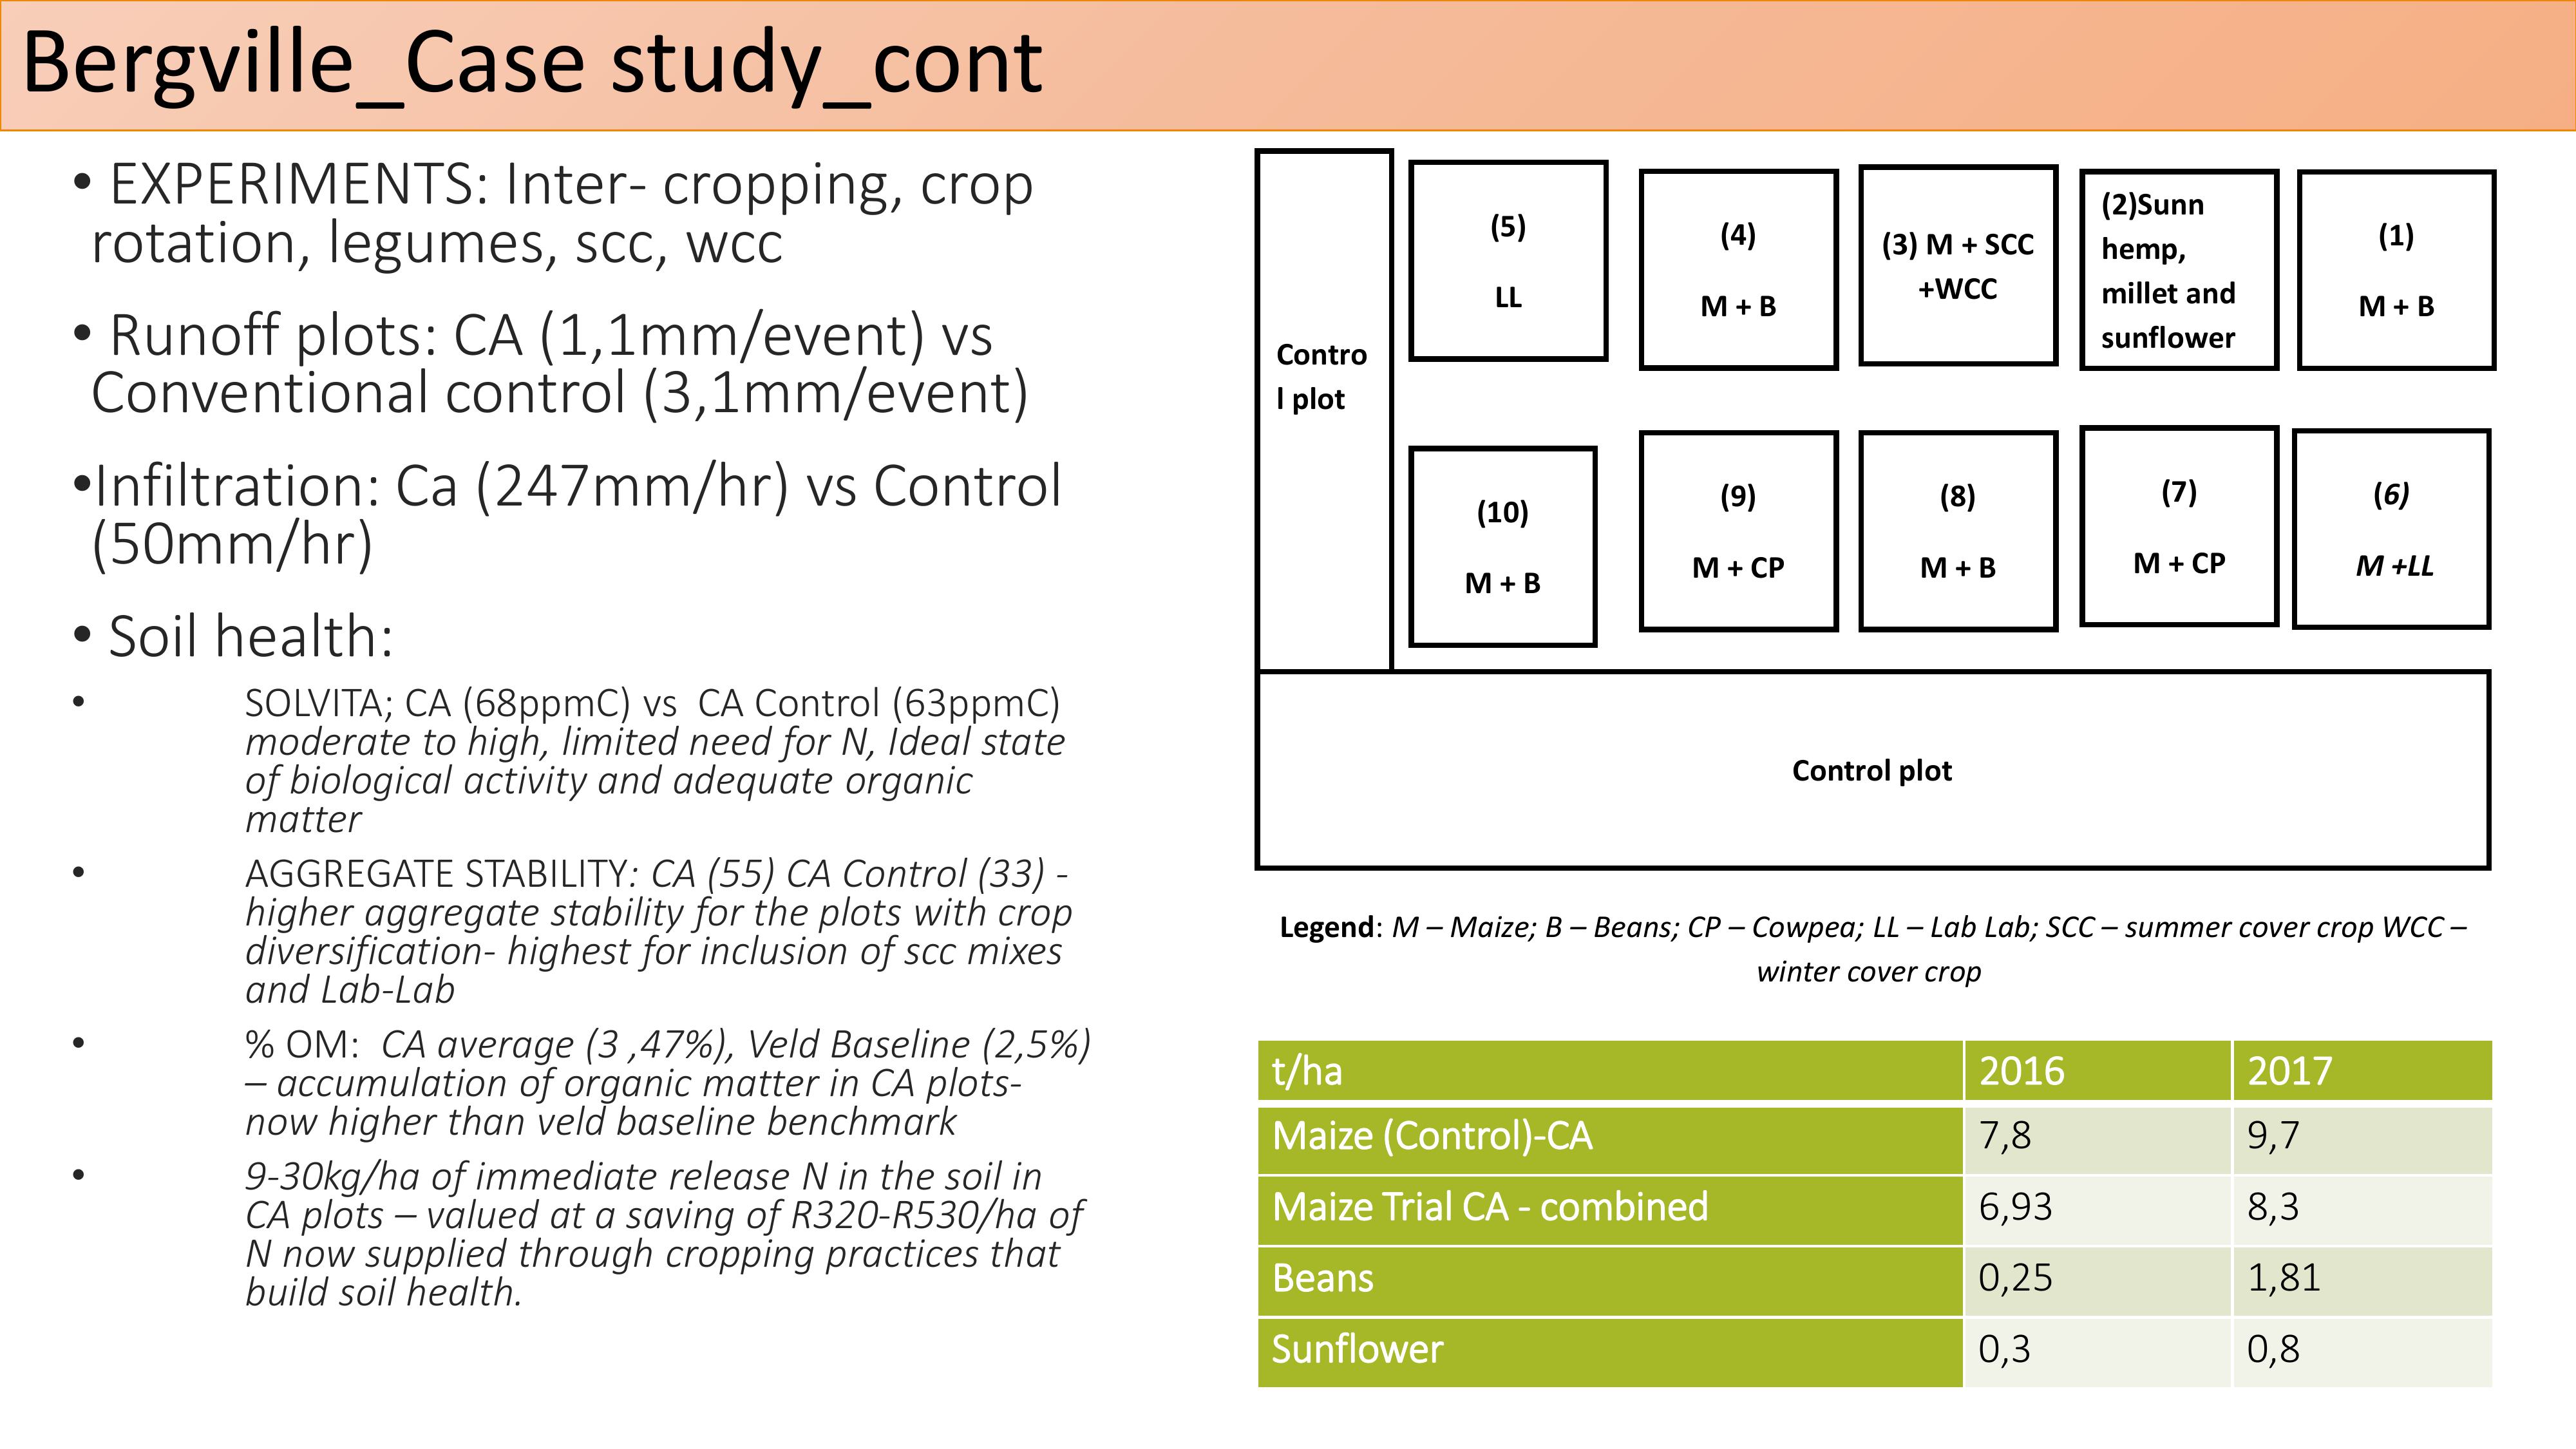
•EXPERIMENTS: Inter- cropping, crop
rotation, legumes, scc, wcc
•Runoff plots: CA (1,1mm/event) vs
Conventional control (3,1mm/event)
•Infiltration: Ca (247mm/hr) vs Control
(50mm/hr)
•Soil health:
•SOLVITA; CA (68ppmC) vs CA Control (63ppmC)
moderate to high, limited need for N, Ideal state
of biological activity and adequate organic
matter
•AGGREGATE STABILITY: CA (55) CA Control (33) -
higher aggregate stability for the plots with crop
diversification-highest for inclusion of scc mixes
and Lab-Lab
•% OM: CA average (3 ,47%), Veld Baseline (2,5%)
–accumulation of organic matter in CA plots-
now higher than veld baseline benchmark
•9-30kg/ha of immediate release N in the soil in
CA plots –valued at a saving of R320-R530/ha of
N now supplied throughcropping practices that
build soil health.
(10)
M + B
(5)
LL
Control plot
(8)
M + B
(6)
M +LL
(3) M + SCC
+WCC
Contro
l plot
(9)
M + CP
(7)
M + CP
(4)
M + B
(2)Sunn
hemp,
millet and
sunflower
(1)
M + B
Legend: M –Maize; B –Beans; CP –Cowpea; LL –Lab Lab; SCC –summer cover crop WCC –
winter cover crop
Bergville_Case study_cont
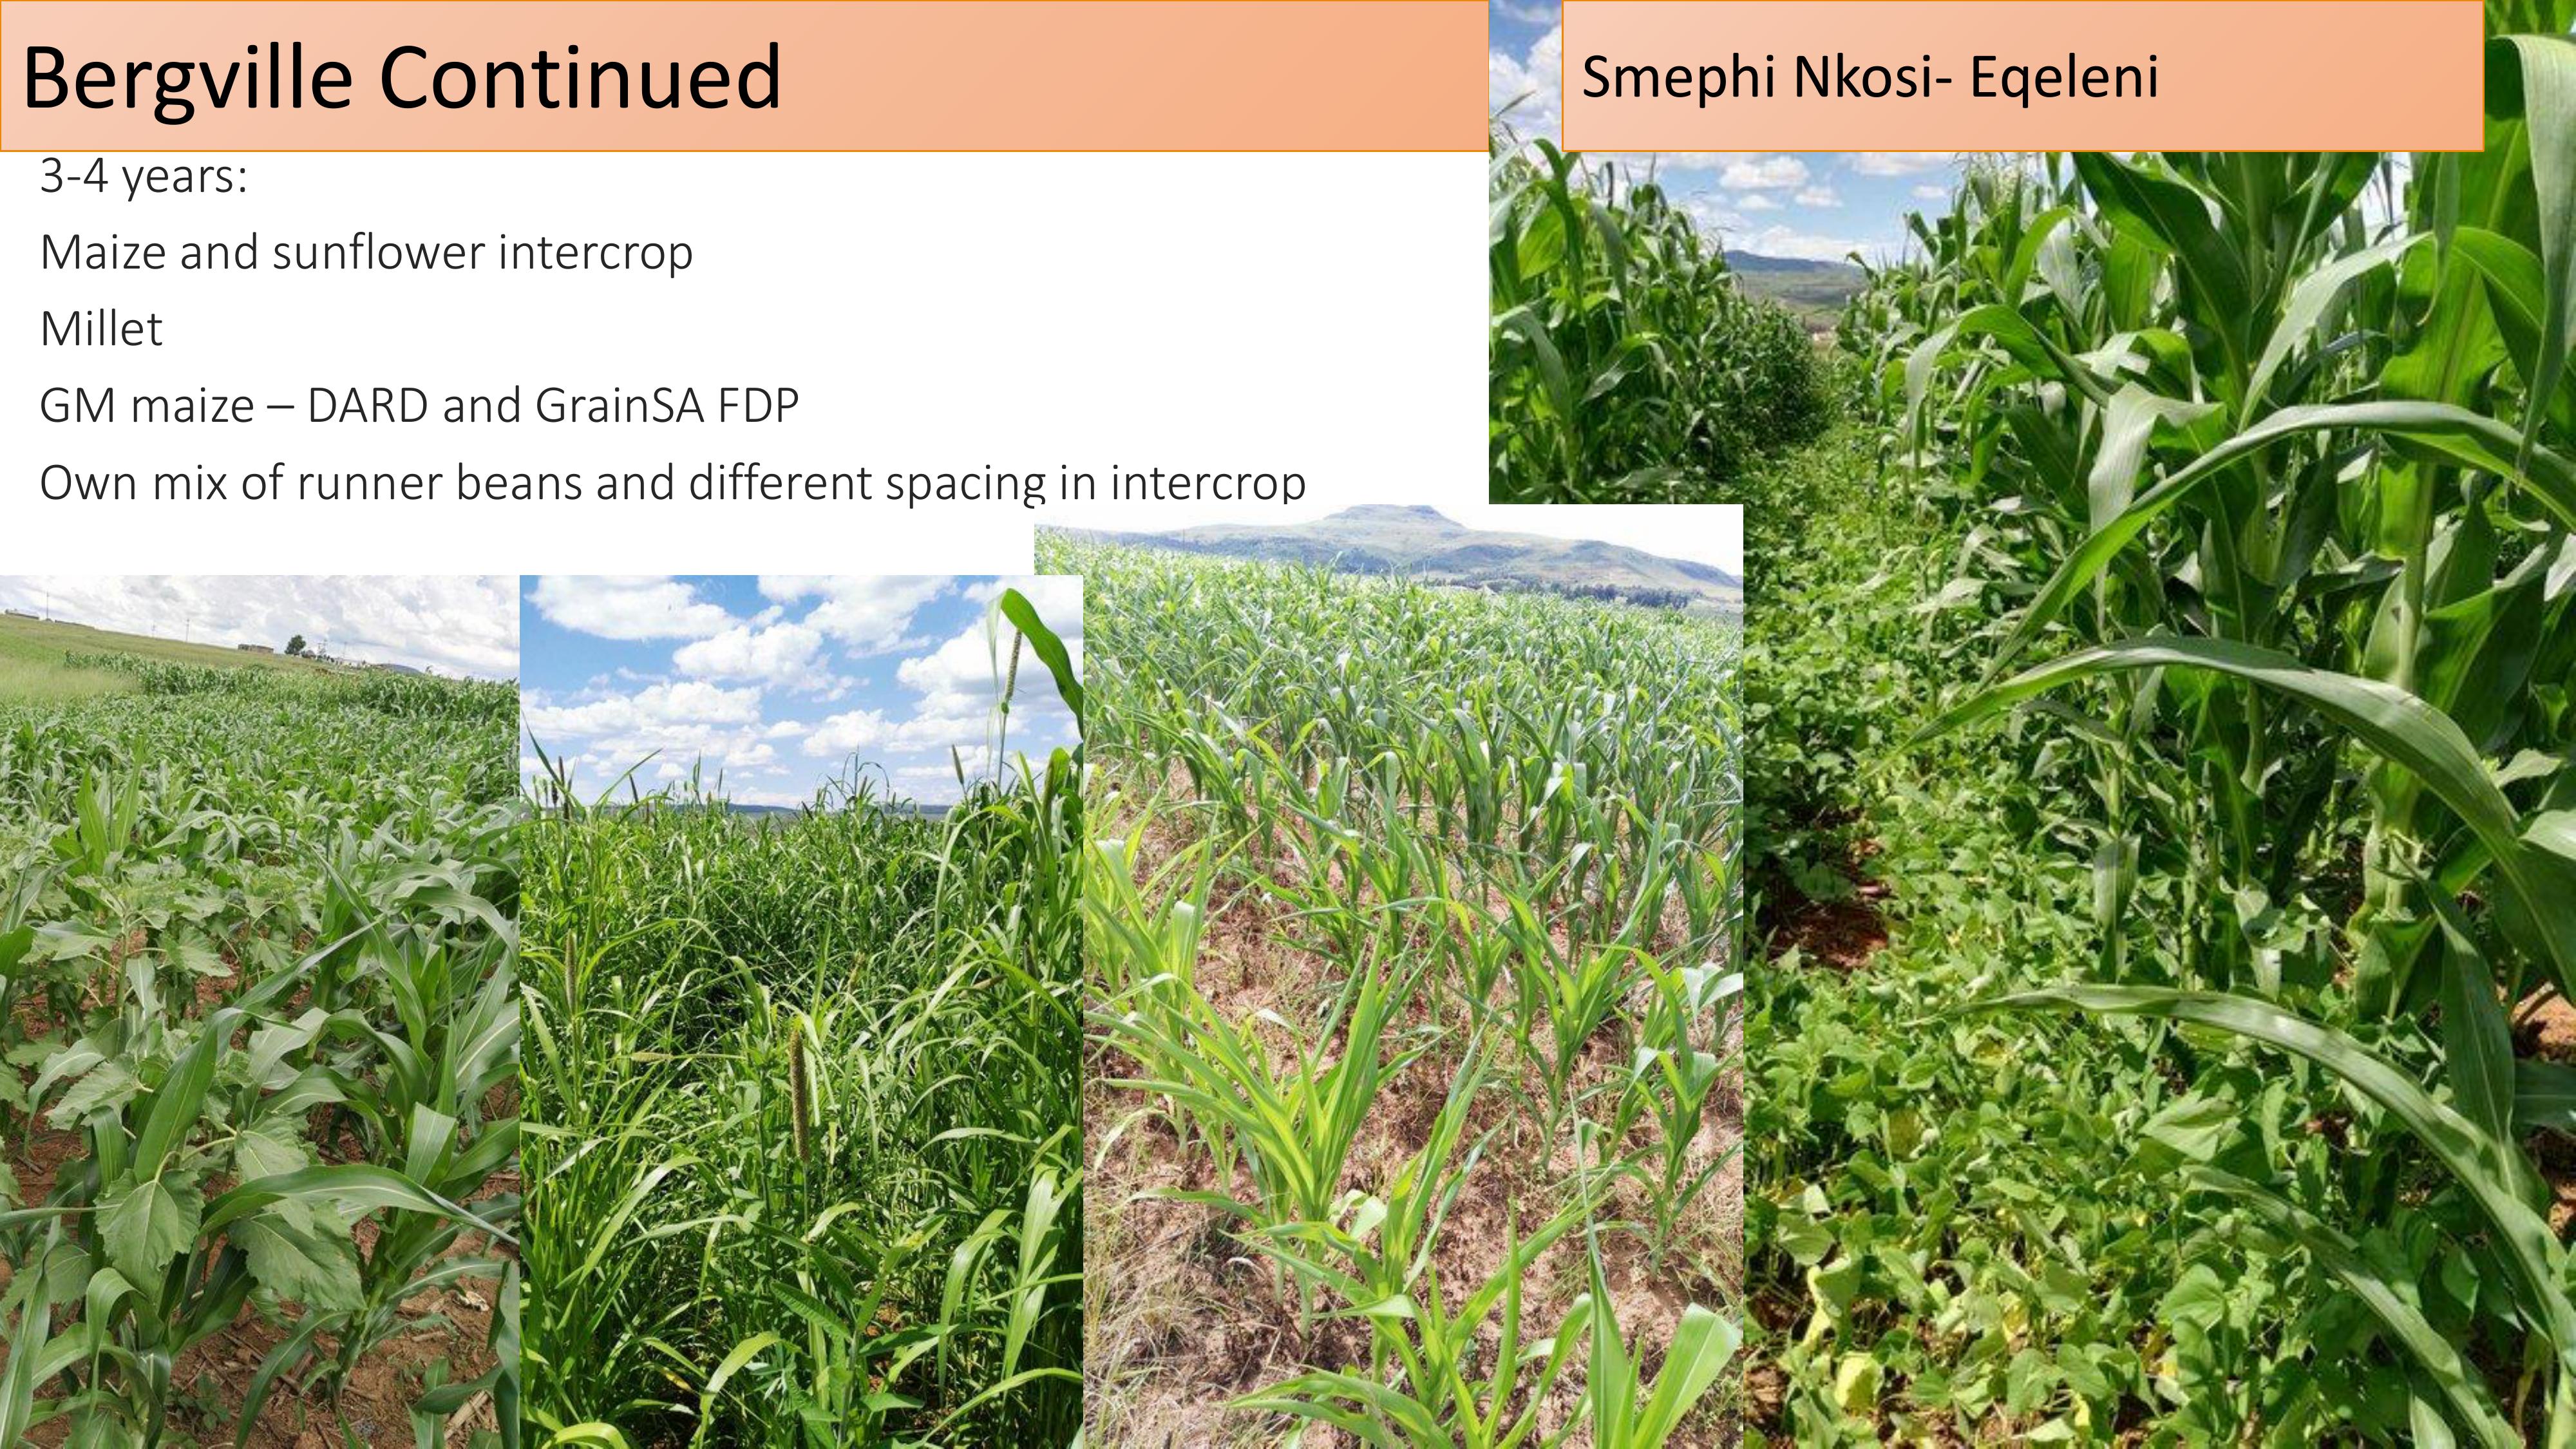
3-4 years:
Maize and sunflower intercrop
Millet
GM maize –DARD and GrainSAFDP
Own mix of runner beans and different spacing in intercrop
Bergville ContinuedSmephi Nkosi- Eqeleni
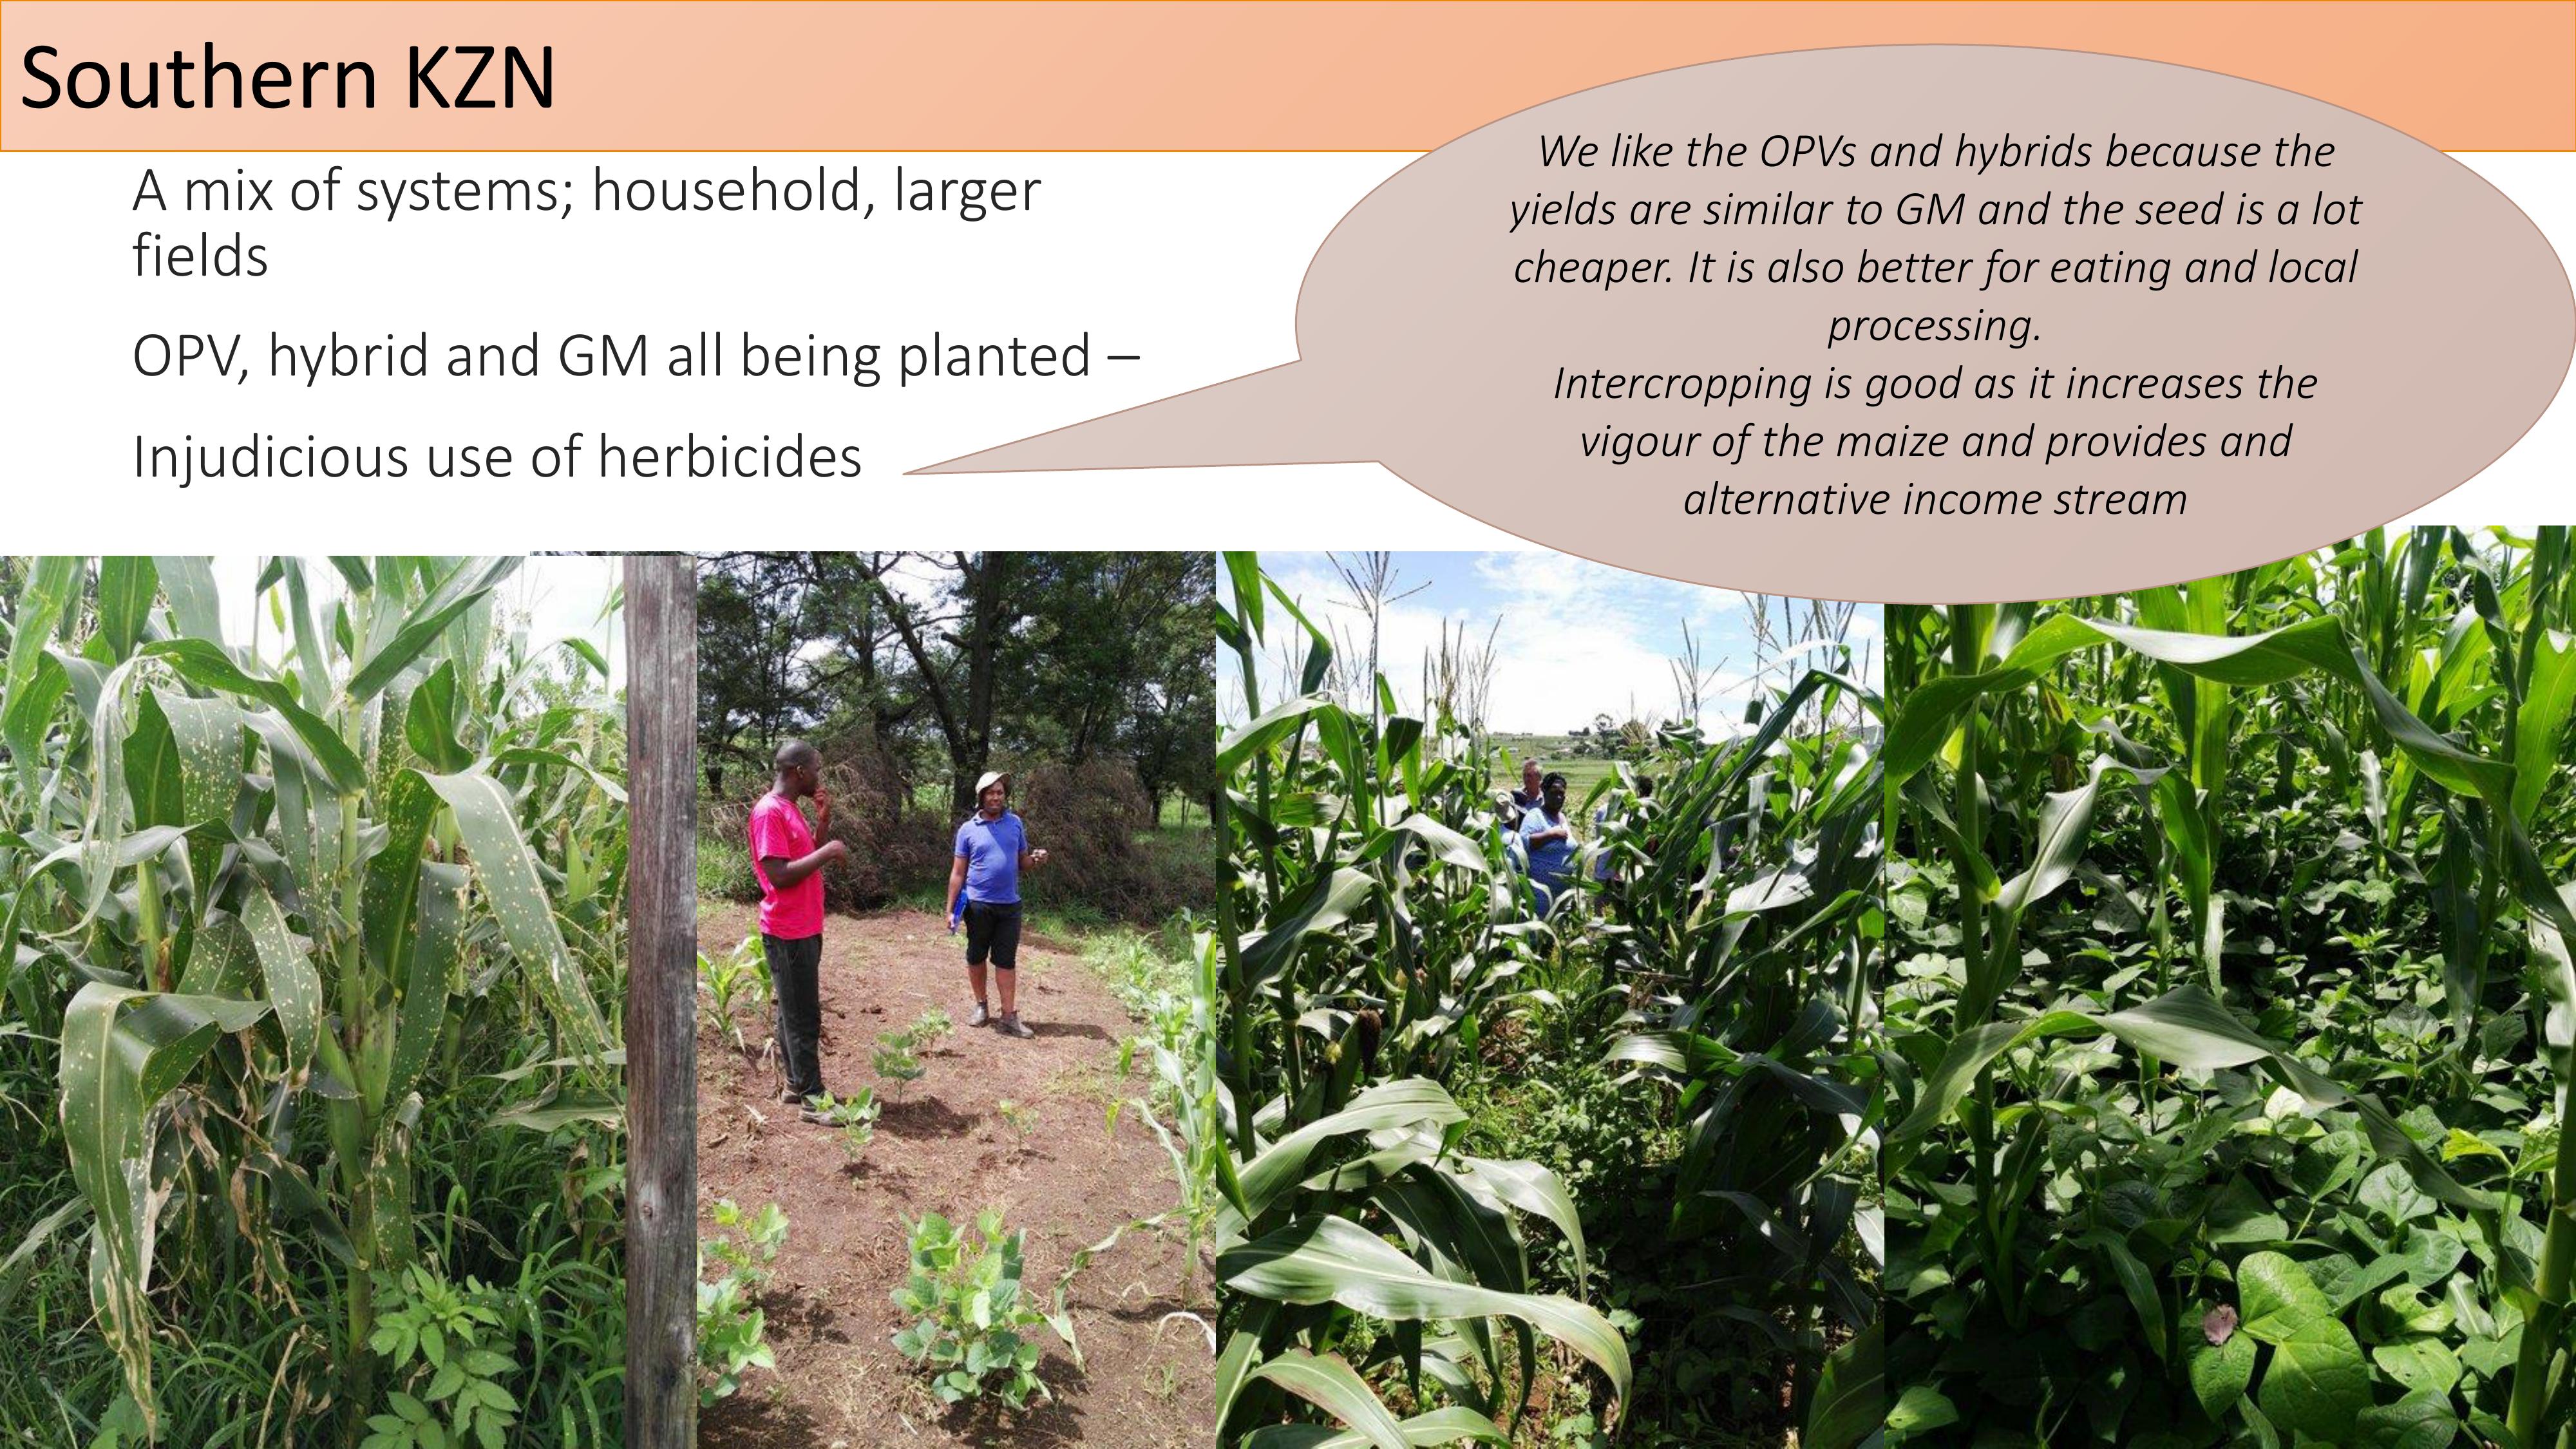
A mix of systems; household, larger
fields
OPV, hybrid and GM all being planted –
Injudicious use of herbicides
Southern KZN
We like the OPVs and hybrids becausethe
yields are similar to GM and the seed is a lot
cheaper. It is also better for eating and local
processing.
Intercropping is good as it increases the
vigour of the maize and provides and
alternative income stream
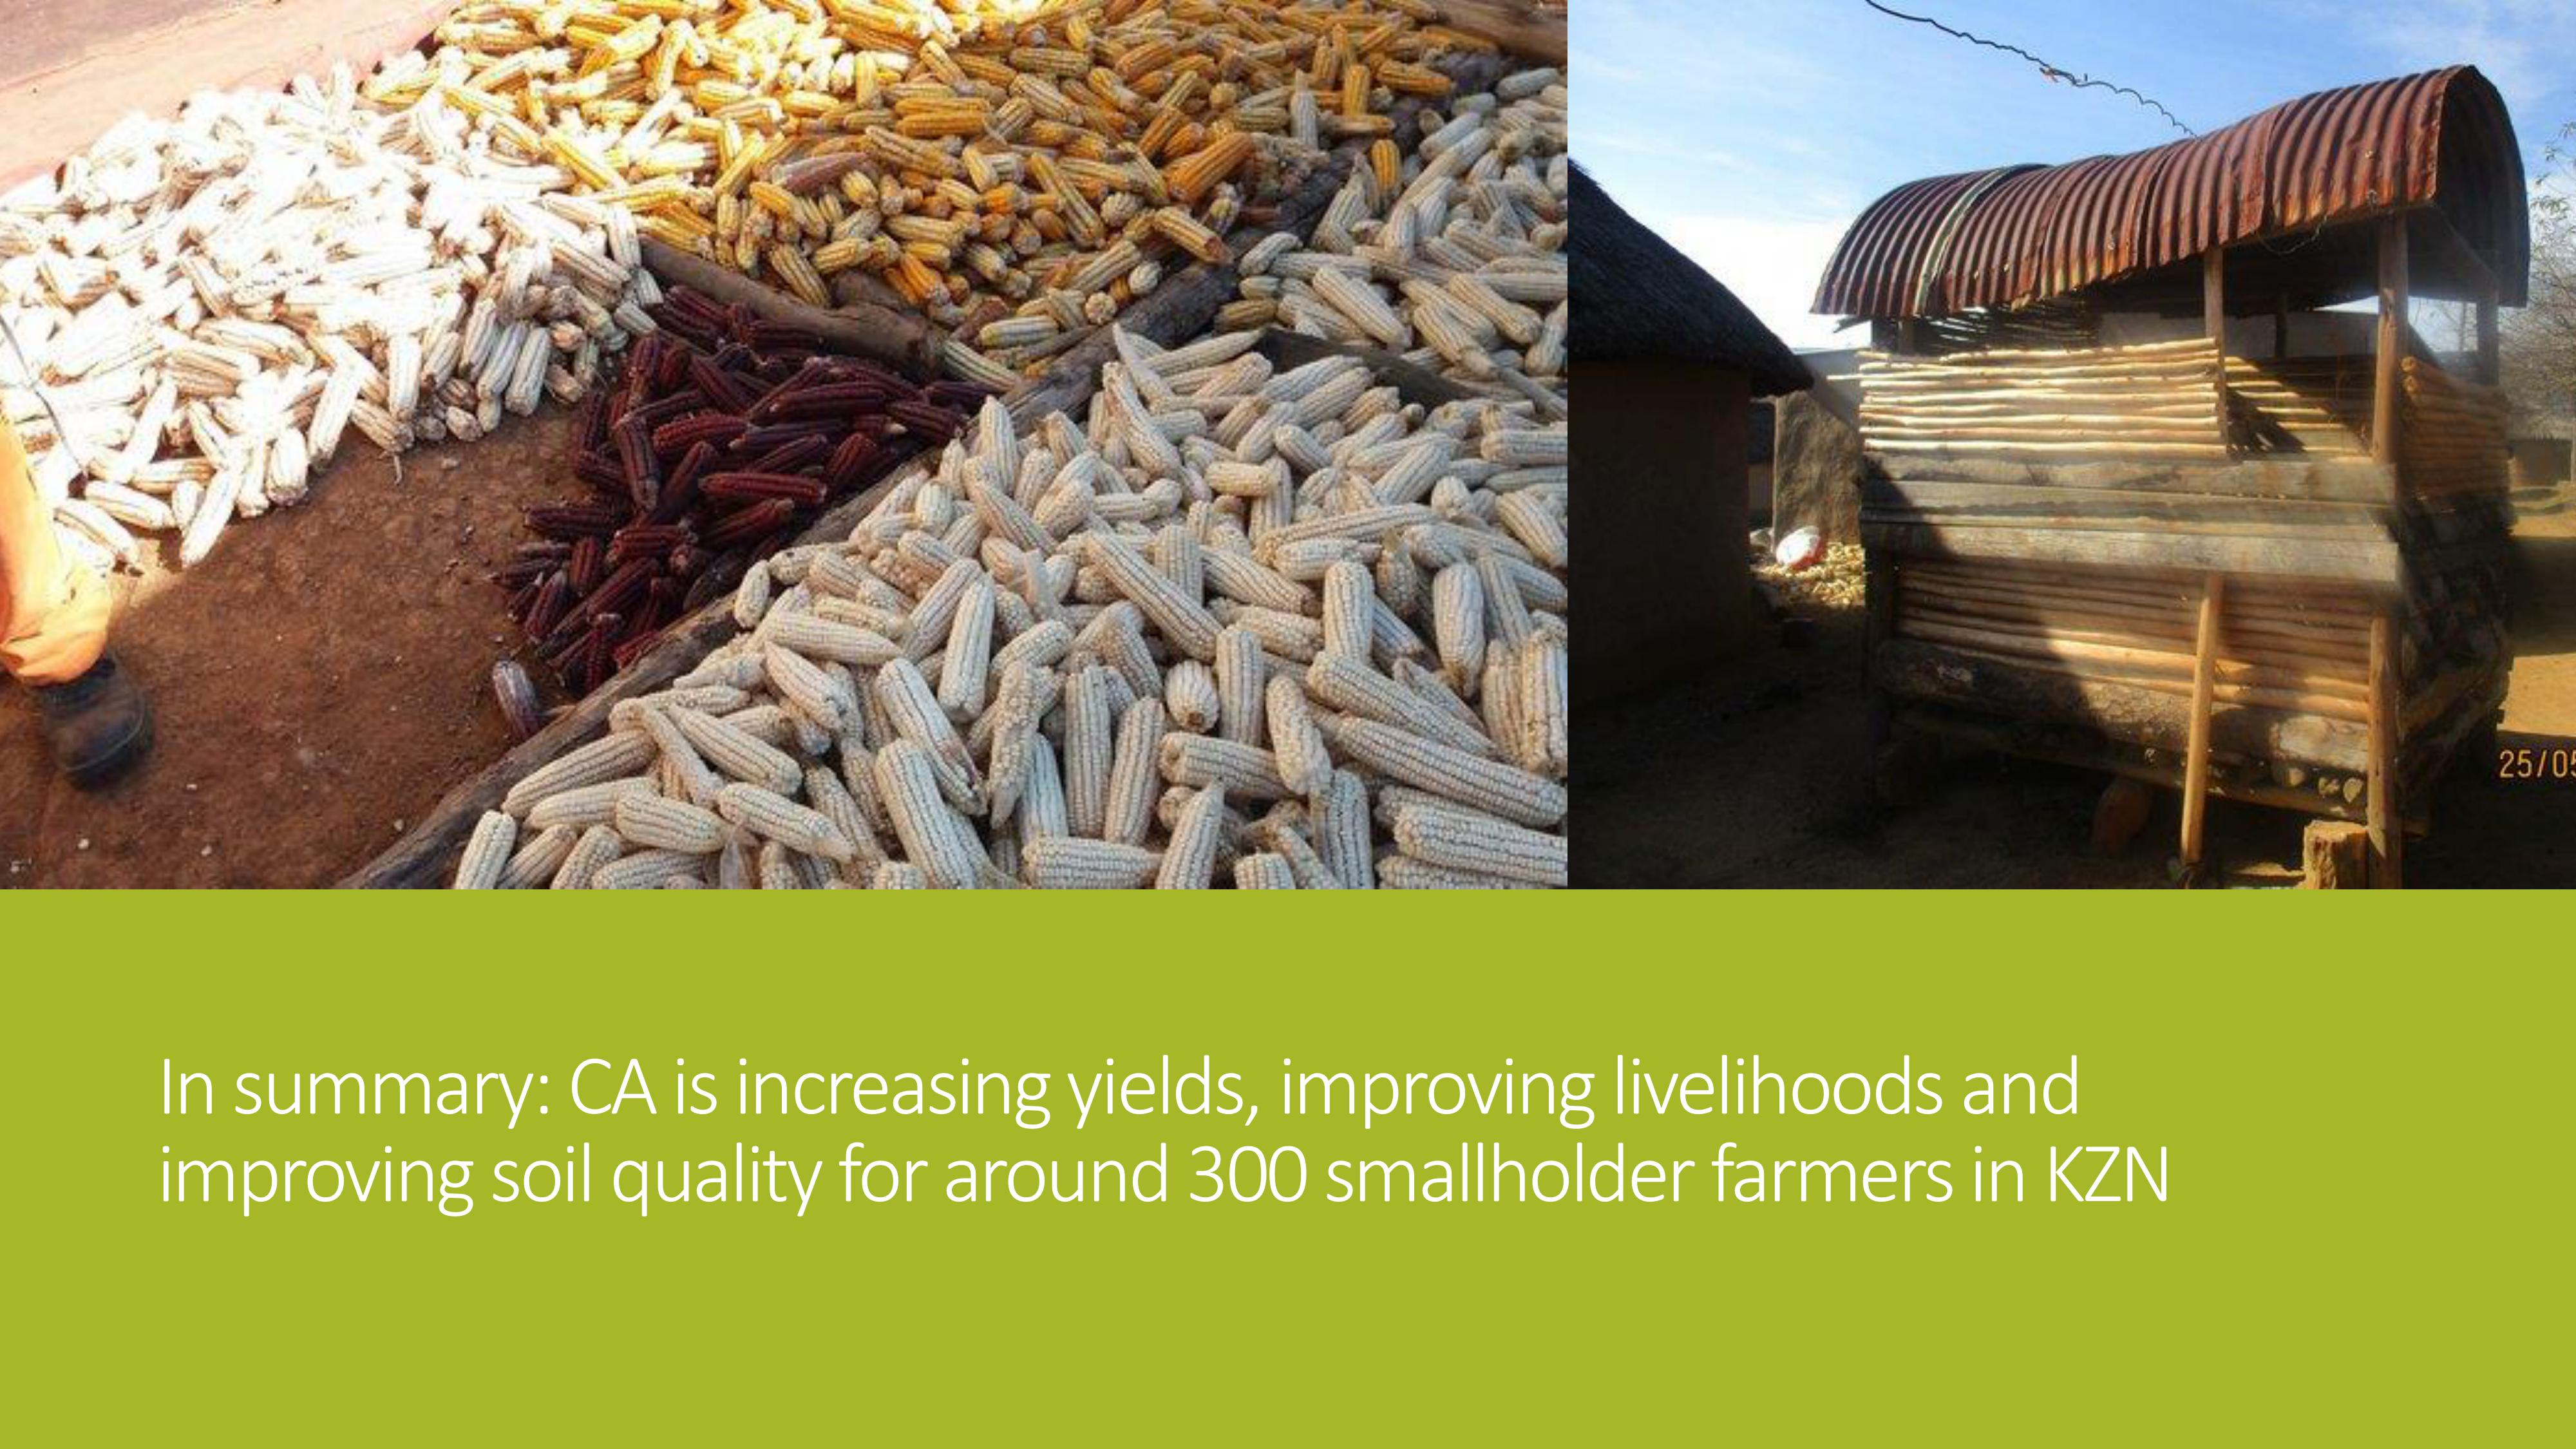
Insummary:CAisincreasingyields,improvinglivelihoodsand
improvingsoilqualityforaround300smallholderfarmersinKZN