
Agriculture and water
•Agriculture faces the dual challenge of adapting to a hotter, more drought-prone climate
with higher evaporative demand while also reducing its water footprint
•Higher blue water consumption coupled with lower blue water availability due to climate
change will lead to approximately 60% of the world population likely experiencing blue
watershortagesby2050
•Green water is rainfall that infiltrates in the upper unsaturated soil layers and flows back
to the atmosphere through evapotranspiration (ET), that is, it is the water retained in soil
after deep percolation andrunoff .Green water accountsfor 90% of croplandwater
consumption globally, including both rainfed and irrigated agriculture
•Challenge of adapting irrigated agriculture to water limitations will involve: (1) reducing
the consumption of blue water for irrigation to achieve sustainable levels of withdrawal,
(2) optimizing green wateravailability to crops, and (3) maximizing productive
consumption of water from all sources, that is, water that flows as transpiration through
plants rather than soil evaporation, all while maintaining crop production

Soil health
•soil health is a concept focused on managing dynamic soil properties like
soil organic matter (SOM), soil structure, and soil organisms to support soil
ecosystem functioning and provide multiple ecosystem services, including
water provisioning and effective use of water resources
•Managing soil health is based on several well-defined principles— reducing
soil disturbance, keeping the soil covered, increasing plant diversity, and
keeping living roots in the ground—that manifest as practices, such as
reduced/no till, cover cropping, organic matter amendments, crop rotation
diversification, and strategic integration of perennial plants into key
landscape positions. These practices change the dynamic biological,
chemical, and physical properties that underlie healthy soils, which affect
water provisioning and effective use in multiple ways.

•continuous living cover through perennial herbaceous and woody crops and
cover crops consistently and strongly promotes higher infiltration rates compared
to barefallow
•Plant roots strongly influence the interrelated biological, chemical, and physical
processes that increase porosity and aggregation
•Organic matter amendments, such as crop residues, straw, biochar, and manure
(from integrated crop-livestock systems), often improve soil structure and
infiltration
•Diversified crop rotations can improve soil structure and infiltration by including
crops with deep and shallow roots and by increasing soil cover and root presence
in the topsoil
•reducingsoil evaporationrelativetocrop transpirationpromotesproductive
water flow and increases the percentage of water recharged via percolation when
transpiration is low.

Microbes
•practices likeconservation tillage, cover cropping, organic matter
amendments, and diversification of crops typically enhance microbial
biomass relative to conventional practices and also impact diversity
and density of soil macrofauna, such as earthworms and positively
affect the biologicalsuppressionofsoilpathogens
•By drivingnutrientcyclingandincreasingplantnutrientavailability
soil microbes—with the exception of soilborne pathogens—help
removelimitationstoplantgrowthandallowplantstotakefull
advantage of available water. Greater plant productivity, specifically
increased canopy cover, mediated by plant–soil–microbe interactions
further reduces evaporation and increases productive green water
flow

•PGPR(plant growth promoting Rhizobacteria, mainly bacillus and
Pseudomonasspecies)areroot-colonizingbacteria that enhance
plants’
•ability to withstand biotic and abiotic stresses via the production of a
wide range of enzymes and metabolites

•Soil health management can create conditions favorable toroot
growth, such as increasing soil macroporosity,
•reducing penetration resistance, and maintaining soil
•moisture, which facilitate root elongation, oxygen diffusivity, and heat
transport (Nunes et al., 2019). A generalized framework across
management practices is that
•higher SOM due to soil health management tends to
•increase aggregation and promote growth and maintenance of roots
by alleviating negative impacts from both
•compactionindryingsoilsandpoor aerationinwaterlogged soils

•AM fungi can enhance plants’ drought tolerance by improving access
to nutrients and maintaining physiological performance. This, in turn,
increases plant growth strengthens plants’ ability to recover, and/or
prevents severe root and photosynthetic apparatus damage. Further,
AM fungi affect plant water relations, such as stomatalregulation in
ways thatmay optimize responsivenesstoloworvariablesoil
moisture. AM fungi stimulate antioxidant enzyme activity, which
alleviates damage caused by reactive oxygen species under drought
stressandimproveswateruse efficiencyandgreaterrecoveryof
plants post drought


Data collection for the following variables
Water:
1.Rainfall (rain gauges, weather stations,
SAEON)
2.Run-off (run-off pans)
Soil:
1.Bulk density (field measurements)
2.Soil health (Haney tests –Soil Health
Solutions)
3.Nematodes (Indices – NWU)
Productivity
1.Water productivity (soil data- CEDARA),
yield data- MDF)
2.Yields (Maize, beans, cover crops)
Laboratory analysis for water productivity -grain
Bulk density ring samplingRun-off plot

Layout of blocks and strips
BLOCKS (10x10m) x 10
plots
1
M
2
M+B
3
SCC
4
M
5
M+B
10
M+CP/Pk
SCC
8
M+B
7
M
6
SCC
Strips (2mx50m) x10
strips
1
M
2
M+B
3
SCC
4
M
5
M+B
6
SCC
7
M
8
M+B
9
SCC
10
M+CP/Pk
FodderStrips (2mx50m)x
8 strips
Short season maize
PAN5A190=yellow
PAN5A172=white
SSM
B/WCC
relay
SSM
Lespedeza
SSM
Tall
Fescue
SSM
B/WCC
relay

1 M
2 M+B
3 SCC
4 M
5 M+B
10 M+CP/Pk
9 SCC
8 M+B
7 M
6 SCC
CMT trial layout example: Nombono Dladla –Bergville (Ezibomvini)
Measurements
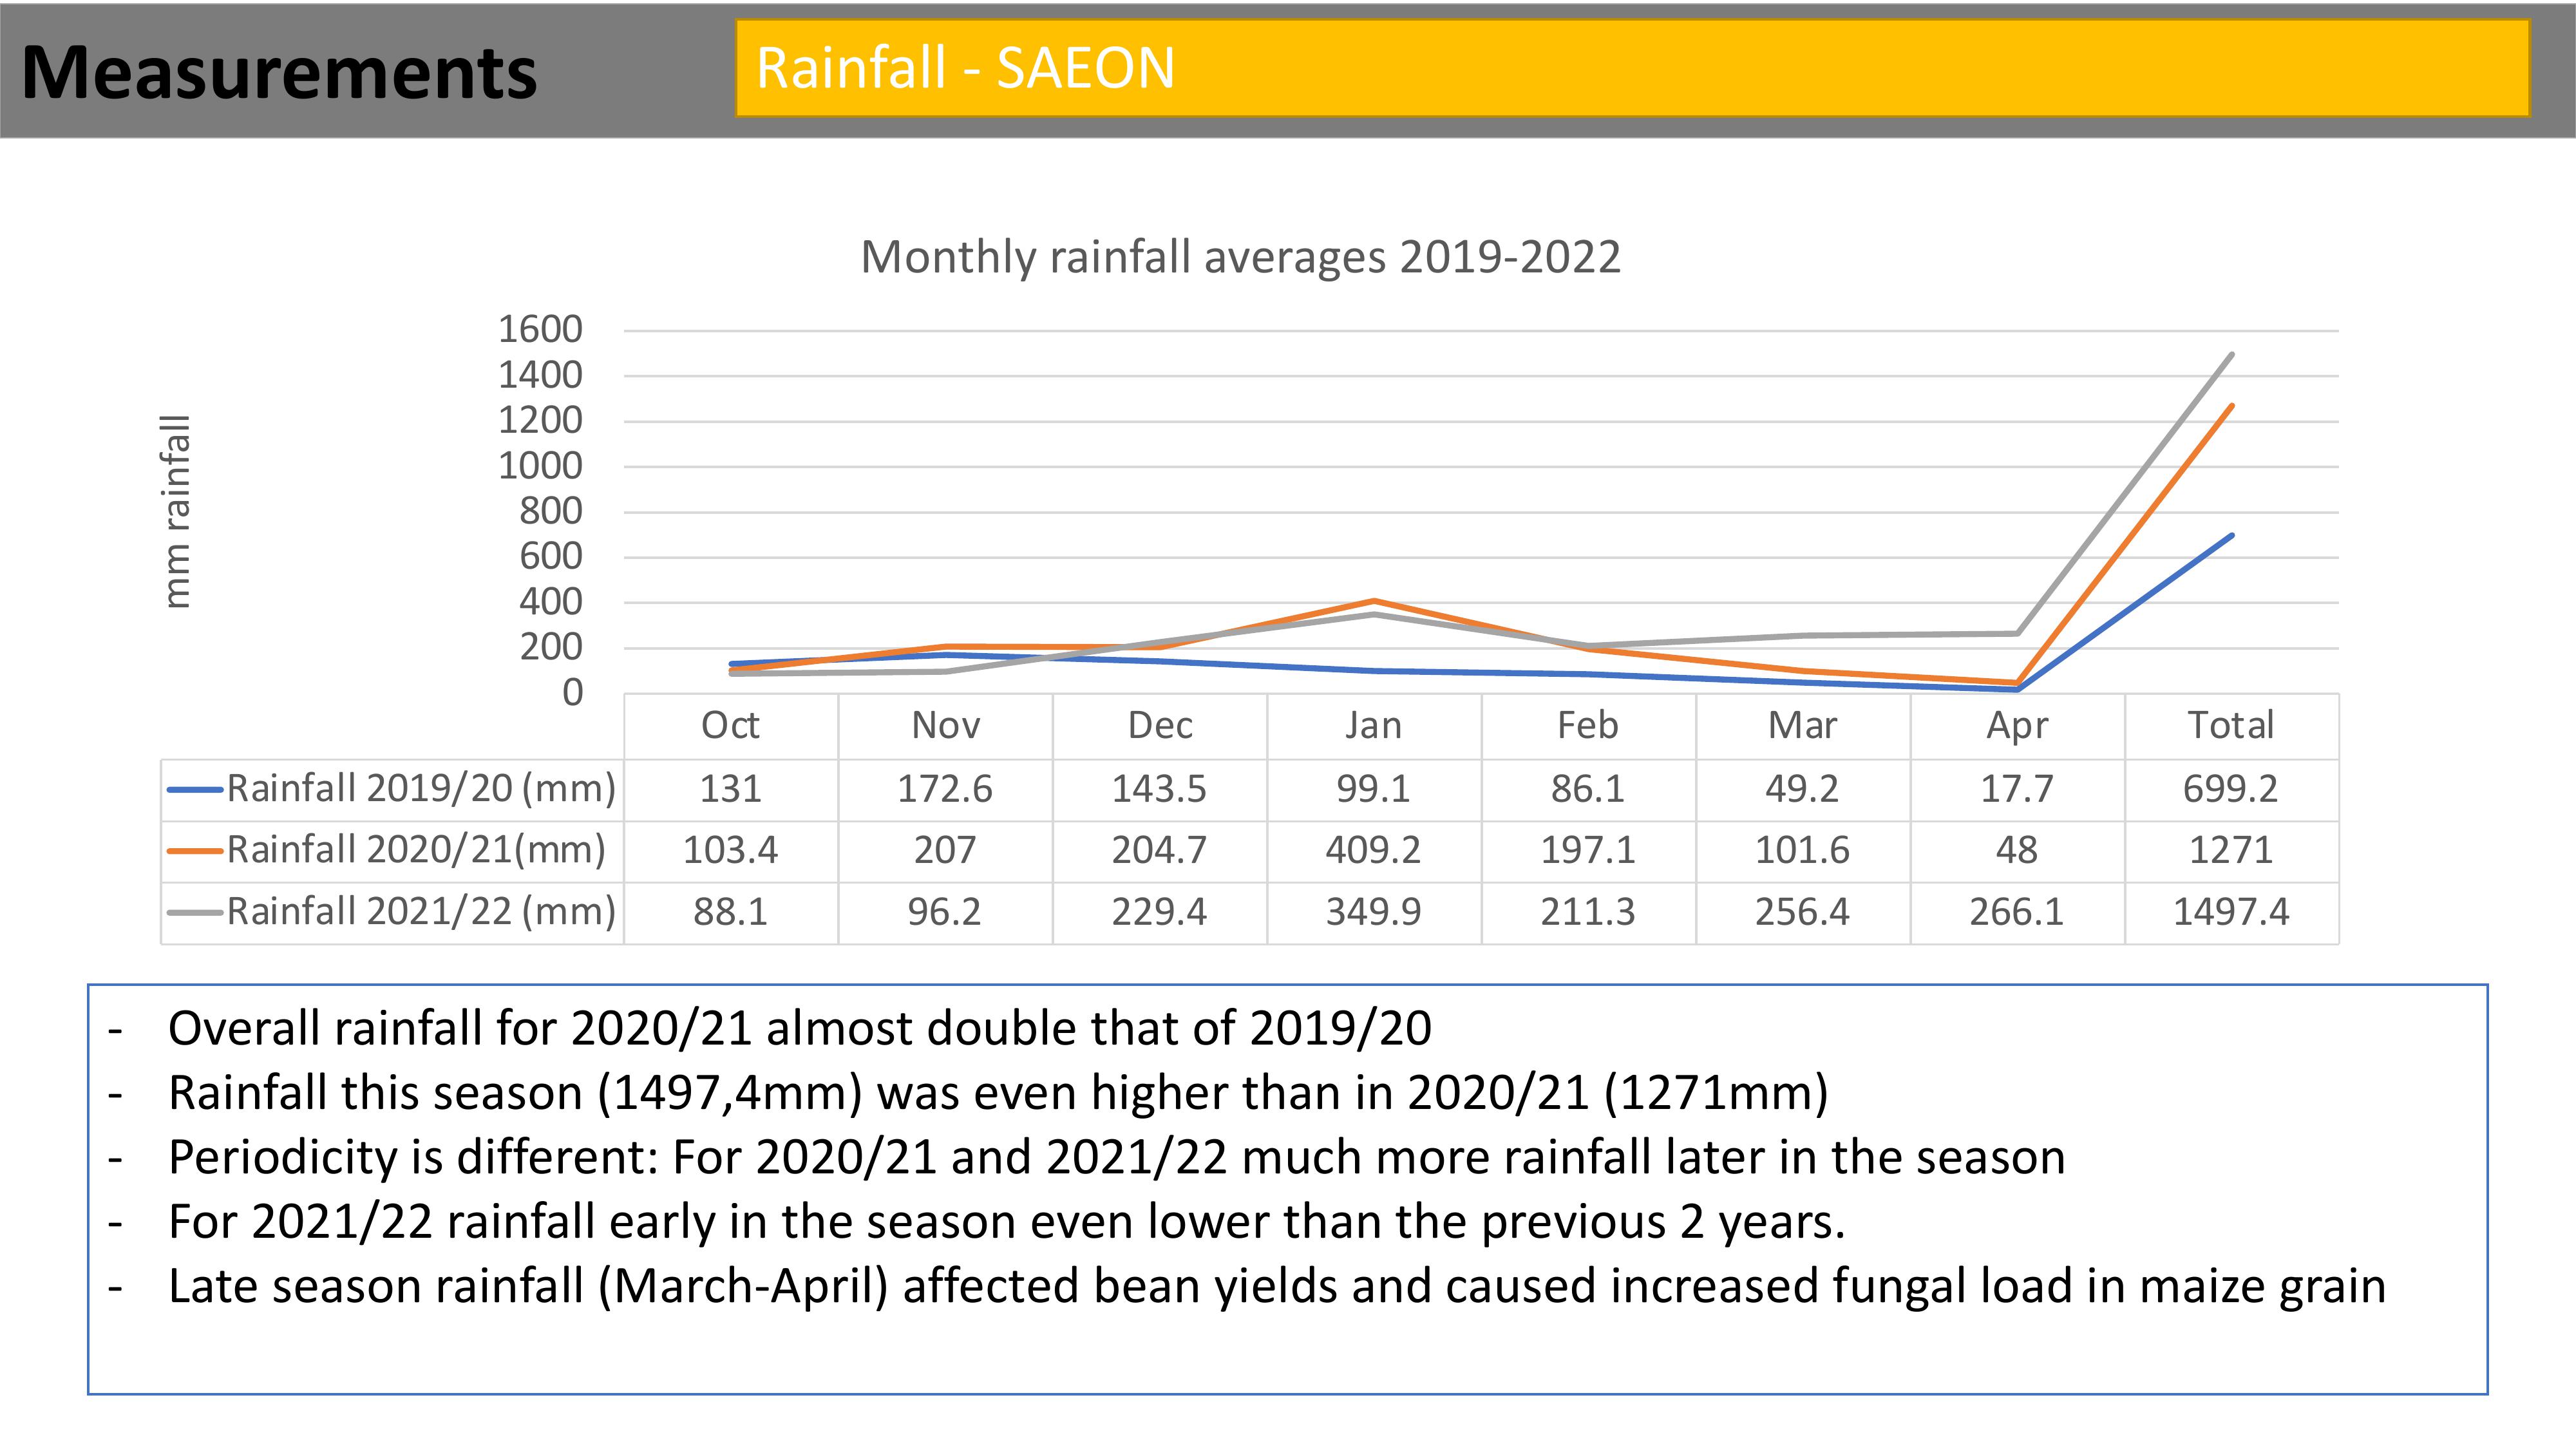
-Overall rainfall for 2020/21 almost double that of 2019/20
-Rainfall this season (1497,4mm) was even higher than in 2020/21 (1271mm)
-Periodicity is different: For 2020/21 and 2021/22 much more rainfall later in the season
-For 2021/22 rainfall early in the season even lower than the previous 2 years.
-Late season rainfall (March-April) affected bean yields and caused increased fungal load in maize grain
Rainfall -SAEON
Oct Nov Dec Jan Feb Mar Apr Total
Rainfall 2019/20 (mm)131172.6143.599.1 86.1 49.2 17.7699.2
Rainfall 2020/21(mm)103.4207204.7 409.2 197.1 101.6481271
Rainfall 2021/22 (mm)88.196.2229.4 349.9 211.3 256.4 266.11497.4
0
200
400
600
800
1000
1200
1400
1600
mm rainfall
Monthly rainfall averages 2019-2022
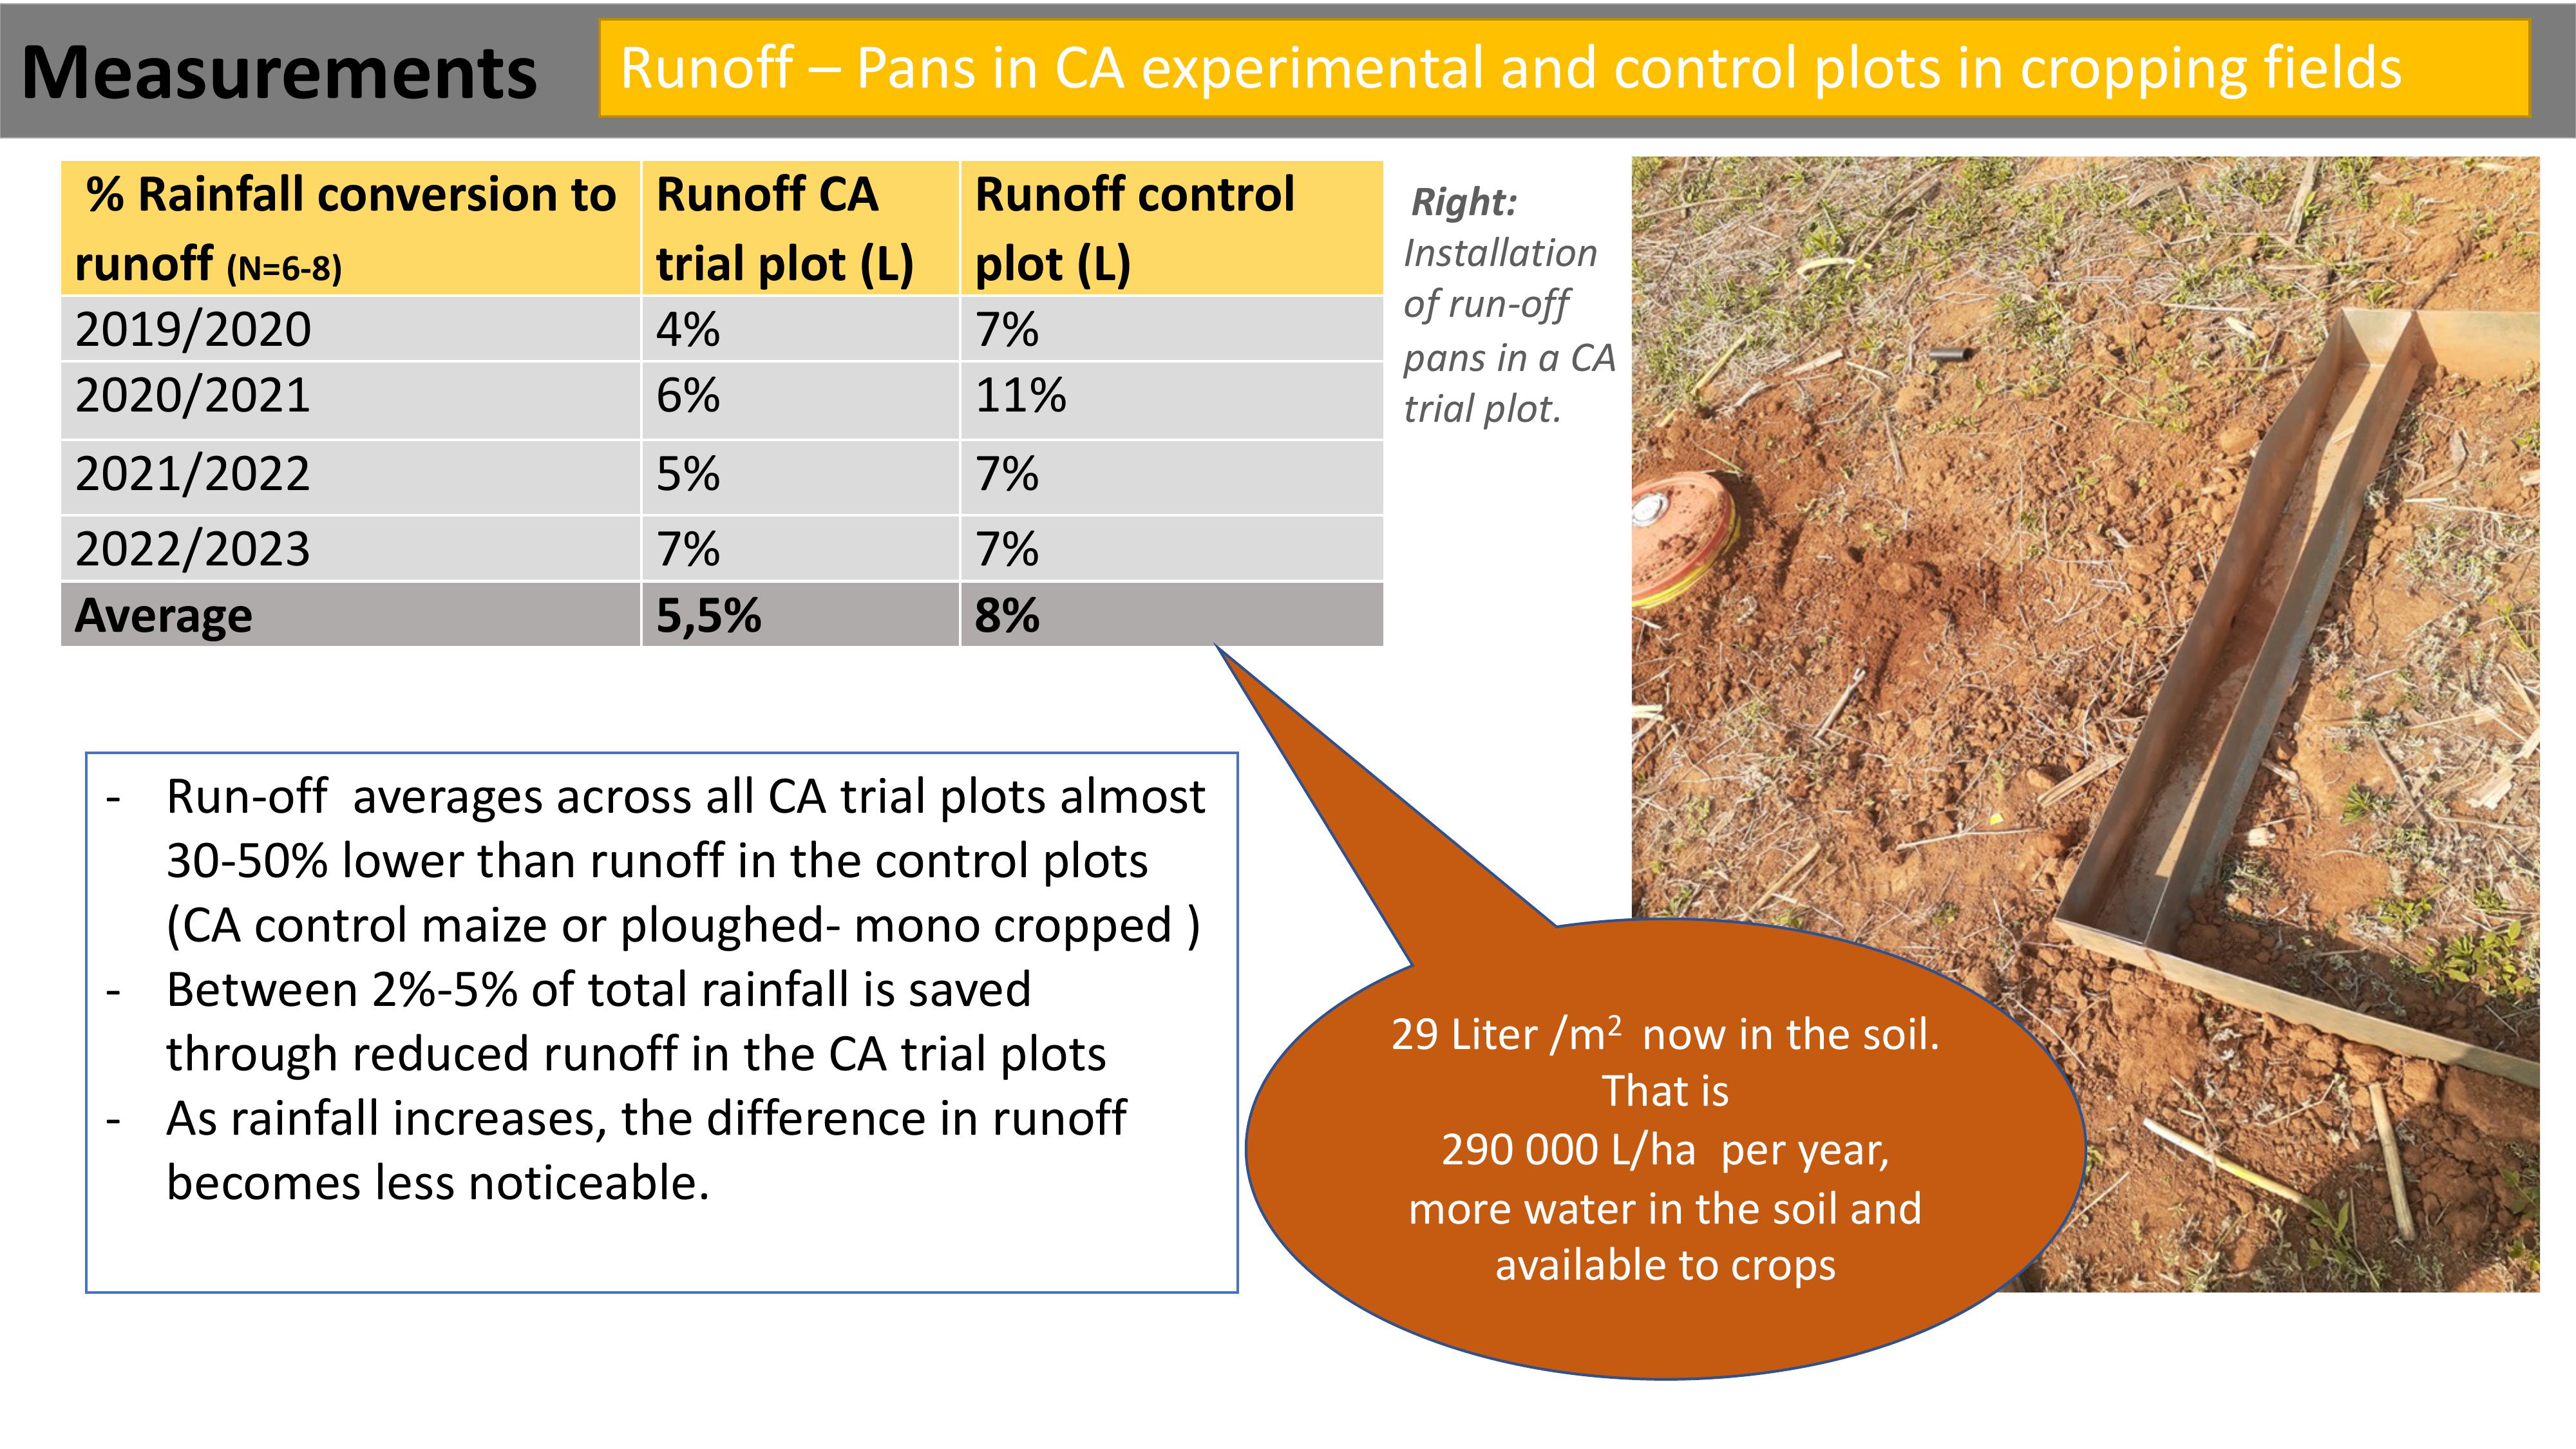
-Run-off averages across all CA trial plots almost
30-50% lower than runoff in the control plots
(CA control maize or ploughed- mono cropped )
-Between 2%-5% of total rainfall is saved
through reduced runoff in the CA trial plots
-As rainfall increases, the difference in runoff
becomes less noticeable.
Right:
Installation
of run-off
pans in a CA
trial plot.
Measurements Runoff – Pans in CA experimental and control plots in cropping fields
% Rainfall conversion to
runoff
(N=6-8)
Runoff CA
trial plot (L)
Runoff control
plot (L)
2019
/2020
4
%
7
%
2020
/2021
6
%
11
%
2021
/2022
5
%
7
%
2022
/2023
7
%
7
%
Average
5
,5%
8
%
29 Liter /m2 now in the soil.
That is
290 000 L/ha per year,
more water in the soil and
availabletocrops

Right: Crop monitoring in Ezibomvini (24 Jan 2023)
Above: Maize forCabangani Hlongwane showing
heat stress
Below: Maize and cover crops for Phumelele
Hlongwane on the same day –
WHY THE DIFFERENCE?
Observations Midseason drought
-Innate soil qualities
%Organic Carbon – 1,6% vs
2%
Org. C %
N %
pH
Clay %
Cabangani
1,6
0,15
4,9
27
Phumelele
2
0,19
5,1
43

Measurements and results
Water productivity field cropping
Cropping
options
WP (kg/
m
3)
WP (kg/
m
3)
WP
(kg/m
3)
Ave
WP (
3
yrs
)
2021
/22
(n=
7)
2020
/21
(n=
11)
2019
/20
(n=
9)
CA
–Maize (M)
2
,64
2
,28
1
,11
2
,0
CA
-Maize, bean intercrop (M+B)
3
,07
2
,50
1
,21
2
,3
CA
-Maize cowpea intercrop (M+CP)
2
,84
1
,43
2
,1
CA
-Maize control (M-CA control)
1
,42
1
,1
0
,8
1
,1
Conventionally
tilled maize (M-
Conv
Control)
0
,75
0
,36
0
,6
•Water productivity for CA maize
grown as an intercrop with beans or
cowpeas is higher than single
cropped CA maize and
• Water productivity for CA plots is
significantly higher than
conventionally tilled plots.
•Despite annual differences in water
productivity, these trends remained
the same across three seasons for all
three areas within KZN.
•The close spacing used in the CA trial
plots provides extra WP benefits
when compared to the ‘normal’
spacing used in these villagesWP for maize grown in a multi-
cropping rotation CA system is
much higher (x2) than CA mono-
cropped maize or conventionally
tilled maize (x3)

Measurements and results
Volumetric water benefit field cropping
CA trial (inter
cropping and
crop rotation)
CA control
(mono
cropped M)
Conv
control
(mono
cropped M)
kg/m3 (WP)
2,3
1,1
0,6
Difference (CA trial
-CA
control
-Conv control)
1,2
0,5
Volumetricwaterdifference
(l/kg)
1 200
500
Yield(t/ha)
5,11
2,87
VWB (l/ha)
6
132 000
1
435 000
Volumetricwaterbenefitfor
intercropped and rotated CA plots is
~6 million litres/ha more than
conventional tillageand for mono-
cropped CA plots is ~1million
litres/ha more.
CA control
CA trial
INR, Wildlands Trust, WWF visit

Measurements
•For the 2021-22 season soil samples were collected from 21
participants across 11 villages.
•All the values used to calculate the soil health index are lower in
2021 than in all the other seasons, except for the %soil organic
matter.
•Similar trends were found in all three areas:Bgvl,SKZN and
Midlands
% Organic matter in the soil has
increased, indicating a build up of
organic material in the soil ,
through CA, despite the
temporary loss of soluble
nutrients due to environmental
constraints
Soil health analysis- Haney tests
2015 2016 2017 2018 2019 2020 2021
CO2-C179.1 75.1 100.8147.6 65.855.548.8
organic N7.413.6 21.1 15.7 20.86.66.2
Organic C89.0205.1 302.3 233.2 260.9 146.579.2
C/N 12.1 15.7 13.4 16.7 12.8 28.5 12.8
%SOM 3.1 3.3 3.5 3.5 3.1 3.9
Soil Health Calculation (Index)16.5 8.4 16.617.913.9 9.17.1
0.0
50.0
100.0
150.0
200.0
250.0
300.0
350.0
SH parameters , Bergville 2015-2021
The high loss of Organic N and Organic
C from the soil between 2019 and
2021 is a combined effect of:
-high temperatures early in the
season and leaching due to
extreme rainfall eventsmid to late
season (January-March 2021 and
2022) and
-reduced stover or soil cover, due
to increased grazing pressure
Recommendationsfor
increased permanent soil
cover andmuch increased
inclusion of legumes and
cover crops are important

Measurements
Soil health analysis- Nematode indices
C
AB
D
Left:Faunal analysis and Right: A pooled analysis for CA (treatment
and control) samples compared to Conventional tillage and aveld
benchmark, for Bergville (December 2021).
CA treatments, when compared to
CA control and veld samples have
the highest Structure and
Enrichment Index values. This
indicates that the soil ecosystems
forCAtreatmentsareN-enriched,
maturing, with low C:N values and
with bacterial dominated nutrient
cycling pathways within a
regulated soil ecosystem.
The Structure Index serves as a measure of
the complexity of the soil ecosystem. Higher
structure values (>50) are indicative of
healthier soils with structured food webs,
while lower values (<50) are indicative of
degraded soils.
The Enrichment Index represents the level of
resource availability in the soil. Therefore,
higher values (>50) are indicative of nutrient
enriched soils and lower (<50) values of
nutrient depleted soils. .

•Averageyieldsformaize
planted in intercropped
plots (M+B , M+Pumpkin)
are much higher than the
yields in maize only plots
•AverageyieldsfortheCA
trial plots (intercropped
and maize only averaged)
are much higher than
maize yields in the CA
control plots (plantedto
maize only in consecutive
years)
•For 2021/22yields were
on average 1-2 t/ha lower
than the previous season.
Productivity:Yields(Bergville)
Yield advantages for
maize through
intercropping and crop
rotation are evidentafter
a continuous CA
implementation cycle of
4 or more years
AveyieldM-intercrop:
5,22t/ha,
AveyieldM-monocrop:
4,18 t/ha
AveyieldM-control:
2,87t/ha
MM+B M+P
CA 4.60 4.81 3.58
CA-Strip 3.74 7.15 5.60
Control 2.87
0.00
1.00
2.00
3.00
4.00
5.00
6.00
7.00
8.00
t/ha
Yields ofmaizein CMTs(18)Bergville2021/22
Maximum yields have increased
from 6,7 t/ha to 13,6 t/ha
between 2014 and 2021, for high
performing smallholder farmers.
A yield gain of ~1 t/ha per annum
is possible under CA cropping
systems despite difficult climatic
conditions