
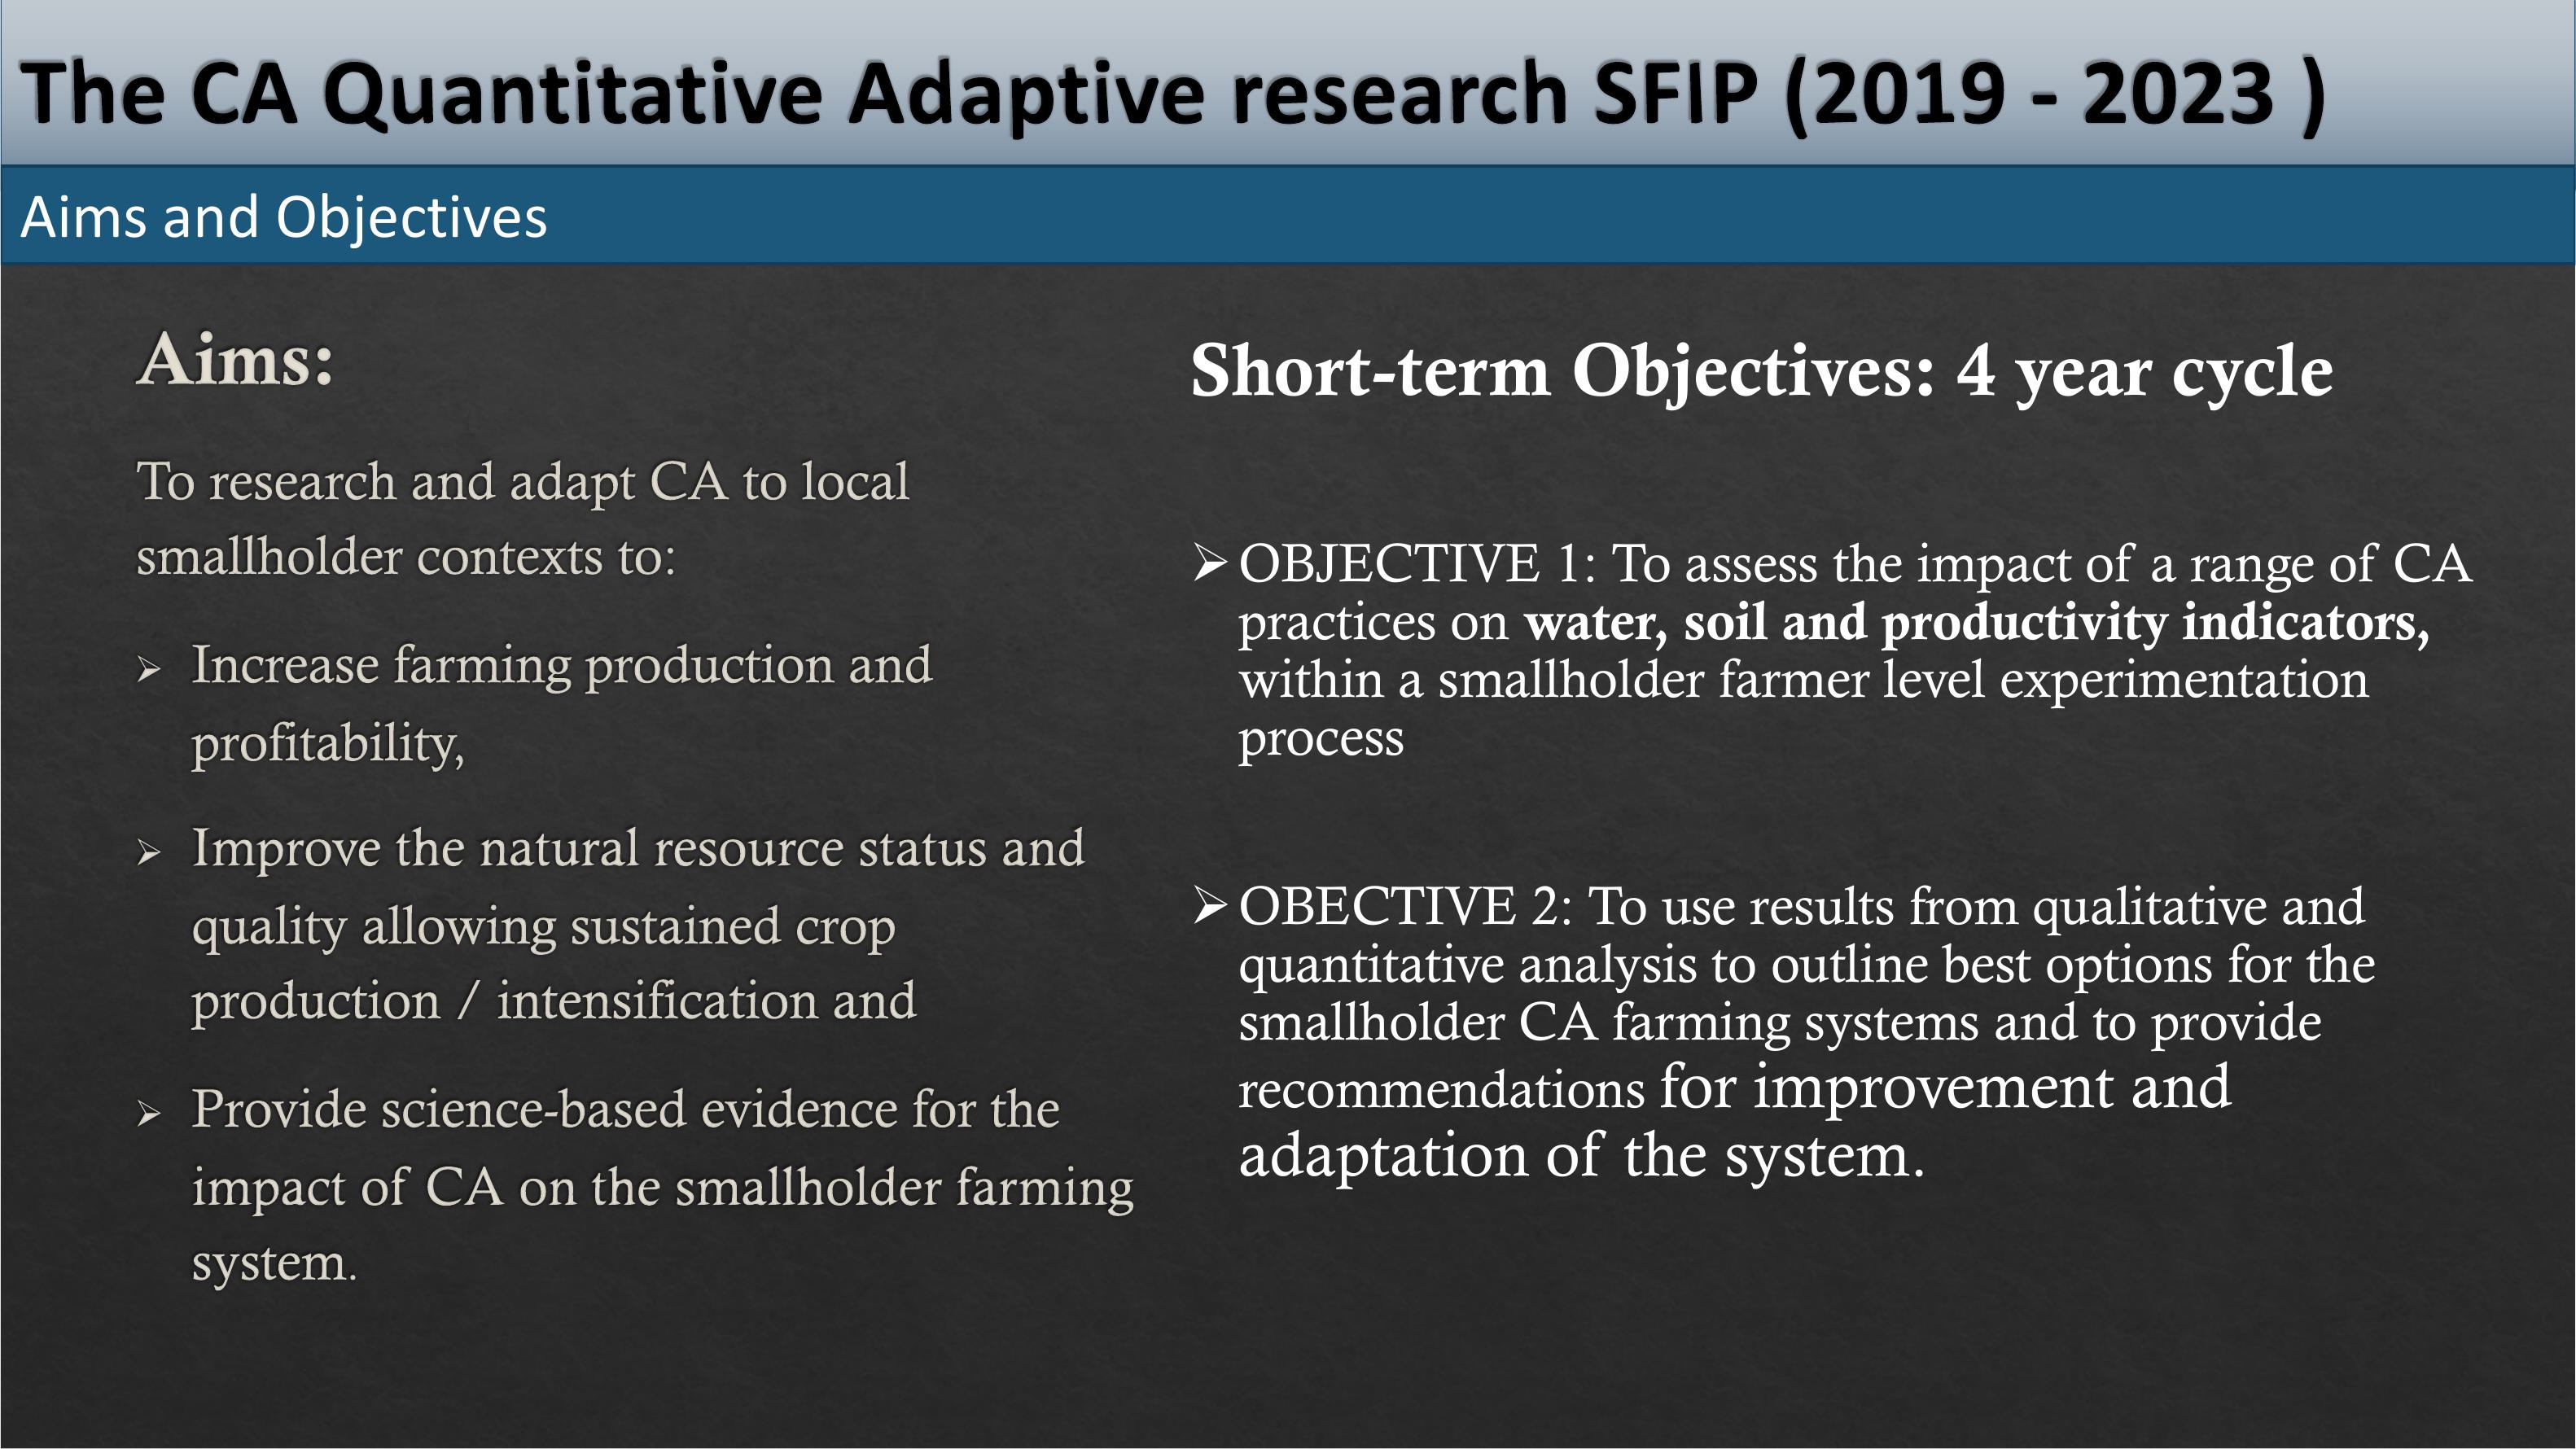
Aims and Objectives
Short-term Objectives: 4 year cycle
ØOBJECTIVE 1: To assess the impact of a range of CA
practices on water,soilandproductivityindicators,
within a smallholder farmer level experimentation
process
ØOBECTIVE 2: To use results from qualitative and
quantitative analysis to outline best options for the
smallholder CA farming systems and to provide
recommendations for improvement and
adaptation of the system.


Context Climate change impact on Agriculture -Water
CC IMPACTS
- Hotter
-Droughtpronewith
higher evaporative
demand
-Extreme events;storms,
hail, floods, drought,
heat.
NombonoDladla’sfield after hailstorm 1stFeb2023

Collaboratively managed trials (CMTs) -
2020/23
10x10 blocks
Strip cropping
Perennialfodderstrip

BLOCKS
(10x10m) x
10 plots
1
M
2
M+B
3
SCC
4
M
5
M+B
10
M+CP/
Pk
SCC
8
M+B
7
M
6
SCC
Strips
(2mx50m)
x10 strips
1
M
2
M+B
3
SCC
4
M
5
M+B
6
SCC
7
M
8
M+B
9
SCC
10
M+CP/Pk
Fodder
Strips
(2mx50m) x
8 strips
SSM:
PAN4A128/
SC701
SSM
B/WCC
relay
SSM
Lespedeza
SSM
Tall
Fescue
SSM
B/WCC
relay
FENCED
TRIALS
-500m2
(
10mx10m)x5
Compared to
normal blocks
Tokeepallstover
–
zero grazing
REMEDIAL
TRIALS
–
1000m
2
Limed and
ploughed
contours and
swales
Dense planting of
cover crops
Tocorrect‘bad’
soils that are not
improving


Water:
1.Rainfall (rain gauges, weather stations,
SAEON)
2.Run-off (run-off pans)
Soil:
1.Bulk density (field measurements)
2.Soil health (Haney tests–Soil Health
Solutions) –ND in 2022/23
3.Nematodes (Indices– NWU)-ND in
2022/23
Productivity
1.Water productivity (soil data- CEDARA),
yield data- MDF)
2.Yields (Maize, beans, cover crops)
Laboratory analysis for water productivity - grain
Bulk density ring samplingRun-off plot

Measurements
-2021-2023 annual rainfall higher than the historical mean of 1 392mm/annum
-Weathervariabilityquiteextreme:includinglateseasononset,flooding,hailstormsandheatwaves
-Substantial impact on crop production and yields: Roughly 20% reduction in yields, increased disease
pressure, new weeds and pests
Rainfall - SAEON
Oc tNov DecJan Feb Mar Apr Total
Rainfall 2019/20(mm)131172.6143.599.1 86.1 49.2 17.7699.2
Rainfall 2020/21(mm)103.4207204.7 409.2 197.1 101.6481271
Rainfall 2021/22(mm)88.196.2229.4 349.9 211.3 256.4 266.11497.4
Rainfall 2022/23(mm)111.8 210.7 372.5 265.9 267.9 166.115.0 1409.8
0
200
400
600
800
1000
1200
1400
1600
MM RAINFALL
Monthly rainfall averages 2019-2023

The mean annual
temperature has been above
the historical (1951 - 1980)
mean, and has been greater
than the mean by more than
0.5⁰C each year with 2015
and 2019 being more than
1.5⁰C warmer than the
historical mean average
temperature.
Measurements Temperature_SAEON

Measurements Heatwaves-SAEON
All years in the current period
have experienced at least two
heat waves.During the current
period of monitoring, nine heat
waves occurred during 2019,
seven heat waves in both 2013
and 2018 and six heat waves in
2015.
CA controlCA trial
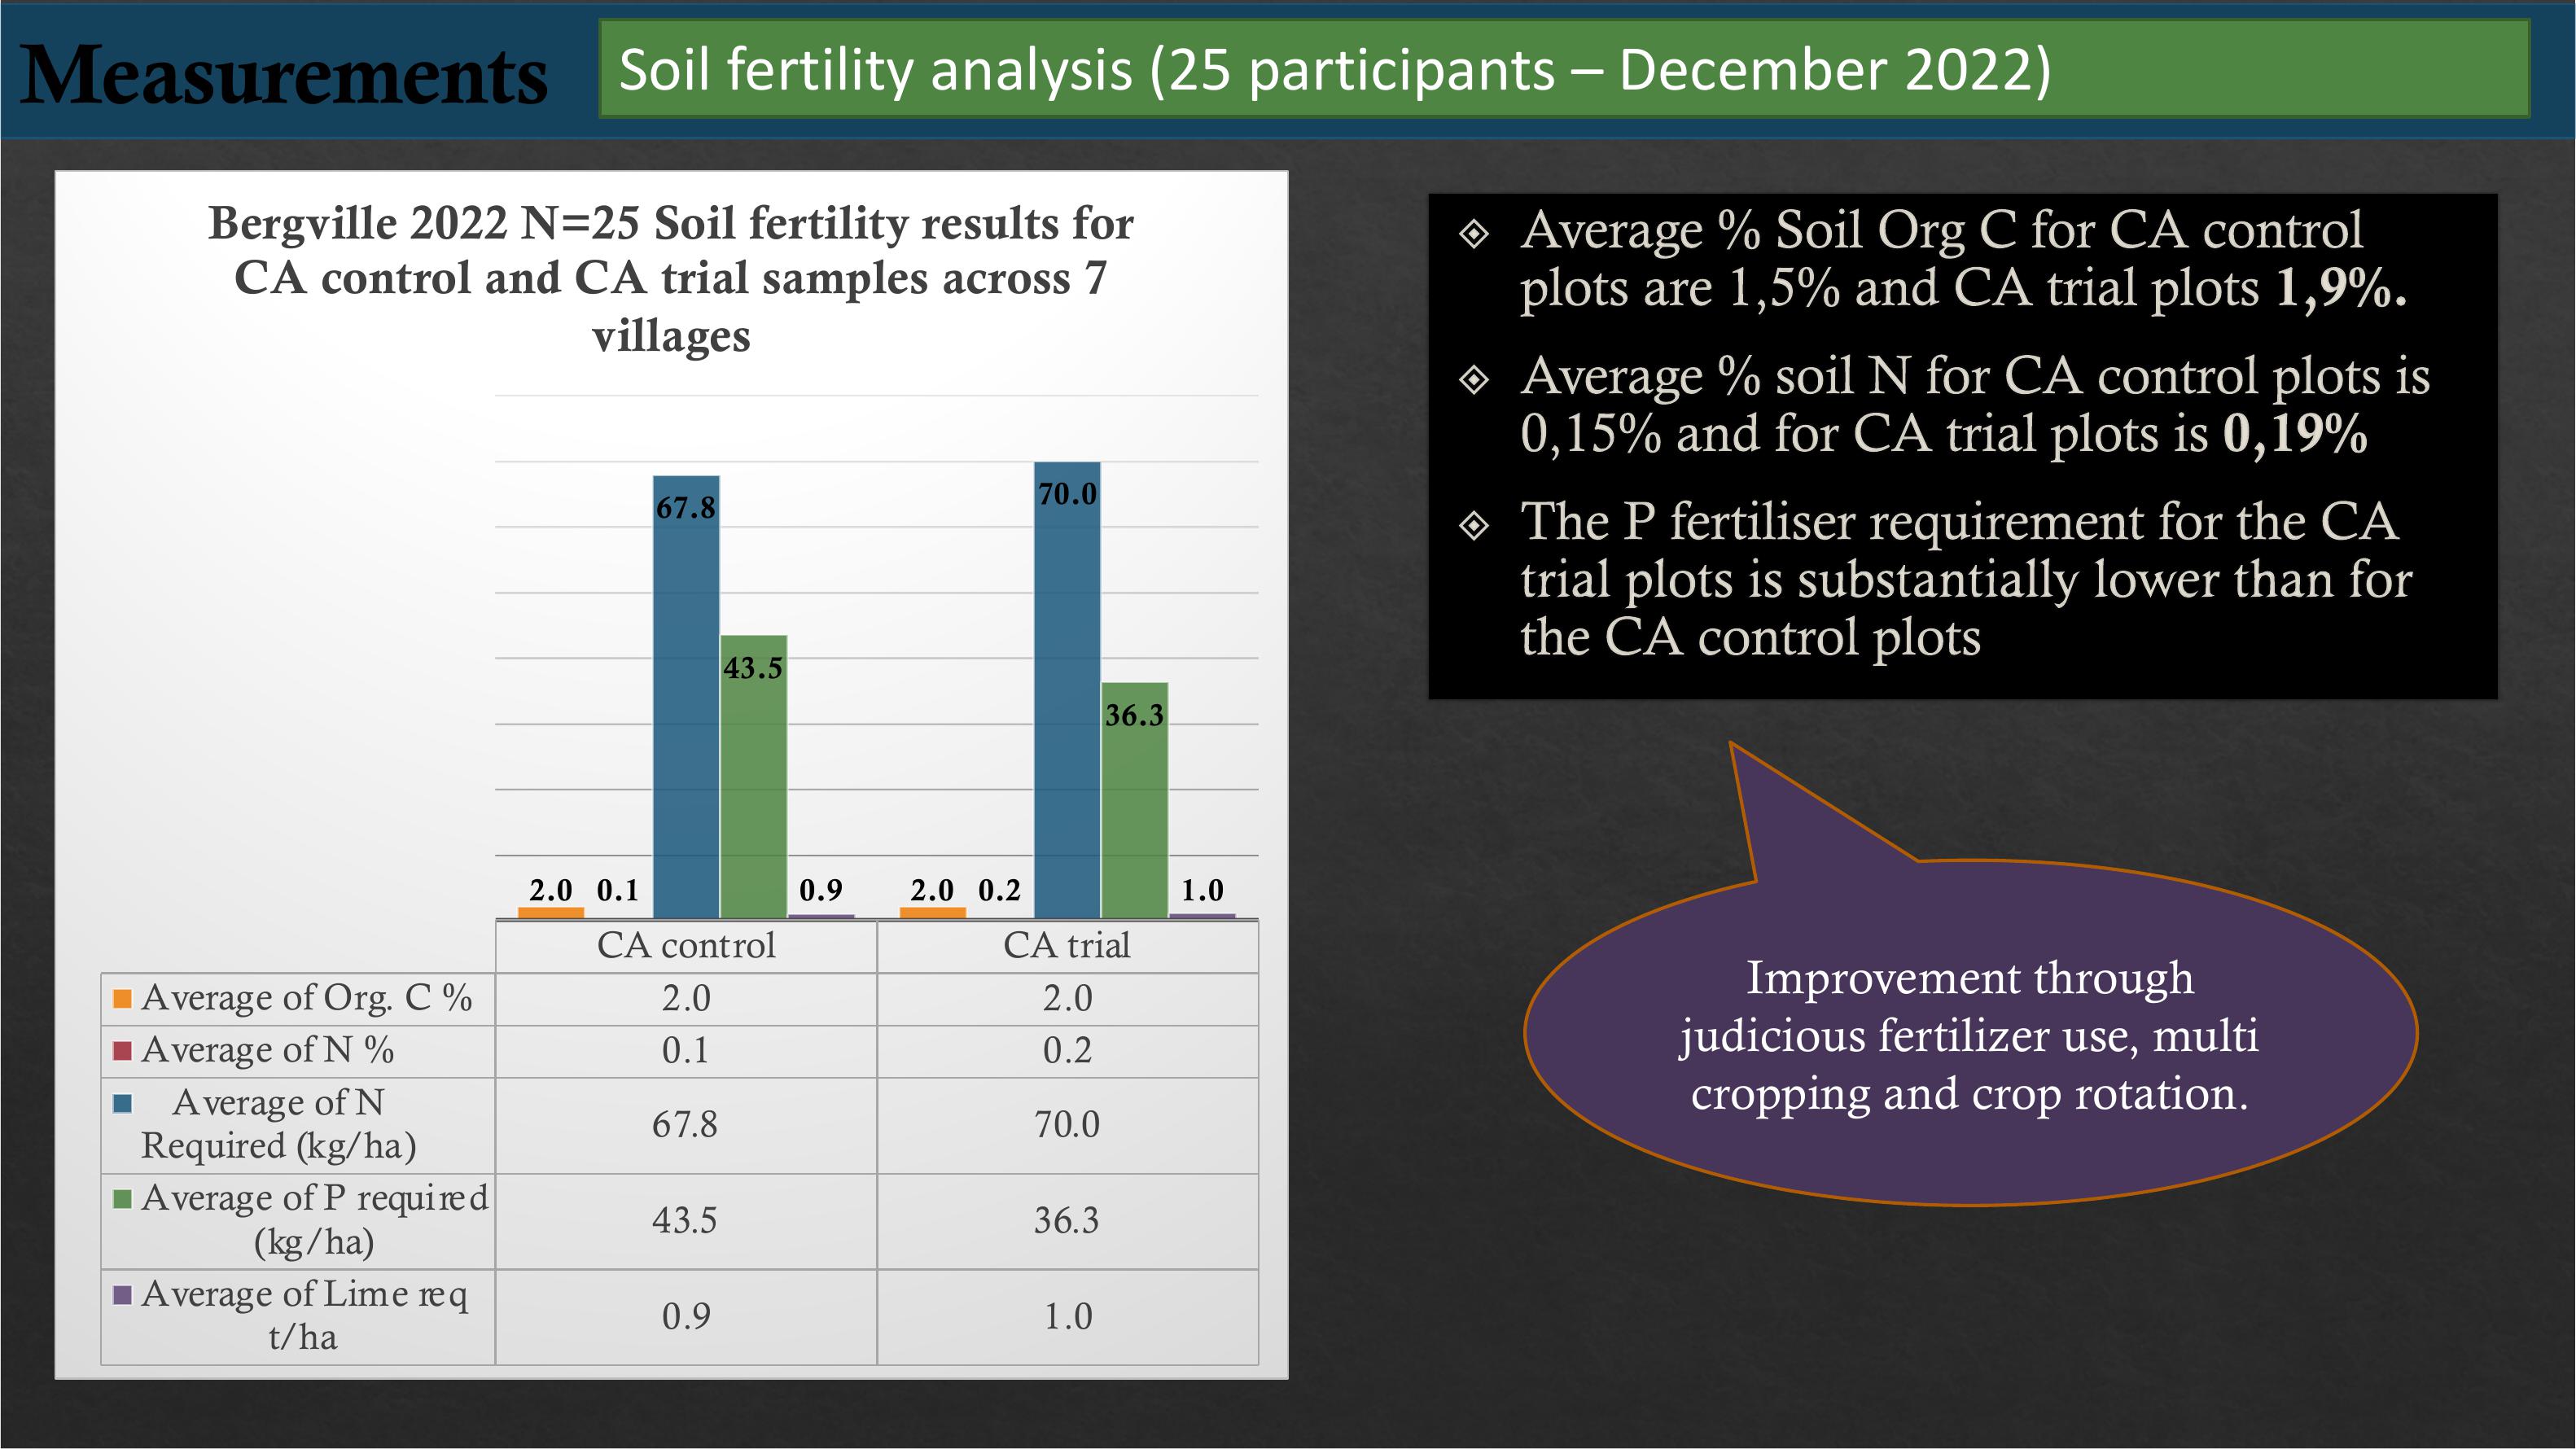
AverageofOrg.C%2.0 2.0
AverageofN%0.1 0.2
AverageofN
Required (kg/ha)67.8 70.0
AverageofP required
(kg/ha) 43.5 36.3
AverageofLimereq
t/ha 0.9 1.0
2.0 2.00.1 0.2
67.8 70.0
43.5
36.3
0.9 1.0
Bergville 2022 N=25 Soil fertility results for
CA control and CA trial samples across 7
villages
Measurements Soil fertility analysis (25 participants – December 2022)
Improvement through
judicious fertilizer use, multi
cropping and crop rotation.

Right: Crop monitoring inEzibomvini(24 Jan 2023)
Above: Maize for farmer 1 showing heat stress
Below: Maize and cover crops for farmer 2, in the
next-door homestead, on the same day.
WHY THE DIFFERENCE?
Observations Midseason dry spell - heatwave
- Innate soil qualities
-Increased soil organic matter
-Increased nitrogen
-Improved canopy cover
Org. C %
N %
pH
Clay %
Farmer 1
1,6
0,15
4,9
27
Farmer 2
2
0,19
5,1
43

-Bulk density for multi-cropped plots is lower than the mono-cropped maize for
all 5 seasons measured.
-Bulk density for the conventionally tilled maize only plots is higher than the
CA maize only control plots for 3 seasons of measurement
Measurements Bulk density
Bergville
ρb(g/cm3)
2018
/
19
2019
/
20
2020
/
21
2021
/
22
2022
/
23
CA
multi
cropped
plots
combined
1,261,291,12 1,14
1,15
CA
control(M) 1,361,401,23 1,26
1,27
Conventional
control
(M)
1,30 -1,24 -
1,36
Above:Bulk density sampling at Phumelele Hlongwane in Ezibomvini
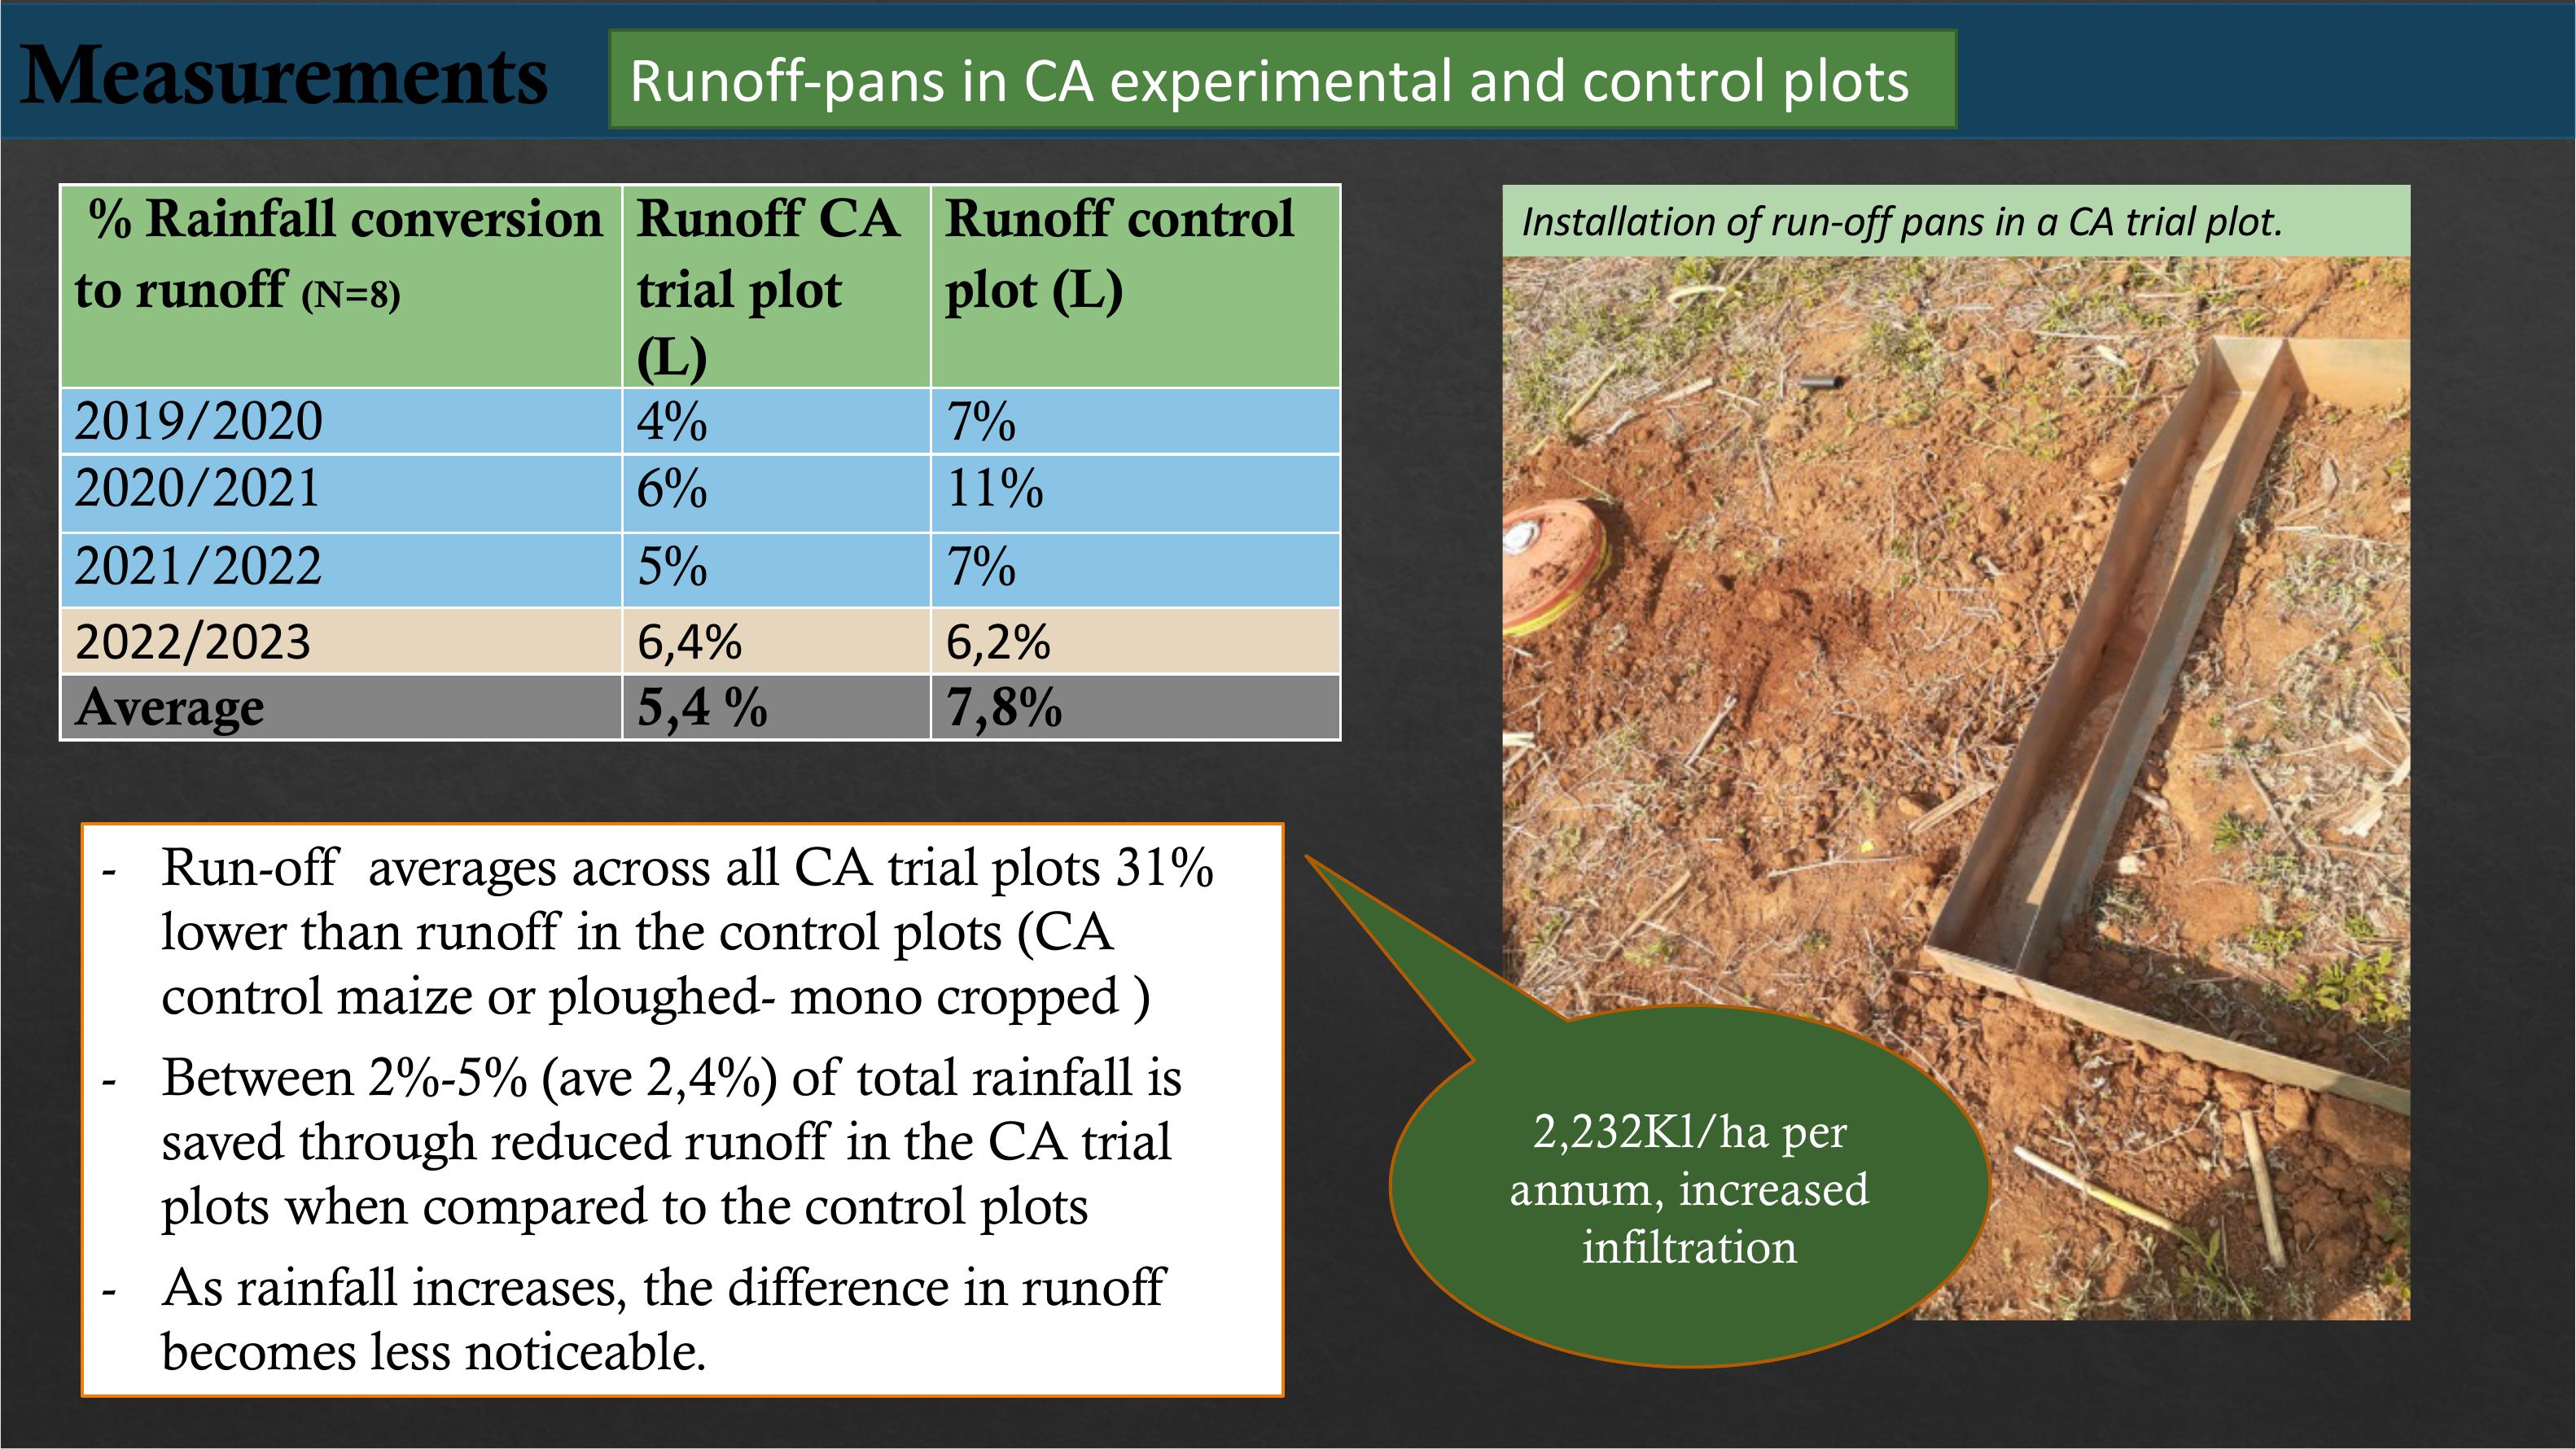
-Run-off averages across all CA trial plots 31%
lower than runoff in the control plots (CA
control maize or ploughed- mono cropped )
-Between 2%-5% (ave2,4%) oftotal rainfall is
saved through reduced runoff in the CA trial
plots when compared to the control plots
-As rainfall increases, the difference in runoff
becomes less noticeable.
Measurements Runoff-pans in CA experimental and control plots
% Rainfall conversion
to runoff
(N=8)
RunoffCA
trial plot
(L)
Runoffcontrol
plot (L)
2019
/2020
4
%
7
%
2020
/2021
6
%
11
%
2021
/2022
5
%
7
%
2022
/2023
6
,4%
6
,2%
Average
5
,4 %
7
,8%
2,232Kl/ha per
annum, increased
infiltration
Installation of run-off pans in a CA trial plot.

Measurements and results
Waterproductivityfieldcropping
•WaterproductivityforCAmaizegrownasanintercropwithbeansorcowpeasishigherthansingle
cropped CA maize and
•WaterproductivityforCAplotsissignificantlyhigherthanconventionallytilledplots.
•Similar trends across all 4 seasons, including annual increase in WP for all treatments
Cropping
options(BERGVILLE)
WP
(kg/m3)
Ave
WP(
4
seasons)
2019
/20(n=9)
2020
/21(n=11
)
2021
/22(n=8)
2022
/23(n=9)
CA
– Maize(M)
1
,11 2,28
2
,64
2
,09
2
,03
CA
- Maize,beanintercrop(M+B)
1
,21
2
,50
3
,07
3
,38
2
,54
CA
- Maizecontrol(M)
0
,80
1
,10
1
,42
1
,54
1
,22
Conventionally
tilledmaize(M)
20
,36 0,75
2
,1
1
,07
WP formaizegrownina multi-
cropping rotation CA system is
muchhigher(x2)thanCA mono-
cropped maize or conventionally
tilled maize

Measurements and results
Volumetricwaterbenefitfieldcropping
CA trial (inter
cropping)
CA control
(mono cropped
M)
Conv control
(mono cropped
M)
kg/m3 (WP)
2,54 1,221,07
Difference (CA trial
-CA
control
- Conv control)
1,32 0,15
Volumetricwater
difference (l/kg)
1 320150
Yield(t/ha)
5,30 1,8
VWB(l/ha) 2022/23
6996 000270 000
VWB (l/ha) 2021/22
8840 300344 400
Volumetricwaterbenefitfor
intercropped and rotated CA plots is
~7 million litres/ha more than
conventional tillage and for mono-
cropped CA plots is ~0,3 million
litres/ha more.

On average the CA
block trial plots
produce 2t/ha more
maize than the control
plots (CA and
conventional)
and the CA strip
trial plots produce
3t/ha more.
CACA-stripCA controlConv control
2020/21 3.12 4.372.1
2021/22 4.39 5.85 2.87
2022/23 4.53 5.331.82.46
0
1
2
3
4
5
6
7
T/HA
Comparison of maize yield per treatment; 2020-
2023
1
1
1
1
2
2
Comparison of yield pairs: Tukey
-Kramer
Mean difference
p
-value
Strip
- CA control
3,531
<0,0001
Strip
- Conv control
2,868
<0,0001
CA
- CA control
2,734
<0,0001
CA
- Conv control
2,070
0,0028
Maximum yields have
increased from 6,7 t/ha to
13,6 t/ha between 2014
and 2023.
Productivity: Yields (Bergville

MM+B M+CP M+P
CA 3.80 5.17 6.09 5.15
CA control1.80
Conv control2.46
Strip 4.44 6.136.06
0.00
1.00
2.00
3.00
4.00
5.00
6.00
7.00
t/ha
Maize yields for monocropping and
intercropping after a 3 year period
Impact of
intercropping on yield
improvement of
maize is clear
Bergville yields continued

Higher average
yields for CMTs
vs FMTs – not
statistically
significant
No incremental
annual increase in
yield based on years
under CA
1
1
1
1
2
2
CMT Ave yrs under
CA FMT Ave Yrs
under CA
CA-Blocks Average of yield
(t/ha) 4.84 84.03 5
CA control Averageof yield
(t/ha) 1.51 81.51 5
Conv control Averageofyield
(t/ha) 2.79 72.14 5
CA-Strips Average of yield(t/ha)5.34 65.32 5
TotalaverageYield (t/ha)4.59 3.91
0.00
1.00
2.00
3.00
4.00
5.00
6.00
7.00
8.00
9.00
T/HA AND YRS
CMT vs FMT maize yields, linked to period under
CA. Bergville (n=75)
Stabilization of
yields after 2nd-3rd
yeardespitevery
difficult climatic
conditions
Productivity: CMTs vs FMTs linked to years under CA

Species
Moisture %
NDF %
ADF %
Quality
Protein %
Quality
Lespedeza (Cut Feb)
39,02
67,13
4,59
Verybad
10,31
Good
Lespedeza (June regrowth)
25,64
40,42
32,77
Good
4,84
Poor
SCC (Mature, still green)
54,07 59,09
36,56
Moderate
10,49
Good
SCC (dry, seeded)
47,28
38,65
27,79
Verygood
4,73
Poor
Beans (full plants with seed)
58,27
46,40
36,49
Moderate
16,73
Verygood
Beans (dry stover, no seed)
10,13
34,17
26,02
Verygood
8,94
Good
Maize (dry stover)
18,16
39,07
20,92
Verygood
5,90
Maintenance
Veld(CutFeb
- green) 51,88
78,76
45,50
Verybad
5,08
Maintenance
Veld(CutMay
- June- dry) 11,27
40,36
23,06
Good
7,12
Moderate
Veldhasmoderate
potential for
maintenanceofanimals
Lespedeza provides
high protein levels but
is not that palatable.
Regrowthlower
protein levels.
Bean stover with or
withoutseed hasthe best
feed value
SCC should be cut and
fed while green for
best protein value and
moderate togood fibre
Measurements
Foddernutrientanalysisforveld,and stoverMarchandJuly2023

