
1
APPENDIX: BERGVILLEANNUALPROGRESS
REPORT
CA FarmerInnovation Programme for
smallholders in Bergville
Period: October 2017 – September2018
Farmer Centred Innovation in Conservation Agriculture
in upper catchment areas of the Drakensberg in the
Bergville region of KwaZulu-Natal
Compiled by:
Erna Kruger, Phumzile Ngcobo and Hendrik Smith
September 2018

2
Project implemented by:
Mahlathini Development Foundation
Promoting collaborative, pro-poor agricultural innovation.
Contact:Erna Kruger (Founder and Coordinator)
Address: 2 Forresters Lane, Pietermaritzburg, 3201, KZN
Email: erna@mahlathiniorganics.co.za, info@mahlathini.org
Cell: 0828732289
Time of operation: 2003-2016
Legal status: NPC
BEE status: 4. – Certificate available.
In collaboration with:
Funded by:

3
IDENTIFICATION OF THE PROJECT............................................................................................................5
DESCRIPTION AND SELECTION OF STUDY AREAS........................................................................................................5
APPROACH AND METHODOLOGY.............................................................................................................. 5
KEY ACTIVITIES: OCTOBER 2017-SEPTEMBER 2018.............................................................................. 6
FINANCIAL REPORTING ..................................................................................................................................7
PROGRESS............................................................................................................................................................9
LOCAL FACILITATORS............................................................................................................................................11
RESULTS ACHIEVED TO DATE..................................................................................................................12
CA PRACTICE.....................................................................................................................................................14
Year 1(1st level) trial outlines....................................................................................................................14
Year 2 (2nd level) trial outlines..................................................................................................................14
Year 3 (3rd level) trial outlines...................................................................................................................15
RAINFALL DATA ............................................................................................................................................15
INFILTRATION...............................................................................................................................................16
Stulwane .....................................................................................................................................................17
Eqeleni ........................................................................................................................................................18
Ezibomvini ..................................................................................................................................................19
Challenges and Solutions..........................................................................................................................19
VISUAL SOIL ASSESSMENTS ........................................................................................................................20
SOIL FERTILITY AND SOIL HEALTH ...............................................................................................................21
SOIL FERTILITY....................................................................................................................................................22
BULK DENSITY....................................................................................................................................................22
SOIL HEALTH TEST RESULTS..................................................................................................................................24
FARMER CENTRES .......................................................................................................................................25
VSLAS ...........................................................................................................................................................26
Progress of VLS Groups .............................................................................................................................26
Mphelandaba VSL Group, Ndunwana.......................................................................................................27
Mbalenhle Group: Stulwane ......................................................................................................................28
TRENDS FOR LONGER TERM SMALLHOLDER PARTICIPANTS IN THE CA FIP ...............................................30
THE CONSERVATION AGRICULTURE SYSTEM.......................................................................................................32
CROP ROTATION...............................................................................................................................................33
INTERCROPPING................................................................................................................................................33
COVER CROPS....................................................................................................................................................33
CROP VARIETIES................................................................................................................................................34
PLOT LAYOUT AND SPACING...............................................................................................................................34
Eqeleni........................................................................................................................................................35
Stulwane.....................................................................................................................................................38
SOIL FERTILITY ANALYSIS..................................................................................................................................39
CASE STUDY_NELISIWE MSELE;STULWANE............................................................................................................42
CASE STUDY PHASAZILE SITHEBE:STULWANE.........................................................................................................43
CASE STUDY LETIWE ZIMBA:NDUNWANA................................................................................................................44
YIELDS IN INTERCROPPED AND ROTATED PLOTS ........................................................................................46
COVER CROPS ..............................................................................................................................................48

4
Winter cover crops.....................................................................................................................................50
YIELD SUMMARIES.....................................................................................................................................52
PROGRESS PER AREA OF IMPLEMENTATION.........................................................................................53
STULWANE.........................................................................................................................................................53
Yields ..........................................................................................................................................................55
NDUNWANA........................................................................................................................................................58
Yields ..........................................................................................................................................................59
MAGANGANGOZI.................................................................................................................................................60
EQELENI............................................................................................................................................................61
Eqeleni yields.............................................................................................................................................62
ISSUES, COMMENTS AND SUGGESTIONS ....................................................................................................65

5
Identification of the project
Description and selection of study areas
Work in the Bergville (KwaZulu-Natal) site continued with the 17 village learninggroups brought
on board in the 2016-2017 season. Attention has been given to consolidating and expanding the
learning groups within each village. In this way the numbers of farmer participants in farmer level
trials have increased from 263 inthe 2016-2017 season to 322this season. The overall area for
trials has increased from 13ha to 17 ha.
Approach and Methodology
The farmer centred innovation systems research process underpinning the programme, which is
based on working intensively with farmer learning groups and local facilitators in each of the
villages, has been continued and strengthened.
Within the learning groups farmer innovators volunteer to set up and manage farmer-managed
adaptive trials as the ‘learning venues’ for the whole learning group. Farmer Field School
methodologies are used within the group to focus the learning on the actual growth and
development of the crops throughout the season. New ideas are tested against the ‘normal’
practise in the area as the controls. Farmers observe, analyse and assess what is happening in the
trials and discuss appropriate decisions and management practices. Small information provision
and discovery-learning (training) sessions are included in these workshops/ processes. These are
based also on the seasonality of the crop and the specific requests and questions from farmer
learning group participants.
Local facilitators are chosen from within and by members of the learning group to be a person
who has the required experience, knowledge and a willingness to support the other farmer
innovators in their implementation. Facilitators are only chosen and appointed where people
with the appropriate skill and personality exists. Local facilitators receive a stipend for a
maximum of 10 working days per month, for their support to the farmer innovators. They fill in
detailed timesheets outlining their activities against which they claim a monthly stipend.
Learning group members agree to a season long learning process and put forward the farmer
innovators to run the trials. Each prospective innovator is interviewed and visited and signs an
agreement with the Grain SA team regarding their contribution to the process. They undertake to
plant and manage the CA trials according to the processes and protocols introduced as well as a
control plot of the same size. For the latter, farmers provide their own inputs.
The adaptive trials are also used as a focus point for the broader community to engage through
local learning events and farmers’ days.Stakeholders and the broader economic, agricultural and
environmental communities are drawn into these processes and events. Through these events,
Innovation Platforms (IPs)are developed for cooperation, synergy between programmes and
development of appropriate and farmer-led processes for economic inclusion. These IPs also
provide a good opportunity to focus scientific and academic research on the ‘needs’ of the process.
In this season (2017-2018) the project has continued to focus on the following elementsof the
model, namely:
a)Support farmers who are in their 1st, 2nd , 3rd , 4th and 5th seasons,

6
b)Conscious inclusion of crop rotation to compare with inter cropping trials,
c)Inclusion of summer cover crops in the crop rotation trials,
d)Continuation with experimentation with winter cover crops, but planted in separate
plots rather than in-between maize,
e)Planting of late season beans,
f)More focussed introduction of lab-lab beans and,
g)Initiation of nodes for farmer centres that can offer tools, input packs and advice,
h)Support for existing VSLAs and initiation of new savings groups where requested,
i)Conscious inclusion of the local facilitators in the crop and progress monitoring
processes,
j)Further supply of tools (MBLI planters, animal drawnplanters and knapsack
sprayers) to learning groups.
Key activities: October 2017-September 2018
For this season a process of consolidation of existing learning groups has been the focus, along
with implementation of the co-funded process from LandCare. Support here hasprimarily been
in the form of implements, but also some seed and for hosting of farmers’ days.
Researcher-managed trial plots have now been set up in Ezibomvini, Eqeleni and Mhlwazini to
work on quantitative benchmarking of some of the visual CA indicators being used in this process.
This includes rain gauges, run-off plots, a weather station, gravimetric soil sampling and use of
infiltrometers for measurement of water infiltration;with the intention of comparingwater
balances across control and CA trial plots. In addition, visual soil assessments have been
conducted for 15selected participants and soil health samples have been takenfor 9 participants
across four villages, along with 42 soil fertility samples for new participants and 30 repeat
samples for existing participants to build a body of information about the soil fertility and soil
health status of the CA trial participants.
A survey has been conducted for 4thand 5thyear participants to gauge the implementation and
adaptation of CA in their farming systems and to ascertain potential sustainability going forward.
As in previous years intensive growth monitoring has been done for a selection of trials and yield
measurements taken for as many of the participants as possible.
Two stakeholder innovation platform events/ farmers’ days have been conductedin Emmaus and
Ndunwana respectively. Three cross visits have been hosted; one for the Growing Nations team
from Lesothoin collaboration with KZN DARD, one for the mentorsand coordinators for the Grain
SA FDP and one for ateamof researchers fromthe ARC SGI in Potchefstroom.CA participants
have been included in a cover crop learning event hosted jointly between KZN DARD and the No-
till Club. A number of awareness days were held in the villages of Ezibomvini, Eqeleni and
Thamela. These proved to be fruitful as the importance of practices undertaken were emphasized.
These were not only attended by farmers who are participants of the programme but various
stakeholders including the local and provincial departments of agriculture, various NGO’s and
local traditional authority leadership.
Three articles have been written for the SA Grain magazine and papers have been written and
accepted for presentation at two conferences: 2ndAfrica Congress on Conservation Agriculture

7
(9-12 Oct2018) and the 8thBiennial LandCare Conference (25-27 Sept 2018). In addition, co-
facilitated and presented at a workshop; Conservation Agriculture-Principles in Land
Rehabilitation for the 2018 conference of the Land rehabilitation Society of Southern Africa (13-
16 Aug 2018).
Village Savings and Loan Associations (VSLAs) have increased from 12 to 16 groups, with 208 of
the participants involved. A total of R335 664.00 has been saved by these groups in this year.
Progress for the farmer centre in Ezibomvini has been monitored. The centre now operates
independently of support.
Financial reporting
Below is a summary of the key result areas and budgets provided under the 2017-2018 project
cycle.
Table 1: Bergville SFIP budget outline for 2017-2018
Bergville Milestones: Farmer Centred Innovation in CA. October 2017- November 2018
Milestones/
Outputs
Key activities
OUTCOMES/ DELIVERABLES
Budgets
Capital
Equipment
Incl soil samples, knapsack sprayers
and planters
R38 752,00
Farmer
experimentation
Bergville
Administration
and sundries
Travel ,accommodation, admin,
manuals etc
R94 160,00
Farmer centred
innovation
systems
Farmer experimentation, savings
groups, monitoring, review
R525 898,00
Innovation
platforms
Stakeholder meetings,platform
building and events
R15 000,00
Sub - TOTAL: Oct2016-Sept2017
R673 810,00
Expenditure by MDF has followed the key activities above. Regarding capital equipment and
Farmer Experimentation, a few modifications were made, given the co-funding that was received
through the KZNDARD Land Care programme (R245 750) and the payment of subsidies by
farmers (R23 865). This provided for increased budgetary allowances and thus also meant
savings on capital equipment of around R10 000, which has been used within the Farmer centred
innovations systems key activity area.
Expenditure on capital equipment and farmer experiments is detailed below.
Table 2: Expenditure on the Capital Items and farmer Experimentation portions of the budget; 2017-2018
Date
Inputs
Capital
equipment
Farmer
Experiments
Subsidies
paid by
farmers
2017/10/25
Cedara Soil samples x 140
R 12 600,00
2017/10/24
TWK Agri-Winterton
R 81 410,75

8
2017/10/24
TWK Agri-Winterton
R23 654,91
R 900,00
2017/10/27
Farmsave: Roundup
R2 795,00
R 10 140,00
2017/11/03
Cedara Soil samples
R 12,60
R 5 000,00
2017/10/20
Victoria Packaging; bags for input
distribution
R 755,03
R 3 000,00
2017/11/15
TWK Maize seed white
R1 701,20
R 4 000,00
2017/11/17
Build It Winterton; rain gauges
R 322,60
R 825,00
2017/11/17
TWK Winterton; polesfor
raingauges
R 78,50
2017/11/25
TWK Maize seed white
R548,60
2017/12/13
TWK Maize seed, RoundUp
R885,40
2018/01/15
Victoria packaging; packets
R 172,00
2018/01/24
Farmsave Bgvl Kemprin
R462,00
2018/02/06
Farmsave Bgvl Kemprin
R308,00
2018/02/06
TWK Agri; materials for run-off
plots
R 237,40
2018/03/06
TWK Agri - bags
R 37,20
2018/02/09
Food pack distributors- foil
R 339,72
218/04/04
Food pack distributors- buckets
R 190,67
2018/04/04
Victoria Packaging-bucket
R 37,98
2018/05/10
Victoria Packaging; mini grips
R 75,66
2018/05/14
Victoria Packaging; drums- VSAs
R 440,00
R 15 299,36
R 111 765,86
R 23 865,00
Total
R103,300,22
Budget _MT
Description
Amount
Budget -
KZNDARD
Land Care
Amount
Capital
equipment
Soil samples, tools, quantitative
measurements
R 38 752,00
Co funding
farmer
experiments,
capital
expenditure
R245 750,00
Farmer
experiments
Seed, herbicide, fertilizer
R 75 000,00
Total
R113 752,00
R245 750,00

9
Progress
The project is now operational across 17 villages in the Bergville area, with a total of 322learning
group participants and 226 farmer-level trials.
The basic experimental design was followedfor all 1st year participants and most of the 2nd year
participants as well. Variations have included crop rotation, intercropping, summer and winter
cover crop mixes, planting of lab-lab beans and late season planting of beans.
The table below outlines activities related to objectives and key indicators for the period of
October 2017 -September 2018.
Table 3:SUMMARY OFPROGRESS (OCTOBER 2017-SEPTEMBER 2018) RELATED TO OBJECTIVES AND KEYACTIVITIES
Objectives
Key activities
Summary of progress
% completion and comment
1. Document
lessons
learned
Documentation for
learning and
awareness raising
- Manuals, promotional
and learning materials
- Sharing of information
through innovation
platforms processes
- Grain SA promotional DVD used
in learning sessions and events.
- Shooting of CA implementation
DVDs with Bergville CA
participants

10
- Articles and
promotional material
- 5 farmers days, 3 cross visit
learning events with further
meetings and workshops
- 3 articles in the SA Grain
magazine, incl a case study for
Phumelele Hlongwane (Dec2017,
Jan 2018, Feb 2018), one article in
the Adaptation Network
newsletter (Jan 2018)
- 3 Papers for conferences
(100% completion)
Final report
-
- Annual report finalised.
(100% completion)
2. Increase
the
sustainability
and efficiency
of CA systems
1st level
experimentation:
farmers sue their
own practice as a
control – size 400m²
ha exp, 400m²
control,
Control. farmers
- 12 villages, 56 farmers
- Basic CA design- intercropping
with maize beans and cowpeas on
a 400m2 plot, with a control plot
managed entirely by the
participant.
- Adaptation trials included late
season planting of beans with a
mixture of winter and summer
cover crops.
(100% completion)
2nd level
experimentation:
existing farmers use
their own practice as
a control – size: size
400m² ha exp,
400m²
- 14 villages, 118
farmers
- Adaptation trials included late
season planting of beans with a
mixture of winter and summer
cover crops. Most participants
opted to continue with
intercropping practice from their
1st year.
(100% completion)
3rd level
experimentation;
own contribution,
larger plots, own
ideas
- 9 villages, 59 farmers
- Larger level plantings using oxen
drawn planters and including
cover crops. Intercropping still
practised. Awa crop rotation and
summer and winter cover crops.
(100% completion)
4th level
experimentation (inc
also participants
from 5th year); own
contribution, larger
plots, own ideas
-8 villages, 26
farmers
-Participants undertake their own
combination of experimental plots
that include intercropping, crop
rotation and cover crops (summer
awa winter).
(100% completion)
Develop and manage
PM&E framework; –
weekly and monthly
M&E visits
-M&E forms
redesigned and used
- Digital monitoring
system piloted
- Crop growth monitoring, VSA’s,
4th and 5th year participants
surveys and final reviews finalised
(100% completion)
Facilitation of
innovation platforms
-Co- facilitation of
information sharing
and action planning
with stakeholders and
role players
- 5 Farmers days, 3 cross visits,
numerous meetings and
workshops
(100% completion)
CA working group,
and reference group
- Attended in August
2018
- Maize trust presentation – July
2018
(50% completion)

11
Sharing of
information using a
range of innovation
platforms
-Attendance of a range
of meetings,
workshops, networking
events and planning
processes
- CCA processes linked to UKZN
and the WRC
- Meetings with DEA re CA
adaptation and mitigation
potential
- Networking meetings;
Prolinnova, Green fund,
-Student thesis inputs- Khethiwe
Mthethwa – UKZN RRM Honours,
Mazwi Dlamini – UWC PLAAS
Masters
- Making of participatory videos –
short videos detailing farmers’
perspectives and success stories
(100% completion)
A performance dashboard is indicated below. This provides a snapshot of performance according
to suggested numbers and outputs in the proposal.
Table 4:PERFORMANCE DASHBOARD;SEPTEMBER 2018
Outputs
Proposed (March 2017)
Actual (Sept 2018)
Number of areas of operation
2
2
Number of villages active
17
18
No of 1st level farmer experiments
27
82
No of 2nd level farmer experiments
80
125
No of 3rd level experiments
125
59
No of 4th level experiments
17
15
No of local facilitators
12
6
No of direct beneficiaries
270
322
VSLAs
11
14
Participatory monitoring and evaluation
process (farmer level)
Yes
Yes
The process of focusing on the existingvillageshas bolstered the learning group numbers and
most of the participants from last season (2016-2017) continued with their CA process. There
has been some attrition for the 3rd level experiments; some reasons given by participants include
inability to pay the subsidies and a wish to continue with CA without the intercropping
experimentation.
Local Facilitators
The involvement and responsibilities of the local facilitators are expanded upon each year and
this year saw substantial assistance in monitoring and yield measurements from the facilitators.
The two tables below summarises the facilitators involved and their activities.
Table 5: Bergville CA programme local facilitators
Village name
Name of local
facilitator
Activities
1.Ezibomvini
Phumelele Hlongwane
Planting, mobilization of group, collecting of
yield data

12
2.Eqeleni (lower)
Eqeleni (upper)
Simephi Hlatshwayo
& Ntombakhe Zikode
Planting, mobilization of group
Newly appointed-Planting, mobilization of
group
3.Stulwane
Nelisiwe Msele
Newly appointed-Planting, planting & crop
growth monitoring, weighing, group
mobilization
4.Okhombe
Nkosithandile Ndlovu
Planting, group mobilization
5.Vimbukhalo
Sbongile Mpulo
Planting, group mobilization
6.Emabunzini
Valindaba Khumalo
Planting, group mobilization
7.Mhlwazini
Mathula Mdladla
Planting, group mobilization
8.Ndunwane
Boniwe Hlatshwayo
Planting, group mobilization, planting & crop
growth monitoring, yield data collection
9.Thamela
Constance Hlongwane
Planting, group mobilization, yield data
collection
10.Ngoba
Thembelani
Hlongwane
Planting, group mobilization
11.Emazimbeni
Valindaba Khumalo
Planting, group mobilization
12.Magangangozi
Thulile Zondo
Planting, group mobilization
13.Emangweni-
Emaqeleni
Nkanyiso Hadebe
Planting, group mobilization
14.Thunzini
Nikiwe Hadebe
Planting, group mobilization
15.Nsuka
Busisiwe Khoza
Planting, group mobilization
Table 6: Description of activities
Activities
Description of activity
Planting
Assist learning group members with trial layout, fertilizer and
herbicide dosages and general planting duties.
Group mobilization
Organizing people for meetings or farmers days and general logistics
Yield collection
Assist with maize weighing, beans, cowpeas and cover crops (scc and
wcc)
Monitoring
Completion of forms for planting and crop growth monitoring
Results achieved to date
The framework for scaling out implementation included: Continuation with existing farmer
experimentation options for 1st, 2ndand 3rdlevel participants and mentoring and monitoring for
4thand 5thyear participants. This includes intercropping, crop rotation, late season planting of
beans and combinations of summer and winter cover crop mixes.
The table below outlines the villages, numbers of participants and experimentation processes for
the present learning groups in the Bergville area.
13
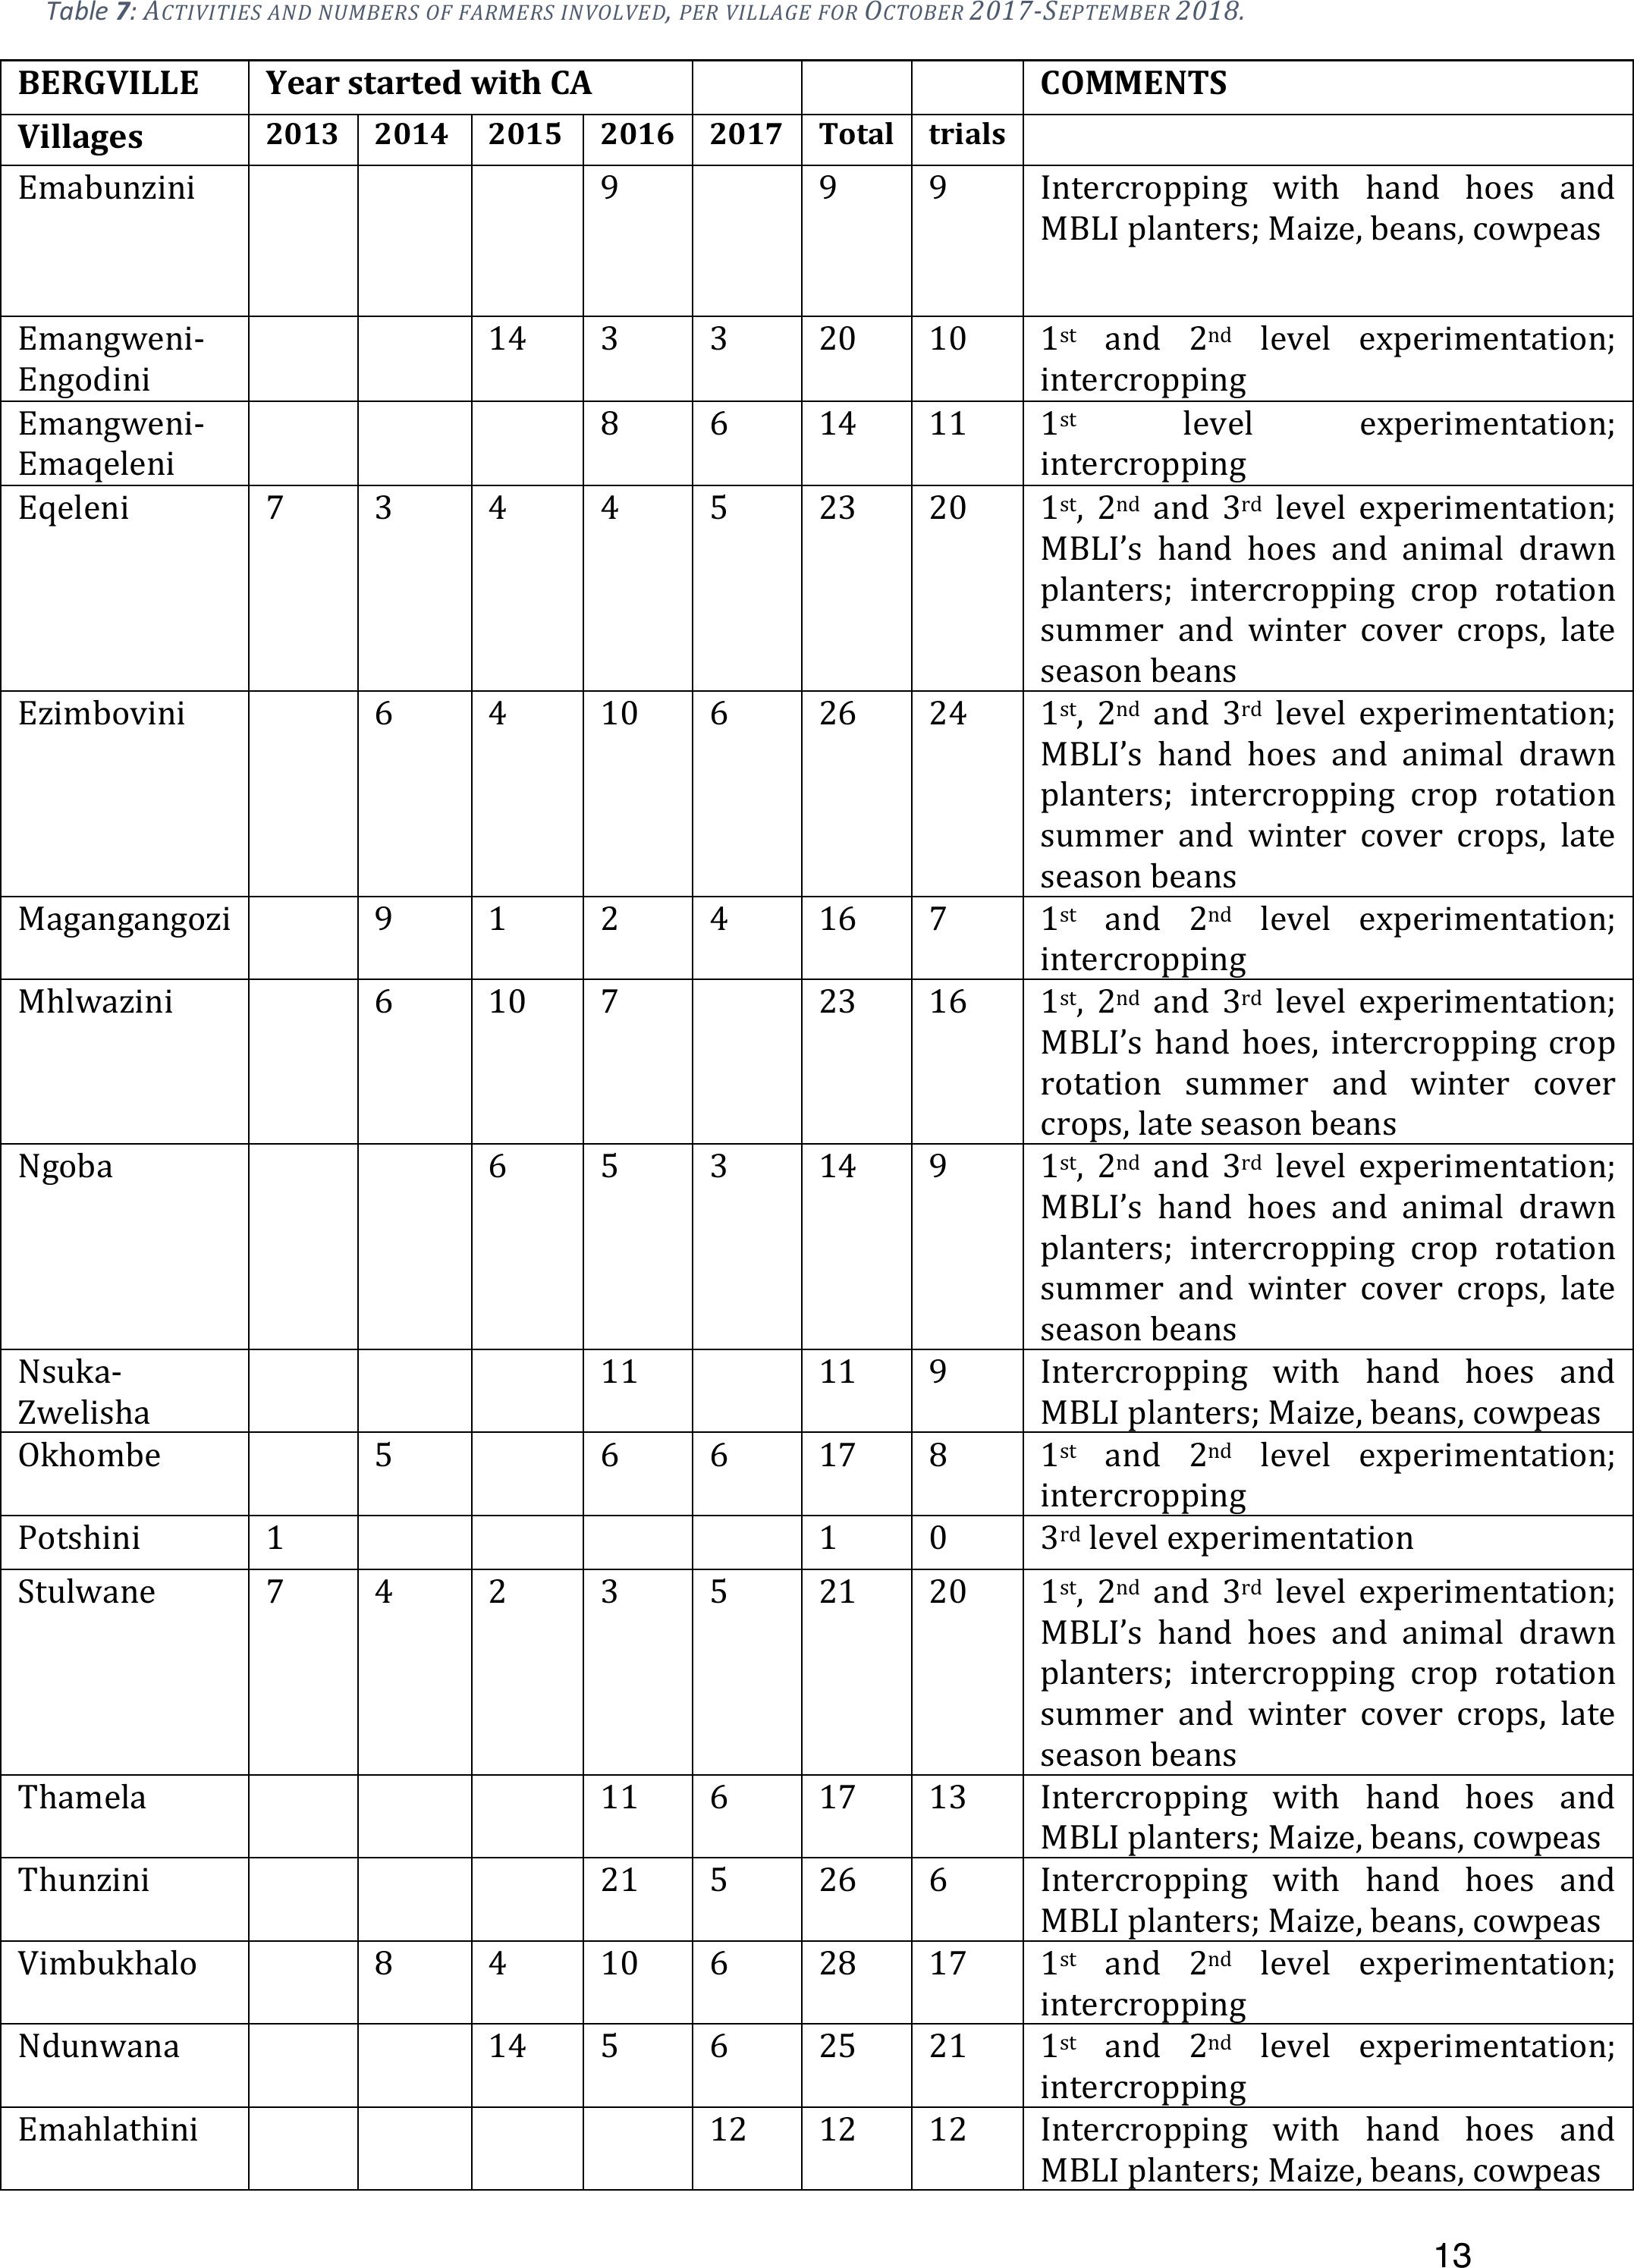
Table 7:ACTIVITIESAND NUMBERS OF FARMERS INVOLVED,PER VILLAGE FOROCTOBER2017-SEPTEMBER2018.
BERGVILLE
Year started with CA
COMMENTS
Villages
2013
2014
2015
2016
2017
Total
trials
Emabunzini
9
9
9
Intercropping with hand hoes and
MBLI planters; Maize, beans, cowpeas
Emangweni-
Engodini
14
3
3
20
10
1stand 2ndlevel experimentation;
intercropping
Emangweni-
Emaqeleni
8
6
14
11
1stlevel experimentation;
intercropping
Eqeleni
7
3
4
4
5
23
20
1st, 2ndand 3rdlevel experimentation;
MBLI’s hand hoes and animal drawn
planters; intercropping crop rotation
summer and winter cover crops, late
season beans
Ezimbovini
6
4
10
6
26
24
1st, 2ndand 3rdlevel experimentation;
MBLI’s hand hoes and animal drawn
planters; intercropping crop rotation
summer and winter cover crops, late
season beans
Magangangozi
9
1
2
4
16
7
1stand 2ndlevel experimentation;
intercropping
Mhlwazini
6
10
7
23
16
1st, 2ndand 3rdlevel experimentation;
MBLI’s hand hoes, intercropping crop
rotation summer and winter cover
crops, late season beans
Ngoba
6
5
3
14
9
1st, 2ndand 3rdlevel experimentation;
MBLI’s hand hoes and animal drawn
planters; intercropping crop rotation
summer and winter cover crops, late
season beans
Nsuka-
Zwelisha
11
11
9
Intercropping with hand hoes and
MBLI planters; Maize, beans, cowpeas
Okhombe
5
6
6
17
8
1stand 2ndlevel experimentation;
intercropping
Potshini
1
1
0
3rd level experimentation
Stulwane
7
4
2
3
5
21
20
1st, 2ndand 3rdlevel experimentation;
MBLI’s hand hoes and animal drawn
planters; intercropping crop rotation
summer and winter cover crops, late
season beans
Thamela
11
6
17
13
Intercropping with hand hoes and
MBLI planters; Maize, beans, cowpeas
Thunzini
21
5
26
6
Intercropping with hand hoes and
MBLI planters; Maize, beans, cowpeas
Vimbukhalo
8
4
10
6
28
17
1stand 2ndlevel experimentation;
intercropping
Ndunwana
14
5
6
25
21
1stand 2ndlevel experimentation;
intercropping
Emahlathini
12
12
12
Intercropping with hand hoes and
MBLI planters; Maize, beans, cowpeas

14
Emazimbeni
10
9
19
14
Intercropping with hand hoes and
MBLI planters; Maize, beans, cowpeas
Grand Total
15
41
59
125
82
322
226
17,4 ha trials; 13,4ha controls
322 Participants across 17 villages are still registered and have been implementing the CA trials
for between 1-5 seasons. This year 226 trials have been planted of whom 82participants started
this season for the first time.
CA practice
Going into the 3rdyear, thefarmer experimentation protocols for each level of farmer participants
has been more clearly defined, given that those farmers with more experience can now
incorporate some of their own learnings and preferences in the trials, but the 1stlevel trial
participants still need to get used to the overall CA planting process and thus the close spacing
intercropping trial plots are ‘prescribed’ for them.
The protocols are outlined below:
Year 1(1st level) trial outlines
Experimental design is pre-defined by the research team (based on previous implementation in
the area in an action research process with smallholders). It includes a number of different
aspects:
•Intercropping of maize, beans and cowpeas
•Introduction of OPV and hybrid varieties for comparison (1 variety of maize and beans
respectively)
•Close spacing (based on Argentinean model)
•Mixture of basin and row planting models
•Use of no till planters (hand held and animal drawn)
•Use of micro-dosing of fertilizers based on a generic recommendation from local soil
samples
•Herbicides sprayed before and/or at planting
•Decis Forte or Kemprin used at planting and top dressingstage for cutworm and stalk
borer
•Planting of cover crops; winter mix in Autumn
Experimental design includes 2 treatments; planter type (2) and intercrop (2)
Year 2 (2nd level) trial outlines
Based on evaluation of experiment progress for year 1, this includes the addition of options that
farmers choose from. Farmers also take on spraying and plot layout themselves:
•A number of different OPV and hybrid varieties for maize
•A number of different options for legumes (including summer cover crops)
•Planting method of choice
•Comparison of single crop and inter cropping planting methods
•Use of specific soil sample results for fertilizer recommendations
•Early planting and

15
•Own choices.
Year 3 (3rd level) trial outlines
Based on evaluation of the experimentation process to date this protocol includes issues of cost
benefit analysis, bulk buying for input supply, joint actions around storage, processing and
marketing. Farmers designtheir experiments for themselves to include some of the following
potential focus areas:
•Early planting; with options to deal with more weeds and increased stalk borer pressure.
•Herbicide mix to be used pre and at planting (Round up, Dual Gold, Gramoxone)
•A pest control programme to include dealing with CMR beetles
•Intercropping vs crop rotation options
•Spacing in single block plantings
•Use of composted manure for mulching and soil improvement in combination with
fertilizer, or singly.
•Soil sample results and specific fertilizer recommendations
•Planting of Dolichos and other climbing beans
•Summer and winter cover crops; crop mixes, planting dates, management systems,
planting methods (furrows vs scatter)
•Seed varieties; conscious decisions around POVs, hybrids and GM seeds
•Cost benefit analysis of chosen options and
•Farmer level monitoring of trials for selected individuals.
Rainfall data
Rain gauges have been installed across 5 villages. Therain gauges installed in Okhombe and
Emangweni were moved to other villages, as the participants there were not meticulous about
taking the rainfall records. Below isa small table that summarises the information. The
cumulative average rainfall for the area as recorded by the farmers was 563 mm between
December2017-May 2018.
Averages for Ezibomvini, Eqeleni,
Stulwane, Thamela and Ndunwana
Dec
Jan
Feb
March
April
May
Monthly rainfall (mm)
185
72,25
169,2
114,7
17
5
Mean (mm) per rainfall event
7,9
5,8
8,2
7,6
2,1
0,4
Max (mm) per rainfall event
60
30
30
20
1
3,5
An analysis of the rainfall patterns for January-February 2018 were done for Ndunwana as an
example of the rainfall distribution in these months.

16
Figure 1: rainfall data for Ndunwana for December 2017-January 2018
A few observations can be made from the two small graphs above
➢The number of rainfall events in December was 13 and in January 7
➢In each month one large rainfall event occurred; 60mm in December and 30mm in January
➢The average rainfall per event for December was 6mm and for January was 2,2mm
This indicates a high variability in rainfall with extreme events punctuated by small amounts of
rain which is unevenly distributed. This dry spell in the period of maturation of beans and maize
have had a detrimental effect on yields – more specifically for the beans.
Infiltration
Content for this section was supplied by the MDF intern Nonkhanyiso Zondi, who did the
infiltration tests, analysis and reporting.
Infiltration rates of water into the soil are expected to increase for the CA trial plots over time.
The assumption is that the pore continuity and pore size distribution are improved due to greater
structural stability and biological activity and thus saturated hydraulic conductivity and the plant
available water are greater under CA than conventional tillage.
The infiltration tests were done to assess the impact of CA on water infiltration in the soil.
Results from infiltrometer tests (single ring) from 2016-2017 season for 16 participants were
extremely varied and appeared unreliable. They were not reported on. For the 2017-2018 a
double ring infiltrometer was acquired and readings were taken for 13 participants.The
comparison of control and trial plots is somewhat artificial, given that a number of participants
have been practising CA on their control plots as well.
The results are presented below.
Table 8: Summary of water infiltration results for 13 participants in Bergville; 2017-2018
Village
Name and Surname
Yrs under
CA
infiltration rate
(mm/hr) control
infiltration
rate (mm/hr)
trial
Stulwane
Khulekani Dladla
5
587,4
531,4

17
Dlezakhe Hlongwane
5
226,2
423,8
Thulani Dlamini
5
422,7
450,0
Makhethi Dladla
5
226,6
587,4
Pasazile Sithebe
5
544,4
478,3
Cuphile Buthelezi
5
429,2
637,7
Ezibomvini
Phumelele Hlongwane
4
455,5
282,5
Cabangile Hlongwane
3
183,0
133,9
Eqeleni
Tholwephi Mabaso
5
218,8
250,8
Tombi Zikode
5
618,1
177,1
Smephi Hlatshwayo
5
434,8
218,8
In summary, infiltration results were higher and thus faster for the CA plots for only 5 of the 13
participants. Generally soils are hard, with high clay content and a lot of compaction and soil
crusting is still visible, in both the control and CA plots. Structural improvements in the soil cannot
be gauged using water infiltration as a proxy.
Below are some comments for a selection of the participants on the infiltration tests.
Stulwane
Phasazile Sthebe
Phasazile is on her 5thyear under the CA programme. Her soils
contain around 46-49% clay and are acidic with some addition of
lime in the CA plots, but not the control plots. Her soil pH is around
4 for both control and trial plots, but acid striation for the trial
plots (32%) is lower than the controls (44%. She has experienced
unsatisfactory, stunted and variable growth, although in this past
season growth in her trial plots has visibly improved.
Figure 2: Stunted maize in Phasaziles’ control plot.
The infiltration tests showed higher infiltration in her control
plots, which have been under CA for 3 years, than her trial plots.
The soils were similar with the only visible difference being that of
crop growth.
Makhethi Dladla
Makhethi is on her 5thyear under the CA implementation. She has hard soils, with visible crusting.
When her trial was monitored earlier on in the year, her field was suffering from stunted growth
and large patches of yellowing maize at an early stage of growth.

18
Khulekani Dladla, Thulani Dlamini, Dlezakhe Hlongwane
Reasonably high water
infiltration rates were recorded
for these three participants.
Their soils however are similar to
the other participants in Stulwane
showing veryhigh clay
percentages; around (35-55%)
and soil crusting
Figure 3: Right: Crusting and cracking in the
soil shown in Dlezakhe Holngwane’s field
and Far Right: A soil sausage made from his
soil indicting the high clay content.
Eqeleni
Simephi Hlatshwayois on her 5thyear of CA implementation. She is now
focussing mainly on crop rotation also using a number of different types of
traditional beans. She has not planted cover crops this season. It is not clear
whether this way of planting has impacted negatively on her soil quality. When
comparing Simephi’s VSA results in 2016-2017 and 2017-2018, the soils
haven’t not improved and the indicators and scores have remained the same.
Her soils have not improved, showing shallow rooting (~12cm) and
compaction.
Figure 4: The hard, compacted soils in Smephi Hlatswhayo’s CA trial plots
Ntombakhe Zikode
Ntombakhe is also on her 5thyear of participation and she has 1000m² trials intercropped with
maize, beans and cowpea and she also has cover crops. Ntombakhe has also undertaken a liming
experiment.

19
Her soils are extremely shallow with an effective depth of around 30cm
only, before hitting the shale below. Ntombakhe also stated that her
yield for this year has somewhat decreased in comparison to the
previous year. She holds the dry weather accountable for such a poor
yield.
Figure 5: A gravimetric soil simple taken at Ntombakhe’s trial plot, showing the clay and
shale parent material in this 30cm depth sample
Ezibomvini
Phumelele Hlongwane is one of the best CA farmers in the Bergville
area. She has used all cropping practices including intercropping,
rotation and summer and winter cover crops and has consistently
achieved very high yields. Here soils however are not good structurally
and the implementation of CA for the last 4 years has not changed the
water infiltration rate of her soil. Soils are also variable across her field
with some parts being shallow and rocky and other less clayey with
deeper soil. Generally, her infiltration rates are slow.
Figure 6: From Left to
Right: A spade of her soil
graded to show large
clods but little structural
integrity; An example of
root size and depth of one
of her maize plant -
showing quite shallow
rooting andthe double
ring infiltrometer set up
for readings. The walls of
the rings are quite
battered due to extreme
difficulty of getting the
rings into the soil
Challenges and Solutions
One of the biggest challenges indoing the infiltrometer readings was
accessing enough water. Each site would take on average around 100litof
water. The households had not access to water and thus this had to be found
and brought to site, usually from a nearby stream or spring-which was
extremely time consuming. The doulbe ring as well was construted locally in
Pietermatizburg and was not of a high enough quality to withstand the strain
of being hammered into extremely hard soils. It is likely that the project will
discontinue these efforts in the future and rely more heavily on gravimetric
water soil sampling and analysis.

20
Visual Soil Assessments
This methodology has been tried each year in the Bergville area, as a potential peer review system
for assessing soil quality. Below is the scoring sheet that has been designed for this assessment.
This assessment has been altered slightly in terms of indicators used when compared to similar
processes employed
12
, to accommodate for tests that are seen to be very similar in the original
forms. An example is surface ponding and infiltration, which in our version has been changed to
infiltration only.
Visual indicator of
Soil Quality
Visual Score
(VS)
0 = Poor
conditions
1 = Moderate
conditions
2 = Good
conditions
Weight
Comments
Soil Structure
(aggregates)
3
Shatter test and assessment of clods for
distribution of aggregated 0=many large clods,
few smaller ones, 1=equal proportions of large
and finer aggregates, 2= larger proportion of
friable soil and fine aggregated
Soil porosity
3
0=hard compact clods, 1= breakable clods, 2=
easily breakable with organic matter and some
roots
Soil colour and
organic matter
2
Here the organic matter is what counts.
0=none,1=little, 2=Some to lots
Number and colour
of soil mottles
1
0= many mottles, 1=some mottles, 2= no
mottles
Earthworm counts
2
As per manual
Soil cover (residue
cover)
2
As per manual
Soil depth (presence
of a tillage pan),
depth of rod into soil
2
0=0-10cm, 1=10-15cm, 2=>15cm
Run-off
2
As per manual
Infiltration (surface
ponding)
x 2
0= evidence of ponding (yellowing plants,
standing water after rain), 1= some ponding
(water takes a while to infiltrate) 2=no ponding
TOTAL
37
VSAs were conducted for 13 of the longer termparticipants this season. Soil from the CA trial
plots were compared with the control plots. As is the case with a number of other indicators, the
value of comparing trials and controls has been minimised due to the fact that all these
participants started using CA in their control plots as well. There are however still marked
differences in crop diversification between the trial and control plots, as all participants plant
only maize in their controls.
Below is a summary table for the soil based indicators of the VSAs for the 13 participants.
1
Sheperd G. 2010. Visual Soil Assessment Field Guide: Part 1: Maize. FAO, Rome
2
Sheperd G, Bailey J, Johnson P. 2012. Visual Soil Assessment. SMI and Vaderstad. New Zealand.

21
Table 9: Visual Soil Assessments for 4th and 5th year CA participants in Bergville:2017-2018
The VSA scores for 6 of the 13 participants are higher for their CA trial plots (T) when compared
with their control plots (C), the scores for 2 participants are the same and the scores for 5 of the
participants are lower. As this is the fourth year that these scores have been used and the
results are still very inconclusive in terms of a methodology to assess improvement under CA,
the tests are to be discontinued in the future as a CA assessment methodology. While VSAs
provide a good set of visual indicators for testing soil quality, some of the indicators are not
directly related to short term management benefits and changes in the soil. A selection of these
indicators, notably soil structure, run-off and soil cover are however to be continued, as they do
provide visible differences in the shorter term (4-5years).
Some interesting points however can be made from the table above
•Even after 5 years of implementation there are no earthworms counted in the soil across
all the villages.
•The only indicator that shows either a positive change for the CA trial plots, or where
soils remain similar for that indicator across the trial and control plots is Soil Structure
(aggregates).
Soil Fertility and soil health
Soil samples are taken annually, both for new participants and also a selection of participants in
their 4thand 5thyear of participation. These results are used to be able to give participants a
specific fertilizer recommendation, check the “generic” recommendation used and also to observe
any changes in soil fertility status over time.
In addition, soil health status is tested for a selection of the longer-term participants to ascertain
levels of and changes in; microbial activity, percentage soil organic carbon, percentage organic
nitrogen, upstream availability of nutrients to follow-on crops and aggregate stability.
This season an additional measurement has been included, that of soil bulk density(ρb). This
measurement is needed for the calculation of water productivity. Bulk density is directly related
May-18
Visual soil Indicators
NAME OF PARTICIPANT
K Dladla(T)
K Dladla(C)
D Hlongwane(T)
D Hlongwane(C)
T Dlamini (T)
T Dlamini (C)
M Dladla(T)
M Dladla(C)
C Buthelezi(T)
C Buthelezi(C)
P Sthebe(T)
P Sthebe(C)
ThZikode (T)
ThZikode (C)
T Zikode (T)
T Zikode (C)
T Mabaso (T)
T Mabaso (C)
N Zikode (T)
N Zikode (C)
S Hlatshwayo (T)
S Hlatshwayo (C)
C Hlongwane (T)
C Hlongwane (C)
P Hlongwane (T)
P Hlongwane (C)
SOIL TEXTURE66666663663 6 3 6 36333333666 3
SOIL STRUCTURE( AGGR)66666363633 3 3 3 33333333333 3
SOIL POROSITY63336360333 3 6 6 33363330336 3
SOIL COLOUR22222244222 2 2 2 22222222224 2
NO. OF SOIL MOTTLES AND COLOUR11111122211 1 1 1 11100012111 0
EARTHWORM COUNTS00000000000 0 0 0 00000000000 0
SOIL COVER (RESIDUE)00002000000 0 0 0 00000000001 0
SOIL DEPTH( CM)44444424444 4 4 4 44422224222 2
RUN-OFF 44022400222 2 2 2 24222022022 2
INFILTRATION 44222222222 2 2 2 22222222222 2
TOTALS 333024263125 28 18 27 23202323262025202017 15181819212717
Stulwane
Eqeleni
Ezibomvini

22
to soil porosity and indicates the degree of soil compaction (Assouline, 2006
3
). Consequently, ρbis
considered a good measure of soil quality as it affects other soil physical parameters such as water
holding capacity and ease at which roots can penetrate the soil.
Soil fertility
The following generic fertilizer recommendation has been used for all farmer led trials in the
Bergville area:
➢250kg/ha MAP (5x 50kg bags) (equivalent to 40kg/ha of P) and
➢150kg/ha LAN (3x50kg bags)( equivalent to 60kg/ha N)
These amounts have been checked yearly against the soil sample results and thus far have
provided a good average.
Soil samples were taken for most of the new entrant farmers (42 of the 56 new farmers). The
summary below outlines the soil fertility recommendation results. From these results however,
it can be seen that the average recommendation for MAP of 250kg/ha can be reduced to 200kg/ha
or (4x50kg bags/ha).The LAN recommendation will remain 3x50kg bags/ha
Table 10: A summary of soil fertility recommendations for 8 villages across Bergville area, 2017-2018
Soil fertility results for the repeat samples of longer term participants will be presented within
that case study within this document
Bulk density
Soil tillage has been a popular agricultural practise throughout the world due to the initial
improvement of crop productivity, control of weeds and ease with which crops can be planted.
3
Assouline S., 2006. Modelling the relationship between soil bulk density and the water retention
curve. Vadose Zone Journal, 5 (554-563).
No of
samples
Village Crop
Yield
target
(t/ha)
pH
Acid
sat (%)
N
(kg/ha)
P
(kg/ha)
K
(kg/ha)
Lime
(t/ha)
MAP (50kg
bags/ha)
KCL (50kg
bags/ha)
LAN (50kg
bags/ha)
Org. C %N %Clay %
10 EMAQALENIMaize4 4,211,472 4310,5 3,9 0,4 3,6 1,7 0,223,8
Beans1 4,211,440 3302,0 2,1 0,4 2,0 1,7 0,223,8
7 MAGANGANGOZIMaize44,29,973 4720,2 4,2 0,4 3,6 1,6 0,221,5
Beans1 4,135,345 3601,2 2,4 2,1 2,3 2,6 0,240,2
6 VIMBUKHALOMaize44,112,140 3601,9 2,2 0,0 2,0 1,7 0,223,8
Beans1 4,417,076 5010,4 4,5 0,0 3,7 2,0 0,228,7
6 EZIBOMVINIMaize44,117,539 2802,2 2,0 0,0 2,2 0,920,223,8
Beans1 4,46,566 4410,9 3,7 0,0 3,3 1,3 3,633,4
3 EQELENIMaize44,217,254 4001,2 3,0 0,0 2,7 2,1 0,230,9
Beans1 3,848,051 3711,4 5,5 2,0 2,1 2,5 0,251,7
6 NDUNWANAMaize44,218,656 3911,2 3,1 0,0 2,8 1,6 4,224,8
Beans1 3,938,356 4001,2 3,6 0,0 2,7 2,1 0,237,3
1 STULWANEMaize43,831,080 6002,5 5,5 0,0 3,6 1,7 0,128,0
Beans1 3,831,040 6007,5 5,5 0,0 3,6 1,7 0,128,0
3 EMAZIMBENIMaize44,027,258 4011,2 4,3 0,7 2,7 2,0 1,340,8
Beans1 4,116,363 4601,6 5,5 5,2 3,1 1,9 0,218,5
42 4,1 21,857 4201,7 3,8 0,7 2,9 1,8 2,029,9

23
However, it has been recognised in many regions that this improved productivity is temporary
and overall, soil organic matter (SOM) content decreases under conventional tillage (CT).
This decrease in SOM results in a decline of soil quality as SOM plays a major role in the soil’s
structural and pore characteristics by influencing aggregate stability.
Bulk density samples were taken for three participants, towards the end of the cropping season
(early May 2018). Samples were taken this late in the season as many authors report greater
porosity, lower ρb and reduced soil strength under CT than under (no-till) NT due to the creation
of macro-pores during ploughing. These provide for a lower ρbreading early inthe season, as
during the course of the season the soil settles again and the readings increase (Basset, 2010)
4
.
Below is a summary of the results of the bulk density calculations for different cropping practices
within the CA system of the three participants. They were chosen for having differing period of
cropping under CA and for inclusion of a number of practices within their CA system; namely
intercropping and planting of summer cover crops (SCC).
Table 11: Bulk density results for three CA participants
Village
Period
undue CA
(yrs)
Name and
Surname
Control
CT
Control
CA
M
M+B
M+CP
SCC
Average
Ezibomvini
4
Phumelele Hlongwane
1,30
1,36
1,38
1,33
1,38
1,28
1,34
Eqeleni
5
Ntombakhe Zikode
1,35
1,49
1,37
1,32
1,38
Thamela
1
Mkhuliseni Zwane
1,14
1,08
1,09
1,07
1,10
Average bulk density
1,27
These results indicate an increase in ρbover period of involvement in CA. There is little to no
difference between the CA practices, although in all three cases the planting of SCC has reduced
the ρb fractionally.
An explanation for this trend is that ploughing increases the presence of macro-pores in the short
term but, less structural stability under CT can lead to lower porosity, higher bulk densities and
greater soil strength with time, as tillage-induced pores readily collapse. Although initial
conversion from CT to CA usually results in higher bulk densities it is unlikely that plant growth
will suffer markedly as a consequence of insufficientmoisture and poor aeration status. Improved
aggregation and pore connectivity under CAallows the soil to maintain an adequate supply of
moisture and air (Cavalieri et al., 2009)
5
.
The average ρb of 1,3g/cm3 is to be used for the water productivity calculations
4
Basset, T.S. 2010. A comparison of the effects of tillage on Soil physical properties and microbial
Activity at different levels of nitrogen Fertilizer at Gourton farm, Loskop, Kwazulu-Natal. MSC thesis. Dept
of Soil Science, UKZN.
5
Cavalieri K.M.V., da Silva A.P., Tormena C.A., Leão T.P., Dexter A.R. and Håkansson I., 2009.
Long-term effects of no-tillage on soil physical properties in a Rhodic Ferrasol in Paraná,
Brazil. Soil and Tillage Research, 103 (158-164).

24
Soil health test results
In the interim report an analysis was done for soil health test results over 2-3 years for a selection
of participants to analysethe changes in soil health due to specific CA practicesin each year.
Below an analysis has been done to ascertain soil health changes dependant on length of CA
practice. Results from Ezibomvini (three 4th year participants) are compared to Mhlwazini (two
2nd year participants). These results are qualitative and give an indication of trends only.
Figure 7: Comparison of soil health test results for 2nd and 4th year CA participants
From the above figures the following comments can be made:
➢After 4 years the % OM accumulation for the CA plots (M+B and SCC) is higher than the
veld benchmark. This indicates good accumulation of organic matter in the intercropped
and summer cover crop plots of the CA trials over time. The maize only plots do not
accumulate organic matter to the same extent. For the 2nd year participants the % OM is
lower than the veld benchmark and there is as yet no distinction between the maize only
and maize and bean plots.
➢There is an increase in the average organic C from the maize(M) only plots, to the maize
and bean intercrops (M+B) to the summer cover crops (SCC), indicating an accumulation
Ave
rag
e of
%
OM
Ave
rag
e of
CO
2 -
C,
pp
m C
Ave
rag
e of
Org
ani
c C
pp
m C
Ave
rag
e of
Org
ani
c N
pp
m
N
Ave
rag
e of
C:N
rati
o
Ave
rag
e of
Soil
hea
lth
cal
cul
atio
n
(ne
w)
Cont M (CA)3.754.1 252.0 18.713.512.3
M+B 3.653.1 255.5 17.714.612.2
Veld 4.575.4 272.0 20.713.115.1
0.0
50.0
100.0
150.0
200.0
250.0
300.0
Soil health Mhlwazini; 2nd yr
(N=2)
Aver
age
of %
OM
Aver
age
of
CO2
- C,
ppm
C
Aver
age
of
Orga
nic C
ppm
C
Aver
age
of
Orga
nic N
ppm
N
Aver
age
of
C:N
ratio
Aver
age
of
Soil
healt
h
calc
ulati
on
(new
)
Cont M3.873.1233.519.1 12.6 13.9
M+B 4.769.9243.522.2 11.2 13.2
SCC 4.073.7263.320.3 13.1 14.0
Veld 3.984.8285.317.8 16.3 15.2
0.0
50.0
100.0
150.0
200.0
250.0
300.0
Soil health Ezibomvini; 4th
yr (N=3)

25
of Organic C for the M+B plots from the 2ndyear onwards. Use of SCC over a period of time
provides for the highest increase in Organic C.
➢The largest accumulation of Organic N is for the 4th year M+B plots, when compared to M
and SCC plots. This indicates a cumulative effect of increased Organic N when
intercropping is used and the effect becomes more visible over time.
➢This links to the lower C:N ratio for M+B plots for 4th year participants.
➢C:N ratios for the CA plots (M, M+B and SCC) for the 4th year participants arelower than
the veld benchmarks. This is not the case for the 2nd year participants. This indicates the
lowering of C:N ratios over time for the CA practices.
In summary, the use of CA practices and especially including intercropping and summer cover
crops in the cropping system increases % soil organic matter and the accumulation of organic C
and Organic N over time. C:N ratios decrease. These trends become more clear after a period of
4-5 years of implementation of CA.
The savings in R for inorganic N that needs to be applied is also cumulative. For Mhlwazini (2nd
year) this value is R374,50/ha and for Ezibomvini (4thyear) the value is R437,13. These values
are equivalent to 12% and 14% of total fertilizer costs respectively.
Farmer Centres
Thus far only one farmercentre has grown up from the learning groups, with two others not
lasting more than one season. This is directly linked to the commitment and entrepreneurial spirit
of those who volunteered for the task.
Now in its second year of operation the farmer centre in Eizbomvini has been running quite well
and is seen to have played a pivotal role in the upkeep of agricultural production inthe village.
More and more people, including those from neighbouringvillages such as Vimbukhalo also get
their inputs of seed, fertilizer and herbicide from the Ezibomvini farmer centre.
Products available at the farmer centre still include seed, fertilizer, herbicide and the preservative
pill, but maize ready for milling, beans and sweet potatoes are now up for sale as well. These are
products which Phumelele grows and are a surplus from her yields.
Figure 8: Above Left: Seed available at the farmer centre now includes the commercial hybrids as wellas locally grown OPV
yellow maize seed and Right; traditional white maize is sol for milling in small quantities.
26
The small table below gives a summary of income made through the farmer centre.
Date
Description of products sold
Total
Mark- up (20-25%) Profit
February 2018
Brought forward
R3092.14
March 2018
Quickphos preservative pill
Bulala Zonke
R 46.72
R 100
March – July 2018
Maize 30*20 l @ R 50.00 each
Beans 06* 5l @ R90. 00 each
02* 20l @ R 300 each
Sweetpotato 20* 5l @ R25.00
5* 20l @ R 100
R 1 500
R 450
R 600
R 500
R 500
Sub Total
R 3 550.00
Total profit
R 6 642.14
VSLAs
In Bergville 16 VSLAs are now active. The groups consist predominantly of middle aged to elderly
women majority who are unemployed and depend on social and pension grants in order to
survive.
The VSL groups were established with the aim to support CA learning groups to save money for
agricultural inputs. The groups however, have come to have broader functions where the
members save for household needs, to pay back loans, pay for school fees and to buymerchandise
for their businesses among other things. A VSL group operates for 12 months and on the
thirteenth month the group has a share out of “profits” (interest gained) and thereafter begins
another cycle. During these twelve months group members take out loans which they repay with
a 10% interest fee added monthly which is how the groups generate income.
Progress of VLS Groups
The groups are all functioning and are doing well except for uMhlathuze group in Bergville,
Emmaus area that is no longer under MDF due to non-compliance with the non-negotiable rules.
Out of the four new groups that were established this year, there are two groups in Vimbukhalo,
one in Ngoba and one in Nokopela. This report will focus on the 9 groups that were visited during
the month of June in the following villages; Ezibomvini, Eqeleni, Vimbukhalo, Ngoba, Stulwane
and Ndunwana
In the month of June, the groups saved a combined sum of R 59 700 and the total value of their
shares for the year is R 403 964. Loans repayments add up to R 53 240, existing loans were R
297 190 and new loans were R 69 500. This money is counted and kept by the groups themselves.
Table 1 on the following page gives a breakdown of the VLS transactions for each group. When
looking at the loans versus shares, one will notice that the existing loans are generally lower than
the total number of cumulative shares, which is the case for most of the groups. The two groups
in Stulwane have existing loans that are higher than the cumulative number of shares, which
suggests that they are in the negative i.e. some people are still adding new loans on existing ones.

27
Table 12: Summary of VLS Groups for the month of June
GRP
NO
Area
Village
GROUP NAME
YRS
ACTIVE
NO. OF
MEMBERS
#
SHARES
BOUGHT
TODAY
VALUE OF
SHARES
(TODAY)
CUM #
OF
SHARES
VALUE OF
TOTAL
SHARES
LOAN
REPAID
TODAY
LOAN
NEW LOAN
TAKEN
AMOUNT
DUE NEXT
MONTH
1
Bergville
Vimbukhalo
Inyonyana
1
20
20
R2,000.00
260
R26,000.00
R2 540
R13,100.00
R14,410.00
2
Bergville
Eqeleni
Masibambisane
4
20
54
R5,400.00
442
R43,210.00
R5 190
R22,600.00
R500.00
R26,310.00
3
Bergville
Eqeleni
Masithuthuke
5
20
48
R4,800.00
354
R35,100.00
R4 910
R20,700.00
R4,000.00
R27,570.00
4
Bergville
Stulwane
uMntwana
5
35
70
R7,000.00
507
R50,332.00
R4 900
R57,550.00
R12,300.00
R78,250.00
5
Bergville
Stulwane
Mbalenhle
3
20
56
R5,600.00
400
R40,000.00
R4 490
R43,600.00
R3,000.00
R52,030.00
6
Bergville
Ngoba
Sakhokuhle
2
23
38
R3,800.00
399
R37,722.00
R8 570
R30,600.00
R5,200.00
R39,480.00
7
Bergville
Ngoba
Isibonelo
1
30
82
R8,200.00
537
R53,700.00
R9 350
R32,500.00
R13,600.00
R42,870.00
8
Bergville
Ezibomvini
uKuzama
2
21
56
R5,600.00
317
R31,700.00
R3 530
R18,800.00
R6,000.00
R27,130.00
9
Bergville
Ndunwana
Mphelandaba
2
19
17
R1,700.00
179
R17,900.00
R2 110
R16,600.00
R1,500.00
R18,260.00
TOTAL
208
441
R44,100
3395
R335,714
R45
590
R256,050
R46,100
R326,310
Mphelandaba VSL Group, Ndunwana
The Mphelandaba group from Ndunwana Village in Bergville is in its second year of operation. It has a total membership of 19 people who
are all female. The group saves for household needs but do occasionally use the money for inputs. This year is going well so far, the group
has learned from the mistake of the first year where some people took out loans but failed to pay back because they did not follow the
principle of not lending more than twice the cumulative number of shares. The table below gives a summary of the group’s savings for June.
NO.
SURNAME
INITIALS
#
SHARES
BOUGHT
TODAY
VALUE
OF
SHARES
(TODAY)
CUM #
OF
SHARES
VALUE OF
TOTAL
SHARES
LOAN
REPAID
TODAY
LOAN
NEW LOAN
TAKEN
AMOUNT DUE
NEXT MONTH
1
Zondo
SN
1
100
9
900
50
500
550
2
Hlatshwayo
BS
0
0
10
1000
150
1500
1650
3
Hlongwane
AM
1
100
12
1200
20
200
220
4
Hlongwane
PL
1
100
8
800
50
500
550
5
Mazibuko
N
1
100
10
1000
20
200
220

28
Mbalenhle Group: Stulwane
The Mbalenhle Group consists of 20 members and is based in Stulwane. The table below shows their transactions for the month of June. In
terms of savings, value of shares bought came to R 5600.00, total amount repaid was R 4490.00, exiting loans were R 47 960 and new loans
came to R 3000.00. The group is similar to uMntwana group in that they also borrow money on top of existing loans. The biggest challenge
with Stulwane is that the groups are comprised of young as well as old women, who also happen to be in laws of some of the younger women.
When the older, more knowledgeable break the rules it is difficult for those deemed as inferior to rectify them.
NO.
SURNAME
INITIALS
#
SHARES
BOUGHT
TODAY
VALUE
OF
SHARES
(TODAY)
CUM #
OF
SHARES
VALUE
OF
TOTAL
SHARES
LOAN
REPAID
TODAY
LOAN
AMOUNT
DUE
NEXT
MONTH
NEW LOAN
TAKEN
NEW
BALANCE
1
Duma
H
5
500
35
3500
300
3000
3300
0
3300
2
Msele
N
5
500
32
3200
500
5000
5500
0
5500
3
Mpinga
T
5
500
31
3100
300
3000
3300
0
3300
4
Dubazana
N
4
400
17
1700
330
3000
3300
0
3630
6
Zimba
LL
2
200
14
1400
300
3000
3300
7
Mdluli
K
1
100
10
1000
50
500
550
8
Hlongwane
Z
2
200
17
1700
100
1000
1100
9
Khumalo
ZJ
1
100
9
900
100
1000
1100
10
Hlatshwayo
NE
1
100
12
1200
180
1800
1980
11
Vilakazi
Z
0
0
5
500
0
600
660
12
Hlongwane
D
1
100
9
900
50
500
550
13
Zondo
T
0
0
9
900
230
2300
2530
14
Nkala
T
0
0
6
600
50
500
550
15
Mazibuko
S
1
100
5
500
60
600
660
16
Hlongwane
N
1
100
9
900
330
0
1500
0
17
Mkhonza
SI
2
200
14
1400
50
500
550
18
Zondo
G
0
0
3
300
270
900
990
19
Zimba
LL
1
100
8
800
50
500
550
Total
19
17
1700
179
17900
2110
16600
1500
18260

29
5
Sishi
H
4
400
19
1900
150
1500
1650
0
1650
6
Mkhize
T
3
300
23
2300
200
2000
2200
0
2200
7
Skhosana
N
2
200
23
2300
220
2200
2420
1800
4620
8
Nyoka
Z
0
0
3
300
100
1000
1100
0
1100
9
Mkhize
S
5
500
34
3400
200
2000
2200
2200
10
Mvelase
M
2
200
14
1400
150
1500
1650
0
1650
11
Mkhize
E
4
400
31
3100
150
1500
1650
0
1650
12
Mhlanga
N
0
0
16
1600
200
2000
2200
0
2200
13
Mazibuko
N
1
100
9
900
300
2000
2200
0
2200
14
Zimba
N
2
200
13
1300
270
2700
2970
0
2970
15
Mkhize
N
2
200
29
2900
300
3000
3300
0
3300
16
Mpinga
N
2
200
11
1100
150
1500
1650
700
2420
17
Dlamini
N
2
200
12
1200
150
1500
1650
0
1650
18
Ndlovu
N
2
200
9
900
200
2000
2200
0
2200
19
Nene
M
5
500
31
3100
200
2000
2200
500
2970
20
Msele
M
1
100
8
800
120
1200
1320
0
1320
TOTAL
56
5600
400
40000
4490
43600
47960
3000
52030

30
Trends for longer term smallholder participants in the CA FIP
A specific survey was conducted this season (2017/18), with smallholder participants who have now
cropped for 4 (5th year) and 5 (6th year) seasons respectively to ascertain their uptake, adaptation of
the CA systems introduced as well as aspects of sustainability, including –increased cropping area,
use of CA principles in all their fields (thus including the control plots), increased yields, increased
food security and increased incomes/savings.
A total of 15 case studies with 5 participants in each of three villages (Eqeleni, Ezibomvini and
Stulwane) in the Bergville area,were conducted between January-March 2018.. (This is a sub-
sample of the total number of participants (27) who started CA in 2013 and 2014 ).

31
Below is a summary for the 15 participants interviewed. The values in the graph represent the
number of participants for that indicator
Summary of results:
All these participants are implementing all threeprinciples of CA, are involved in intercropping and
have included CA into their overall farming practices. They will now use CA as their farmingapproach
going into the future. All participants agree that this approach has saved them money and increased
food security considerably and all are involved in local VSLAs (Village savings and loan associations).
All participants also use traditional seed varieties alongside the more modern OPVs, hybrids and GM
varieties promoted.

32
There are some individual variations and adaptations in terms of crop rotation systems, spacing, use
of cover crops and use of fodder for livestock. Around 73% of these respondents have already
increased their area of cropping and feel that with the introduction of the animal drawn and tractor
drawn implements, they will be able to expand even further.
This summary provides a very clear indication that after around 5 years of experimentation with CA,
the farmers are now willing and able to implement CA without any further external mentoring.
Support in the form of farmer centres that can assist in the provision of access to implements and
inputs as well as the small subsidies for continued experimentation is however still important.
Present challenges are primarily around storage systems and capacity as all are producing more
maize than they can easily harvest and store. Stray livestock provide a challenge for many
participants and some still have some challenges around weeding and pest incidence (such as
cutworms and bagrada beetles). In addition, we have as yet been unable to come up with a
satisfactory process of inclusion of winter cover crops (WCC’s) in this CA farmingsystem. Relay
cropping and broadcasting of WCC’s have been largely unsuccessful in this system.
A few other comments of interest are:
1.A proportion of participants have included the broadcasting of kraal manure into their
cropping system, along with the micro-dosing of fertilizer and believe this works well. This is
a practice that warrants further attention and experimentation
2.Around 36% of these participants have also been involved in the Grain SA Farmer
Development Programme’s Job Funds project. They have now all withdrawn given that the
inputs provided through this programme have become unaffordable. Most of these
participants have also kept the seed they obtained through that process for more than one
season as their cropping areas are in fact smaller than 1ha.
Below is a summary of comments made by the interviewees.
The Conservation Agriculture system
“I am very happy with my current method of farming (CA) and I tryby all means to recruit people
into CA as it breaks the strong boundaries of poverty and food insecurity” (Ntombakhe Zikode)
“We really appreciate havingMahlathinias a stepping stone towards poverty alleviation in our
village. The learning groups and farmer’sday have played a huge role in enhancing our knowledge
and learning. It has taught me to experiment with the skills that I have picked up. Phumzile and her
team encourage us to keep our plots looking good. When they do monitoring rounds, we are able to
ask more questions and share new ideas and in turn acquire more skills.” (Khulekani Dladla)
“The workshops that were given in the introductory phase of the programme led me to believe that
this system can be a very useful tool to solve our production problem of obtaining poor yields and
also at the same time contribute to better food security in my homestead. Soils that we worked were
tired after numerous years of tillage and had very little potential and the CA principles presented
helped to form a more complete picture of the factors influencing good productivity of the soil which
includes the combined use of practices such as intercropping, crop rotation and cover cropping and
how these can assist in terms of buildingup the nutrients in the soil and also increase moisture
retention capacity of the soils when practicing CA. I have now seen a drastic improvement in my fields
with increased yields and soils are always workable as they are moist (cover)”. (Thulani Dlamini)
•CA helps to save money and improves yields

33
•CA reduces water erosion and run-off in the fields
•CA reduces wind damage to crops as maize is not blown over, as it is under conventional
tillage
•CA increases soil fertility and soil health
•CA increase soil moisture and makes the soil soft and more workable
Crop rotation
“Crop rotations helps most when it comes to disease control and balancing the way nutrients are
taken from the soil as well as putting them back into the soil. This includes planting maize for one
season then changing in the following season and planting cover crops, which are ideal for soil
health”. (Khulekani Dladla)
Below is a summary of some of the observations related to crop rotation:
•Maize-beans-beans-maize. This rotation has been introduced as maize grows a lot better after
the bean rotations than without
•Maize-SCC-maize; this rotation provides the best growth of maize when compared to other
intercropped and rotated plots.
•Rotations after planting Lab-Lab beans grow very well
Intercropping
Below is a summary of some of the observations made related to intercropping:
•Intercropping assists with weeding and keeping the soil soft and moist
•Intercropping also assists in boosting the fertility of the soil and helps with good growth in
follow-on crops. It improves the yield of maize
•Intercropping helps with weeding
•Cowpeas provide for excellent soil cover due to its vigorous growth and thus also helps with
weeding, containing soil moisture and soil fertility. Participants are no longer used to eating
cowpeas and for this reason it is not preferred.
•There can be problems with bean yields in intercropped plots due to shadingand excessive
moisture where the pods rot prior to harvest.
•It also assists in providing different food sources over a longer period of time
•In maize and cowpea intercrops, the maize grows and yields better than in the maize and
bean intercropped plots.
•Cowpeas provide more nutrients for follow-on crops.
•The yields of the mono cropped maize in the CA control plots varies a lot from year to year,
while the maize yields in the trail plots where intercropping and cover crops have been used
increase every year.
Cover crops
Below is a summary of observations related to cover crops:
•Planting of millet improves soil quality (making it soft and easy to work with) and soil health.
It assists the follow-on crop substantially in terms of growth and yield
•Millet is eaten by birds and thus harvesting the grain has been impossible formost
participants.
•Sunflowers grow well and most participants have harvested the seed to feed to their chickens.
Some participants prepare a feed of crushed maize and sunflower for their poultry and have
found this to greatly increase their survival rate.

34
•SCC’s are cut and dried as a fodder for livestock – both goats and cattle.
•Cover crops increase the fertility of the soil; especially cowpeas and millet.
•Lab-Lab beans also have medicinal properties in assisting to regulate blood pressure. This is
preferred over the modern medications as it is more natural. It also provides for much
increased soil fertility and improved soil health.
•Cover crops help keeping the soil moist and in a good condition during the off season
•Cover crops help inproviding fodder for livestock in winter when they do not have enough
food.
Crop varieties
“I like the modern cultivars, such as PAN6479 as they have the capacity to produce more as compared
to the traditional maize which I used in my control plot. The traditional maize is good when it comes
to disease resistance and adaptation to weather changes; however, it does not have the best yield”
(Smephi Hlatshwayo)
“The Gadra beans are more susceptible to pests and diseases as well as poor adaptation to weather
changes, which makes it better to plant this bean late in the planting season. Usuthu (a traditional
cultivar of climbing bean) is much more disease resistant and can adapt to weather changes, which
is why I have both these cultivars in my trial and control plots” (Smephi Hlatshwayo).
Traditional varieties are used as it is possible to keep seed for following seasons and this is seen as
important. Participants also prefer the taste of the traditional maize.
Below is a small table put together from comments made by Khulekani Dladlaon comparing different
seed types.
Hybrid seed Pro’s
Hybrid seed cons
Yields big cobs with multiple lines
Sometimes it is too sensitive to chemicals
Produces quality maize
GM seeds Pro
GM seeds cons
Persistent and not too sensitive to weather and
chemicals
Has many bad weather hazards
Easy to work with because they don’t require
labour when it comes to weeding (chemically
friendly)
Has many bad health hazards
Traditional seeds Pro
Traditional seeds cons
Resistant to many diseases
Yield is too small (the traditional seed cob has
fewer lines of seeds/pips).
It is filling
Plot layout and spacing
Overall the standard design of the experimental plots has been adapted by the whole group in Eqeleni
under the direction of the local facilitator in the area. They have altered plant spacing from the
recommended 50 cmx50cm for maize to 70 cmx70 cm. They share that this solves the problem of
ease of weeding as with the close spacing the feeling was that the growing bean plants intercropped
with the maize cannot escape damage from human traffic and implements used. Apart from this,
increased competition between growing plants was observed and for this reason spacing altered.

35
Their 1000 m2 trials (50 m*20 m) are divided into5 plots (20 m*10 m). The last crop rotation plot is
split into two to allow for 2x (10 m* 10 m) plots, planted to sole Maize crop and summer cover crop
mix of sunflower, sunn-hemp and millet respectively.
In the other two villages the decisions have been based a lot more on individual observations. For the
control plots, which are the ‘rest’ of the field crop plantings for each individual, most of the
participants have now included elements of the CA system, including no till and micro dosing
fertilizer. For the most part however, they have continued with a maize monocropping system in
their control plots.
Below are some descriptive photographs.
Eqeleni
Ezibomvini
Stulwane
Smephi Hlatshwayo
Phumelele Hlongwane
Khulekani Dladla
Ntombakhe Zikode
Phumelele Gumede
Dlezakhe Hlongwane
Thulile Zikode
Cabangani Hlongwane
Thulani Dlamini
Tombi Zikode
Alfred Gumede
Makhethi Dladla
Tholwephi Mabaso
Velephi Zimba
Phasazile Sthebe
Eqeleni
Eqeleni village is one of the pioneer
villages of CA in the Bergville. The group
currently comprises of a total 21
participants 6 of which are new entrants
into the programme having joined in the
current 2017/2018 growing season. This
group has really taken on the CA principles
and made these their own by modifying
certain aspects of the model but also
sticking to basic concepts of CA. There are
2 VSLAs in the village
Figure 9: Tholwephi Mabaso stands in front
of her mono-cropped maize trial plot.
M+B+WCC
M+B+WCC
M+C
M+B
M SCC

36
Figure 10(below: Close-up mono cropped maize from Smephi
Hlatshwayo’s trial.
Figure 11(right): control maize (CA) – Her trial maize performs
better than her continually mono-cropped control
Figure 12(left): Ntombakhe’strial plot, early
stages of the summer cover crops in the
foreground. Behind that and to the right are her
inter cropped plots and on the left at the back
her mono-cropped maize plots.
Figure 13: Thulile
Zikode. below –a
view of her late
bean planting with
her maize and bean
intercropped plot behind her and Right – her SCC plot with millet, sunflower
and sunn-hemp mix

37
Ezibomvini
This village started the CA process in the
2015-2015 season. There are presently 26
participants, of whom 6 are new entrants into
the programme. Ezibomvini hosts a farmer
centre and 2 VSLA groups.
Figure 14: right: Alfred Gumede standing next
to a plot of Lab-lab beans planted in the 2015-
2016 season. Towards the back of the picture
are the millet stalks from a SCC plot. Right
below: A view of one of his CA mono cropped
maize plots.
Figure 15: Above- Velephi Zimba standing in her SCC plot (sunn-hemp, millet and sunflower)
Figure 16: Right- a view of
Phumelele’s maize and
cowpea intercropped plot
and Far Right -A view of
Phumelele’s Lab-Lab plot
in the 2017-2018 season.
She rotates these plots in
her intercropping and
rotation system. Behind
the visitors is a plot of
inter cropped maize and
sunflower.

38
Stulwane
This village started their CA process in 2013. There are presently 19 participants. A new group has
been started in another part of this village this past season, with 12 members
Figure 17: Left above: A view of Khulekani Dladla’s field showingmaize and bean and maize and cowpea
intercropped plot. Left below –he stands in front of a plot of sunflowers and Right –he indicates yields
form different types of beans planted in his fields.
Figure 18: Thulani Dlamini stands in a single crop bean plot, ready for harvest and in front of a plot of
single cropped sunflower that he planted in the 2016-2017 season.

39
Figure 19: Right above: A view of Makhethi Dladla’sfield with a mono-cropped bean plot in view and
towards the back of that is maize andSCC intercropped plot. Right below: Makhethi stands in a maize
and bean intercropped plot.
Soil fertility analysis
Soil samples are taken forevery participant at the start of their experimentation and then again 2-3
years later. The idea has been to gauge the difference between soil fertility and nutrient requirements
for the control and trial plots. Below is a summary of the soil fertility requirements analysis for 12 of
the 15 participants interviewed.
Table 13: Averages for soil fertility requirements across three villages, for control and trial plots; 2017-2018
The table indicates broadly that the differences between control and trial plots are quite small. P
requirements are on average lower for the trial plots than the control as are the Lime requirements.
%C and %N are on average the same across trial and control plots.
It isassumed from these results that the use of CA in both control and trial plots have evened out any
differences in the soil fertility status between the plots.
Average of soil fertility requirements and indicators for repeat samples across three villages
(Eqeleni, Stulwane, Ezibomvini)
Plot
Village
N
(kg/ha)
P
(kg/ha)
K
(kg/ha)
Lime
(t/ha)
MAP
(kg/ha)
LAN
(kg/ha)
Org C
%
N %
Control
Stulwane
63
41
0
4,4
3,7
3
2,4
0,2
Trial
Stulwane
63
29
0
1,7
3,4
3,2
2,6
0,2
Control
Eqeleni
73
31
0
1,2
2,8
4,2
1,8
0,2
Trial
Eqeleni
73
41
0
0,3
3,7
3,8
1,6
0,1
Control
Ezibomvini
80
60
0
0
3,6
4,3
1,2
0,1
Trial
Ezibomvini
80
40
0
0
5,5
3,6
1,2
0,12

40
Figure 20: Soil fertility requirements and fertiliser recommendations across three villages for control and trial plots; 2017-2018
The figure above provides for the fertilizer recommendations now requiredacross these areas. The
generic recommendation of 5 bags (50kg)/ha MAP and 3 bags (50kg)/ha LAN, along with1t/ha of
lime, can now be reduced to 3,5 bags of MAP/ha and 1 bag/ha of LAN. This indicatesa 30% reduction
in the need for MAP and phosphate and points towards the provision of this nutrient through the CA
practices. For LAN the reduction is even more significant at around 48%.
A practice that participants have not included in their application of CA to their control plots is the
addition of lime. This can be seen in the higher average lime requirement across the control plots. A
recommendation of addition of 3 t/ha of lime to the control plots is to be made in these areas.
As the N recommendation for soil fertility analysis is based on crop requirements, rather than N
present in the soil, these are predictably similar for the control and trial plots. The savings in N are
however calculated through the Haney soil health test process. For these participants the combined
average of savings in inorganic N fertilizer amount to R401,82/ha. This is equivalent to roughly
35kg/ha of N. the reduction in MAP suggested will already reduce the application of inorganic N by
around 9 kg /ha. This suggests a reduction also in the LAN requirement of 26 kg. This is equivalent
to a reduction of roughly 2x50kg bags and means the recommendation can be brought down from 3
to 1x50kg bags of LAN/ha.
A further analysis of the changes in soil fertility status over timehas been made for the Stulwane
participants as an example. The two small figures below represent the results for 2016 and 2017
respectively.
Control averageTrial average
Average of N (kg/ha)68 68
Average of P (kg/ha)36 35
Average of K (kg/ha)0 0
Average of Lime (t/ha)2.8 1.0
Average of MAP (50kgbags/ha)3.3 3.6
Average of LAN (50kg bags/ha)3.6 3.5
0
10
20
30
40
50
60
70
80
Soil fertility averages for 2017 across control and trial
plots for three villages

41
Figure 21: Soil fertility requirements for Stulwane 4th and 5th year participants for 2016 and 2017
From the figures above the following observations can be made:
➢Average pH has increased for control plots and remained similar for the trial plots
➢Average % acid saturation has decreased for both the control and trial plots
➢Avera P required (kg/ha) has increased for the control plots, but remained constant for the
trial plots
➢Average lime requirement (9t/ha) has decreased for both control and trial plots. The
decrease for the trial plots is significant
➢Average % organic carbon has increased slightly for the control plots and increased more
significantly for the trial plots, by an amount of 0,17%. This is equivalent to around 2tC/ha
(using the calculation %C x BD (g/cm3) x SD(cm)x 10 –the assumption here is 10 cm sampling
depth and around 1,3 g/cm3 bulk density.
➢Average % nitrogen in the soil has increased slightly for both control and trial plots.
Given these results, it can be seen that the CA process is improvingsoil fertility status in the soil;
increasing pH, reducing acid saturation and the consequent need for lime applications. There is a
visible reduction in the need for externally applied P, while organic carbon is sequestered in the soil
at a rate of around 2 t/ha.
The Haney Soil health tests for 9 of these 15 participants have also been done for this season.
Averaging the % soil organic matter (SOM) (LOI) from those tests leads to a value of around 3,5 t/ha
sequestered carbon. This value is equivalent to the Cedara % soil organic carbon (SOC) (Walkley
Black) test, given different procedures used, as SOM~ 1,72 x SOC. The tests from the two laboratories
are thus providing the same results.
Control
average
Trial
average
Average of pH4.10 4.10
Average of
%Acid Sat29.90 19.00
Average of P
(kg/ha) 41.00 29.00
Average of Lime
(t/ha) 4.40 1.70
Average of Org.
C %2.40 2.60
Average of N %0.20 0.20
0.00
5.00
10.00
15.00
20.00
25.00
30.00
35.00
40.00
45.00
Stulwane 2017; Soil fertility
averages for control and trial
plots
Control
average
trial
average
Average of pH3.75 4.06
Average of Acid
sat (%)33.56 28.33
Average of P req
(Kg/ha) 37.50 29.44
Average of Lime
req (t/ha)6.00 4.03
Average of Org. C
%2.39 2.43
Average of N %0.14 0.15
0.00
5.00
10.00
15.00
20.00
25.00
30.00
35.00
40.00
Stulwane,2016: Soil fertility
averages for control and trial
plots

42
Case study_Nelisiwe Msele; Stulwane
Nelisiwe is inher 5thyear of programme
participation and has in the past two
seasons taken over the administrative
role of hervillages learning group acting
as Local Facilitator. Nelisiwe has shown
signs of great initiative andhas
contributed tremendously in data
collection in her village having collected
alldata related to planting, crop growth
monitoring, yield data for beans and
maize, cover crop information, rainfall
data and photographs.
Figure 22: Nelisiwe working with Phumzile and Nonkanyiso in filling in the crop growth
monitoring forms
She is also a member of a new savings group in her village Eqaqaneni
savings group, which is in its second year of operation.
In the past years of her programme participation her yields have been good
showing progressive increase, but there has always been cobs
characterized by discoloration and of no use for milling except for making
of brewing malt. Due to this the initial thought was that her field might be
infected by a kind of soil borne disease, but this is slowly disappearing from
her fields, with her current season’s yield at a record 10.27 t/ha for maize
and 1.26 t/ha for beans.
Figure 23: Far right; a view of one of Nelisiwe’s maize only trial plots
She has been actively experimenting both with inter cropping and crop
rotation and has includedsummerand winter cover crops in her plots as
well.
1
M+B
2
M+C
3
M+C
4
M+B
5
B
6
M
7
M
8
B
9
SCC
10
M
Figure 24: Nelisiwe’s trial plot layout.
Figure 25: Far right; a view of Nelisiwe’s SCC trial plot
In addition, she has planted a late season bean trial. She has done this
alongside two other participants in the Stulwane group-Makehti Dladla

43
and Mthuleni Dlamini assessing not only the yields but also the effectiveness of different treatment
when planting (kraal manure versus conventional fertilizer MAP). Both Nelisiwe and Makhethi used
animal traction. The layout sketched below was used. Plot size was 100 m2.
1
Beans
(Fert)
2
Beans
(Fert)
3
WCC + SCC
(Fert)
4
Beans (kraal
manure)
Below is a table outlining the yields obtained for this experiment.
Table 14: Late bean experiment yields comparing use of fertilizer with kraal manure (Stulwane)
Participant name
Treatment
Fertilizer
Yield (Kg)
t/ha
Kraal Manure (Kg)
t/ha
Nelisiwe Msele
18.12 kg
0,9
9.06 kg
0,9
Makhethi Dladla
4.53 kg
0,23
0 kg
0
Mtholeni Dlamini
4.53 kg
0,23
4.53 kg
0,23
Figure 26: (Left) Neliwise’s late bean yield and (Right) a view of her maize and cowpea intercropped plot.
Case study Phasazile Sithebe: Stulwane
During the initial stages of her participation, Mam Phasazile Sithebe was experiencing serious acidity
problems in her fields with stunted yellowing plants and poor yields. In the 2016/2017 season she
conducted one of three liming experiments in the Bergville area. Her lime recommendation was 11
t/ha and in the 2016-2017 planting season 22 x 50kg bags of lime was added to her ploughed and CA
plots. Her yields in the 2016/2017 season after the application of lime were 2.08 t/ha maize and 0.12

44
t/ha beans. Thishas more than doubled in the 2017/2018 season with her obtaining 4.75 t/ha maize
and 1.087 t/ha beans.
Trial Layout 2017/2018 – Mam Phasazile Sithebe, with maize yields 2017-2018
1
M+C
17.342kg
2
M+C
26.441kg
3
M+B
43.651kg
4
M+B
32.272kg
5
M
63.972kg
6
B
7
SCC
8
M
31.313kg
9
B
10
M
26,665kg
The yields for maize, having been collected for each plot, show quite a high variation.
Averages are as follows and indicates her best yields to be in the maize and bean intercropped plots.
Plot
Average yield (kg/plot)
M – maize only
32,32
M+B- maize and bean intercrop
37,96
M+C – maize and cowpea intercrop
21,89
Figure 27Above left: Phasazile Sithebe’s trial plots with beans only in the foreground and a maize only plot behind that. Above
right: her SCC plot
Case study Letiwe Zimba: Ndunwana
Lethiwe Zimba, a mother of two, is one of the younger participants in the programme, at 30yrs old.
This is her 4thyear of programme participation in the Ndunwana learning group. She reports that her

45
yields have been increasing every year and that she received good yields this season 2017-2017. She
harvested around 10,3 t/ha of maize (a total of around 620 kgs from her trial plot) and around 0,3
t/ha of beans.
Yields obtained from her trial are enough to satisfy the needs of her family of 6 for at least 9 months
and she is confident that this year’s yields will be able to keep her family going until the next
harvesting season set to begin in May - June 2019.
She is a member of the Mphelandaba
VSLA and one of the book-keepers of
her village. She has been saving in
this group for the past 3 years and
saves at least R 100.00 per month.
Figure 28: Centre with purple pinafore and
book on lap. Lethiwe attending a savings
group meeting in her village
She states that the share out from
this association not only assists her
in satisfying household necessities
but also helps her to be ready for the upcoming planting season as the share out for her group is in
October of every year. This means she is able to contribute toward input subsidies and buy other
inputs such as fertilizer for her control plots
She has nothing but praises
for intercropping, especially
that of maize and cowpea,
which she has seen to have a
significant effect on the
subsequent maize crop that
is characterized by good crop
growth and good cob
formation.
Figure 29: A view of Lethiwe Zimba’s
trial plot showing stunted cover
crop growth_ the plot with yellow
flowers on the right- hand side of
the maize planting

46
Although she has learnt about the benefits of including cover crops in the CA system, especially
regarding the benefits they have for the soils, she shares that she prefers the intercrop more because
of already limited access to
agricultural land. She does
not want to relinquish land for
crops other than food crops
She commentedthat while
this year was her first year of
experimentation with cover
crops, their growth was
unpleasing; although the
germination was, the
subsequent growth was
stunted and seeding
unsuccessful.
Figure 30:Lethiwe Zimba’s maize yields for the 2017/2018 season
Yields in intercropped and rotated plots
Maize yields for different plots within the experimentation regime were taken for a few of the longer
term participants.

47
Table 15: Maize yields calculated for each plot in a few longer participant trials
The yields across the plots vary considerably for all eight participants. The expectation is that after a
number of years, the mixture of intercropping and crop rotation would mean that the soil builds up
across the plots and that the yields would even out as they increase. This is as yet not happening.
A more in-depth look at the actual rotations and yields for one of the participants, Phumelele
Hlongwane, are presented in the table below.
Table 16: Maize yields per plot in Phumelele Hlongwanes rotation system:2015-2017
Phumelele Hlongwane: Comparison of maize yields per plot:2015-2017
Plots
2015/2016 season
2016/2017 Season
2017/2018 Season
Crops Planted
Yields
(t/ha)
Crops planted
Yields
(t/ha)
Crops
planted
Yields
(t/ha)
Change
in yield
(t/ha)
Plot 10
Maize +Beans
8,3
Maize + Beans
8,8
Maize
11,5
2,8
Plot 9
Maize +Cowpea
8,7
Maize + Beans
8,9
SCC
Plot 8
Maize + Beans
10,4
Maize +
Cowpea
7,7
Beans
Plot 7
Maize +Cowpea
6,9
Maize
6,5
Maize + Beans
16,3
9,8
Plot 6
Maize +Lab-lab
3,4
SCC
Maize +
Cowpea
12,4
Plot 5
Lab-Lab
NA
Maize
8,8
Lab-Lab
NA
Area
Nameand
Surname
Trial descriptionPlot 1Plot 2Plot 3Plot 4Plot 5Plot 6Plot7Plot 8Plot 9Plot 10Total KgTon/ha
Ntombakhe
Zikode
Plt 1-4: M+B (20*20), Plt 5-8: M+B
(20*20),Plt 9 M+C (10*10)
150,86142, 4538,54331,864,92
Tholwhephi
Mabaso
M only(10*20), Bonly,M only, M only,
M+C, Scc, M+B, M only, M only
167,32B only83,24115,75102,55Scc67,6450,6258,47B only645,598,90
Phumelele
Hlongwane
Plt 1(m only), Plt 2 (m+b), Plt 3 (M
only),Plt 4 (m only) Plt 5 (lab lab), Plt
6 (m+c), Plt 7( m+b), Plt 8 ( b only), Plt
9 (Scc), Plt 10 (M only)
89,7884,99110,22103,07lab- lab74,6898,07B onlyScc115,23676,0510,82
Cabangani
Hlongwane
Plt 1(m only), Plt 2 (m+c), Plt 3
(m+b),Plt 4 (m+ c) Plt 5 (m only), Plt 6
(m only), Plt 7( lab lab), Plt 8 ( m
only), Plt 9 (b only), Plt 10 (Scc)
28,9960,2464,8434,2133,8942,42lab- lab45,15bonlyScc309,744,95
Nelisiwe Msele
plot 1(m+b), plot 2(m+cp), plot
3(m+cp), plot 4(m+b),plot 5( b only),
plot 6(m only), plot 7(m only),plot 8( b
only),plot 9( scc), plot 10(m only)
77,2180,8760,8186,11B only95,98114,29B onlyScc101,03616,2910,27
Khulekani
Dladla
Plt 1(m+cp), Plt 2( m+cp), Plt3 (m+b),
Plt 4 (m+b), Plt 5 (m+b), Plt 6 (m only),
Plt 7 (b only), Plt 8 (m only), Plt 9
(Sunflower) Plt 10 (Sunhemp and
Millet)
22,0224,9028,6927,3532,10b onlyb only39,41
Sunflow
er
Millet
and
sunhemp
174,47 3,49
Phasazile
Sthebe
Plt 1(m+cp), Plt 2( m+cp), Plt3 (m+b),
Plt 4 (m+b), Plt 5 (M only), Plt 6 (B
only), Plt 7 (Scc), Plt 8 (M only), Plt 9
(b only) Plt 10 (M only)
17,3426,4443,6533,0868,57b onlyScc31,31b only22,67243,074,75
Ndunwana
Boniwe
Hlatshwayo/
Mthembu
Plt 1: M+C , Plt 2: M+B,Plt 3 M+C, Plt
4: M+B
74,49 85,8180,1784,97325,4410,85
Stulwane
Ezibomvini
Eqeleni
Yield of Maize(kg)
Yields per plot for a selection of participants: 2017-2018

48
Plot 4
Maize+ Beans
8,7
Lab-lab
Maize
10,3
Plot 3
M +SCC+WCC
8,7
Maize + Beans
10,1
Maize
11,0
0,9
Plot 2
SCC
Maize
10,0
Maize + Beans
14,2
4,2
Plot 1
Maize +Beans
6,9
Maize
6,2
Maize
8,9
2,7
This season (2017-2018) has seen a remarkable increase in yield across all the plots where maize
has been grown, with yields that seem to be almost unheard of. These calculations and yields have
been checked and re-checked given this near impossible outcome and appear to be correct as far as
the team can tell. The variety of maize planted was PAN6479.
Rainfall as recorded by the farmers has averaged around 563mm this season as compared to an
average of around 527mm for last season. These amounts are considered similar enough to not have
a major influence on yield differences noticed.
The difference in maize yield from one plot to another does not appear to be directly related to the
previous rotations, although in general those that include legumes and summer cover crops in a three
year rotation prior to planting a monocrop of maize, are higher than the plots where maize has
followed on maize.
Cover crops
The inclusion of summer cover crops in the plantings were expanded from 4 to 8 villages in this
season; Ezibomvini (11), Eqeleni (9), Stulwane (14), Vimbukhalo (6), Ngoba (6), Ndunwana (4),
Thamela (8) and Emabunzini (6). A total of 65 particpants thus planted SCC (summer cover crops
Each participant received three cups with the following seeds: 1 cup sunflower, 1 cup sunhemp and
1 cup millet (enough for 100 m2). These were planted in rows and a number of variations were
practiced in the different villages. Ezibomvini, Eqeleni and Stulwane practiced the following planting
system:
-2 rows of a mix of sunhemp and millet
-2 rows ofsunflower
This was done because past experience has taughtthe participants that when the cover crops are
mixed together the sunflower does not do well in terms of overall growth and seeding.

49
While the germination of the
cover crops was reasonably
good this season, the
subsequent growth and
seeding for all was
unpleasing, Very few
participants obtainedyields.
Participants attribute this to
a significant dry spell that
took place in the critical
growth stages of the plants.
No seed was harvested for
either millet or sunnhemp.
For sunflower around 30% of
the participants harvested an
average of 5 kg seed each (~0,4
t/ha).
Figure 31: Above right- SCC planting for
Zodwa Zikode in Ezibomvini – And Below
right; SCC planting for Valindaba Khumalo
from Vimbukhalo
In Stulwane, all participants in
their 2nd- 5thyears of
implementation planted SCCs.
This can be attributed to the fact
that this village has a very active
interest in livestock, as they use
animal traction and are also interestedin producing fodder at a larger scale. However out of the 15
participants who planted cover crops more than half (53%) reported issues of either birds feeding
on the seeding cover crops or interference by stray livestock. Only four participants recordedany
yield. Thulani Dlamini and Khulekani Dladla recorded the highest yields in all villages of4.805 kg and
9.61 kg respectively, but also kept seed of winter cover crop oats with yields of 5 litres each. In
previous years participants have always recorded yields for sunflower but seldom for millet as birds
have always fed on this, but this season birds seemed to attack the sunflowers as well.
Yields (Kg) of SCC
Ezibomvini
Sunflower
Millet
Sunnhemp
Phumelele Hlongwane
5.76 kg
-
-
Zodwa Zikode
0.823 kg
-
-
Fikile Zikode
0.653 kg
-
0.07 kg
Gcinekile Zikode
0.961 kg
-
-
Eqeleni
Smephi Nkosi
4.805 kg
-
-

50
Ngoba
Thembelani Hlongwane
0.961 kg
-
-
Vimbephi Dladla
2.403 kg
-
-
Ntombenhle Hlongwane
2.403 kg
-
-
Stulwane
Khulekani Dladla
9.61 kg
-
-
Thulani Dlamini
4.805kg
-
-
Mtholeni Dlamini
4.805 kg
-
-
Cuphile Buthelezi
4.805 kg
-
-
Winter cover crops
A mixedcover crop combination of five crops was distributed to participants in the Bergville area
who wanted to experiment with WCC (winter cover crops). This included Sunnhemp, millet, Saia oats,
fodder radish and fodder rye. The mix of both summer and winter cover crop species is made as these
are planted during February. Planting later has given very lowgermination and growth results. As
February isstill quite warm, it is considered that a good over can be achieved by mixing both summer
and winter cover crops together. Experimentation with a range of other cover crops would also make
sense. In the past two seasons that this 5 species mix has been used, all 5 crops have germinated
reasonably well on grown to provide good vegetative cover.
The table below indicates the participants who received WCC for experimentation.
Ezibomvini
Eqeleni
Stulwane
Gcinekile Zikode
Ntombakhe Zikode
Khulekani Dladla
Nombono Dladla
Thulile Zikode
Thulani Dlamini
Phumelele Hlongwane
Sbongile Mkhonza
Makhethi Dladla
Smephi Hlatshwayo
Nelisiwe Msele
These WCC’s were broadcasted onto beans
only plots after harvestedand raked in. For
the relay-cropping they were broadcasted
once beans were harvested in between the
maize rows. Germination and growth has
been reasonable this season. The green tops
of the radishes are used as ‘imifino” or spinach
in the households. WCC were grazed by
livestock once the maizewas harvested and
cattle let back into the village. Phumelele
Hlongwane from Ezibomvini has fenced her
field plots and can now manage the grazing in
her field. For other participants cattle feed
until they have finished the fodder.
Figure 32: Ntombakhe Zikode’s field planted to winter
cover crops (Oats seen clearly )

51
.
Figure 33: Pictures above show winter cover crops “Winter master- Oat, fodderradish, & fodder peas” planted by Phumelele
Hlongwane, in a plot that was planted to beans only.
In Stulwane both Khulekani Dladla and Dlezakhe Hlongwane harvested seed from their Saia oats.
Both reported harvesting around 5 kg of seed (~0,4 t/ha). They kept the WCC until they had seeded
and provided cut and carry fodder to their livestock in their kraals.

52
Figure 34:: Above left; Khulekani Dladla’ss summer cover crop “Sunflower yield” . Above right; Nelisiwe Msele’s sunflower
yield.
Figure 35: Above left & right shows Thulani Dlamini & Khulekani Dladla’s winter cover crop” oat yield”
Yield summaries
Below is a summary table for maize and bean yields obtained and measured in the Bergville area.
There were a number of participants who did not obtain any yields due to crop failure and livestock
invasions. Some participants however did really well. So, the trend of vastly different yields between
participants even within the same learning group has continued.
Table 17: Yield summaries for maize and beans for Bergville viallges;2017-2018
Village
Maize
(Trial) t/ha
Maize
(Control)
t/ha
Maize (min-
max) t/ha
Beans
(t/ha)
Beans
(min-
max) t/ha
Stulwane (older)
3,8
-
0,6-10,3
0,84
0,5-1,9
Stulwane (new)
2,3
-
0,4-5,7
1,75
0,7-2,7
Ndunwana (older)
5,3
3,8
1,7-10,8
1,46
0,3-1,8
Ndunwana (new)
2,2
1,5
0,8-6,0
0,47
0,3-0,9
Ezibomvini
8,1
7,5
4,4-13,5
1,62
0,5-2,2
Eqeleni (older)
7,8
3,7
0,9-9,4
1,37
0,3-2,2
Eqeleni (new)
1,0
0,96-1,1
0,26
0,2-0,3
Thamela
4,5
1,8
1,6-7,3
0,51
0,0-1,3
Emabunzini
4,6
-
2,7-10,2
0,94
0,0-2,7
Emazimbeni
7,9
-
3,2-10,6
1,28
0,2-2,1
Vimbukhalo
7,9
-
3,5-10,3
1,29
0,04-2,1
Emangweni- Emaqeleni
5,9
-
0,7-7,9
1,80

53
Okhombe
3,5
-
1,4-9,6
-
Magangangozi
2,8
2,5
0,5-6,7
0,5
0,5
Nsuka
2,8
-
0,0-8,3
-
Thunzini
3,6
-
0,4-9,5
1,2
0,7-2,0
Ngoba
4,2
-
0,8-10,9
0,5
0,2-0,9
Mhlwazini
6,6
2,7-10,9
Emahlathini (new)
5,9
3,8-9,6
1,09
0,5-1,4
AVERAGE (older)
5,7 t/ha
3,4 t/ha
1,22 t/ha
The average yield for the maize CA trials has increased slightly from the 2016/2017 season from 5,03
t/ha to 5,7 t/ha. The maximum yield was recorded at 13,5 t/ha this season. Average bean yields for
the trials have also improved slightly from 1,05 t/ha to 1,22 t/ha.
Measurement of control yields has been a problem this season. A new procedure where participants
were meant to harvest form a proportion of their control plots, the same size as their trials were tried
out. Very few participants actually did this. Control yields were generally just big piles and it was not
possible to estimate the harvest. In the cases where participants have now fully incorporated CA into
their original control plots, these were no longer measured as controls.
In addition some yields were not monitored; specifically in Emangweni where violence in the
community meant the field team could not gain access.
Progress per area of implementation
A few of the learning groups in the Bergville area are also supported through the KZN DARD. This has
mostly occurred in Ezibomvini, which is presentlythe most organised and active learninggroup.
They have received support in planting orange fleshed sweet potatoes and also now have a registered
Co-operative - the Gcinekile Primary Co- Operative established in the year 2016. This Co-op consists
of 12 members and is headed by Phumelele Hlongwane. These Co-ops are supported with all inputs
required for planting, including seed, fertilizer, as well as planting and in the 2017/2018 planting
season the group has been assisted to plant 3 ha of dry beans. Yieldsobtained here are shared equally
among participating members and in this past season 08 x 50 kg bags of dry beans were obtained as
yield. This translated to at least 2 x20litres of dry beans for each registered member. Other villages
receiving limited support from DARD include Eqeleni and Ngoba.
Stulwane
Stulwane is one of the oldest villages in the programme having joined in the 2013/2014 season. They
are situated in the Emmaus central area of Bergville with neighbouring villages such as Ezibomvini,
Eqeleni and Thunzini. To date the group has a total membership of 19 members, with 5 of these
members having joined in the 2017/2018 season. A new group has been established as an extension
of this area in the 2017/2018 season and this group has12 members who are in their first year of
programme participation.

54
The following experiments are being run in this village:
•Collecting village weather data i.e rainfall
•Late bean planting using different treatments
•Liming experiment to rectify excessive soil acidity issues
Livestock has presented a major challenge to this year’s yields in the village with numerous farmers
reporting invasion of stray livestock either early season or late season, which led to farmers with
good management practices of trials in terms cropping practice and general maintenance obtaining
relatively lesser yields than previously recorded.
Khulekani Dladla and Mtholeni Dlamini of Stulwane were among the best performers in the
2016/2017 season with yieldsof 7.16 t/ha and 3.85 t/ha of maize respectively. Their bean yields
showed signs of slight decreases, not as a matter of mismanagement but due to the invasion of stray
livestock into their fields. Drybean yields were recorded at 0.63 t/ha and 1.81 t/ha for dry beans in
the previous season and in the current season 2017/2018 season their yields have been recorded at
0.54 t/ha and 1.08 t/ha showing decreases of 0.09 t/ha and 0.73 t/ha respectively.

55
Yields
Table 12 shows the yields of the 2017-18 season in Stulwane.
Table 18: Stulwane maize yields 2017-2018
An analysis of maize yields for newer and older participants in the village follows.
Surname
Name
Trial size
(m2)
Yield t/ha
Maize
Beans
Buthelezi
Cuphile
1000
2.909
0.724
Dladla
Khulekane
1000
3.489
0.543
Dladla
Makethi
1000
1.581
0.494
Dlamini
Mthuleni
1000
0.654
1.087
Dlamini
Bangeni
1000
3.882
1.268
Dlamini
Thulani
1000
2.292
0.724
Hlongwane
Dlezakhe
1000
4.24
0.181
Hlongwane
Nokwaliwa
1000
9.058
1.977
Miya
Kethabahle/Getty
1000
1.785
0.164
Sithebe
Phasazile
1000
4. 753
1.087
Zondi/buthelezi
Nothile
1000
2.125
0.181
Msele
Nelisiwe
1000
10.27
1.268
Zondo
Hluphizwe
1000
1.899
1.087
Gumbi
Matolozane
1000
4.504
0.906
New Participants 2017/2018
Dlamini
Dombi
400
1.202
0.776
Zikode
Mantombi
400
1.894
2.718
Mthembu
Hlaleni/flaurence
400
0.497
0.724
Hlatshwayo
Fikile
400
1.812
Dlamini
Dombolo
400
5.699
2.718
Average
3.48 t/ha

56
From the above chart we can see that 37% of the participants in their 4th- 5thyear of programme
participants in the 2017/2018 season obtained more than 4t/ha while 27% obtained between 3-4
t/ha of maize yield. The effects of stray livestock is evident in this as18% of these participants
obtained yields between 0 – 2t/ha of maize yield. The average yield for the 4th-5th year participants
is 4.30 t/ha
When comparing the yields of the newer participants to these, it can be seen that a larger proportion
of the longer term participants (37%), versus 13% of the new entrant participants have managed to
obtain yields higher then 4t/ha.
No. of participants,
0 t/ha - 1 t/ha, 1,
9%
No. of participants,
1 t/ha - 2 t/ha, 1,
9%
No. of participants,
2 t/ha - 3 t/ha, 2,
18%
No. of participants,
3 t/ha - 4 t/ha, 3,
27%
No. of participants,
< 4 t/ha , 4, 37%
% Maize Yield t/ha Stulwwane 4th -5th yr pp.
0 t/ha - 1 t/ha
1 t/ha - 2 t/ha
2 t/ha - 3 t/ha
3 t/ha - 4 t/ha
< 4 t/ha

57
The newer entrants into the programme are seen to be making good progress as a combined 38% of
these participants obtained yields more than 2 t/ha and 13 percent of these with yields of > 4t/ha.
Figure 36: Top left picture: show Mrs. Phasazile Sthebe’s maize yield, Middle centre: Mtholeni Dlamini’s maize yield & Top
right: Thulani Dlamini’s maize yield.
No. of participants,
0 t/ha - 1 t/ha, 1,
12%
No. of
participants, 1
t/ha - 2 t/ha, 4,
50%
No. of
participants, 2
t/ha - 4 t/ha, 2,
25%
No. of participants,
< 4 t/ha , 1, 13%
% Maize Yield t/ha Stulwane 1st - 3rd yr pp
0 t/ha - 1 t/ha
1 t/ha - 2 t/ha
2 t/ha - 4 t/ha
< 4 t/ha
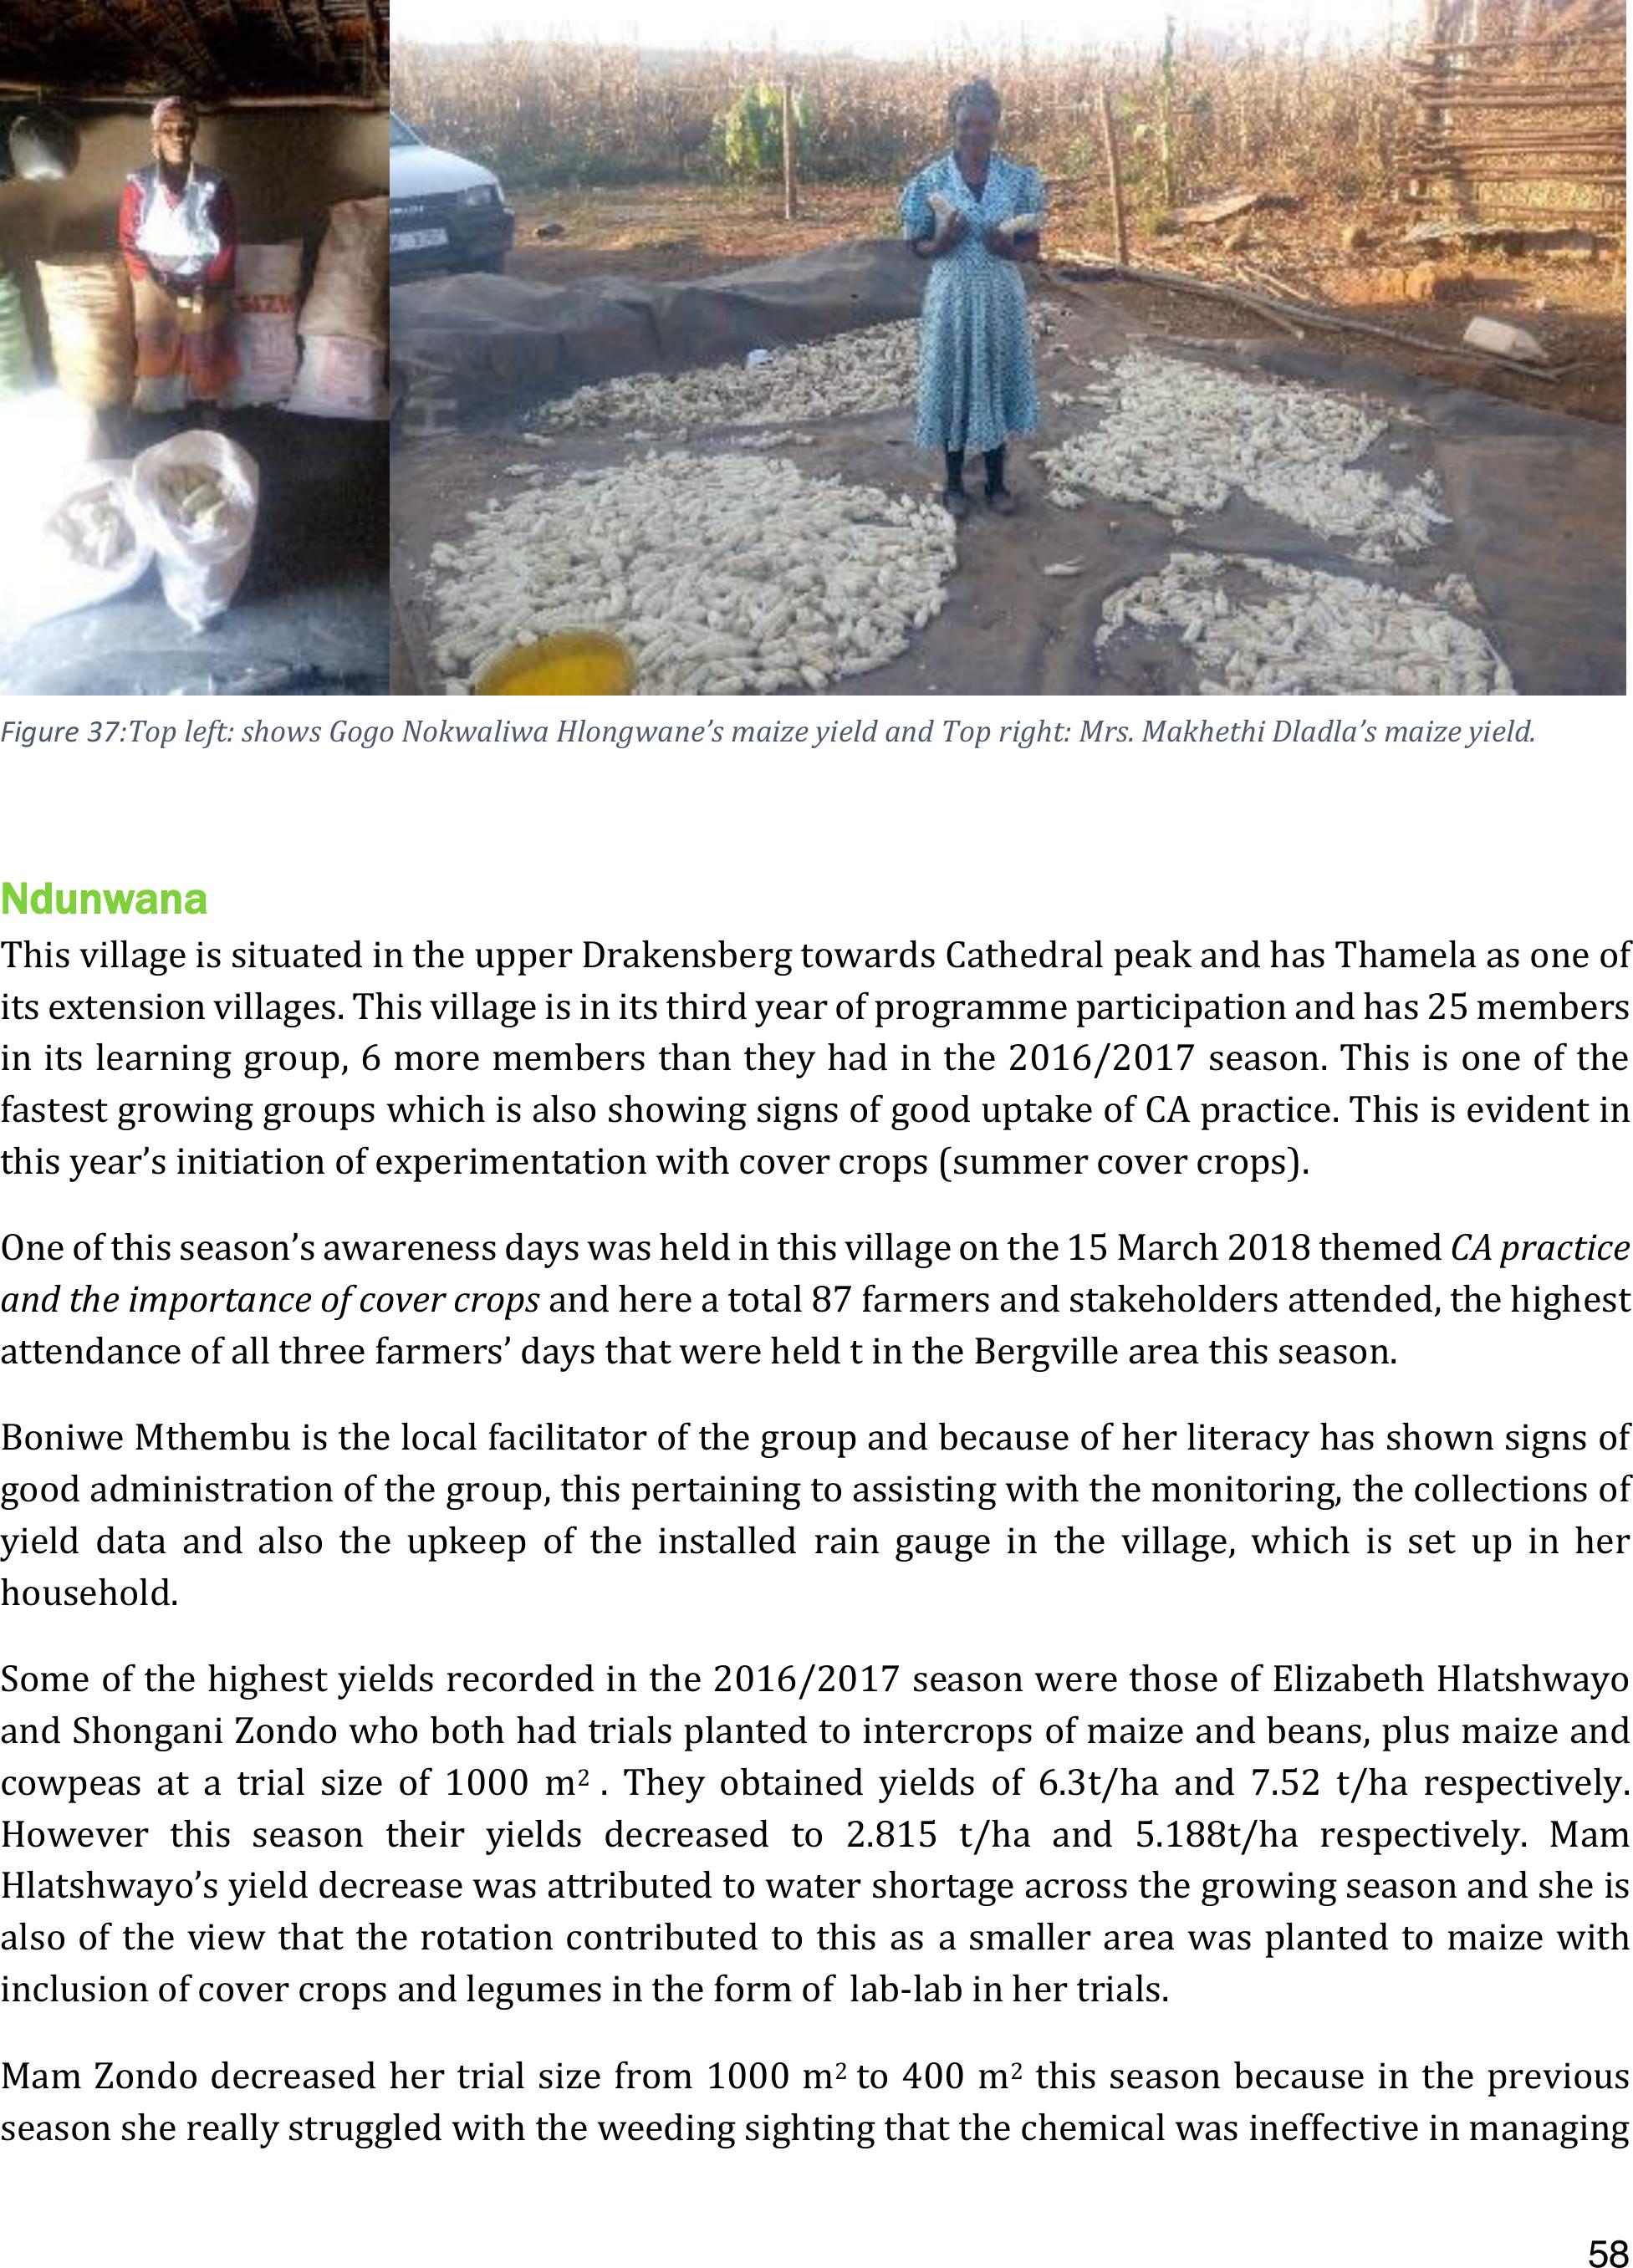
58
Figure 37:Top left: shows Gogo Nokwaliwa Hlongwane’s maize yield and Top right: Mrs. Makhethi Dladla’s maize yield.
Ndunwana
This village is situated in the upper Drakensberg towards Cathedral peak and has Thamela as one of
its extension villages. This village is in its third year of programme participation and has 25 members
in its learning group, 6 more members than they had in the 2016/2017 season. This isone of the
fastest growing groups which is also showing signs of good uptake of CA practice. This is evident in
this year’s initiation of experimentation with cover crops (summer cover crops).
One of this season’s awareness days was held in this village on the 15 March 2018 themed CA practice
and the importance of cover crops and here a total 87 farmers and stakeholders attended, the highest
attendance of all three farmers’ days that were held t in the Bergville area this season.
Boniwe Mthembu is the local facilitator of the group and because of her literacy has shown signs of
good administration of the group, this pertaining to assisting with the monitoring, the collections of
yield data and also the upkeep of the installed rain gauge in the village, which is set up in her
household.
Some of the highest yields recorded in the 2016/2017 season were those of Elizabeth Hlatshwayo
and Shongani Zondo who both had trials planted to intercropsof maize and beans, plusmaize and
cowpeas at a trial size of 1000 m2 . They obtained yieldsof 6.3t/ha and 7.52 t/ha respectively.
However this season their yields decreased to 2.815 t/ha and 5.188t/ha respectively. Mam
Hlatshwayo’s yield decrease was attributed to watershortage across the growing season and she is
also of the view that the rotation contributed to this as a smallerarea was planted to maize with
inclusion of cover crops and legumes in the form of lab-lab in her trials.
Mam Zondo decreased her trial size from 1000 m2 to 400 m2this season because in the previous
season she really struggled with the weeding sighting that the chemical was ineffective in managing

59
her weed problem, but apart from this she had obtained good yields from both her trial and control,
which meant she had more than enough maize to keep her family going for the year.
Yields
Ndunwana Maize yields 2017/2018
Surname
Name
Trial size (m2)
Yield
t/ha
Maize
Beans
Hlatshwayo
Elizabeth/Nomgqibelo
1000
2.8152
1.208
Hlatshwayo/Mthembu
Boniwe
400
10.848
2.718
Hlongwane
Alexina
400
5.7363
0.906
Hlongwane
Nombuso
400
5.430
0.906
Khumalo
Zandile
400
0.906
Mafokeng
David/Bonani/lethiwe
1000
10.362
1.812
Manatha
Gcineni Mavis
400
1.0793
0.906
Zondo/Mazibuko
Shiyiwe
400
2.480
1.812
Mdluli
Makhu
1000
3.957
1.208
Nkala
Tholiwe
400
0.906
Zondo
Matozo
400
9.653
2.718
Zwane
MkhiPheni
Deceased
Zondo
Shongani
400
5.188
1.812
Hlongwane
Phendukile
400
0
0.362
Mdluli
Khipha/Khosi
400
1.734
1.812
Sithole
Lihle/Hilda
400
0.362
Mkhonza
Sbongile
400
4.649
3.624
Vilakazi
Zabi
400
was absent
0.906
Zondo
Thoko
400
6
0.906
Zimba
Phetheni
400
2.263
0.362
Zondo
Gcwalisile
400
0.038
0.362
Nxumalo
Nomfundo/khosi
400
2.036
0.362
Shabalala
Thembeka
400
0.75
0.362
Average
3.74 t/ha
1.19 t/ha

60
Figure 38: Left- Mrs. Elizabeth Hlatshwayo’ss yield, Middle - Shongani Zondo and Right MDF field team counting Mam
Nombuso Hlongwane’s maize yield.
Magangangozi
Magangangozi village is situated between Mhlwazini and Ngoba villages and they joined the CA
programme- in 2014. This village has a total number of 8 participants for the 2017/2018 season. The
progress has been slow due to lack of commitment ofparticipants and poor maintenance ofthe trials.
The present participants all joined as new participants in this season. A training workshop was held
on the 4th of December 2017 before their planting season. The agenda included herbicide and
pesticide application, planting of the trial following CA principles and trial maintenance including
good timing of weeding management. Trial management was better for this season when compared
to the old participants.
Table 19: Magangangozi maize yields:2017-2018
Surname & Names
Trial description
Maize(t/ha)
1.Hlongwane Buselaphi
2(m+b), 2(m+cp)
4.12
2.Zondo Thulile
2(m+b), 2(m+cp)
6.71
3.Mdakane Buselaphi
2(m+b), 2(m+cp)
0.50
4.Dubazane Shonisile
2(m+b), 2(m+cp)
0
5.Mdakane Bongile
2(m+b), 2(m+cp)
2.68
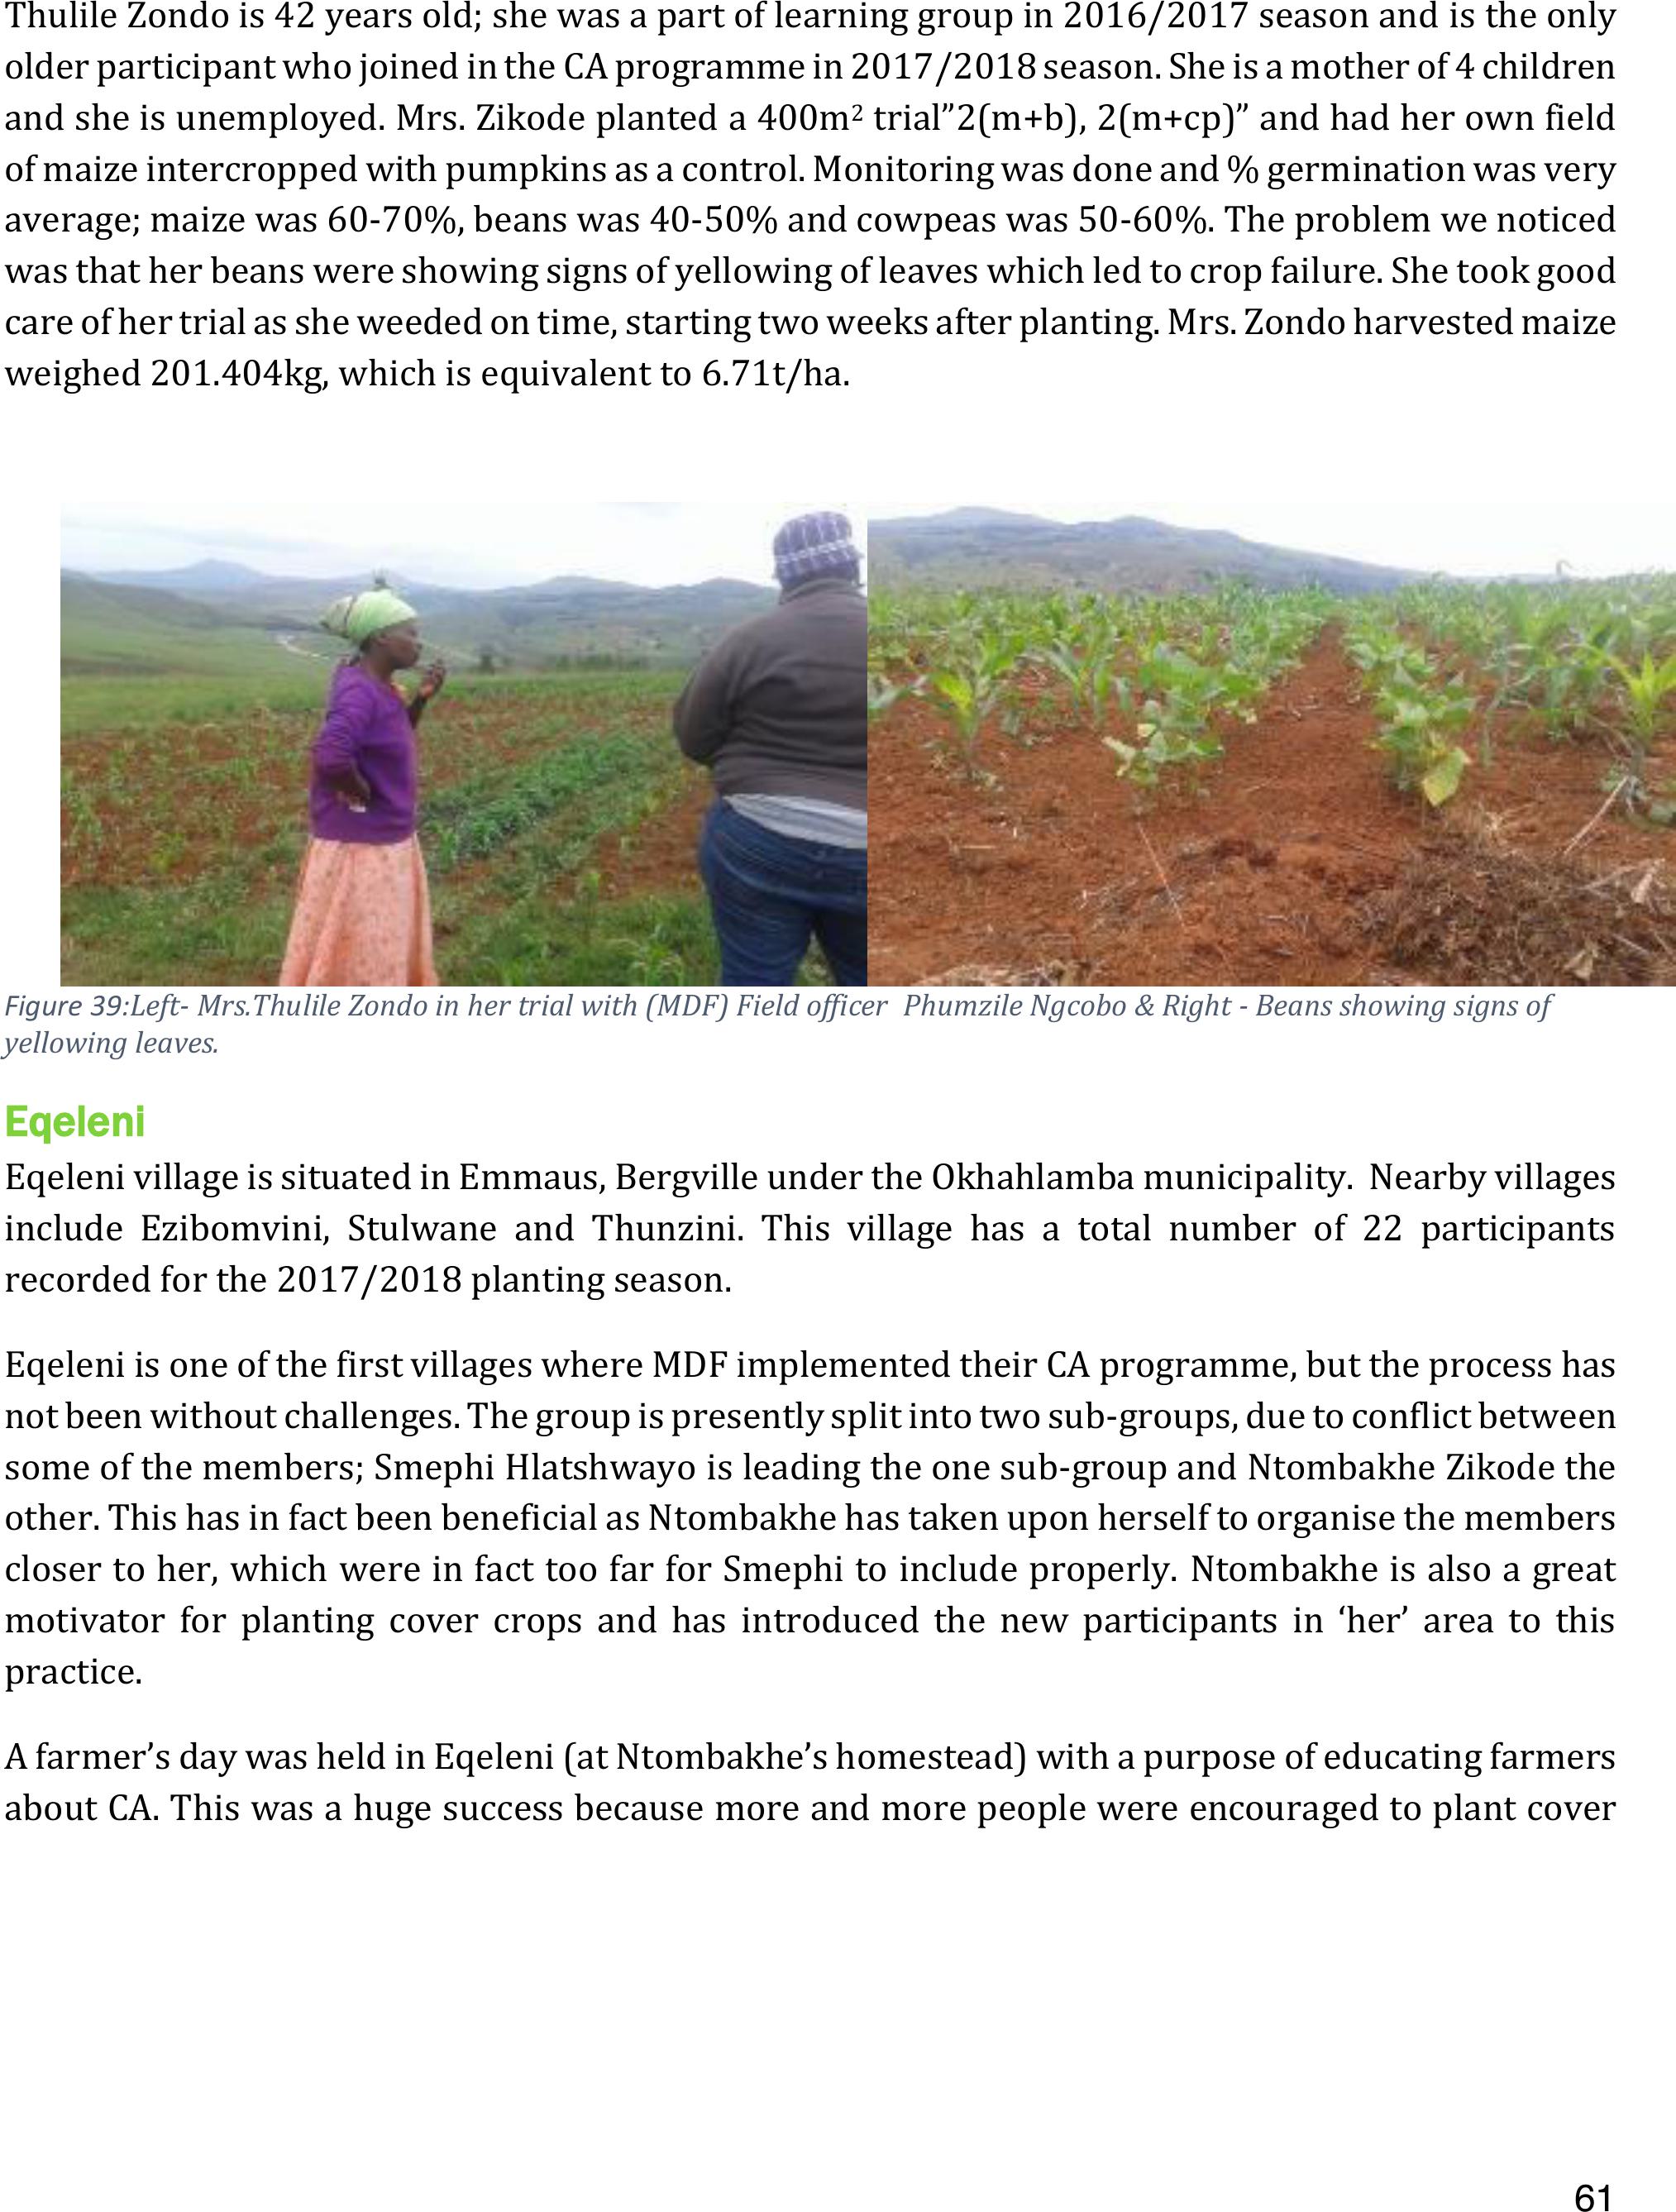
61
Thulile Zondo is 42 years old; she was a part of learning group in 2016/2017 season and is the only
older participant who joined in the CAprogramme in 2017/2018 season. She is a mother of 4 children
and she is unemployed. Mrs. Zikode planted a 400m2trial”2(m+b), 2(m+cp)” and had her own field
of maize intercropped with pumpkins as a control. Monitoringwas done and % germination was very
average; maize was 60-70%, beans was 40-50% and cowpeas was 50-60%. The problem we noticed
was that her beans were showing signs of yellowing of leaves which led to crop failure. She took good
care of her trial asshe weeded on time, starting two weeks after planting. Mrs. Zondo harvested maize
weighed 201.404kg, which is equivalent to 6.71t/ha.
Figure 39:Left- Mrs.Thulile Zondo in her trial with (MDF) Field officer Phumzile Ngcobo & Right - Beans showing signs of
yellowing leaves.
Eqeleni
Eqeleni village is situated in Emmaus, Bergville under the Okhahlamba municipality. Nearby villages
include Ezibomvini, Stulwane and Thunzini. This village has a total number of 22 participants
recorded for the 2017/2018 planting season.
Eqeleni is one of the first villages where MDF implemented their CA programme, but the process has
not been without challenges. The group is presently split into two sub-groups, due to conflict between
some of the members; Smephi Hlatshwayo is leading the one sub-group and Ntombakhe Zikode the
other. This has in fact been beneficial as Ntombakhe has taken upon herself to organise the members
closer to her, which were in fact too far for Smephi to include properly.Ntombakhe is also a great
motivator for planting cover crops andhas introduced the new participants in ‘her’ area to this
practice.
A farmer’s daywas held in Eqeleni (at Ntombakhe’s homestead)with a purpose of educating farmers
about CA. This was a huge success because more and more people were encouraged to plant cover
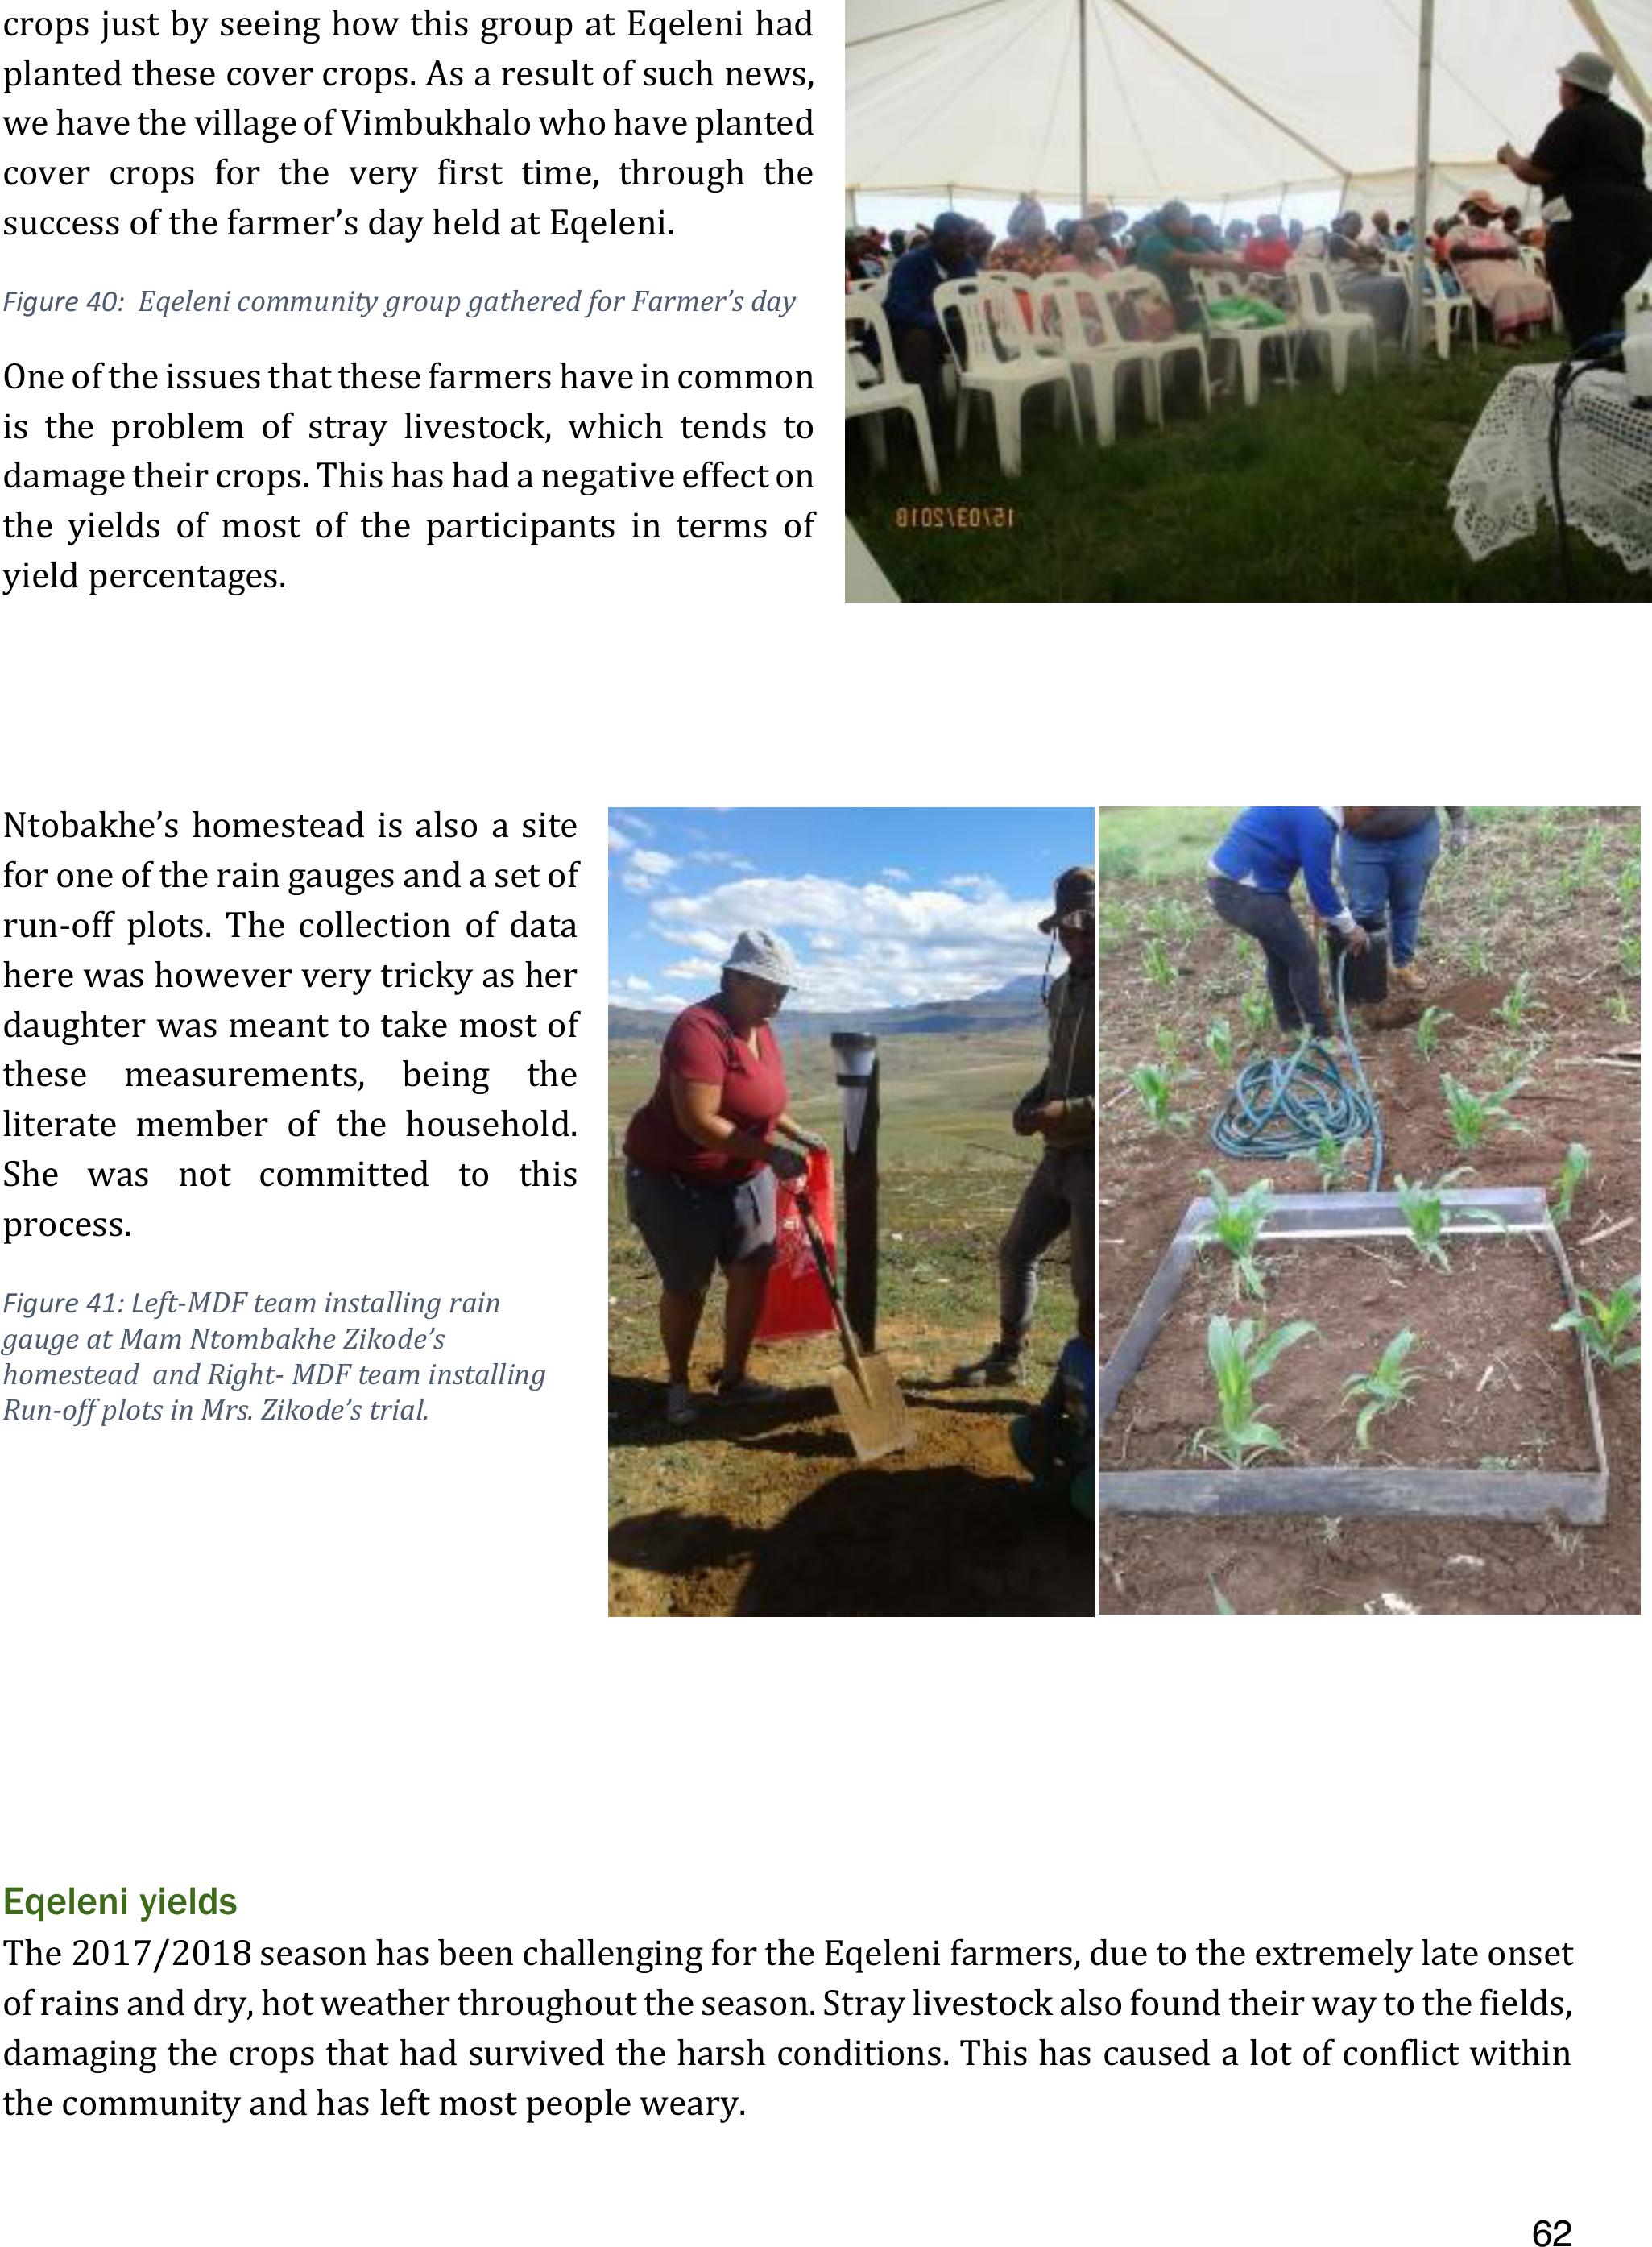
62
crops just by seeing how this group at Eqeleni had
planted these cover crops. As a result of such news,
we have the village of Vimbukhalo who have planted
cover crops for the very first time, through the
success of the farmer’s day held at Eqeleni.
Figure 40: Eqeleni community group gathered for Farmer’s day
One of the issues that these farmers have in common
is the problem of stray livestock, which tends to
damage their crops. This has had a negative effect on
the yields of most of the participants in terms of
yield percentages.
Ntobakhe’s homestead is also a site
for one of the rain gauges and a set of
run-off plots. The collection of data
here was however verytricky as her
daughter was meant to take most of
these measurements, being the
literate member of the household.
She was not committed to this
process.
Figure 41: Left-MDF team installing rain
gauge at Mam Ntombakhe Zikode’s
homestead and Right- MDF team installing
Run-off plots in Mrs. Zikode’s trial.
Eqeleni yields
The 2017/2018 season has been challenging for the Eqeleni farmers, due to the extremely late onset
of rains and dry, hot weather throughout the season. Stray livestock also found their way to the fields,
damaging the crops that had survived the harsh conditions. This has caused a lot of conflict within
the community and has left most people weary.

63
Besides all theseissues, the farmers were able to get some yields,even though most of them were not
impressed with what they were able to harvest.
Figure 42: Left and centre-Maize yields for Mrs. Sbongile Zikode and Right- maize yields for Ntombakhe Zikode
The chart below indicates that despite the harsh conditions,67% of the participants were able to
achieve a yield higher than 4 t/ha, with one participant by the name of Smephi Hlatshwayo achieving
remarkable yields of of 13.5 t/ha. 22% had a yield between 3-4 t/ha and 11% had a yield between 0-
1 t/ha..
No of
participants,
0t/ha-1t/ha, 1,
11%
No of
participants,
3t/ha-4t/ha,
2, 22%
No of
participants,
4t/ha<, 6,
67%
% Maize Yield t/ha Eqeleni
0t/ha-1t/ha
3t/ha-4t/ha
4t/ha<

64
Figure 43: A summary of maize yields achieved in Eqeleni;2017-2018

65
65
Issues, comments and suggestions
1.Measuring yields of control plots hasbeen a difficult process form the start. This season a
new approach was attempted where participants were to separate yields in their control
plots on a small section marked out to be an equivalent size to their trial plots. A lot of time
was spent helping participants mark out these sections, but very, very few participants
remembered to separate out these yields at the end of the season. It was then too late to
estimate these yields. A new process will need to be designed for next season
2.The maintenance quantities of lime of 1 t/ha were supplied for all trial participants. The field
team is aware that there are individual participants who require much larger quantities of
lime, but the programme is unable to assist in this regard due to budget and resource
constraints. Options for ordering bulk quantities of lime, which should be cheaper, will be
explored in the coming season as it is also very labour intensive to move around the
quantities of 50 kg bags of lime required.
3.This season trucks will be hired to deliver the trial inputs to farmers to reduce the need for
the MDF field team to make numerous return trips in their vehicles. A greater reliance will be
placed on the local facilitators to manage the distribution of these inputs to their learning
group members.
4.Working with infiltrometers, both the single and double ringversions,has proven to be
extremely frustrating. Infiltration rates in these high clay compacted soils is very slow and
the interns involved literally spent weeks and weeks waiting for water to infiltrate. This is in
addition to the difficulties of gettingthe rings into the soil and finding water to do these
measurements. A decision has been taken to remove this measurement,as the results
obtained are very inconclusive in terms of improved soil structure.
5.This season, due to the long periods between rainfall events and the sometimes very small
rainfall amounts of between 1-10mm, the rain gauges and run-off plots have not been well
tended by the participants involved. Readings have been very patchy and consequently the
results have been unusable in most cases. Going into the next season, interns will be given
the responsibility for collecting this data and ensuring in an ongoing way that participants
are up to date with their readings.
6.Consolidation of the 17 existing villages has been a good idea, as the team is at the limit of
their implementation capacity. This does mean that bringing new villages on board –of which
there are a number, will be a huge challenge going into the next season. Joint learning sessions
across 3-4 villages will need to be organised and in the older groups Local facilitators are to
do the planting demonstrations for the new participants.
7.The review of 4th and 5thyear participants’ farmer led experimentation has been very
successful and a similar process will be undertaken in the coming season.
8.With respect to the payment of subsidies for the trials, this year’spayment in some of the
groups has been very promising. We have however seen a bit of attrition in the older groups
as some participants have fallen away through not being able to pay for their trial inputs. This
is not a problem in and of itself, but it does mean that the poorer participants, or those less

66
66
organised are being excluded. Overall not enough is being recoupedfrom these subsidies to
cover the trial input costs for such a large group of participants. Further financial support for
this process will need to be found.
9.Monitoring has been streamlined in the present season, with different field team members
being responsible for certain aspects such as the visual soil assessments, the soil fertility
sampling and analysis, and the quantitative measurements. There has however been a bit of
a lack of communication between the team members and sonot all the data has been
coherently recorded. The issue was picked up mid-season and has been rectified, but some of
the early season data is now unavailable.
10.Not much progress is being made with the PES system development. It has however been
decided to work primarily from the 3 major CA principles instead of the more detailed
indicators that have been used previously.