
APPENDIX3: BERGVILLEANNUAL
PROGRESS REPORT
CA FarmerInnovation Programme for
smallholders in Bergville
Period: October 2016 - September2017
Farmer Centred Innovation in Conservation Agriculture
in upper catchment areas of the Drakensberg in the
Bergville region of KwaZulu-Natal
Compiled by:
Erna Kruger and Hendrik Smith
September 2017

2
Project implemented by:
Mahlathini Development Foundation
Promoting collaborative, pro-poor agricultural innovation.
Contact:Erna Kruger (Founder and Coordinator)
Address: 2 Forresters Lane, Pietermaritzburg, 3201, KZN
Email: erna@mahlathiniorganics.co.za, info@mahlathini.org
www.mahlathini.org
Cell: 0828732289
Time of operation: 2003-2016
Legal status: NPC
BEE status: 4. – Certificate available.
In collaboration with:
Funded by:

3
Contents
Contents.................................................................................................................................................3
Identification of the project..................................................................................................................5
Description and selection of study areas.........................................................................................5
Approach and Methodology.................................................................................................................5
Key activities: October 2016-August 2017..........................................................................................6
Progress.............................................................................................................................................7
Results achieved to date.....................................................................................................................11
CA practice ............................................................................................................................................14
Year 1(1st level) trial outlines ........................................................................................................14
Year 2 (2nd level) trial outlines .......................................................................................................14
Year 3-7 (3rd level) trial outlines ....................................................................................................15
Possible agrochemical spraying regime options ...............................................................................15
Rainfall Data ..........................................................................................................................................16
Soil fertility and soil health test results and analysis ...........................................................................18
Stulwane: Soil fertility status ............................................................................................................23
Mtholeni Dlamini (Stulwane) ........................................................................................................26
Phumelele Hlongwane ..................................................................................................................28
Eqeleni ...........................................................................................................................................36
Liming trials.......................................................................................................................................38
Yields for CA trial and control plots ......................................................................................................39
Bean production...................................................................................................................................42
Maize production ..................................................................................................................................45
Cover crops ...........................................................................................................................................46
Farmer Centres.....................................................................................................................................52
Ezibomvini Farmer Centre ................................................................................................................52
Mhlwazini Farmer Centre ................................................................................................................55
Socio-economic situation of participant smallholder farmers .............................................................55
Socio economic data.........................................................................................................................55
Learning and implementation of CA practices..................................................................................57
Learning workshops ..............................................................................................................................61
Implementation per area ......................................................................................................................61
Ezibomvini .........................................................................................................................................61

4
Emabunzini ........................................................................................................................................66
Ndunwana .........................................................................................................................................66
Stakeholder engagement ......................................................................................................................68
Building of Social platforms ..............................................................................................................70
General comments and suggestions on the experimentation .............................................................71
Attachment 1: Multi-stakeholder Forum; Mahlathini Development Foundation. ...............................74
Attachment 2: farmers’ day programme..............................................................................................75
Attachment 3: Social Compact Agreement. ..........................................................................................77

5
Identification of the project
Description and selection of study areas
Work in the Bergville (KwaZulu-Natal) site continued with the scaling out (horizontal expansion)
process that has been put in place, to include more villages around central nodes and more
farmers within each village. In this way villages included expanded from 11 to 17 and the
numbers of farmer participants in farmer level trials have increased from 163 in the 2014-2015
season to 263 this season. The overall area for trials has increased from 5,9ha to 13ha.
Approach and Methodology
The farmer centred innovation systems research process underpinning the programme, which is
based on working intensively with farmer learning groups and local facilitators in each of the villages,
has been continued and strengthened.
Within the learning groups farmer innovators volunteer to set up and manage farmer-managed
adaptive trials as the ‘learning venues’ for the whole learning group. Farmer Field School
methodologies are used within the group to focus the learning on the actual growth and
development of the crops throughout the season. New ideas are tested against the ‘normal’ practise
in the area as the controls. Farmers observe, analyse and assess what is happening in the trials and
discuss appropriate decisions and management practices. Small information provision and
discovery-learning (training) sessions are included in these workshops/ processes. These are based
also on the seasonality of the crop and the specific requests and questions from farmer learning
group participants.
Local facilitators are chosen from within and by members of the learning group to be a person who
has the required experience, knowledge and a willingness to support the other farmer innovators in
their implementation. Facilitators are only chosen and appointed where people with the appropriate
skill and personality exists. Local facilitators receive a stipend for a maximum of 10 working days per
month, for their support to the farmer innovators. They fill in detailed timesheets outlining their
activities against which they claim a monthly stipend.
Learning group members agree to a season long learning process and put forward the farmer
innovators to run the trials. Each prospective innovator is interviewed and visited and signs an
agreement with the Grain SA team regarding their contribution to the process. They undertake to
plant and manage the CA trials according to the processes and protocols introduced as well as a
control plot of the same size. For the latter, farmers provide their own inputs.
The adaptive trials are also used as a focus point for the broader community to engage through
local learning events and farmers’ days. Stakeholders and the broader economic, agricultural
and environmental communities are drawn into these processes and events. Through these
events, Innovation Platforms (IPs) are developed for cooperation, synergy between programmes
and development of appropriate and farmer-led processes for economic inclusion. These IPs
also provide a good opportunity to focus scientific and academic research on the ‘needs’ of the
process.

6
As learning groups mature they engage in a number of additional processes within the value
chain that build social capital and cohesion. VSLAs (Village savings and loan associations) are
set up to provide a mechanism for payment for inputs and for setting up bulk buying groups for
production inputs. Farmer centres are set up and managed locally (at village and nodal level) to
provide for local access to inputs through negotiated agreements with local suppliers and
agribusiness, management of shared tools and advice and mentoring in CA. Learning group
members also negotiate joint decisions around their crop production planning and marketing
and engage with stakeholders and support organisations. To support this process a social
compact agreement has been designed to outline roles and responsibilities of the various role
players in these forums.
In this season (2016-2017) we have continued to focus on the following elements of the model,
namely:
a) Support farmers who are in their 1st, 2nd , 3rd and 4th seasons,
b) Conscious inclusion of crop rotation to compare with inter cropping trials
c) Inclusion of summer cover crops in the crop rotation trials
d) Continuation with experimentation with winter cover crops, but planted in separate
plots rather than in-between maize
e) Planting of late season beans
f) More focussed introduction of lab-lab beans and
g) Initiation of nodes for farmer centres that can offer tools, input packs and advice.
Key activities: October 2016-August 2017
This report builds on, but does not repeat information presented in the 6monthly interim report in
February 2017.
For the 1st year of the 2ndphase of this CA Smallholder Farmer Innovation Programme (SFIP)
we have given attention to broadening the organisational scope and areas of operation of the
programme. A proposal was submitted to the LandCare programme of DARD in KZN and a
collaborative process was agreed to. Expansion into further villages in the Bergville areas was
initiated.
Researcher-managed trial plots were set up in Ezibomvini and Eqeleni to work on quantitative
benchmarking of some of the visual CA indicators being used in this process. This process is
designed to augment the new monitoring system being put in place.
The table below outlines the key activities and deliverables planned for the period. Expenditure has
been in line with the work plan. An initial over expenditure on inputs has been accommodated for in
the subsequent months. Partial recovery of over-expenditure on inputs (R98 196) was received from
smallholder participants paying input subsidies (R18 900). Subsequent savings were made in running
expenditures. Presently an amount of R83 475 remains for implementation in the last three months
of this project, which is sufficient for outstanding activities

7
TABLE1:KEY ACTIVITIES,OUTPUTS AND DELIVERABLEOCTOBER 2016-SEPTEMBER2017; PLANNED AND
ACTUAL.
Bergville, KZN Milestones: Farmer Centred Innovation in CA. October 2016- September
2017
Milestones/
Outputs
Key activities
OUTCOMES/
DELIVERABLES
Actual
expenditure
Aug 2017
Budgets
Capital Equipment
R10 410
R18 650
Farmer
experimentation
EC and SKZN
Documentation and
M&E
Meeting and monthly
reports
R89 786
R90 000
Experimentation
List of participants,
interviews and
contracts, awareness
and training
R 404 454
R 481 400
Innovation Platforms
Stakeholder meetings,
platform building and
events
R16 926
R15 000
Budget expenditure end June 2017
R 521 576
R605 050
Remainder
R83 475
Sub - TOTAL: Oct2016-Sept2017
R 605 050
Finances from your side Hendrik
Progress
This year has seen a great upsurge in new participants and the project expanded into 6 new
villages. The project is now operational across 17 villages in the Bergville area, with a total of 263
learning groupparticipants and 212farmer based trials.The map below shows the spread and
distribution of the villages involved.

8
A further map indicates the spread of villages in the Central Bergville region indicated above. This
gives some indication of the three clusters or nodes of villages that are presently involved; 5
villages around Ezibomvini (Stulwane, Magangangozi, Thunzini, Eqeleni and Vimbukhalo), 2
villages around Ndunwana(Thamela and Mhlwazini) and one village close to Ngoba
(Emabunzini). These three nodes are being explored for the farmer centres.

9
The basic experimental design was followedfor all 1st year participants and most of the 2nd year
participants as well. Variations have included crop rotation instead of intercropping, summer and
winter cover crop mixes, planting of lab-lab beans and late season planting of beans.
The table below outlines activities related to objectives and key indicators for the period of
October 2016 -September 2017.
TABLE 2:SUMMARY OFPROGRESS (OCTOBER2016–SEPTEBMER 2017)RELATEDTO OBJECTIVES
AND KEY ACTIVITIES
Objectives
Key activities
Summary of progress
% completion and
comment
1. Document
lessons
learned
Documentation for
learning and
awareness raising
- Finalisation of CA manual
(Eng and Zulu)
- Soil health symposium–
presentation and
participation (Nov 2016)
- Finalised PID report and
progress reports for CA
SFIP- on MDF website
- Sharing of information
through innovation
platforms processes;-
Participation in Ezibomvini
and Mhlwazinifarmers’ days
- Stakeholder engagements
with DRDLR, DARD,
Okahlamba LM, NGOs
- Articles and promotional
material
- 100 copies of E and Z
manuals printed. A further
print run expected. (50%
complete)
- 100 copies of group and
individual savings books
printed and in use. A further
print run of 300 copies done
in January 2017 (100%
complete)
-Innovation platforms
(100% completion) -
ongoing
- Grain SA DVD promotional
DVD produced and viewed
at farmers days (100%
completion)
Final report
- 6 monthly interim reports
and final progress report
- Interim report finalised.
Final report at finalised
(100% completion)
2. Increase
the
sustainability
and efficiency
of CA systems
1st level
experimentation:
farmers se their own
practice as a control –
size 400m² ha exp,
400m² control,
Control.9 villages, 45
farmers
- 9 villages, 115 farmers
- 100%. Basic CA design-
intercropping with maize
beans and cowpeas on a
100m2- 400m2 plot, with a
control plot managed
entirely by the participant.
Adaptation trials included
late season planting of
beans with a mixture of
winter and summer cover
crops.
2nd level
experimentation: 24
- 10 villages, 55 farmers
- 100%. Adaptation trials
included late season
10
existing farmers use
their own practice as a
control – size: size
400m² ha exp, 400m²
8 villages, 59 farmers
planting of beans with a
mixture of winter and
summer cover crops. Most
participants opted to
continue with intercropping
practice from their 1st year.
3rd level and 4th level
experimentation; own
contribution, larger
plots, own ideas (2
villages, 7 farmers in
total)
- 6 villages, 27 farmers
- 100%. Larger level
plantings using oxen drawn
planters and including
cover crops. Intercropping
still practised. Awa crop
rotation and summer and
winter cover crops.
Develop and manage
PM&E framework; –
weekly and monthly
M&E visits
-M&E forms redesigned and
used
- Digital monitoring system
piloted
-100%. Monitoring
completed for 138
participants across all 17
villages, including yield
measurements for maize,
beans and cc’s
Facilitation of
innovation platforms
-Co- facilitation of
information sharing and
action planning with
stakeholders and role
players
- 100%. Farmers days
CA working group,
and reference group
- Attended and presented in
Feb and Sept 2017
- 100%
Sharing of information
using a range of
innovation platforms
- Presentation at LandCare
conference end 2016
- 100% -Stakeholder
interaction- DRDLR, DARD,
Okahlamba LM, NGOs
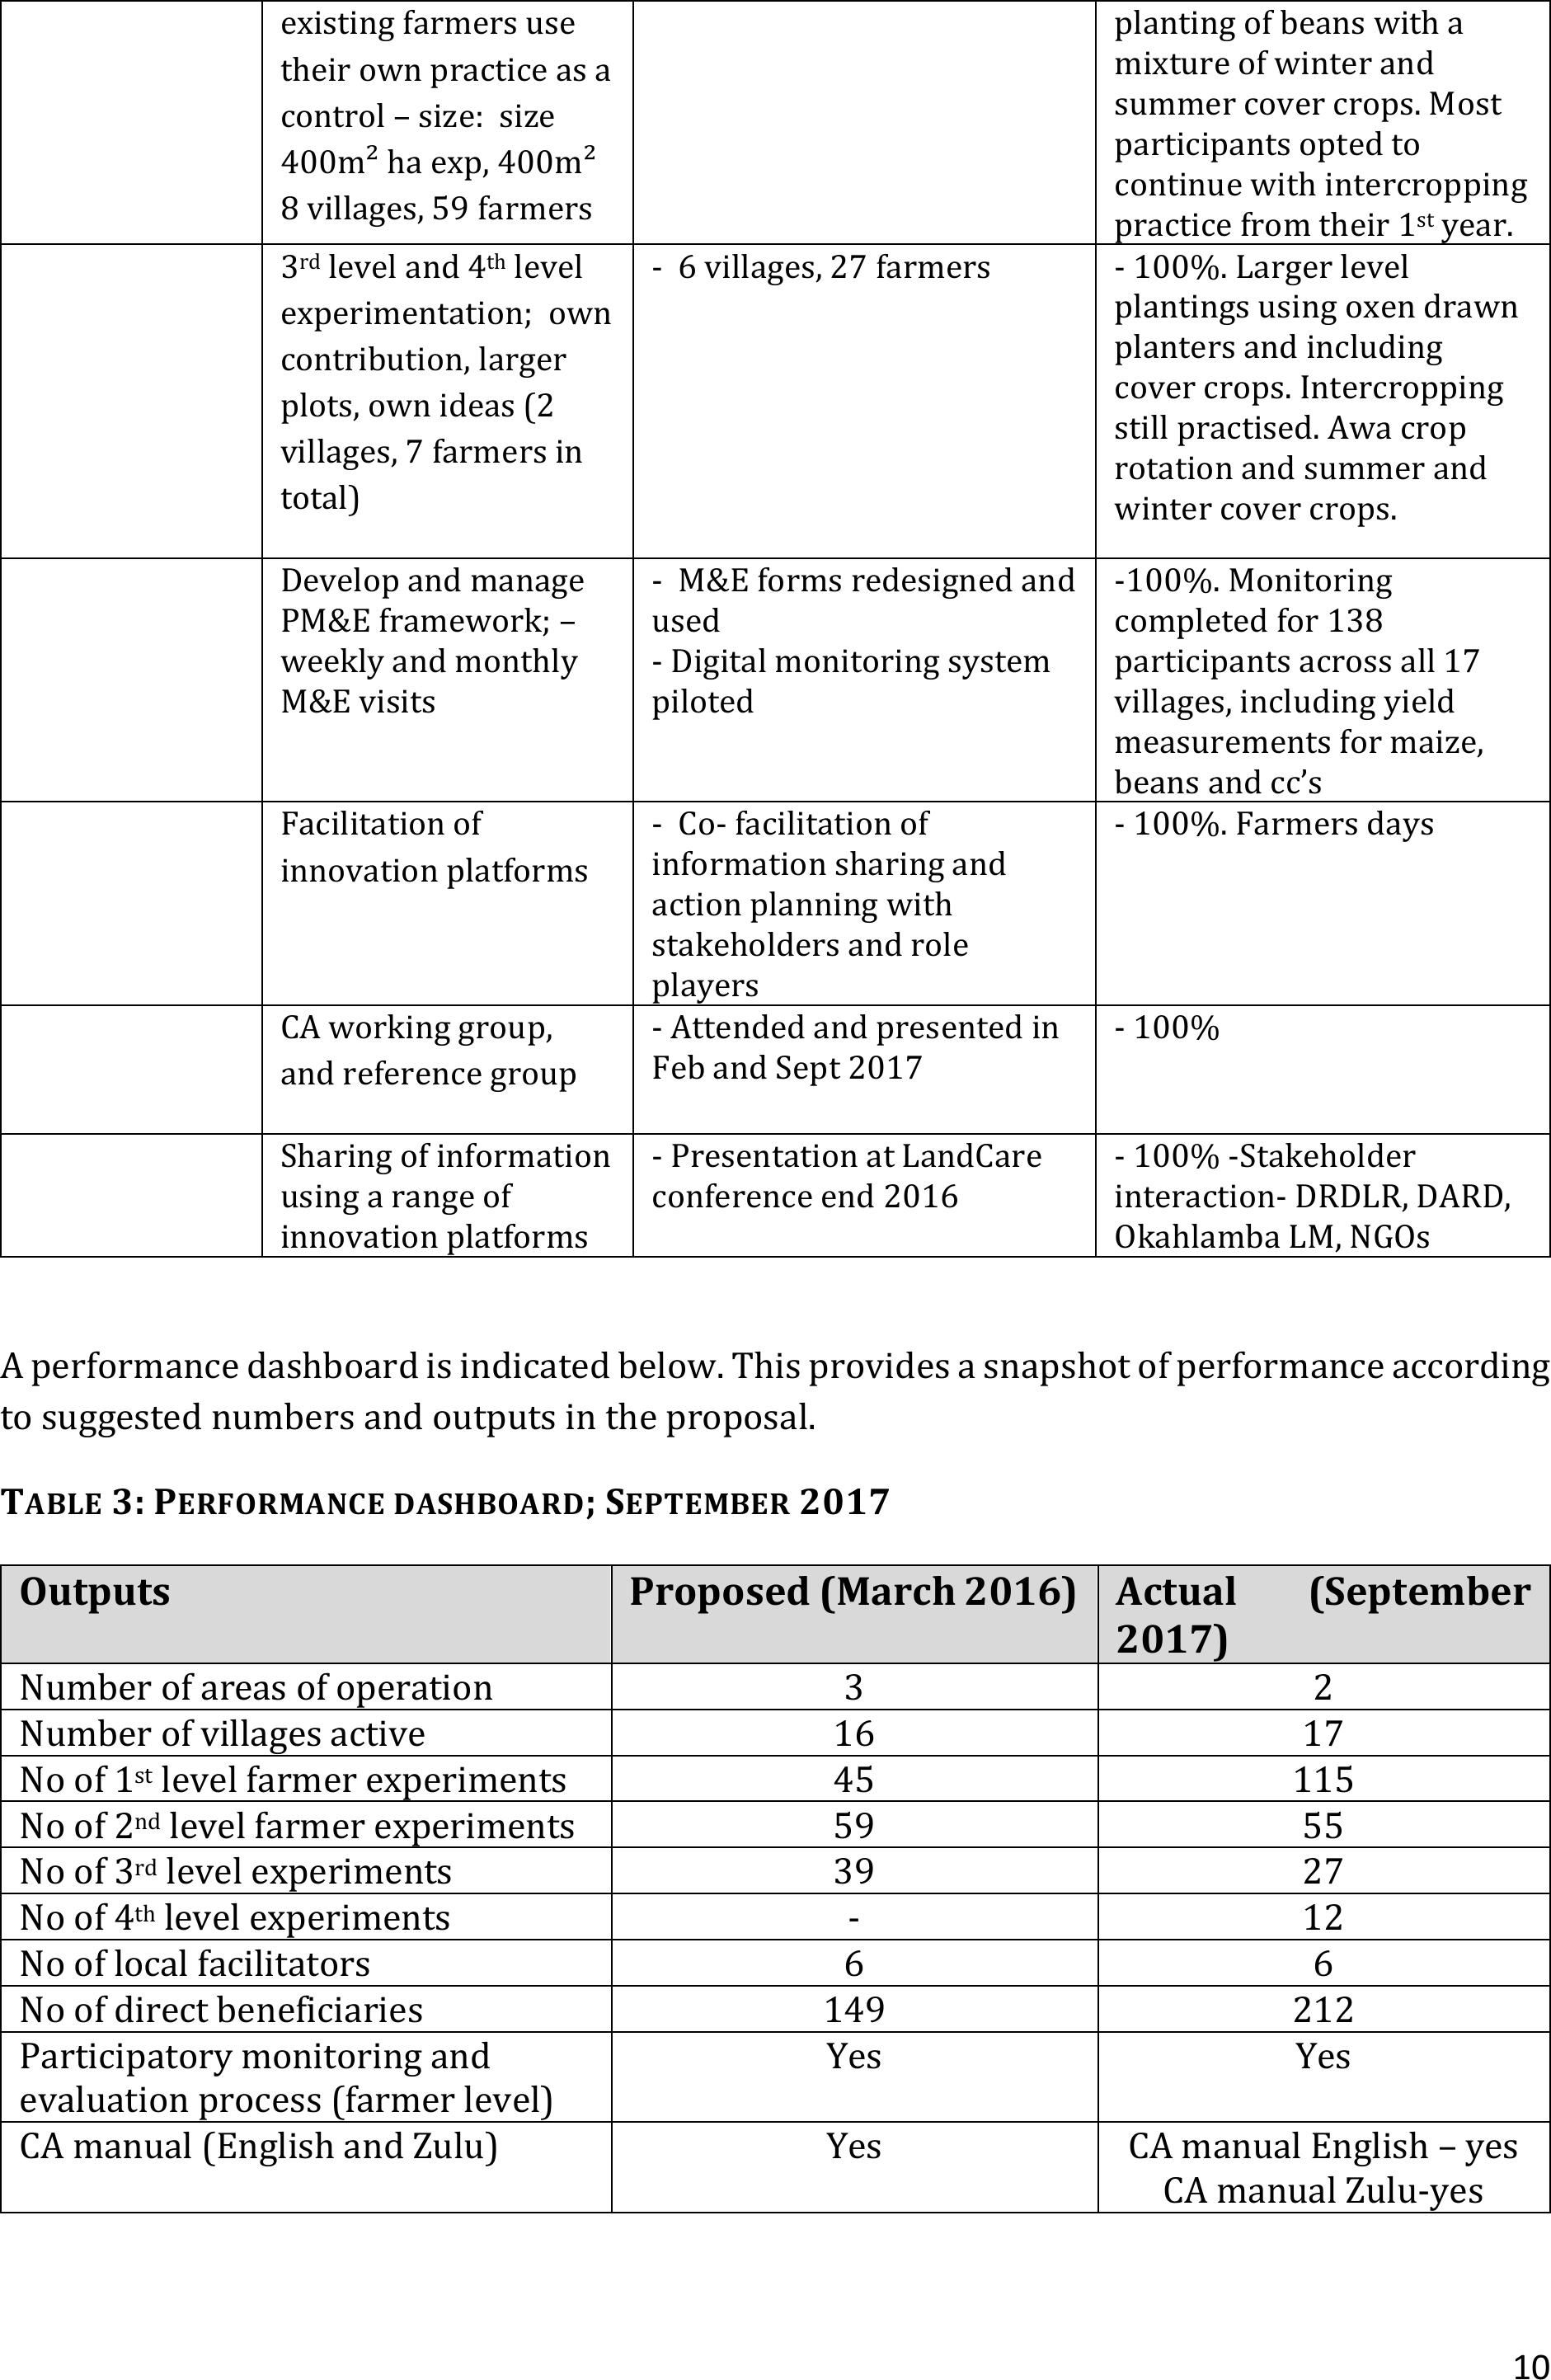
A performance dashboard is indicated below. This provides a snapshot of performance according
to suggested numbers and outputs in the proposal.
TABLE3:PERFORMANCE DASHBOARD;SEPTEMBER2017
Outputs
Proposed (March 2016)
Actual (September
2017)
Number of areas of operation
3
2
Number of villages active
16
17
No of 1st level farmer experiments
45
115
No of 2nd level farmer experiments
59
55
No of 3rd level experiments
39
27
No of 4th level experiments
-
12
No of local facilitators
6
6
No of direct beneficiaries
149
212
Participatory monitoring and
evaluation process (farmer level)
Yes
Yes
CA manual (English and Zulu)
Yes
CA manual English – yes
CA manual Zulu-yes

11
Results achieved to date
The framework for scaling out implementation included: Continuation with existing farmer
experimentation options for 1st, 2nd and 3rd level participants. This includes intercropping, crop
rotation, late season planting of beans and combinations of summer and winter cover crop
mixes. 4th Year participants design their own implementation processes and provide a
mentoring role for newer entrants into the CA process
Cover crops, both a mix of SCC’s (sunflower, millet and sun hemp) as well as a late season relay
cropping of a mix of SCC and WCC (saia oats, fodder peas and fodder radish) were planted by 38
and 55 participants respectively across 5 villages. For the SCC’s a number of participants have
managed to collect some seed, mostly for the sunflowers that participants want to use as
poultry feed.
Six (6) new villages were included, based on their interest in CA. Thus around 212 farmer
experiments were set up across 17 villages around Bergville. 2 Farmer centres were initiated in
Ezibmovini and Ndunwane respectively. The farmer centre in Ezibomvini is functioning very
well and will continue. The centre in Ndunwane did not do very well.
A total of 8 VSLAs have been initiated and supported specifically for the purposes of saving for
inputs for field crop production (Ezibomvini, Eqeleni, Nudnwane and Emabunzini). See the table
below. An improved record keeping process has been designed and record keepers in each of
the VSLAs have received training and mentoring. This has allowed for accurate recording of
group savings and loans and an indication of use of these funds by the individuals in the groups
TABLE4:SCGS OPERATIONAL IN THEBERGVILLE AREAS,WITH NUMBER OF PARTICIPANTS AND
YEARS OF OPERATION
SCG NAME
NUMBER
AREA
VILAGE
YEAR
Masithuthuke
25
Bergville
Qeleni
4th year
Masibambane
25
Bergville
Qeleni
4th year
Mtwana
26
Bergville
Stulwane
3rd year
Ezibomvini
23
Bergville
Ezibomvini
2nd year
Ukuzama
17
Bergville
Ezibomvini
2nd year
Mphelandaba
19
Bergville
Ndunwane
1ST year
Sceluthando
17
Bergville
Mhlathuza
1st year
Siyaphambili
20
Bergville
Ndunwane
1st year
Sakhokuhle
23
Bergville
Emabunzini
1st year
Two very successful farmers days were held in Ezibomvini and Mhlwazini respectively. Interest
in this process is growing and many external role-players and stakeholders participated actively
in these processes. Further involvement with stakeholders has been pursued with the DRDLR
DARD, the Okahlamba LM – LED section and LandCare to ensure coherence and work on
collaborative implementation processes. Discussions with DEA are in progress around a
payment for ecosystem services model appropriate for smallholders.

12
TABLE5:ACTIVITIES ANDNUMBERS OF FARMERS INVOLVED, PER VILLAGE FOROCTOBER2016-
SEPTEMBER2017.
BERGVILLE
Year started with CA
COMMENTS
Villages
2013
2014
2015
2016
Total
Emabunzini
10 (8)
10 (8)
Intercropping with
hand hoes and MBLI
planters; Maize,
beans, cowpeas
Emangweni-
Engodini
12 (14)
7(2)
19 (16)
1st and 2nd level
experimentation;
intercropping
Emangweni-
Emaqeleni
(5)
(5)
1st level
experimentation;
intercropping
Eqeleni
9 (5)
13(3)
7(4)
(1)
29 (13)
1st, 2nd and 3rd level
experimentation;
MBLI’s hand hoes
and animal drawn
planters;
intercropping crop
rotation summer and
winter cover crops,
late season beans
Ezimbovini
1 (6)
8 (4)
(10)
19 (20)
1st, 2nd and 3rd level
experimentation;
MBLI’s hand hoes
and animal drawn
planters;
intercropping crop
rotation summer and
winter cover crops,
late season beans
Magangangozi
10(7)
1
11(7)
1st and 2nd level
experimentation;
intercropping
Mhlwazini
17(5)
12(13)
29(18)
1st, 2nd and 3rd level
experimentation;
MBLI’s hand hoes,
intercropping crop
rotation summer and
winter cover crops,
late season beans
Ngoba
6(6)
4(5)
10(11)
1st, 2nd and 3rd level
experimentation;
MBLI’s hand hoes
and animal drawn
planters;
intercropping crop
rotation summer and
winter cover crops,
late season beans
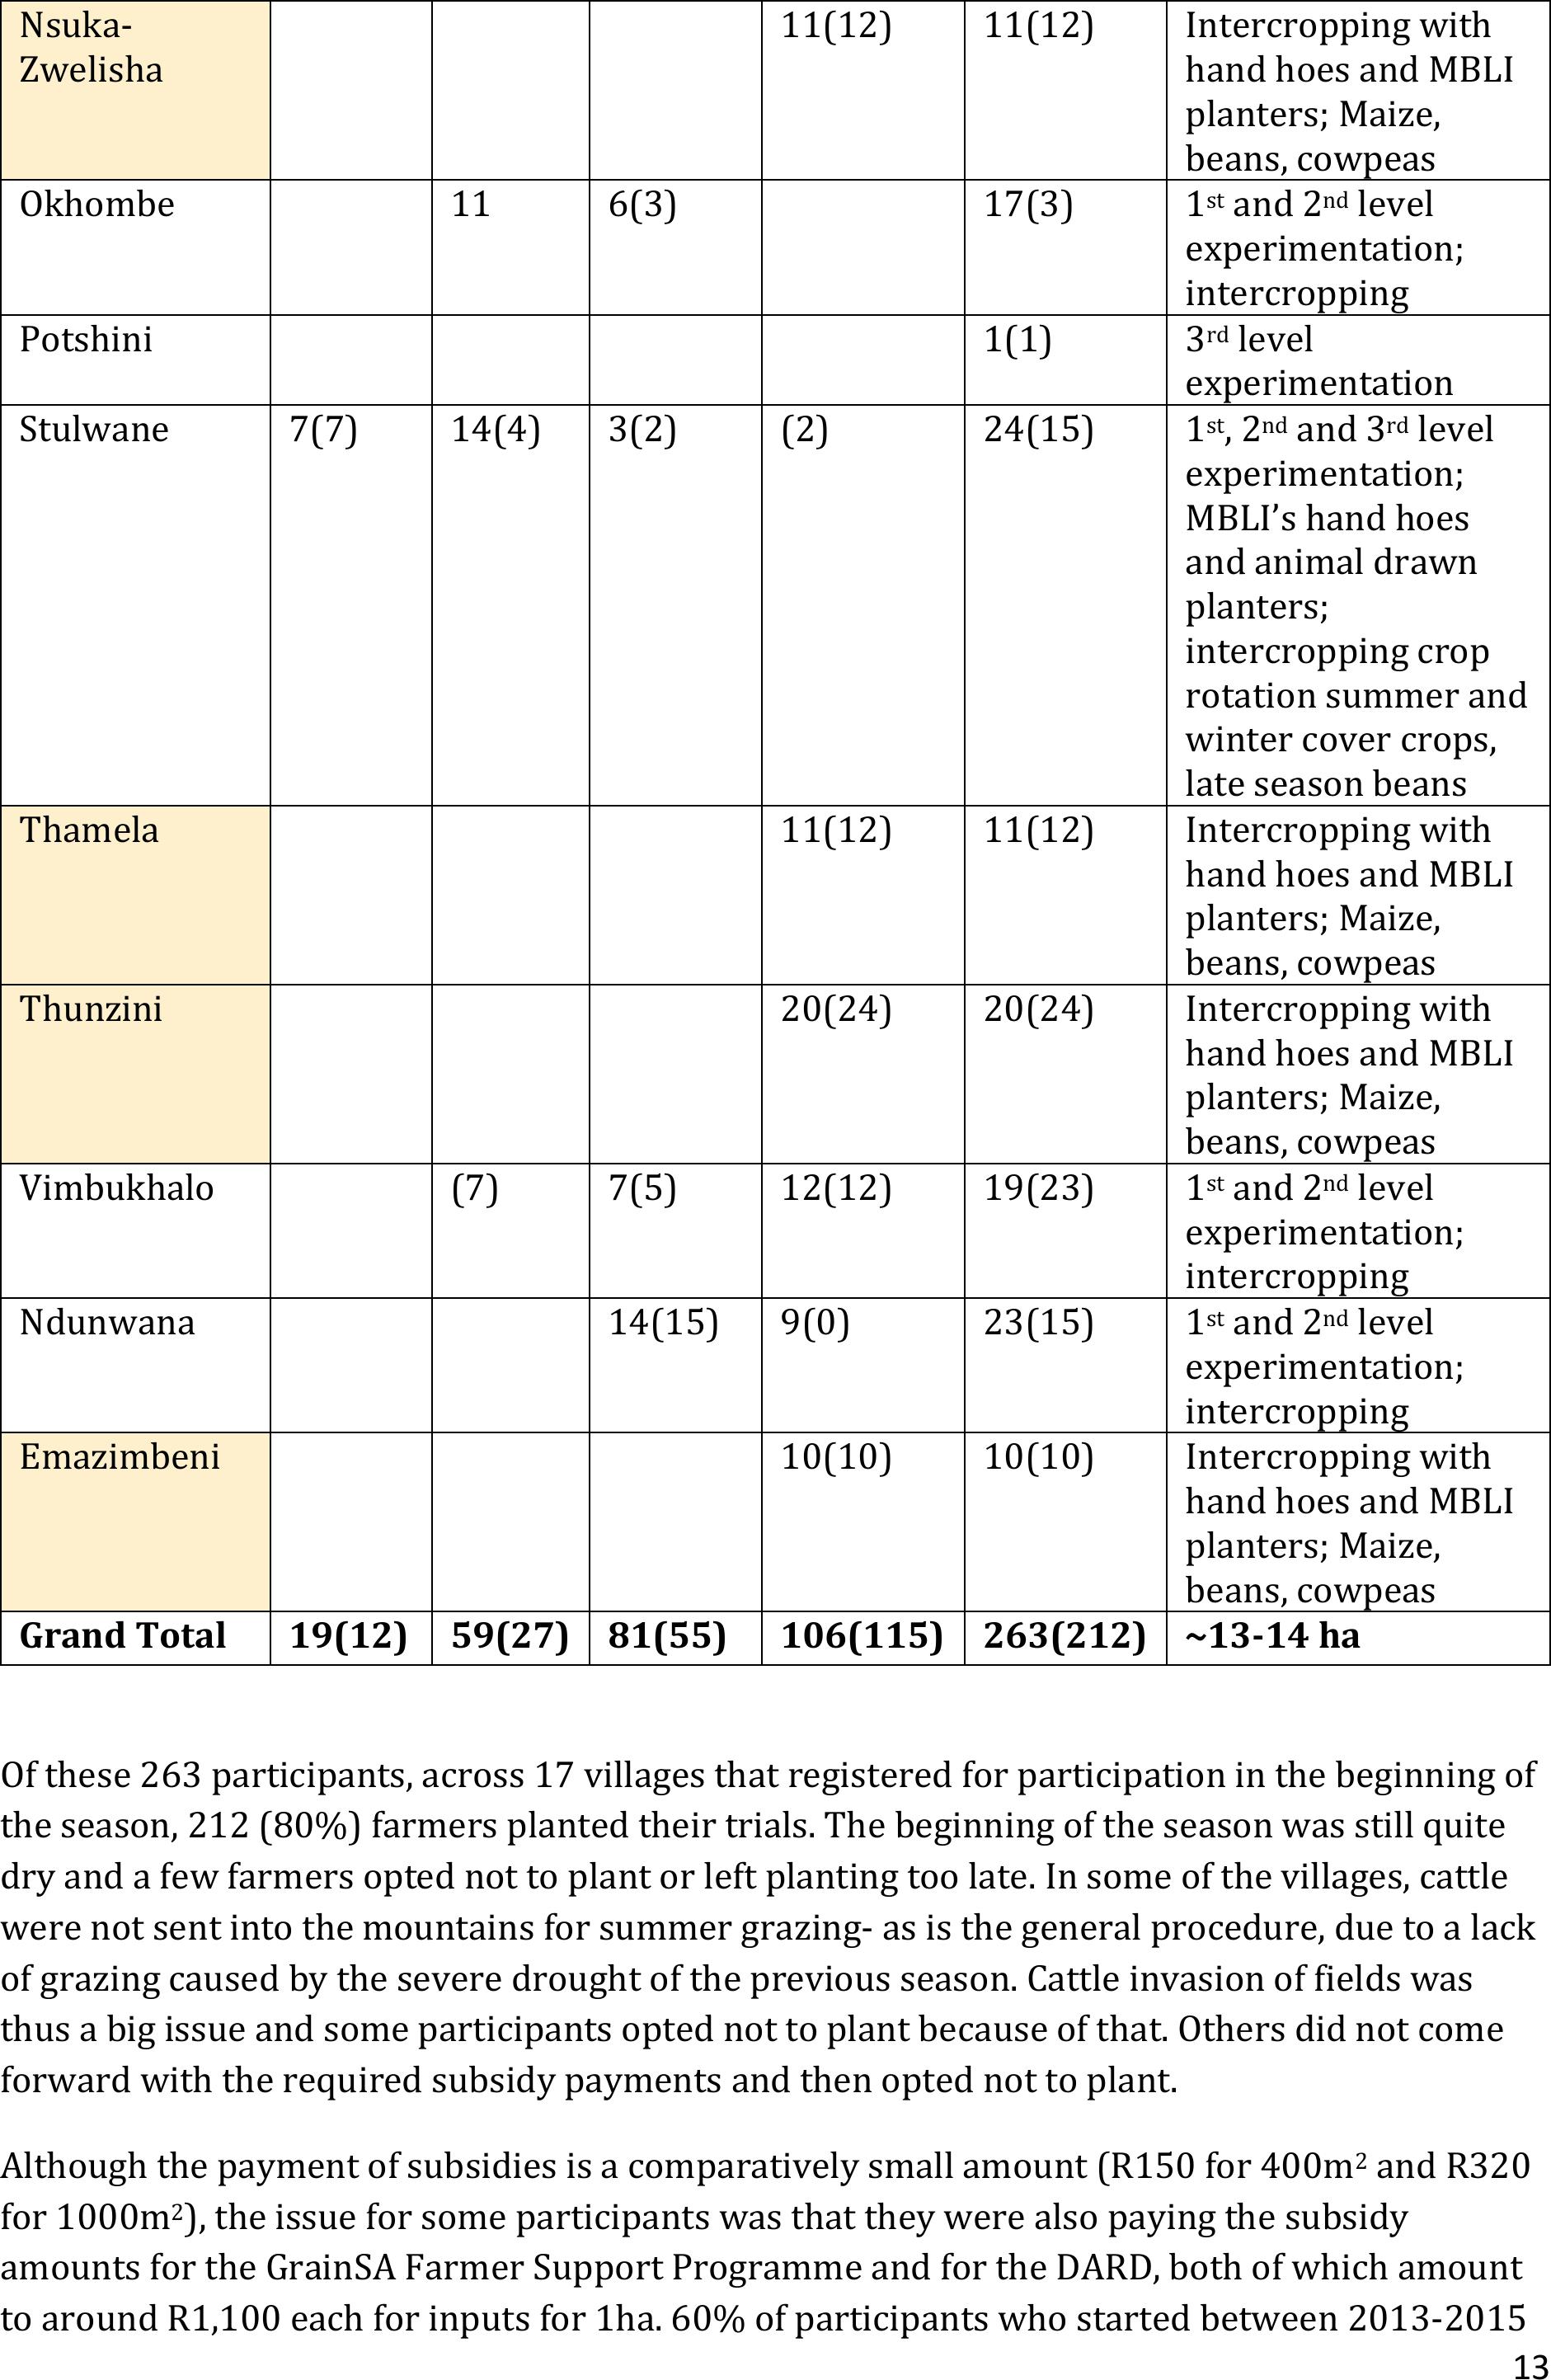
13
Nsuka-
Zwelisha
11(12)
11(12)
Intercropping with
hand hoes and MBLI
planters; Maize,
beans, cowpeas
Okhombe
11
6(3)
17(3)
1st and 2nd level
experimentation;
intercropping
Potshini
1(1)
3rd level
experimentation
Stulwane
7(7)
14(4)
3(2)
(2)
24(15)
1st, 2nd and 3rd level
experimentation;
MBLI’s hand hoes
and animal drawn
planters;
intercropping crop
rotation summer and
winter cover crops,
late season beans
Thamela
11(12)
11(12)
Intercropping with
hand hoes and MBLI
planters; Maize,
beans, cowpeas
Thunzini
20(24)
20(24)
Intercropping with
hand hoes and MBLI
planters; Maize,
beans, cowpeas
Vimbukhalo
(7)
7(5)
12(12)
19(23)
1st and 2nd level
experimentation;
intercropping
Ndunwana
14(15)
9(0)
23(15)
1st and 2nd level
experimentation;
intercropping
Emazimbeni
10(10)
10(10)
Intercropping with
hand hoes and MBLI
planters; Maize,
beans, cowpeas
Grand Total
19(12)
59(27)
81(55)
106(115)
263(212)
~13-14 ha
Of these 263 participants, across 17 villages that registered for participation in the beginning of
the season, 212 (80%) farmers planted their trials. The beginning of the season was still quite
dry and a few farmers opted not to plant or left planting too late. In some of the villages, cattle
were not sent into the mountains for summer grazing- as is the general procedure, due to a lack
of grazing caused by the severe drought of the previous season. Cattle invasion of fields was
thus a big issue and some participants opted not to plant because of that. Others did not come
forward with the required subsidy payments and then opted not to plant.
Although the payment of subsidies is a comparatively small amount (R150 for 400m2 and R320
for 1000m2), the issue for some participants was that they were also paying the subsidy
amounts for the GrainSA Farmer Support Programme and for the DARD, both of which amount
to around R1,100 each for inputs for 1ha. 60% of participants who started between 2013-2015

14
have continued with the CA experimentation process. The arrangement is that the 1st season
participants, those from 2016 on this list, do not pay the subsidy.
The two GrainSA programmes and the DARD are in communication with each other to ensure as
much coherence as possible across programmes. CA is being introduced in all three processes to
a greater or lesser extent. Participants are encouraged to participate across these programmes
to be able to glean the benefit from them. The GrainSA SFIP focusses on learning and
experimentation with different aspects of CA within the maize value chain while the GrainSA
FSP and DARD focus on commercialisation options. Some support for inputs is provided in all
three processes.
VSLAs (Village saving and loans associations) are being promoted to enable cash flow and
affordability of inputs. These are present in 9 of the 17 participant villages, with 3 new villages
having been brought on board in this past year.
CA practice
Going into the 4th year, the farmer experimentation protocols for each level of farmer
participants has been more clearly defined, given that those farmers with more experience can
now incorporate some of their own learnings and preferences in the trials, but the 1st level trial
participants still need to get used to the overall CA planting process and thus the close spacing
intercropping trial plots are ‘prescribed’ for them.
The protocols are outlined below:
Year 1(1st level) trial outlines
Experimental design is pre-defined by the research team (based on previous implementation in
the area in an action research process with smallholders). It includes a number of different
aspects:
-Intercropping of maize, beans and cowpeas
-Introduction of OPV and hybrid varieties for comparison (1 variety of maize and beans
respectively)
-Close spacing (based on Argentinean model)
-Mixture of basin and row planting models
-Use of no till planters (hand held and animal drawn)
-Use of micro-dosing of fertilizers based on a generic recommendation from local soil
samples
-Herbicides sprayed before and/or at planting
-Decis Forte used at planting and top dressing stage for cutworm and stalk borer
-Planting of cover crops; winter mix in Autumn
-Experimental design includes 2 treatments; planter type (2) and intercrop (2)
-
Year 2 (2nd level) trial outlines
Based on evaluation of experiment progress for year 1, this includes the addition of options that
farmers choose from. Farmers also take on spraying and plot layout themselves:

15
-A number of different OPV and hybrid varieties for maize
-A number of different options for legumes (including summer cover crops)
-Planting method of choice
-Comparison of single crop and inter cropping planting methods
-Use of specific soil sample results for fertilizer recommendations
-Early planting and Own choices.
Year 3-7 (3rd level) trial outlines
Based on evaluation of the experimentation process to date this protocol includes issues of cost
benefit analysis, bulk buying for input supply, joint actions around storage, processing and
marketing. Farmers design their experiments for themselves to include some of the following
potential focus areas:
-Early planting; with options to deal with more weeds and increased stalk borer
pressure.
-Herbicide mix to be used pre and at planting (Round up, Dual Gold ,Gramoxone)
-A pest control programme to include dealing with CMR beetles
-Intercropping vs crop rotation options
-Spacing in single block plantings
-Use of composted manure for mulching and soil improvement in combination with
fertilizer, or singly.
-Soil sample results and specific fertilizer recommendations
-Planting of dolichos and other climbing beans
-Summer and winter cover crops; crop mixes, planting dates, management systems,
planting methods (furrows vs scatter)
-Seed varieties; conscious decisions around OPVs, hybrids and GM seeds
-Cost benefit analysis of chosen options and
-Farmer level monitoring of trials for selected individuals.
Possible agrochemical spraying regime options
1 Round-up 2 weeks before planting- if there has been some rain. Dual Gold at planting (just
after with Decis Forte/Kemprin)
2. Gramoxone at planting (just before or after planting) with or without Dual Gold and Decis
Forte/Kemprin–Inactivated on contact with soil. Dual Gold does not work on dry soil (Followed
by heavy rain)
From the outcomes of 2014-2105 season it has been decided to revert back to the use of a pre-
emergence herbicide as many participants had trouble with nut-grass and couch grass. The
spraying of Gramaxone at planting did not provide the same level of weed control as Roundup,
but has still been included as an option given the dry conditions and the limited efficacy of
Roundup and Dual Gold under these circumstances.

16
Rainfall Data
Rainfall data this year was collected by community based volunteers from 5 different villages. In
previous years we have relied on data from nearby weather stations, but this season we wanted
to engage the farmers more directly in this process and also see whether there are large
differences in rainfall between the villages as the farmers have always suggested.
TABLE5:SUMMARIES OF RAINFALL DATA COLLECTED BYFARMER PARTICIPANTS IN DIFFERENT
VILLAGES AROUNDBERGVILLE.
Ezibomvini
Eqeleni
Ndunwana
Okhombe
Emangweni
Average
Cumulative
rainfall (mm)
562.5
301.4
429.3
814
32.7
526,8
Mean (mm) per
rainfall event
2.29
1.40
2.71
3.43
1.17
Max (mm) per
rainfall event
60
36
50
49
20.1
Note:The data from the Emangweni participant is unreliable, given too few readings taken by her and was
not included in the averages provided
In general, the average annual rainfall for the Drakensberg region ranges between 750mm-
1350mm. The actual amount of rainfall has not been seen to vary over time that much (besides a
potential 20year periodicity), even for long term studies over 50years, but the monthly
variability has been increasing reasonably dramatically
1
The rainfall data collected by farmer participants reflect the difference in rainfall in the
Drakensberg region- mostly related to altitude, with those villages at a higher altitude closer to
the mountains receiving more rain. The differences in the above table between the mean
precipitation per rainfall event and the maximum also points strongly towards this kind of
variability, with Okhombe being the highest altitude village in this series and Eqeleni being the
lowest. It also points towards the high variability of rainfall between villages which participants
experience. Eqeleni and Ezibomvini for example are neighbouring villages and should receive
comparable amounts of rainfall.
From the participants’ recordings, it can be seen that this year also was a below average rainfall
year.
1
Nel, W. 2009 Rainfall trends in the KwaZulu-Natal Drakensberg region of South Africa during the
twentieth century. INTERNATIONAL JOURNAL OF CLIMATOLOGY Int. J. Climatol. 29: 1634–1641 (2009)
Published online 12 December 2008 in Wiley InterScience (www.interscience.wiley.com) DOI:
10.1002/joc.1814

17
This graphs below are based on information from Ezibomvini. The first graph depicts daily
rainfall and gives an indication of the rainfall distribution throughout the season. Together with
the monthly averages in the second graph, this gives a clear indication of how rainfall spread
across the season.
It can be seen that the season started quite late with very little rain before November. It then
continued to rain reasonably regularly right through until the end of February and then rain
stopped abruptly in the middle of March for about 3 weeks. The upshot of this trend is that the
beginning of the season was very dry which affected germination of crops. The usual ‘dry spell’
between January and February did not materialise, which led to a substantial reduction in beans
yields and the abrupt nature of the end of season rainfall led to difficulty in the cover crops’
growth – It also meant that cattle were allowed back into the villages two weeks earlier than
normal due to lack of grazing in the mountains.
Figure 2: Monthly rainfall as recorded by farmer participants in Ezibomvini
0
20
40
60
80
100
120
140
Rainfall (mm)
Time (months)
MonthlyRainfall in Ezibomvini 2016-2017
Monthly Rainfall
-10
0
10
20
30
40
50
60
70
Precipitation (mm)
Time (days)
Rainfall distribution in Ezibomvini 2016-2017
Rainfall
2 per. Mov. Avg. (Rainfall)
Figure 1: Rainfall data recorded by farmer participants in Ezibomvini

18
Soil fertility and soil health test results and analysis
Soil samples were taken for a number of new participants to continue building on the information in the database. This information is important,
both to ensure an appropriate sol fertility amendment recommendation for the trials (both generic and specific for individualsupon request) and
also to be able to compare over time whether and how the soil fertility changes for the CA trials.
Repeat soil samples were taken for 16 participants across Eqeleni, Ezibomvini and Stulwane who have been active in CA trials for 3 years (see
Figure 3 below). These were analysed at Cedara for the normal soil fertility parameters. Percentage organic carbon and nitrogen are determined by
Cedara using Mid infrared spectroscopy and are recorded as percentages. Generally the percentage change organic carbon and nitrogen in the soil
followed the same trend for each of the participants, although the values varies. For example, if the trial showed a positive trend in organic carbon,
so did the control.
S
Hlatsh
wayo
(T )
S
Dlami
ni (T )
K
Hlong
wane
(T )
T
Zikode
(T )
S
Zikode
( T )
Ntomb
akhe
Zikode
(T )
Ntomb
i
Zikode
(T )
Tholw
ephi
Mabas
o (T )
Noma
vila
Ndaba
(T )
M
Nkabi
nde (
C )
P
Hlong
wane (
C )
H
Ndaba
( C )
D
Hlong
wane
(T )
N
Hlong
wane(
T )
M
Dladla
(T )
P
Stheb
e (T )
% Change in organic C-45 60 57,1429 5050 -31,25 -42,857-18,182-18,18240 -10 42,3077-31,81811,42868,69565-24,138
%Change in Organic N-68,966 -500-6,25-15 -63,636 -55-35-4053,8462-82,353-3,8462-31,5790-11,765-60,87
-100
-80
-60
-40
-20
0
20
40
60
80
Perecntage change
Percentage change in soil organic carbon and nitrogen content for trial
plots between 2014-2016; Eqeleni, Ezibomvini and Stulwane
Figure 3: Percentage change in some of the soil fertility parameters, over time, for a selection of participants; 2014-2016

19
Comments:
-The average percentage organic carbon available in soils for these 16 participants increased from 1,93%to 2% over the three year period.
There is no difference in the increase in percentage organic carbon for the trial and control plots.
-Nitrogen availability, similarly has been the same for both control and trial plots at an average percentage of 0,13% – 130kg/ha. The average
percentage N decreased from 0,19% to 0,13% over the three year period.
-Average percentage increase in percentage organic carbon for the trial plots has been 6,3% over the three year period. This is an average
increase of around 6,3 tons/ha of carbon (assuming a bulk density of around 1g/cm3 for the samples)
-The average percentage increase over the same period for control plots has been 9,4%.
-Overall, on average, therefor the organic carbon accumulation for the CA plots has been lower than that of the control plots.
-But for 56% of these participants the organic carbon has increased- and this at an average of 34,6% or 34,6 tons/ha. For 7 of these
participants (thus 78%) the organic carbon on their trial plots has increased more than that of their control plots.
-Thus, in summary, the practice of CA is increasing the percentage organic carbon in the participants’ soils. It is possible that participants
provide more nitrogen in their CA plots, as topdressing is not a common practice in the control plots (even in those control plots where some
of the CA principles are being incorporated). This could lead to a difference in the C:N ratios in the CA and control plots, And could lead to
greater rates of processing of the organic carbon in CA plots, with bacterial activity stimulated through the presence of more N. This
supposition is given some weight by looking at soil health test results, where the C:N ratios are generally higher for the CA plots.
-An aspect that has been noted is that control plots for participants are adapted to more closely resemble the CA plots given that they have
noticed increases in growth and yield in the CA plots. This makes comparisons of control and CA plots a rather tricky process. It means that
data then needs to be compared over time within the same system.
-In addition, in the smallholder system of grazing of residues by cattle, no dramatic increases in soil carbon can be expected.
As for most the analyses related to smallholder farmers the variability in results due to differences in farmer practices and also weather related
variability in dryland conditions, provides for highly variable results that can be quite confusing. It can therefore be considered a positive step that
the CA system, on average, provides for an increase in organic carbon in the soil and also that this increase is at a rate of around 34tons/ha over
three years.
The small decrease in percentage nitrogen available can be interpreted in a number ways. One aspect of this process can be that the Nitrogen applied
and available in the system is being more fully utilized for plant growth – or it can point towards the increased volatilization of nitrogen in the drier
and hotter conditions that have prevailed in the last three years.
20
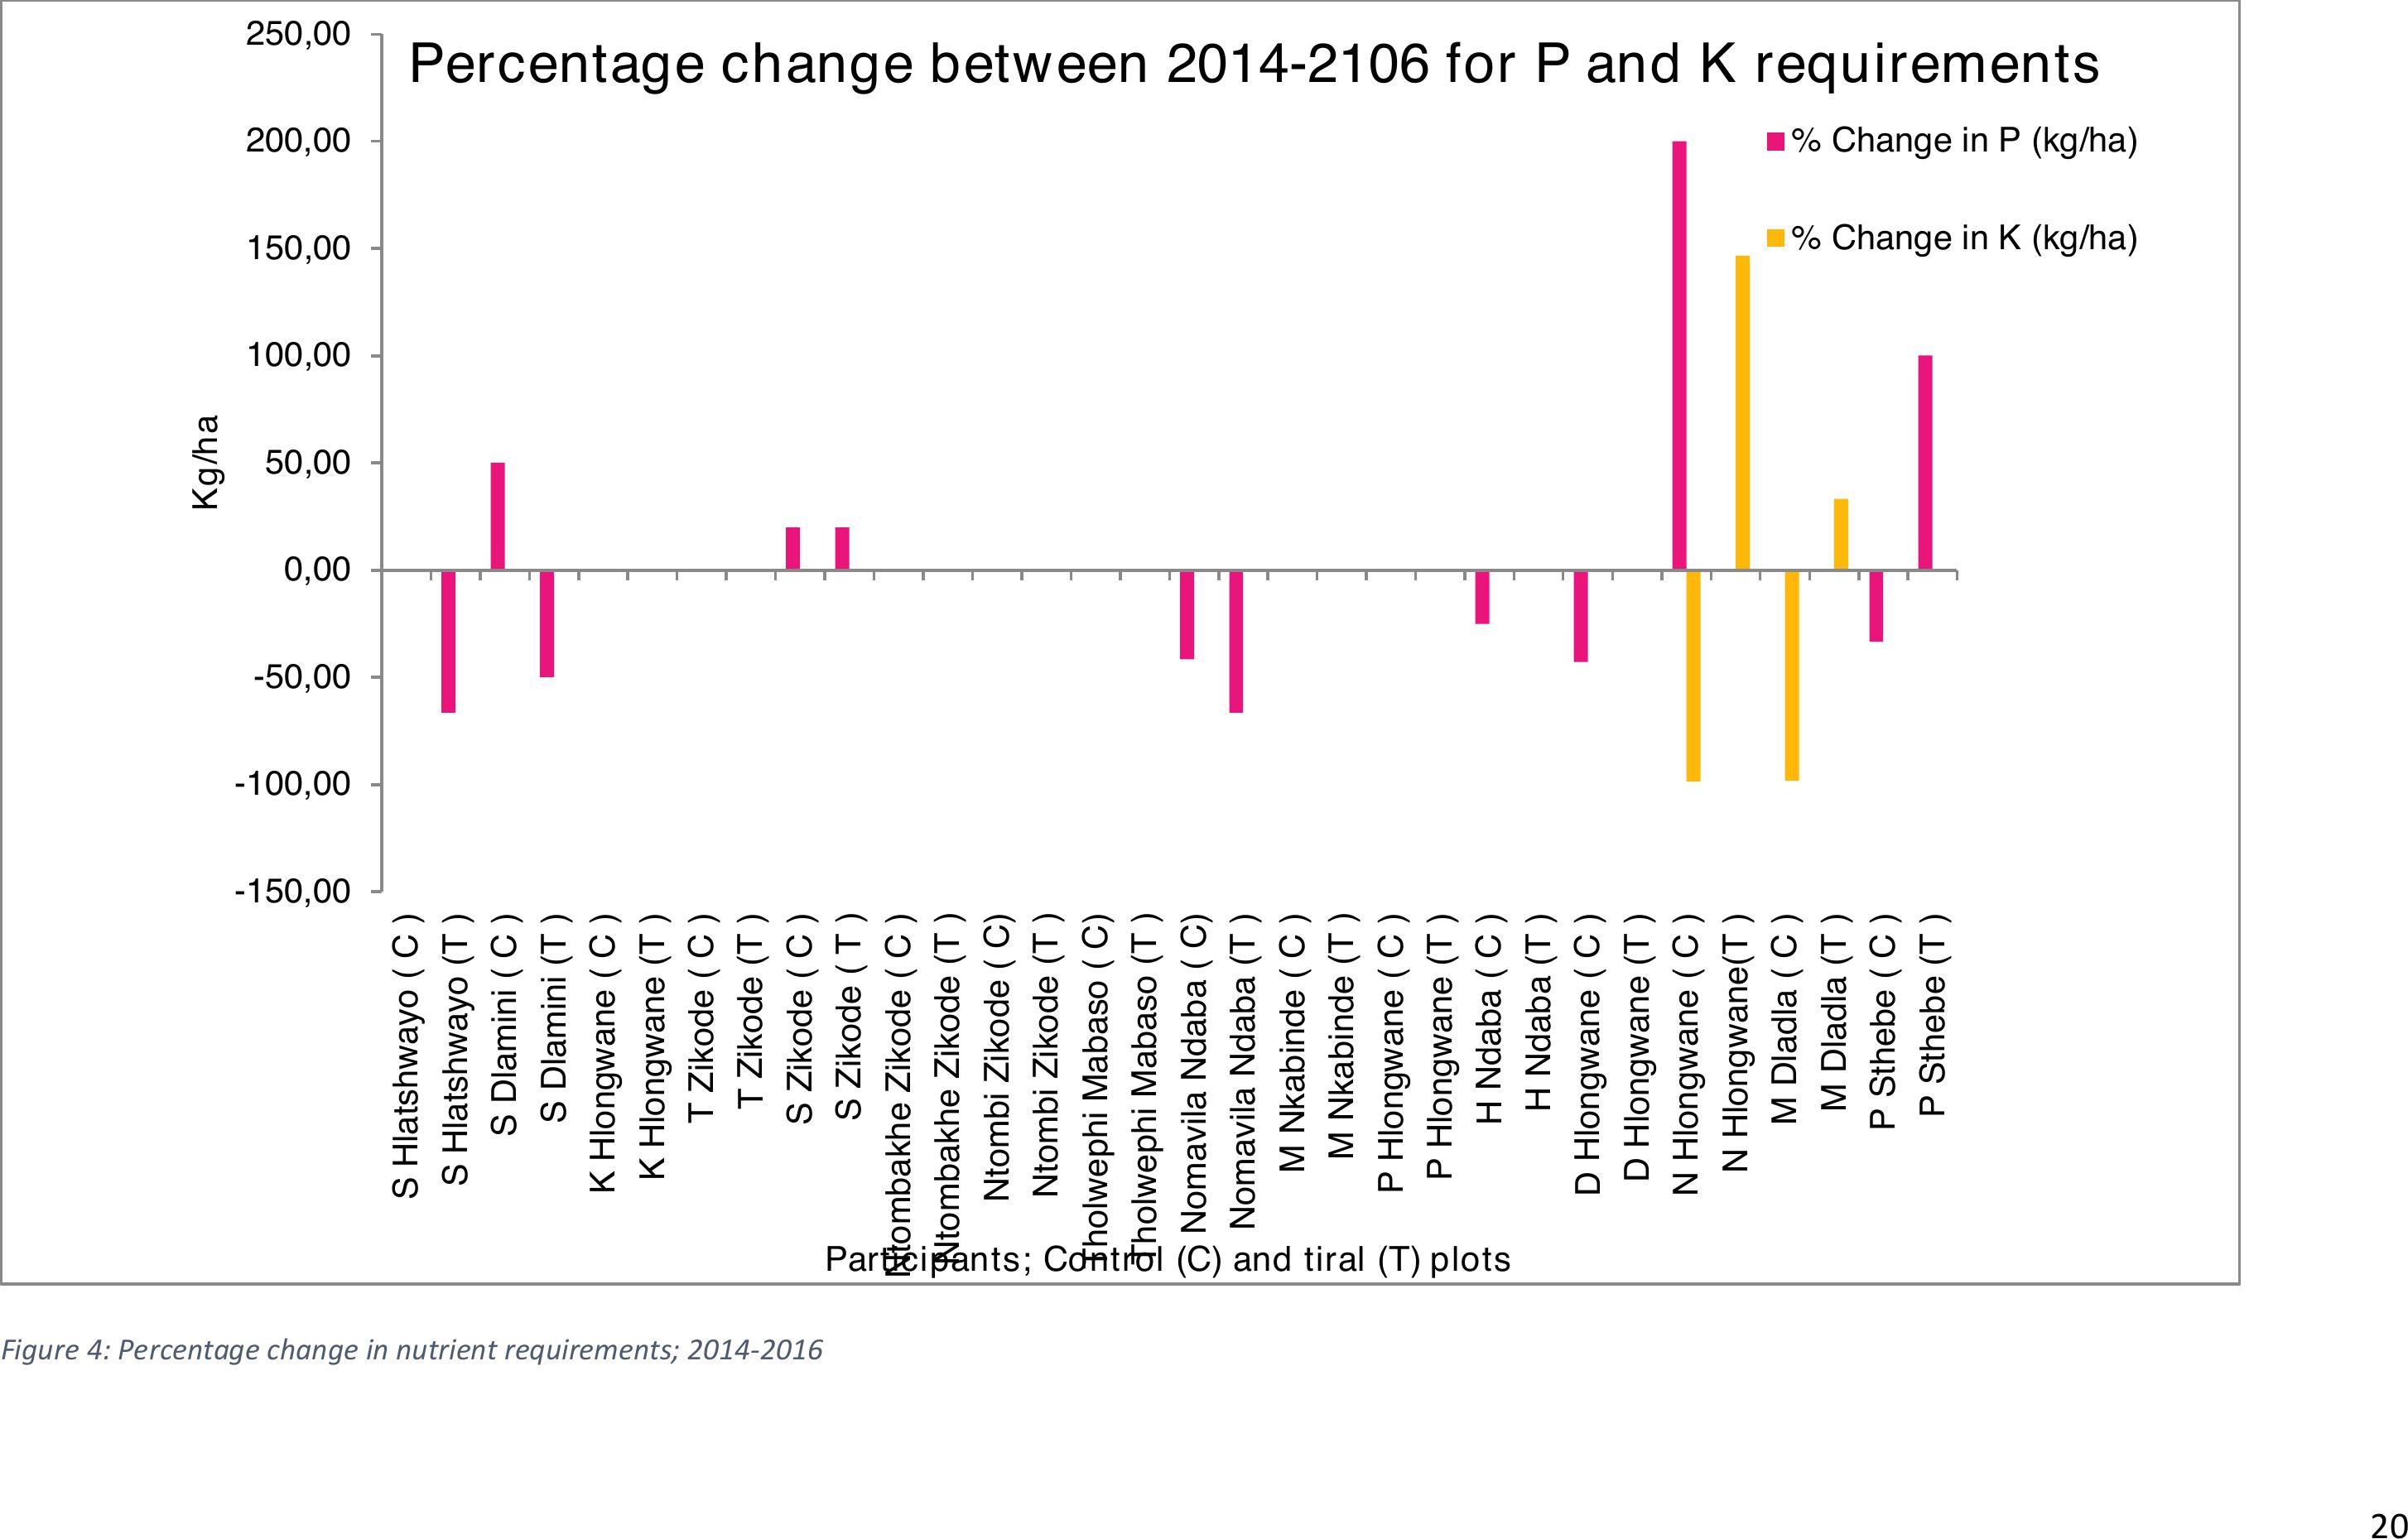
Figure 4: Percentage change in nutrient requirements; 2014-2016
-150,00
-100,00
-50,00
0,00
50,00
100,00
150,00
200,00
250,00
S Hlatshwayo ( C )
S Hlatshwayo (T )
S Dlamini ( C )
S Dlamini (T )
K Hlongwane ( C )
K Hlongwane (T )
T Zikode ( C )
T Zikode (T )
S Zikode ( C )
S Zikode ( T )
Ntombakhe Zikode ( C )
Ntombakhe Zikode (T )
Ntombi Zikode ( C)
Ntombi Zikode (T )
Tholwephi Mabaso ( C)
Tholwephi Mabaso (T )
Nomavila Ndaba ( C)
Nomavila Ndaba (T )
M Nkabinde ( C )
M Nkabinde (T )
P Hlongwane ( C )
P Hlongwane (T )
H Ndaba ( C )
H Ndaba (T )
D Hlongwane ( C )
D Hlongwane (T )
N Hlongwane ( C )
N Hlongwane(T )
M Dladla ( C )
M Dladla (T )
P Sthebe ( C )
P Sthebe (T )
Kg/ha
Participants; Control (C) and tiral (T) plots
Percentage change between 2014-2106 for P and K requirements
% Change in P (kg/ha)
% Change in K (kg/ha)

21
Comparisons were made for soil sample results taken in 2014 and then again for the same participants in 2016. The intention was to see whether
any changes in soil fertility could be attributed to the CA experimentation undertaken by these 16 participants. As the N recommendations in soil
sample results are generic and based on crop nutrient use, these were not included here. What can be seen is that:
-For a number of participants (7/16- 44%), for both their trial and control plots, fertility recommendations have remained the same.
-For three participants (19%), the P recommendations have decreased for the CA trial plots, and for a further 3 participants (19%) the
recommendation has decreased for their control plots- but not their trials.
-P recommendations have increased for one participant only (6%) in her trial plot and for 2 participants (12%) in their control plots.
-For the most part participants do not have to add K, as their soils contain adequate to high levels of K. However 2 participants (12%) , needed
K in their plots, which increased for the CA trials and decreased for their controls. This is because no K has been added in the trial plots in
the last three years and participants generally use compound fertilizers (with K) in their control plots.
-From the above trends the changes in soil fertility are more likely due to the addition of fertilizer than changes effected by the cropping
system. The need for P in the soil also needs to be considered in combination with the soil acidity and liming requirements for those soils.
An analysis was also done for changes in Liming requirements for these participants. A yearly surface application of lime 91t/ha0 has been used
throughout. The results are shown in figure 5 below.

22
Increased requirement for P is mirrored in increased requirement for Lime and thus is related to unavailability of P through acidity in2 participants’
(12%) of the control plots. 6 Participants (38%) have shown a reduced need for lime, and for a further 6 participants (38%) the lime requirement
has remained unchanged. This indicates that the ‘top-up’ liming practice of using 1t/ha every year is having the required effect of stabilizing or
reducing acidification in the soil. However, given that the average H for these participants is 4,17 and the average % acid saturation is 19,2% one
would have to comment that the situation is stable but not ideal. These soils need much more lime than is presently being used.
The four participants who have an increased need for lime all have pH values below 4 and acid saturation values of >40% in their plots and would
need the application of much higher quantities of lime in their fields to make a significant difference.
-150,00
-100,00
-50,00
0,00
50,00
100,00
150,00
200,00
250,00
300,00
350,00
S Hlatshwayo ( C )
S Hlatshwayo (T )
S Dlamini ( C )
S Dlamini (T )
K Hlongwane ( C )
K Hlongwane (T )
T Zikode ( C )
T Zikode (T )
S Zikode ( C )
S Zikode ( T )
Ntombakhe Zikode ( C )
Ntombakhe Zikode (T )
Ntombi Zikode ( C)
Ntombi Zikode (T )
Tholwephi Mabaso ( C)
Tholwephi Mabaso (T )
Nomavila Ndaba ( C)
Nomavila Ndaba (T )
M Nkabinde ( C )
M Nkabinde (T )
P Hlongwane ( C )
P Hlongwane (T )
H Ndaba ( C )
H Ndaba (T )
D Hlongwane ( C )
D Hlongwane (T )
N Hlongwane ( C )
N Hlongwane(T )
M Dladla ( C )
M Dladla (T )
P Sthebe ( C )
P Sthebe (T )
t/ha
Participants' control (C) and trial (T) plots
%Change in lime (t/ha)
% Change in lime (t/ha)
Figure 5: Percentage change in lime requirements; 2014-2016

23
Stulwane: Soil fertility status
In Stulwane, repeat samples were taken for 8 participants who have been active for three or more seasons (2014-2016). The intention is to see how
the soil fertility parameters have changed for these participants in their CA plots. The assumption is that the combination of good soil management
practices, soil building strategies using crop diversification and soil residues, and judicious use of fertilizers would improve the soil statues and
reduce the need for fertilizers. The figure below provides summaries for acidity, nutrient requirements and carbon and nitrogen stocks in the soil.
0,0010,00 20,00 30,00 40,00 50,00 60,00
Average of pH
Average of Acid sat (%)
Average of N Req (kg/ha)
Average of P req (Kg/ha)
Average of K req (kg/ha)
Average of Lime req (t/ha)
Average of Org. C %
Average of N %
Average of Clay %
Average
Average of
pH Average of
Acid sat (%)Average of N
Req (kg/ha)Average of P
req (Kg/ha)Average of K
req (kg/ha)
Average of
Lime req
(t/ha)
Average of
Org. C %Average of N
%Average of
Clay %
OVERALL AVERAGE4,04 32,0640,6342,8125,00 7,412,610,19 45,19
2016 AVERAGE4,09 28,3841,2537,5033,13 2,502,500,15 44,38
2014 AVERAGE3,9935,75 40,00 48,13 16,88 12,312,710,2346,00
Stulwane:Average of soil fertility values 2014,2016 (Maize)
Figure 6:Summary of soil fertility status parameters for 8 participants in Stulwane; 2014-2016

24
From Figure 6 the following trends can be seen:
-Average pH has increased slightly and the percentage acid saturation has decreased. From the 8 participants Ph in their plots have decreased
for 3 participants and increased for 5. Average lime requirements or 2016 were much lower at 2,5t/ha than in 2014 when it was12-13t/ha.
This indicates that the small quantities of lime (1t/ha), added yearly as a top up have had a significant effect on the acidity status of the soils
in the participants’ CA plots.
-The average pH at 4,04 with acid saturation at 32% is still a matter for concern, as this will affect bean growth and yields, maize being a bit
more tolerant to acidic conditions
-Along with acidity status, the amount of P required/ ha has reduced for 7 of the 8 participants.
-N required has increased for 1 participant, thus increasing the average and K requirements have increased for 2 participants
-Nutrient requirements have reduced for 6 of the 8 (75%) participants over the three years. This is a very positive trend
-The average percentage organic carbon in the soil has decreased, overall % organic carbon increased for 3 of the 8 participants only by and
average of 0,4% (~400kg/ha).
-Mineralizable Nitrogen in the soil has decreased over the three
year period., by around 0,08%.
Generally soil fertility status has increased in the CA plots over the last
three years. Specifically acidity and the need for Phosphate has
reduced. This is considered to be a combination of addition of lime to
the soil and an increase in soil health for these participants. The %
organic carbon in the soil has shown a small decline, which is
unexpected, but is not likely to be statistically significant..
We also compared the soil fertility results for the control plot and CA
plots of the 9 participants in 2016. Given the 3-4 years of CA being
practiced it was expected that differences could now be seen in the
soil fertility status between control and CA plots. Figure 7 provides
the averages for a number of soil fertility measurements
Figure 7: Average soil fertility results for control and CA plots for 9 participants in Stulwane (2016)
Control averagetrial average
Average of pH3,75 4,06
Average of Acid sat (%)33,56 28,33
Average of P req (Kg/ha)37,50 29,44
Average of Lime req (t/ha)6,00 4,03
Average of Org. C %2,39 2,43
Average of N %0,14 0,15
0,00
5,00
10,00
15,00
20,00
25,00
30,00
35,00
40,00
Stulwane,2016: Soil fertility averages for
control and trial plots
25
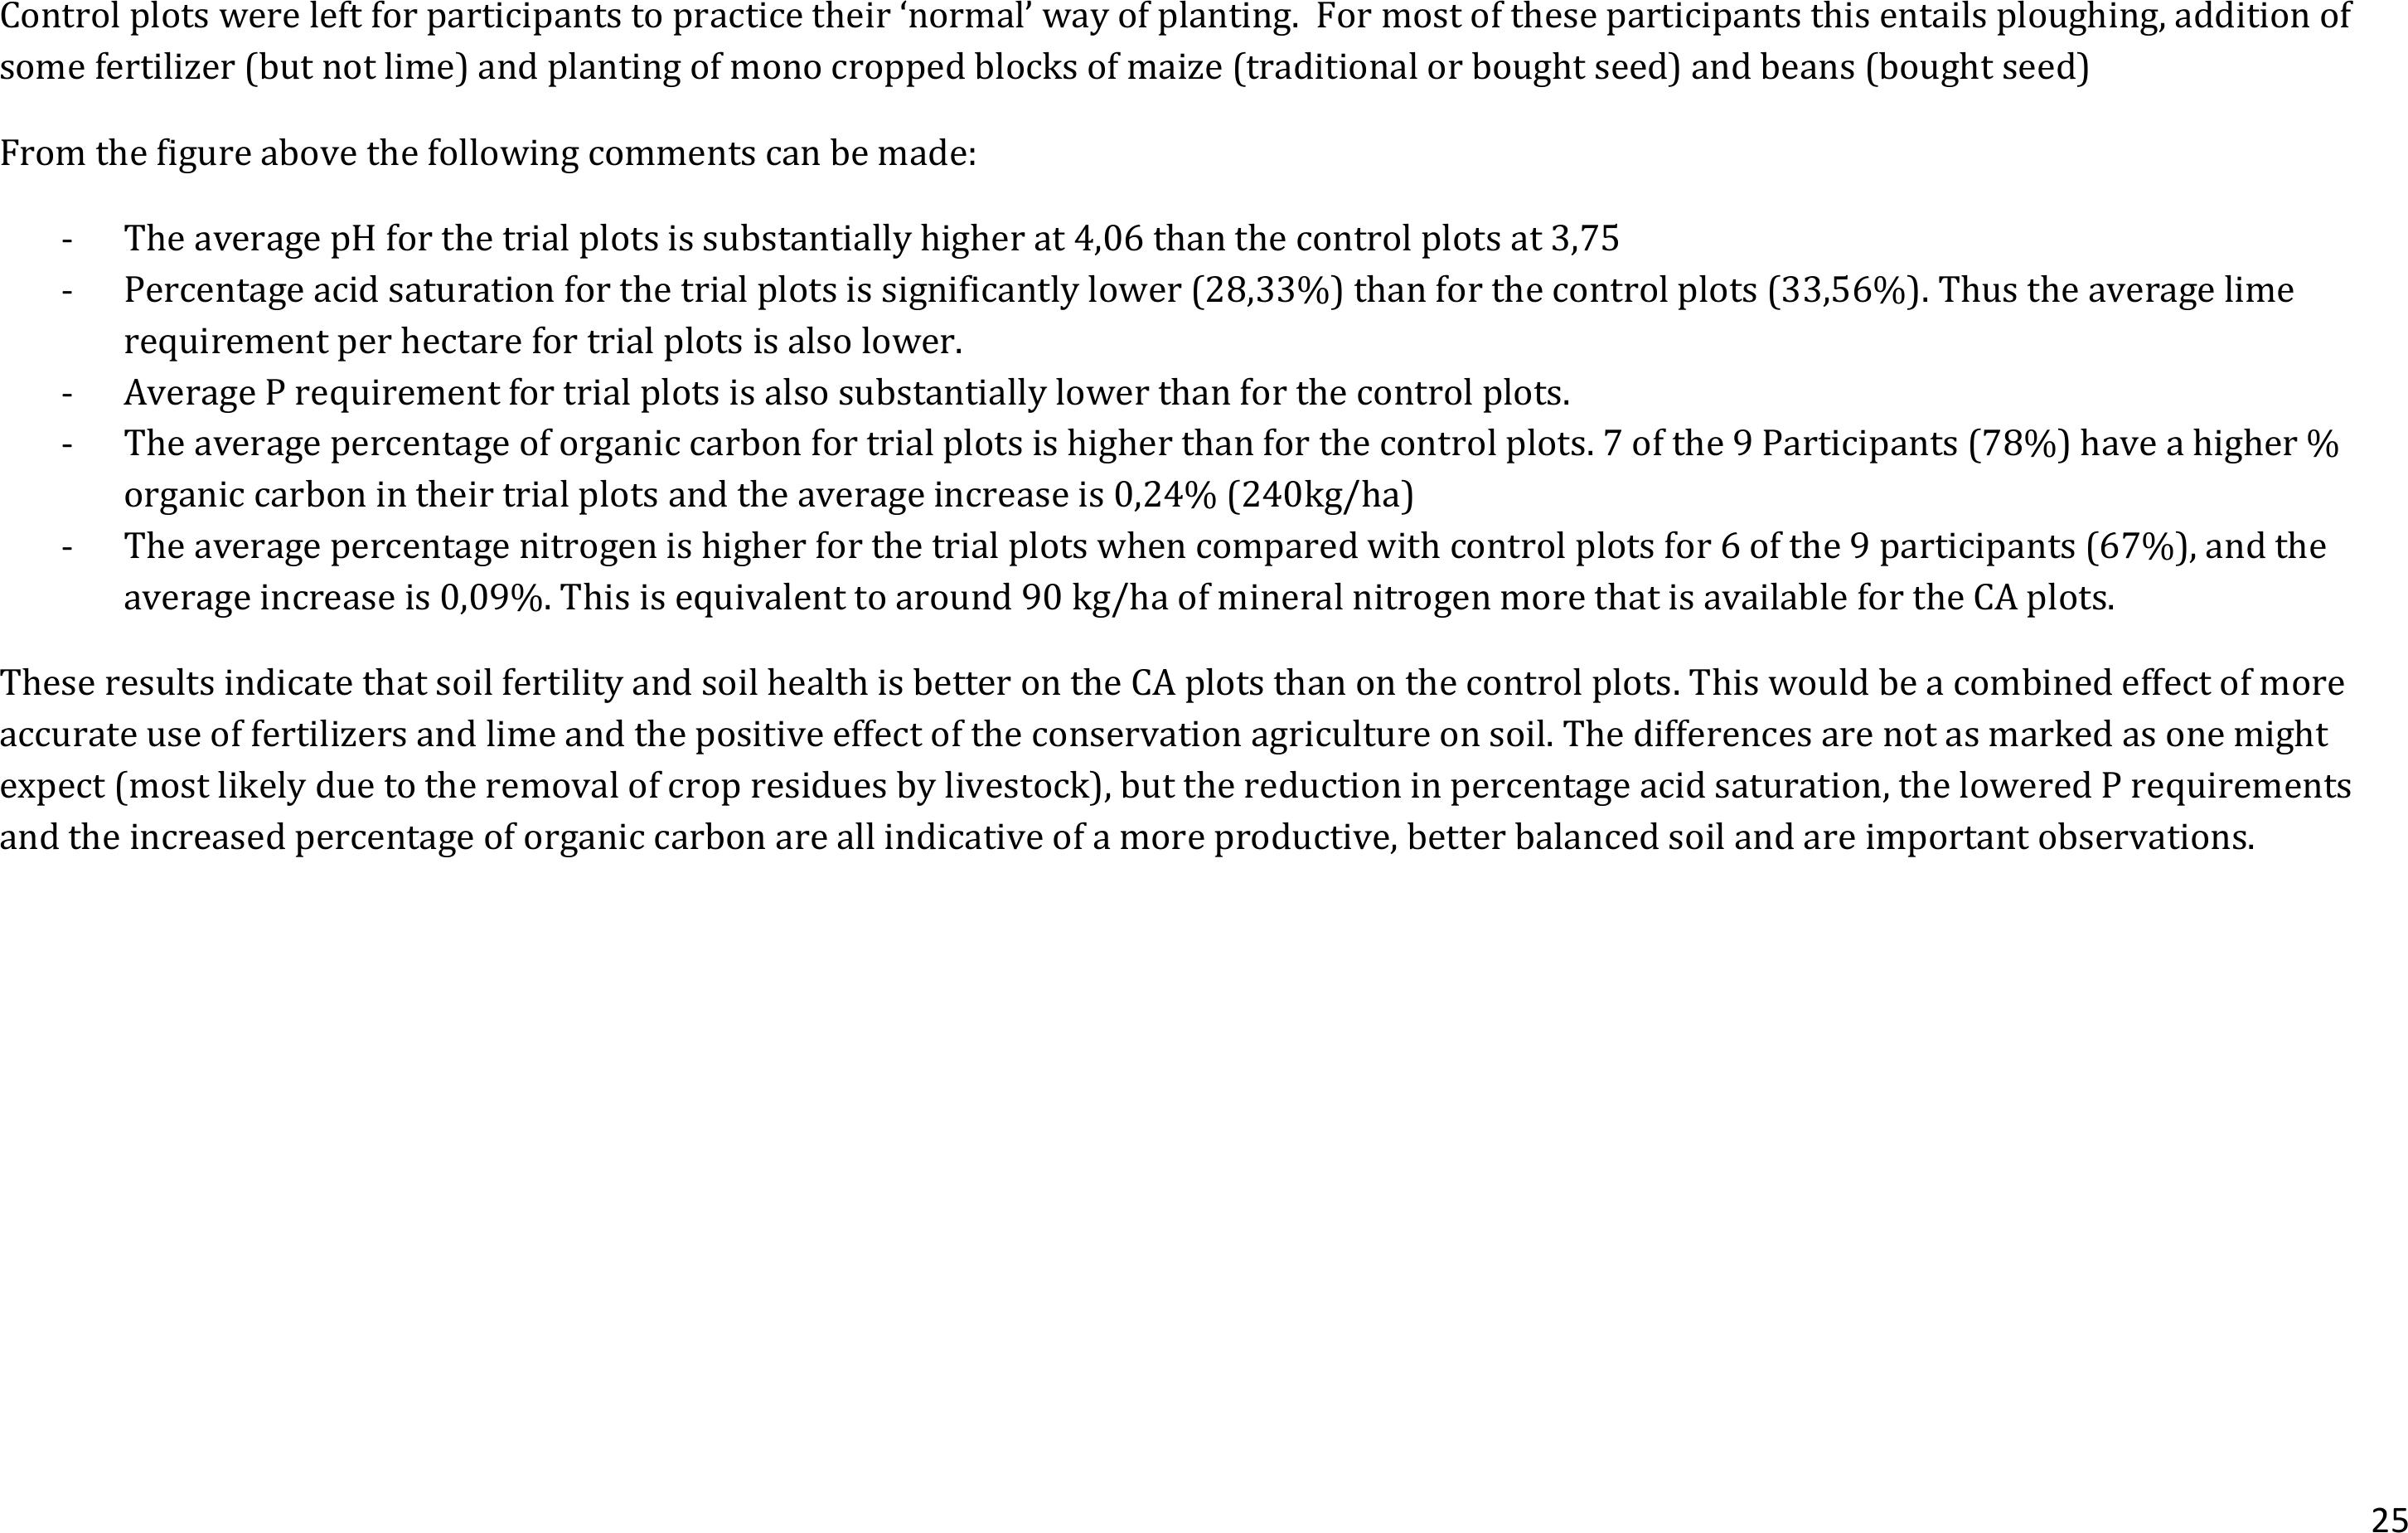
Control plots were left for participants to practice their ‘normal’ way of planting. For most of these participants this entails ploughing, addition of
some fertilizer (but not lime) and planting of mono cropped blocks of maize (traditional or bought seed) and beans (bought seed)
From the figure above the following comments can be made:
-The average pH for the trial plots is substantially higher at 4,06 than the control plots at 3,75
-Percentage acid saturation for the trial plots is significantly lower (28,33%) than for the control plots (33,56%). Thus the average lime
requirement per hectare for trial plots is also lower.
-Average P requirement for trial plots is also substantially lower than for the control plots.
-The average percentage of organic carbon for trial plots is higher than for the control plots. 7 of the 9 Participants (78%) have a higher %
organic carbon in their trial plots and the average increase is 0,24% (240kg/ha)
-The average percentage nitrogen is higher for the trial plots when compared with control plots for 6 of the 9 participants (67%), and the
average increase is 0,09%. This is equivalent to around 90 kg/ha of mineral nitrogen more that is available for the CA plots.
These results indicate that soil fertility and soil health is better on the CA plots than on the control plots. This would be a combined effect of more
accurate use of fertilizers and lime and the positive effect of the conservation agriculture on soil. The differences are not as marked as one might
expect (most likely due to the removal of crop residues by livestock), but the reduction in percentage acid saturation, the lowered P requirements
and the increased percentage of organic carbon are all indicative of a more productive, better balanced soil and are important observations.
26
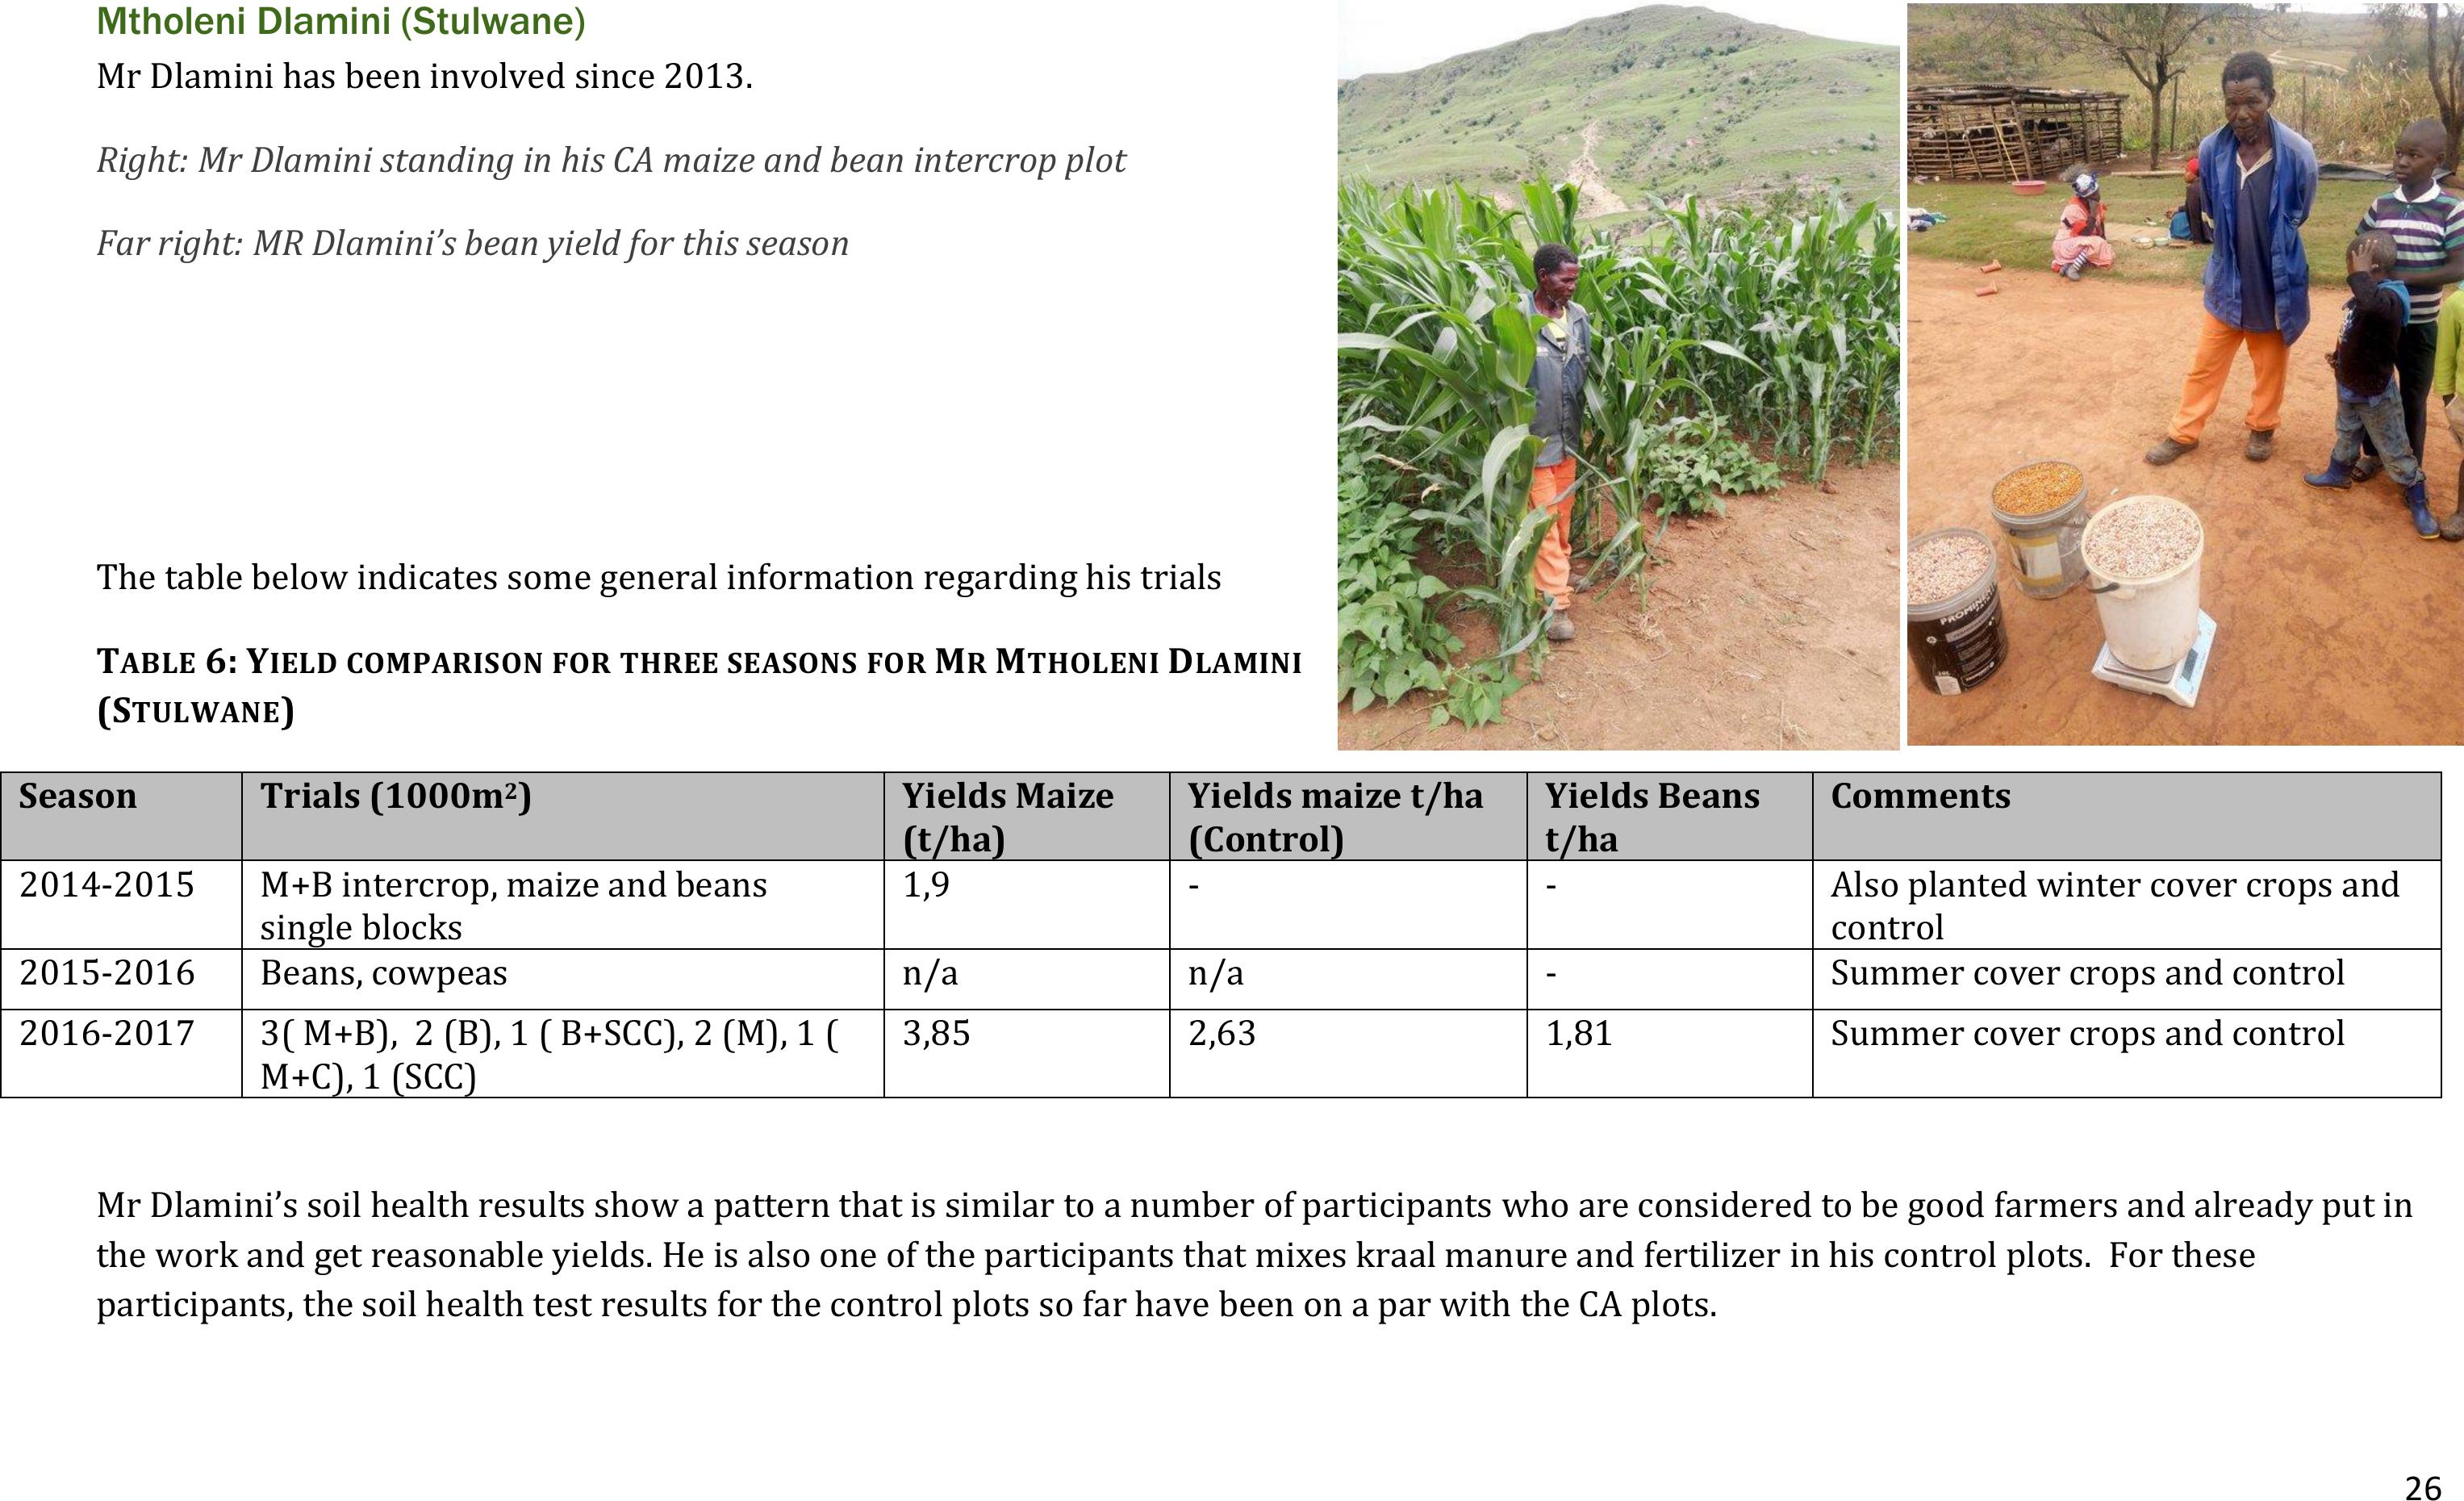
Mtholeni Dlamini (Stulwane)
Mr Dlamini has been involved since 2013.
Right: Mr Dlamini standing in his CA maize and bean intercrop plot
Far right: MR Dlamini’s bean yield for this season
The table below indicates some general information regarding his trials
TABLE6:YIELD COMPARISON FOR THREE SEASONSFORMR MTHOLENI DLAMINI
(STULWANE)
Season
Trials (1000m2)
Yields Maize
(t/ha)
Yields maize t/ha
(Control)
Yields Beans
t/ha
Comments
2014-2015
M+B intercrop, maize and beans
single blocks
1,9
-
-
Also planted winter cover crops and
control
2015-2016
Beans, cowpeas
n/a
n/a
-
Summer cover crops and control
2016-2017
3( M+B), 2 (B), 1 ( B+SCC), 2 (M), 1 (
M+C), 1 (SCC)
3,85
2,63
1,81
Summer cover crops and control
Mr Dlamini’s soil health results show a pattern that is similar to a number of participants who are considered to be good farmers and already put in
the work and get reasonable yields. He is also one of the participants that mixes kraal manure and fertilizer in his control plots. For these
participants, the soil health test results for the control plots so far have been on a par with the CA plots.

27
From the above results, it can be seen that the bean and cowpea mixture predictably provide for more N to the following crop and the scc mix
provides for more P. The control plot values are higher than the CA trial plot values in this case. Mr Dlamini, is another of the participants who has
CA trial plot: summer cover crops (sunflower, miller and sunn hemp), 2015-2016.
following on a maize and bean inter crop (2014-2015 and 2013-2014) N=50,6kg/ha,
P= 12,4kg/ha , K=186,3kg/ha)
Control plot: Planted to beans 2015-2016. following on a maize control plot in 2014-2015.
N=75,5kg/ha, P=26,4kg/ha, K=162,9kg/ha
Figure 8: Veld baseline sample plant available N,P and K. This is a 'high' benchmark against
which the cropping experiments can be compared. N=124,5kg/ha, P=13,3kg/ha ,
K=216,4kg/ha
CA trial plot; bean and cowpea intercrop, 2015-2016, following on a maize and bean
intercrop (2014-2015 and 2013-2014). N=65kg/ha, P=7,7kg/ha, K=186,4kg/ha

28
been practicing CA in his control plots. Fertilization practices, spacing of crops and seed types are however
different to the CA trial plots. All values are below the high veld benchmark.
Phumelele Hlongwane
In the 2015-2016 season, Phumelele out performed almost all the other smallholders and managed to get
rather impressive yields at a time when most other farmers’ crops failed. She experimented with a number of
different crop combinations in her CA plots. Her maize control was also a CA plot, but with use of her own
fertilizer and seed options. Her experimental plots included:
-Intercropping of maize with beans
-Intercropping of maize with cowpea
-Planting cover crop in between rows of maize
-Intercropping maize with lablab
-Planting a single crop of maize (control)
-Planting a single crop of Lab-lab (Dolichos) beans and
-Intercropping of maize with Lab-lab beans
Phumelele followed with a rotation schedule of the same experiments in
the 2016-2107 season.
Clockwise from Top right: Phumelele standing in front of her maize and bean
intercrop plot, taken on 17 Jan 2017. Her Lab-Lab plot and a SCC plot where
she grew sunflower separately and millet and sunn hemp together.
The table below shows yield comparisons for Phumelele’s experimental
plots

29
TABLE7:MAIZE YIELDS FROM DIFFERENT EXPERIMENTAL PLOTS INPHUMLELE HLONGWANE’S (EZIBOMVINI)FIELD
2015/2016 season
2016/2017 Season
Crops Planted
Maize Yields (t/ha)
Crops planted
Maize Yields (t/ha)
Change in yield (t/ha)
Maize +Beans
8,3
Maize + Beans
8,8
0,5
Maize +Cowpea
8,7
Maize + Beans
8,9
0,2
Maize + Beans
10,4
Maize + Cowpea
7,7
-2,7
Maize +Cowpea
6,9
Maize
6,5
-0,5
M +SCC+WCC
8,7
Maize + Beans
10,1
1,4
Maize +Beans
6,9
Maize
6,2
-0,7
The small table below indicates yield averages over the last two seasons.
TABLE8:SUMMARY OF DIFFERENT CROP YIELDS IN PHUMELELE HLONGWANE’S EXPERIMENTAL PLOTS.
t/ha
2015-2016
2016-2017
Maize (Control)-CA
7,8
9,7
Maize Trial CA - combined
6,93
8,3
Beans
0,25
1,81
Sunflower
0,3
0,8
NOTE: Yield increases in 2017 were achieved despite reduction in fertilizer application. She did not apply basal MAP, only top dressed with LAN
The soil health test results from 2015-2016, with some yield data obtained for the different plots are shown in the figure below.
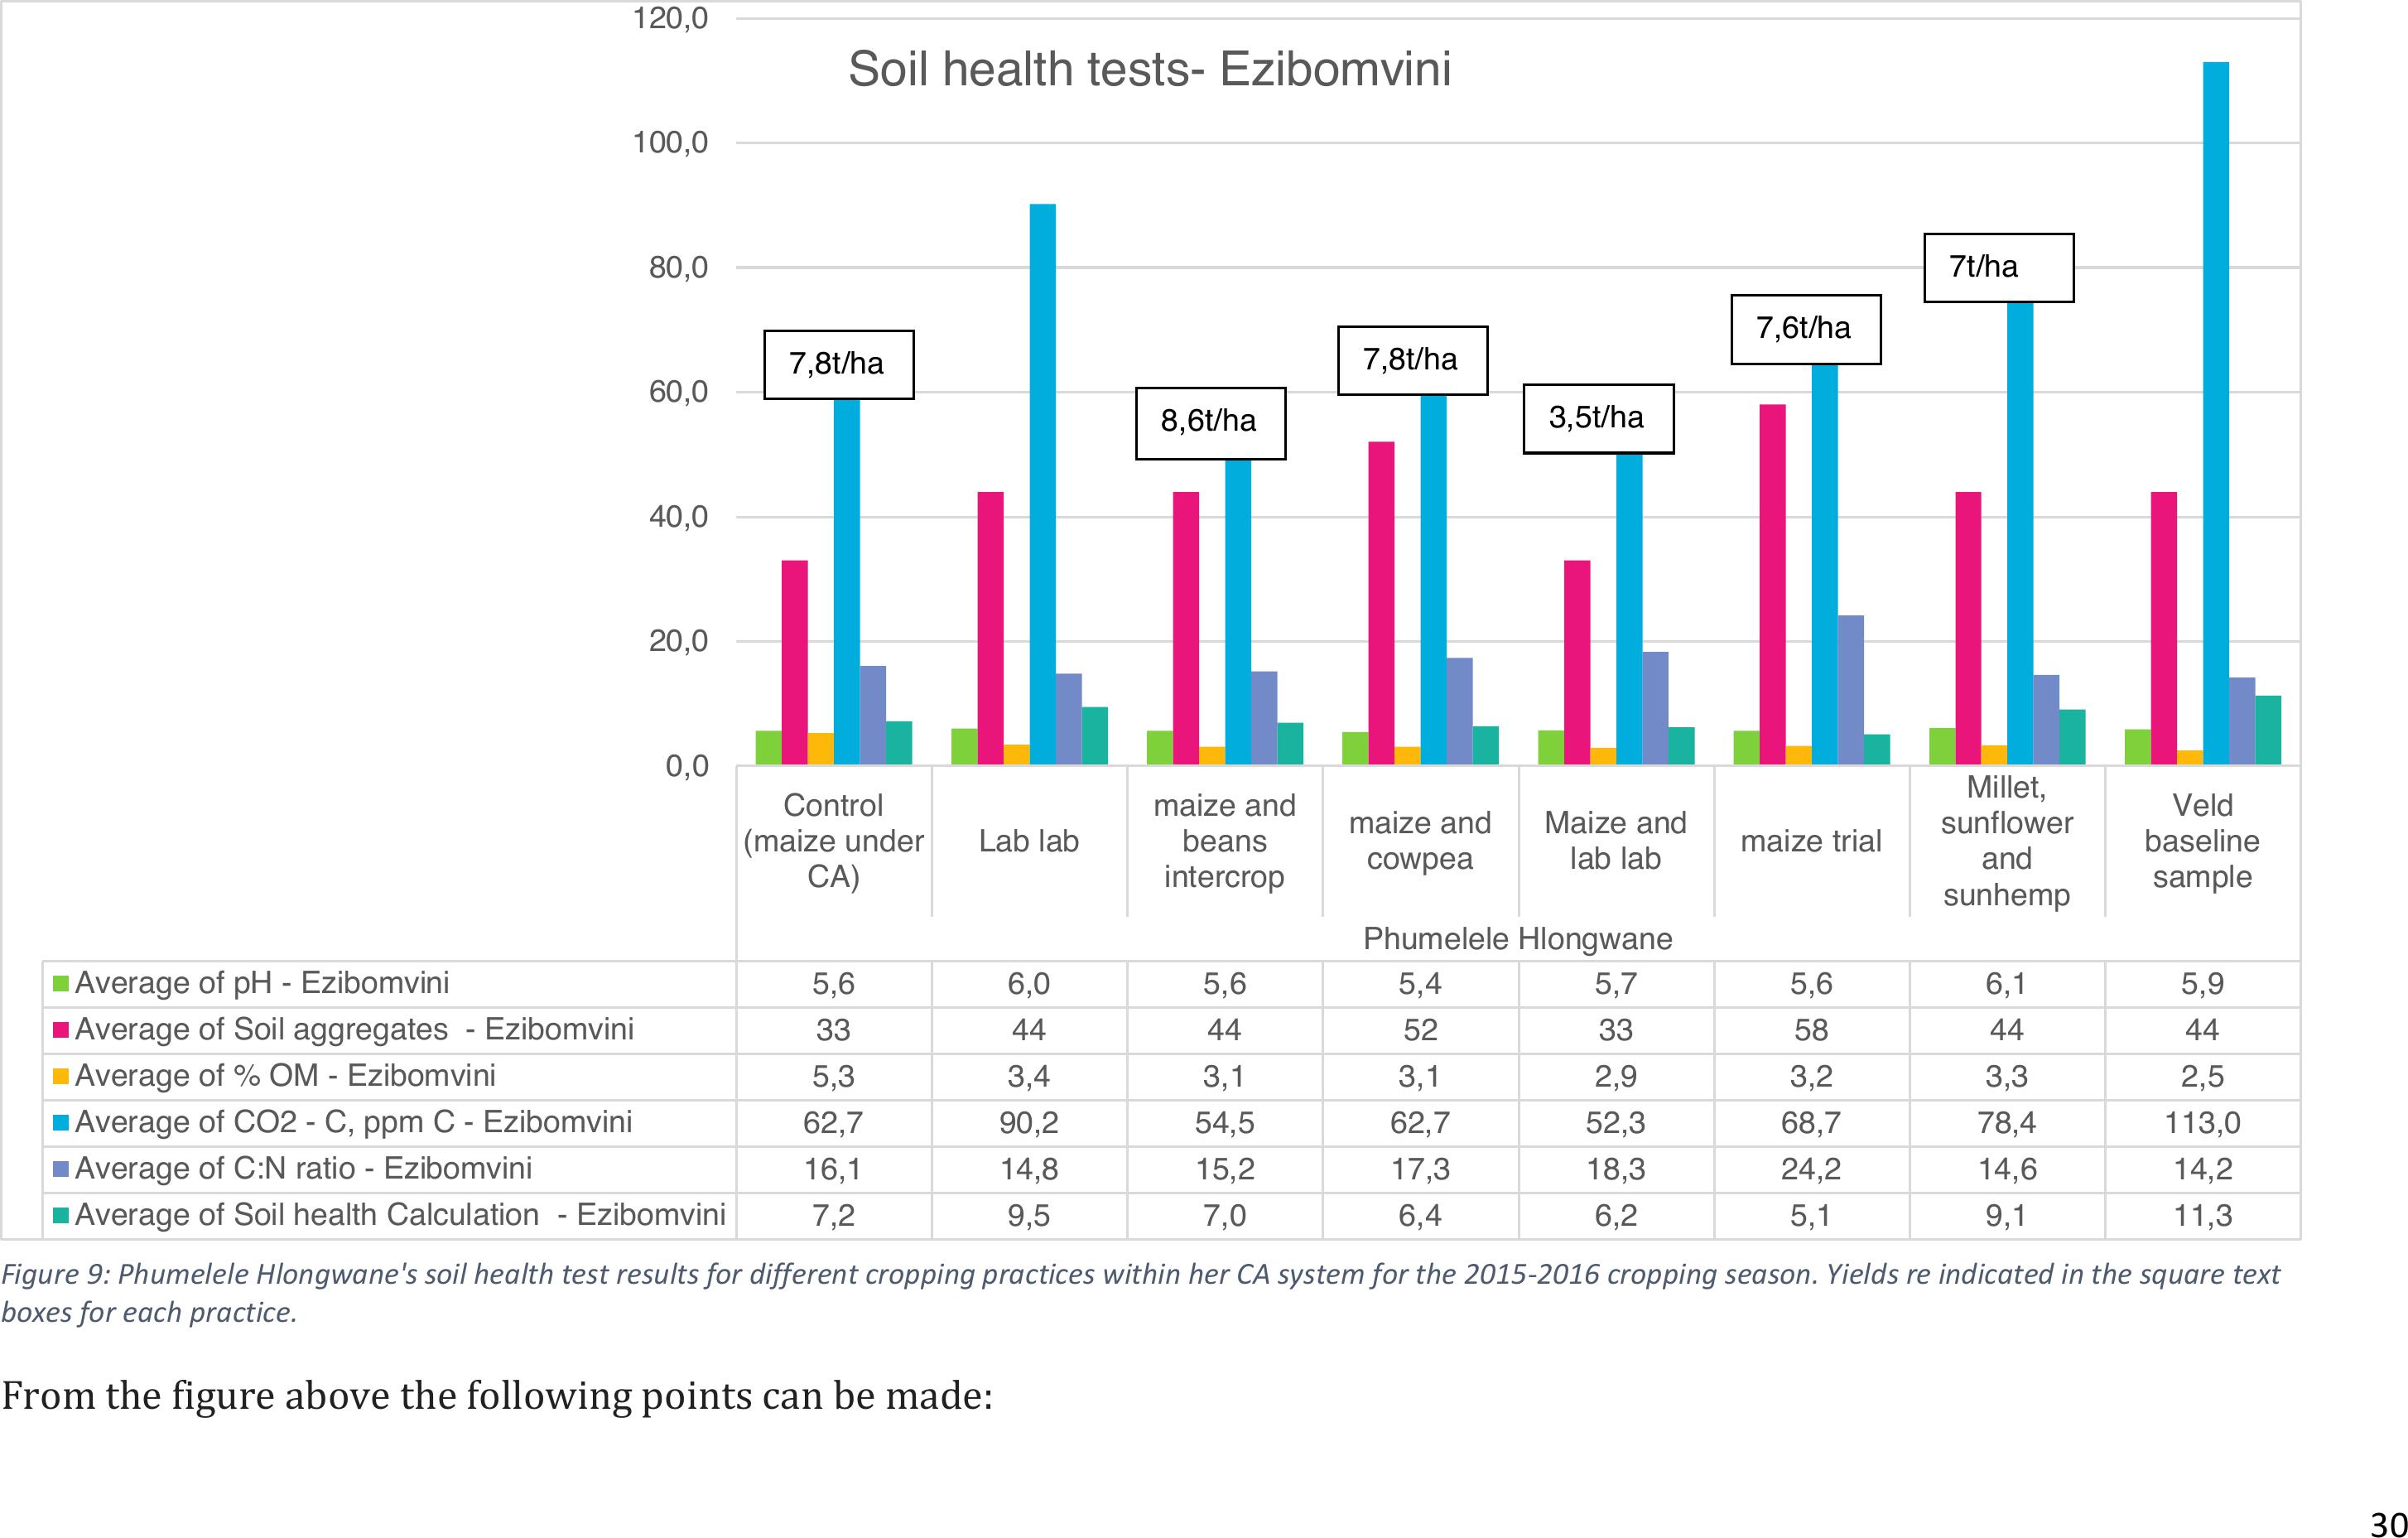
30
From the figure above the following points can be made:
7,8t/ha
Control
(maize under
CA) Lab labmaize and
beans
intercrop
maize and
cowpea Maize and
lab labmaize trial
Millet,
sunflower
and
sunhemp
Veld
baseline
sample
Phumelele Hlongwane
Average of pH - Ezibomvini5,6 6,0 5,6 5,4 5,7 5,6 6,1 5,9
Average of Soil aggregates - Ezibomvini33 44 44 52 33 58 44 44
Average of % OM - Ezibomvini5,3 3,4 3,1 3,1 2,9 3,2 3,3 2,5
Average of CO2 - C, ppm C - Ezibomvini62,7 90,2 54,5 62,7 52,3 68,7 78,4113,0
Average of C:N ratio - Ezibomvini16,1 14,8 15,2 17,3 18,3 24,2 14,6 14,2
Average of Soil health Calculation - Ezibomvini7,2 9,5 7,0 6,4 6,2 5,1 9,111,3
0,0
20,0
40,0
60,0
80,0
100,0
120,0 Soil health tests-Ezibomvini
8,6t/ha
7,8t/ha
3,5t/ha
7t/ha
7,8t/ha 7,6t/ha
Figure 9: Phumelele Hlongwane's soil health test results for different cropping practices within her CA system for the 2015-2016 cropping season. Yields re indicated in the square text
boxes for each practice.

31
-After the veld baseline the highest Soil Health Test (SHT) scores (in descending order) were : Lab-Lab beans, Summer cover
crops, Control maize (CA), maize and bean intercrop, maize and cowpea intercrop, with the lowest score for the maize CA plot.
-The Solvita, microbial respiration tests followed the same trend with the veld baseline being the highest followed by Lab-lab
beans, summer cover crops, maize CA trial, maize and cowpea and maize CA control with the maize and lab-lab plot showing the
lowest Solvita results.
-The C:N ratio for the maize CA trial plot is particularly high, due to no legumes (low N input) and maize residues having a high C
content (or C:N ratio) . Yields were not affected, as the inorganic N content in this plot was higher than the others; the maize
requires higher N-fert input due to N immobilisation in the soil.. It also vindicates Phumelele’s decision not to supply basal
fertilizer in the following season.
-The lowest C:N ratios were achieved for the cover crop plots (lab-lab and summer cover crop mix) – which correlates with the
Solvitas and indicates highest microbial activity and conversion (mineralisation) of nutrients in these plots.
-The maize yield for these plots do not entirely coincide with the soil health scores. The highest yield for maize was achieved in
the maize and bean intercropped plot at 8,6t/ha, followed by the maize and cowpea intercrop plot and the control CA maize plot
at 7,8t/ha respectively.
If one goes into a bit more detail regarding the soil Nitrogen availability; the following small table represents the SOLVITA Labile
Ammonium Nitrogen Analyses (SLAN). This provides the amount of "upstream nitrogen" bound in the Soil Organic component and
represents total releasable N over time.
TABLE 9:COMPARISON OF DIFFERENT FORMS OF NITROGEN AVAILABILITY FOR PHUMELELEHLONGWANE’S CONTROL AND CATRIAL PLOTS;2015-2016
Plots: Phumelele
Hlongwane 2015-2016
SLAN Total
releasable N
Long term
release N
Short term
release N
Immediate
release N
Rand value of N saved
Kg/ha
Maize CA trial
397,6
383,0
8,3
6,3
R107,00
Maize CA Control
341,6
313,6
9,6
18,4
R312,00
Lab-Lab
341,6
310,9
0,0
30,7
R522,00
Maize and scc
319,2
285,2
3,4
30,7
R522,00

32
Maize and beans
308,0
278,0
11,6
18,4
R312,00
Maize and Lab-Lab
268,8
242,4
17,2
9,2
R156,00
Maize and cowpeas
240,8
218,2
9,2
13,4
R228,00
What can be seen from this table is that:
-The cover crop plots (Lab-Lab and scc) are the best at providing immediate release N for the next crop and can save a Rand value
of R522 of nitrogen fertilizer. This helps to explain why the soil health scores are highest for these two plots. They also provide a
substantial amount of long term release N and are thus a very important practice in building soil health.
-The CA maize trial plot provides for the highest long term release N but the lowest immediate release N, This point towards this
practice building soil organic Carbon over time.
-The CA control plot provided more immediate release N, but lower quantities of stable nitrogen, indicated by the larger overall
soil disturbance in the control plot vs trial plots.
-The Maize and legume intercrop plots combine a high value of long term release N with larger quantities of short term and
immediate release N than the Maize only CA plot and provide an average of a rand value of R228 of Nitrogen to the following
crop.
-In addition the maize and bean intercrop plot also provided for the highest yield of maize in the experimental plots at 8,6t/ha
(previous figure).
Overall, for soil health and for benefit of the following crops in terms of available nutrients the cover crop plots and the maize-legume
(specifically maize and beans) intercrop plots are the most beneficial. The latter also provides for the highest yield of maize.
A further study on Soil health was done through a team from the ARC
2
. They took a number of samples from different CA sites in the
Free State North West and KZN. Of interest is that 4 samples from Phumelele Hlongwane were also included (Soybean following maize;
2
Innovative soil health assessments to advance the understanding, improvement and sustainability of grain crop cultivation systems in South Africa.
Johan Habig.ARC-PPRI, Soil Microbiology Laboratory, Private Bag X134, Queenswood, 012
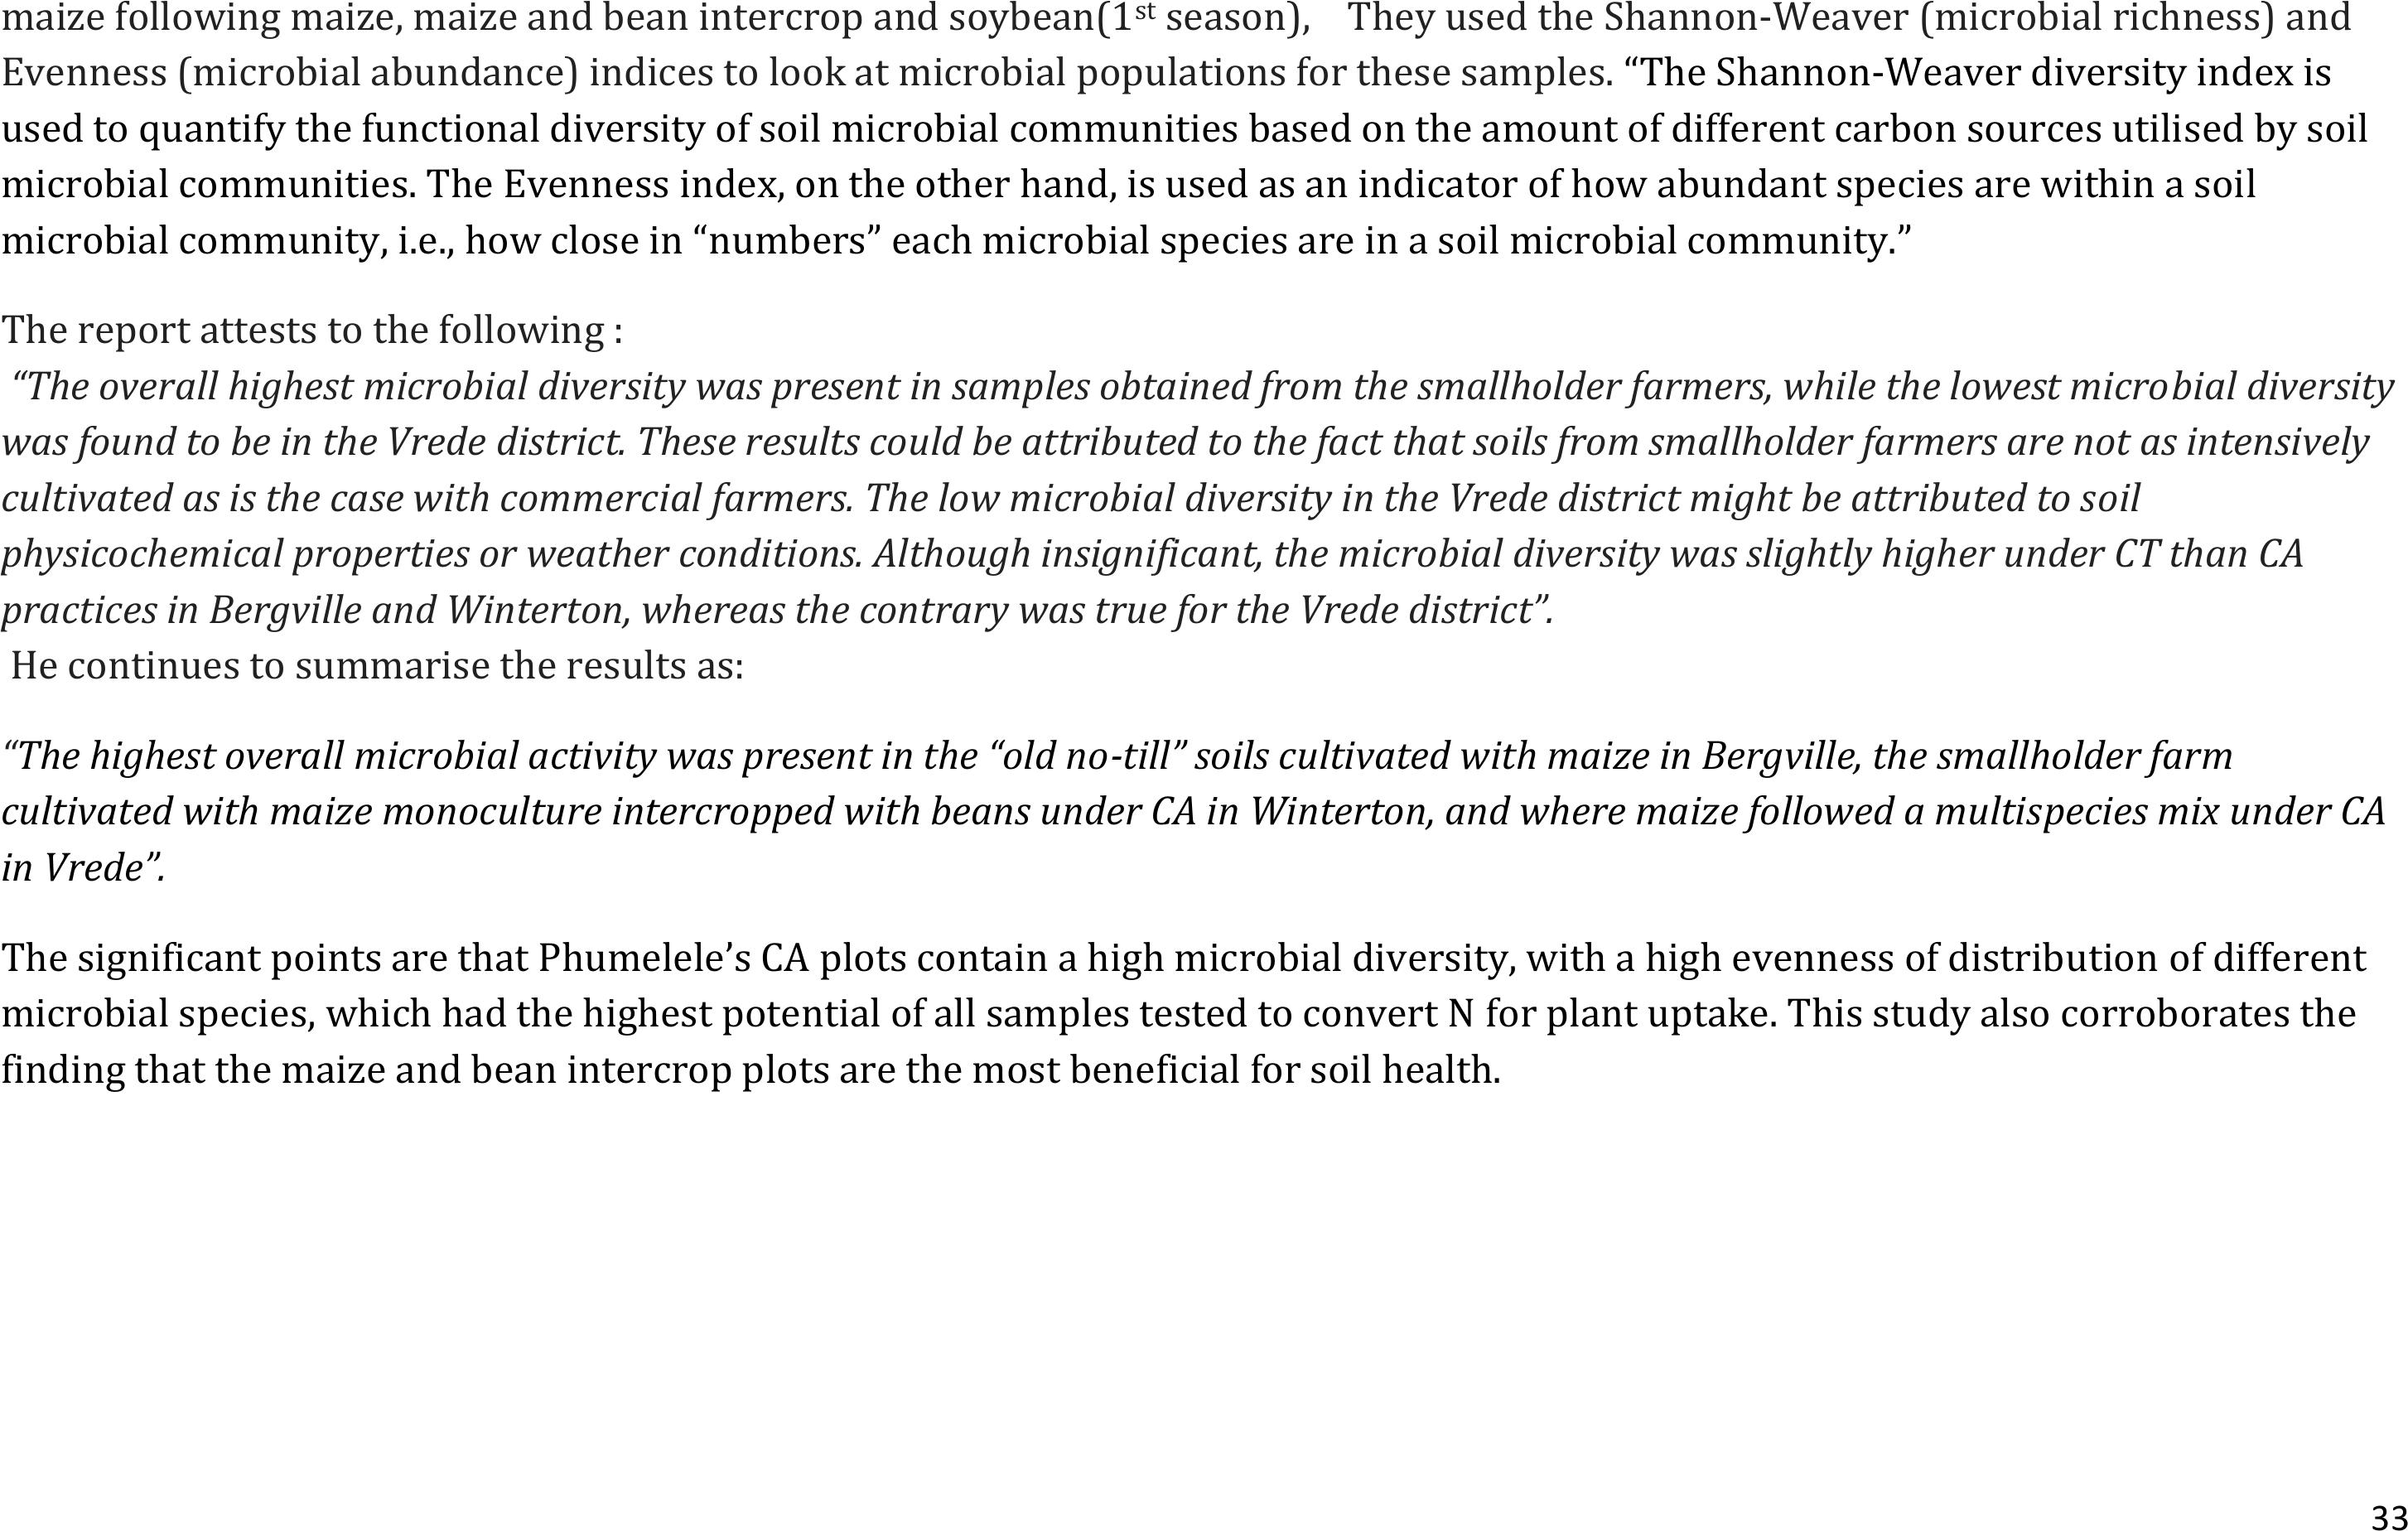
33
maize following maize, maize and bean intercrop and soybean(1st season), They used the Shannon-Weaver (microbial richness) and
Evenness (microbial abundance) indices to look at microbial populations for these samples. “The Shannon-Weaver diversity index is
used to quantify the functional diversity of soil microbial communities based on the amount of different carbon sources utilised by soil
microbial communities. The Evenness index, on the other hand, is used as an indicator of how abundant species are within a soil
microbial community, i.e., how close in “numbers” each microbial species are in a soil microbial community.”
The report attests to the following :
“The overall highest microbial diversity was present in samples obtained from the smallholder farmers, while the lowest microbial diversity
was found to be in the Vrede district. These results could be attributed to the fact that soils from smallholder farmers are not as intensively
cultivated as is the case with commercial farmers. The low microbial diversity in the Vrede district might be attributed to soil
physicochemical properties or weather conditions. Although insignificant, the microbial diversity was slightly higher under CT than CA
practices in Bergville and Winterton, whereas the contrary was true for the Vrede district”.
He continues to summarise the results as:
“The highest overall microbial activity was present in the “old no-till” soils cultivated with maize in Bergville, the smallholder farm
cultivated with maize monoculture intercropped with beans under CA in Winterton, and where maize followed a multispecies mix under CA
in Vrede”.
The significant points are that Phumelele’s CA plots contain a high microbial diversity, with a high evenness of distribution of different
microbial species, which had the highest potential of all samples tested to convert N for plant uptake. This study also corroborates the
finding that the maize and bean intercrop plots are the most beneficial for soil health.

34
An aspect that could be interfering with seedling
germination and growth and overall yields is the
presence of pathogenic soil fungi. A study was conducted
using soil samples from Phumelele Hlongwane’s CA trial
plots by the ARC
3
. Specifically, for Phumelele’s plots
Fusarium and Phoma species were detected. These are
damping off species that would affect germination and
early growth of seedlings.
The data indicates that the severity of root rots is higher
in the CA plots than the conventionally tilled plots.
This could then provide the beginnings of an explanation
as to why the yields in conventionally tilled plots tend to
be a bit higher than the CA plots.
Right: Figure indicating the severity of root and crown rots from
soil samples taken from Phumelele Hlongwane’s plots. The
potential for higher severity of soil borne diseases in the two CA
plots is shown clearly.
3
Agricultural Research Council. Plant Protection Research Institute. P/Bag X134, Queenswood, Pretoria 0121. Preliminary Consultation Report-Analyses Of Soil borne
Diseases Of Maize, Soybean And Sunflower – Soil Health Project. Prepared by: Dr Sandra Lamprecht and Thabo Phasoana. Tel: (021) 887 4690 Fax: (021) 887 5096. Email:
lamprechts@arc.agric.za

35
Pasteurisation of the soil samples prior to germination and growth of seedlings was done to test the difference. The two pictures below
are indicative
Maize grown in pasteurised(2 pots on the left) and non pasteurised (two
pots on the right) soil from Phumelele's CA maize and bean intercrop CA
plot. The difference in growth and germination is clearly visible
Figure 10: Maize grown in pasteurised (2 pots on the left) and non
pasteurised (2 pots on the right) soil from Phumelele's CA maize trial plot.
The difference in growth and germination is clearly visible.

36
Eqeleni
In Eqeleni soil health samples were taken for control and trial plots for Khonzaphi
Hlongwane and Smephi Hlatshwayo. Both are good farmers who have been part of the
CA farmer innovation process for 4 years.
Khonzaphi Hlongwane is another of the participants for whom the soil health results are
presently higher for her control plot than her maize and bean intercropped plot. As
shown for Phumelele Hlongwane in the section above this does not mean that gains in
soil health in terms of longer term build up of nutrients and microbial populations in the
soil is not occurring.
Right: Smpehi Nkosi’s conventionally tilled maize control showing drought stress on 25
February 2016 Far right: Her sorghum cover crop, following on 2 years of CA maize and
bean intercrop growing very well at the same time.
For Smephi Hlatshwayo her CA maize plot fared better than the cover crop (sorghum) plot. Both plots however have very high soil health scores. The
maize CA plot in particular has a much higher percentage of OM in the soil and also a high rate of microbial respiration, indicating a soil with high
microbial diversity and evenness of microbial population types. The results are shown in the figure below

37
Figure 11: Soil health test results for veld baselines, control plots and CA plots for Khonzaphi Hlongwane and Smephi Hlatshwayo from Eqeleni (2015-2016)
General recommendations regarding soil health tests:
-Veld baselines need to be done specifically for each farmer and every season. They also need to be taken in the same place every year to
make them comparable.
-Some attention needs to be given to sampling- the need for a larger no of sub samples is becoming evident in high variability in results from
the same plots
-As the control plots no longer represent standard conventional tillage – these samples need to be taken in plots that do represent that – and
need their own veld baseline samples.
-It may not be possible to compare soil health test results across years meaningfully, especially in the early CA implementation stages and also
due to high climatic variation between seasons.
-Comparison of soil health test results from different CA practices within a trial seem to be interesting and provide for meaningful
comparisons.
maize and
beans Maize,
control
Veld
baseline
sample
maize and
beans
intercrop
maize
control (CA)Sorghum Veld
baseline
sample
Khonzaphi HlongwaneSmephi Hlatswayo
Average of pH - Eqeleni4,9 5,6 5,1 5,7 5,1 5,6 5,1
Average of Soil aggregates - Eqeleni33 33 33 33 35 33 33
Average of % OM - Eqeleni4,8 5,3 5,1 2,6 4,2 2,8 5,1
Average of CO2 - C, ppm C - Eqeleni82,3102,047,6 43,5 94,1 74,6 98,8
Average of C:N ratio - Eqeleni16,8 14,9 20,6 12,4 13,1 13,4 16,3
Average of Soil health Calculation - Eqeleni8,9 12,2 7,77,3 12,3 9,69,0
0,0
20,0
40,0
60,0
80,0
100,0
120,0
Soil health tests -Eqeleni

38
Liming trials
After 2-3 years of involvement in the GRAINSA-SFIP project, some famers are still getting low
yields from their trial and control plots. Soil acidity appears to be one of the major contributing
factors to this problem. The soil sample analysis results have shown lime requirements ranging
between 0 t/ha and 11 t/ha. Generally, maintenance lime of 1 t/ha has been recommended as a
standard for farmers in the programme. For those with the highest lime requirements, yields
remain very low and the maintenance lime does not work well for them.
In order to test if soil acidity is a cause of low yields, three farmers with the highest lime
requirements in 3 villages (Eqeleni, Mhlwazini and Stulwane) were selected. The farmers in
Eqeleni, Mhlwazini and Stulwane had lime requirements of 10.25 t/ha, 7.25 t/ha and 11.5 t/ha,
respectively. A farmer led experimentation was undertake with these 3 farmers (see the small
table below) to test the following; (a) if applying the required lime would have an impact on the
yields and (b) which of the two lime application methods (applying lime and leaving it on the
surface under CA plots and applying lime and ploughing it in the soil under conventional tillage)
is more effective. The overall aim of these experiments was to test two methods of lime
application and to evaluate how those contribute to yield improvement.
TABLE10:LIMING REQUIREMENTS AND APPLICATION FORTHE3PARTICIPANTS IN THELIMING TRIALS;2016-
2017
Name and village
Ntombakhe
Zikode
(Eqeleni)
Phumzile
Zimba
(Mhlwazini)
Phasazile
Sithebe
(Stulwane)
Amount of lime required(t/ha)
10.25
7.25
11.5
Amount of lime applied (50 kg bags)
20
10
23
Maintenance lime (t/ha)
1
1
1

39
Figure: Top left: Phasazile Sithebe applying lime in her field, Top right: tilling the lime under
conventional tillage, Bottom Left and right: method use in applying maintenance lime for beans
and or cowpea and maize, respectively
The results from all three experiments indicated that the yields are higher in plots were lime
was applied and left on the surface compared to plots were lime was applied and ploughed in.
See the table below This shows that lime application under CA/ No Till is more effective
compared to lime application under conventional tillage. Other factors (e.g. fertilizer
application) were kept constant and therefore lime was the only variable in the experiments.
Other factors, planting dates, rainfall and frequency of weeding were also kept constant and
their effect is considered negligible.
TABLE11:YIELDS FOR THE3 LIMING TRIALS:2016-2017
Names
Ntombakhe
Zikode
(Eqeleni)
Phumzile
Zimba
(Mhlwazini)
Phasazile
Sithebe
(Stulwane)
Surface liming plot (maize yield (t/ha))
3
6.2
3.4
Lime and plough plot (maize yield (t/ha))
2.6
4.6
1.6
Difference
0.4
1.6
1.8
An attempt was made to compare the results from this year’s trial and conventional tillage
control plots, to those of previous seasons. Yields from 2013 and 2014 were compared, as the
first year of involvement for the three participants. Yields for both the CA and control plots have
increased substantially. See the small table below.
TABLE12:YIELD COMPARISONS FOR2SEASONS FOR THE THREE LIMING TRIAL PARTICIPANTS.
This indicates that liming can have a significant effect on yields. For this small sample of
participants there is no indication however, that ploughing in of lime works better than surface
application. The experiment will be continued into the next season.
Yields for CA trial and control plots
Yields were measured and recorded for 164 of the overall 212 participants. This accounts for
78% of the participants who planted. 22% of Participants experienced crop failure. 85% of
participants collected their harvests for weighing. This, under these smallholder circumstances,
is truly an impressive feat of organisation and motivation of smallholder farmers, by the
Mahlathini field work team.
Names
Ntombakhe
Zikode (Eqeleni)
Phumzile
Zimba
Mhlwazini
Phasazile
Sithebe
(Stulwane)
20132016
20142016
20132016
Surface liming plot (maize yield
(t/ha))
1.72
3
0.93
6.2
2.67
3.4
Lime and plough plot (maize yield
(t/ha))
2.5
2.6
0.75
4.6
-
1.6

40
The figure below summarises the average yields across all the villages in Bergville.
TABLE13:AVERAGE,MINIMUM AND MAXIMUMCROP YIELDS FOR BERGVILLE;2016-2017
YIELDS
2016-2017
Maize -
Trial
n=141
Maize
Control
n=29
Beans
Trial
n=137
Beans
late
n=13
Cowpeas
n=14
Sunflower
n=10
Millet
n=1
Sunn
hemp
n=1
Average
2,80
2,82
0,91
0,76
0,52
0,97
0,05
0,20
max
11,74
9,69
2,44
2,10
2,80
2,95
0,05
0,20
min
0,28
0,34
0,02
0,07
0,05
0,05
From the above figure and the small table outlining the yields for this season the following
points can be made:
-The highest average maize yields were obtained in Ezibomvini (5,02t/ha), Eqeleni
(4,8t/ha) and Emabunzini (4,47t/ha). The latter is a new expansion area next to
Ezibomvini.
-The lowest average maize yields were in Magangangozi (0,16t/ha). This area struggled a
lot with cattle invasions and yields were decimated. The other two villages with the
lowest trial maize yields were Emangweni (1,22t/ha)and Nsuka (1,49t/ha). In these two
villages yields suffered because of lack of trial maintenance and weeding.
Ema
bun
zini
Ema
ngw
eni
Ema
qele
ni
Ema
zimb
eni
Eqel
eni
Ezib
omvi
ni
Mag
ang
ang
ozi
Mhl
wazi
ni
Ndu
nwa
na
Ngo
ba Nsu
ka
Okh
omb
e
Stul
wan
e
Tha
mel
a
Thu
nzini
Vim
buk
halo
Average of Maize-trial (2016)4,47 1,22 2,16 2,45 4,80 5,02 0,16 2,11 3,15 1,64 1,49 1,94 2,49 2,18 4,28 2,73
Average of Maize- Control (2016)5,12 5,172,52 1,83 2,090,34
Average of Beans (2016)0,16 0,74 1,37 1,50 1,13 0,96 1,02 1,12 0,70 0,55 1,13 0,97 0,41 1,21 1,30 0,51
Average of Late Beans (2016)0,820,43 0,07 1,76
Average of Cowpeas (2016)1,12 0,230,170,20
Average of Sunflower(2016)0,90 0,191,37
Average of Millet (2016)0,05
0,00
1,00
2,00
3,00
4,00
5,00
6,00
Yield averages across all villages in Bgvl 2016-2017
Figure 12: Yield averages across all villages in Bergville:2016-2017

41
-The average maize yield for all villages in the trials(2,8t/ha) was marginally lower than
for the maize control plots (2,82t/ha)
-The highest yield for the maize trials was 11,74t/ha -for Nombono Dladla in Ezibomvini
and the highest control maize yield was 9,69t/ha for Phumelele Hlongwane in
Ezibomvini -this was a CA control plot.
-For beans, the average yield for early season beans was 0,91t/ha and for late season
beans was slightly lower at 0,76t/ha.
-For cowpeas the average yield was 0,52t/ha and the range of yields fell between 0,05t/h
to 2,8t/ha.
-For sunflowers, the average yield was 0,97t/ha (0,05-2,95t/ha)
Maize yields in intercropped plot tend to be slightly higher than in single block plantings, with
and LER of 1,1-1,5 depending on the farmer. This is not generally factored in as most farmers
tend to combine their maize harvests, so it is not possible to differentiate yields from the
different plots of Maize and beans and maize and cowpeas for example.
This season, as with previous seasons, the range of yields was incredibly variable - on average
from about 0,28t/ha to 11,74 t/ha for the maize trials as an example. More participants fell
within the lower range of yields which brought the average down to 2,8t/ha.
If one compares the yields across the 4 seasons where the GrainSA SFIP has been active a
clearer trend becomes apparent.
For maize for example (see figure 13 below), there was a systematic increase in yields from
2013-2014 – both good rainy seasons. For 2015 there is a dip in yields due to the drought and
then the yields increased again this year. For the first two years there was a definite increase in
production of the CA Maize over the control maize. In the drought year, the control maize grew
better and in this last season the yields are comparable.
For this year the
comparable yields are
probably due to the fact
that quite a number of
the longer term
participants are now
planting their control
plots under CA as well.
3,09 3,00 2,74
3,76 4,25
3,18 2,87
2,03
0,00
1,00
2,00
3,00
4,00
5,00
t/ja
Trials and controls
Maize yields 2013-2016 for trial and
control plots
Average of Maize-trial (2016)Average of Maize- Control (2016)
Average of Maize-trial (2015)Average of Maize- Control (2015)
Average of Maize-trial (2014)Average of Maize- Control (2014)
Average of Maize trial(2013)Average of Maize-Control (2013)
Figure 13:Miaze yields for control and CA trial plots; 2013-2016
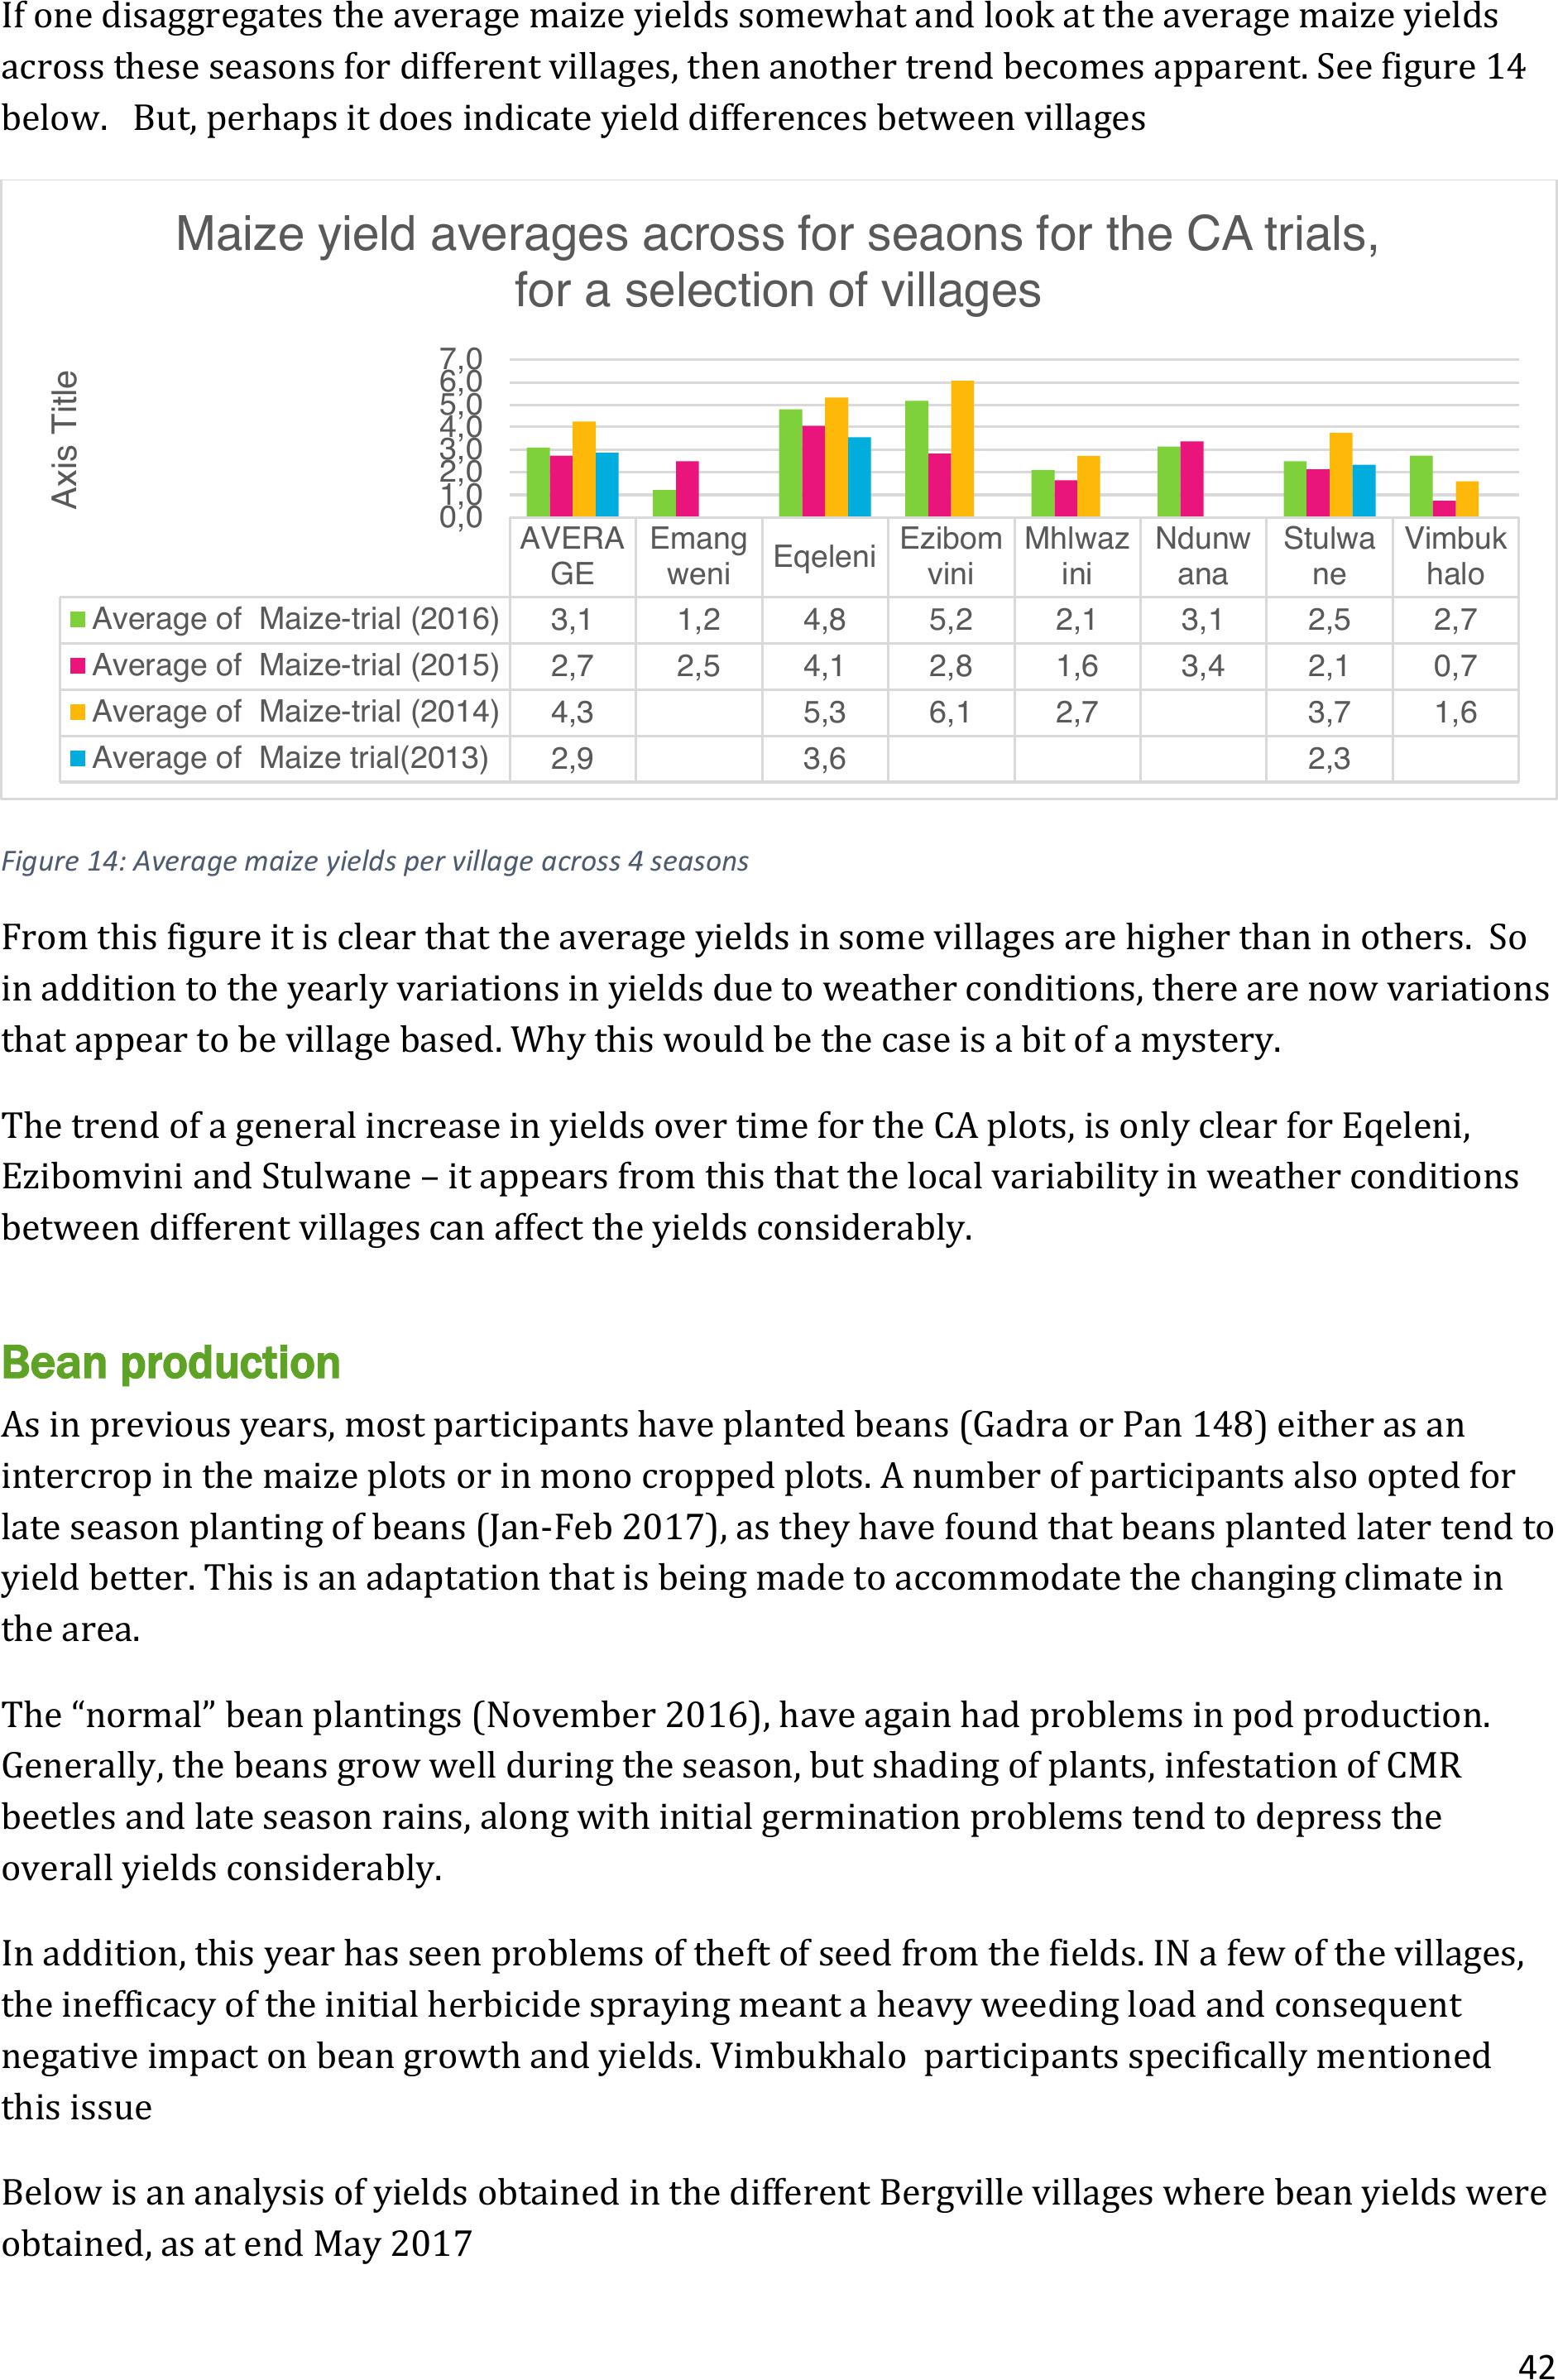
42
If one disaggregates the average maize yields somewhat and look at the average maize yields
across these seasons for different villages, then another trend becomes apparent. See figure 14
below. But, perhaps it does indicate yield differences between villages
Figure 14: Average maize yields per village across 4 seasons
From this figure it is clear that the average yields in some villages are higher than in others. So
in addition to the yearly variations in yields due to weather conditions, there are now variations
that appear to be village based. Why this would be the case is a bit of a mystery.
The trend of a general increase in yields over time for the CA plots, is only clear for Eqeleni,
Ezibomvini and Stulwane – it appears from this that the local variability in weather conditions
between different villages can affect the yields considerably.
Bean production
As in previous years, most participants have planted beans (Gadra or Pan 148) either as an
intercrop in the maize plots or in mono cropped plots. A number of participants also opted for
late season planting of beans (Jan-Feb 2017), as they have found that beans planted later tend to
yield better. This is an adaptation that is being made to accommodate the changing climate in
the area.
The “normal” bean plantings (November 2016), have again had problems in pod production.
Generally, the beans grow well during the season, but shading of plants, infestation of CMR
beetles and late season rains, along with initial germination problems tend to depress the
overall yields considerably.
In addition, this year has seen problems of theft of seed from the fields. IN a few of the villages,
the inefficacy of the initial herbicide spraying meant a heavy weeding load and consequent
negative impact on bean growth and yields. Vimbukhalo participants specifically mentioned
this issue
Below is an analysis of yields obtained in the different Bergville villages where bean yields were
obtained, as at end May 2017
AVERA
GE Emang
weni Eqeleni Ezibom
vini Mhlwaz
ini Ndunw
ana Stulwa
ne Vimbuk
halo
Average of Maize-trial (2016)3,1 1,2 4,8 5,2 2,1 3,1 2,5 2,7
Average of Maize-trial (2015)2,7 2,5 4,1 2,8 1,6 3,4 2,1 0,7
Average of Maize-trial (2014)4,35,3 6,1 2,73,7 1,6
Average of Maize trial(2013)2,9 3,62,3
0,0
1,0
2,0
3,0
4,0
5,0
6,0
7,0
Axis Title
Maize yield averages across for seaons for the CA trials,
for a selection of villages

43
TABLE14:TOTAL YIELD OF DRY BEANS HARVESTED PER VILLAGEBERGVILLE ‘17
Village
Number of pp
weighed
Total beans
(kg)
Ave per
participant
(kg)
Yield (t/ha)*
Stulwane
14
160.4
11,5
0,46
Ezibomvini
17
196.74
11,6
0,46
Thunzini
09
127.19
14,1
0,56
Thamela
11
60
5,5
1,4
Emazimbeni
07
17.77
2,53
0,54
Emangweni-
Emaqeleni
02
7.94
4
0,4
Nsuka- Zwelitsha
06
3
0,5
0,05
Ndunwana
15
127.31
8,5
0,85
Emabunzini
05
7.2
1,4
0,14
Eqeleni
13
320.35
24,6
1,1
Mhlwazini
11
119.95
10,9
1,1
Vimbukhalo
14
88.15
6,3
0,63
Ngoba
08
161.23
20,1
0,81
Okhombe
01
10
10
1,0
Emangweni-
Engodini
05
19.79
4
0,4
Total
138 participants
1427.02 kg
10,3kg
Ave~0,63t/ha
*Yields have been calculated, estimating the area of the plots for each participant under beans to be 25%
of the total trial planted.
From the above table, it can be seen that the average yield for dry beans (normal/early season
planting) was around 0,63tons/hectare. The highest yield was obtained in a new area -Thamela
at 1,4t/ha. Reasonable yields were also obtained in Eqeleni, Mhlwazini and Okhombe. Overall
the most beans were produced in Eqeleni, followed by Ezibomvini , Ngoba and Stulwane.
The actual yields can be seen to be extremely variable ranging from 0,05-1,4tons/hectare. This
is not unusual in a smallholder system and indicates that different management practices are
the main source of variability in yield.
The above table also shows that a total 1.43 tons dry beans were harvested in the Bergville area
in the 2016/2017 planting season. The Figure below provides a representation of the amount of
beans harvested in each village.

44
As with the maize yields, there is no clear explanation why yields in certain villages are much
lower or higher than in others. The same overall trend of higher production in Ezibomvini,
Eqeleni and Stulwane is apparent.
Following are some photographs indicative of the season.
stulwane
11%
Ezibomvini
14%
Thunzini
9%
Thamela
4%
Emazimbeni
1%
Emaqeleni
1%
Nsuka
0%
Ndunwana
9%
Emabunzini
1%
Eqeleni
23%
Mhlwazini
8%
Vimbukhalo
6%
Ngoba
11%
Okhombe
1%
Emangweni
1%
Early beans '17
Figure 15: Percentage bean yields per village
Mrs Thembelani Hlongwane from Ngoba busy with de-
podding her late bean harvest.
Mr Mtoleni Dlamini from Stulwane with
his bean harvest. He also planted the
traditional runner bean (yellowish seed)
and obtained a reasonable harvest.
Tozi Zikode from Eqeleni
with her late bean planting
yields. She considers this a
much better option for bean
production than panting
earlier in the season

45
Maize production
This year, despite the dry start has
been a good year for maize in the
Bergville area. Two hybrids were
used in the trials PAN6479 and
PAN53. Harvesting and weighing of
maize has been a huge task for both
the field staff and the farmers. Many
participants were involved also in
the GrainSA Farmer Develpment
Programme and planted 1ha of
maize, alongside their CA trials. For
the most part, participants do not
have the labour and logistical and
infrastructural requirements to handle these
volumes.
Some participants have constructed new and slightly
larger structures for maize storage. These
traditional structures are however not vermin or
damp proof.
Zodwa Zikode from Ezibomvinii planted beans in single crop blocks 9Left) as well as in the recommended intercropping
design. Growth for both plots looked similar and good midseason when these photographs were taken
Sibongile Mpulo from Vimbukhalo shows her
stored beans with bruchid damage. No control
mechanisms are known to participants
Smephi Hlatshwayo from Eqeleni surveys her mountain of harvested maize. She
has no dedicated structures for maize storage and does shelling by hand.
Neliwise Msele from Stuwlane constructed a new maize
storage structure for her harvest.

46
A number of participant farmers also planted
traditional maize and yellow (hybrid?) maize alongside
their white maize trials and controls??. This remains
one of the most central reasons why genetically
modified varieties are not promoted by the CA
facilitation team. Not so clear…
Cover crops
Cover crops are offered as an experimentation option for participants in their 2nd to 4th years of
involvement. Two to three variations are presently being tested:
Planting a mix of 3 summer cover crops (SCC’s) – millet, sunflower and sun hemp, in a plot as
part of a four block rotations trial (Here a number of participants opted to plant the sunflower
separately in part of the 10x10m plot and the millet and sun hemp together – to ensure a better
seeding rate for the sunflower. This is done in one 10mx10 block as a rotation for maize.
Planting lab-lab (Dolichos) beans in one of a four block crop rotation plot and
Relay cropping a mix of 5 covers crops; 2 SCC’s (sunflowers, sun hemp) and 3 winter cover
crops (WCC’s)- fodder rye, saia oats and fodder radish, into a stand of maize in towards the end
of the growing season (February-March).
For the most part, participants are not too keen to plant a crop that they cannot eat themselves,
no matter the benefit to the soil and potentially to livestock. A concerted effort was made by the
facilitation team to promote the planting of cover crops and thus a reasonable number of
participants participate: – 30 for SCC and 59 for wcc. See the tables below for more detail.
Mr Mthileni Buthelezi from Eqeleni has harvester 4-5 different kinds of maize
including yellow maize and a traditional red variety. On the right, he is busy
sorting his maize for shelling and storage.

47
For the late season cover crop planting- which was either scattered into maize plots or planted
in rows after harvesting of beans in intercropped plots, the germination was again not very
good. A lot of the seed, was eaten by free range poultry. Villages where wcc were planted
include Ezibomvini, Ngoba, Eqeleni, Stulwane and Ndunwana, For those where the seed did
germinate, growth was reasonably good until the cattle were let back into the fields. Presently
all has been consumed.
There also appears to be a
fine balance in terms of
timing of planting of the
wcc. It needs to be done
early enough to take
advantage of remaining
soil moisture- thus
somewhere in February,
but late enough that
actively growing maize
does not compete for soil
moisture. Of those who
planted, only 52% (20/38)
of participants’ cover
crops germinated and
grew.
TABLE15:SUMMARY OF PARTICIPANTS INVOLVED IN SCC TRIAL PLANTINGS
NO
Village
Name and surname
Cover Crops
Description
1
Eqeleni
Ntombakhe Zikode
2 plot SCC intercropped
with maize
2
Simephi Hlatshwayo
2 intercropped plots:
1 maize and sunflower, 1
millet and sun hemp
3
Ezibomvini
Phumelele Hlongwane
1plot SCC in rotation
1 plot lab-lab
Sunflower planted in
separate rows
intercropped with millet
and sun hemp
4
Cabangani Hlongwane
1 plot SCC
Sunflower planted in
separate rows
intercropped with millet
and sun hemp
5
Mtuleni Nkabinde
1plot SCC in rotation
1 plot lab-lab
Sunflower planted in
separate rows
intercropped with millet
and sun hemp
6
Velephi Zimba
1 plot SCC
Sunflower planted in
separate rows
intercropped with millet
and sun hemp
16
Balungile Mkhwanazi, Zodwa Zikode,
Kcinegile Zikode, Mantombi Mabizela,
Landiwe Dlamini, Nonhlanhla Zikode,
Tozi Zikode, Alfred Gumede, Ntombono
Dladla, Khanyisile Zikode
1 plot SCC
Sunflower planted in
separate rows
intercropped with millet
and sun hemp
17
Goba
Fikile Benghu
2 plots SCC
1 plot WCC
In rotation trial
1PHumelel Hlongwane’s. maize plot that had a relay planting of wcc. Livestock are browsing
(July 2017)

48
In relay cropping with
maize
18
Sebenzile Hlongwane
1 plot SCC
Crop rotation plot of
millet, sun hemp and
sunflower.
19
Thobile Mthembu
1 plot SCC
Crop rotation plot of
millet, sun hemp and
sunflower.
20
Stulwane
Mtholeni Dlamini
1 plot SCC
Crop rotation plot of
sunflowers
21
Dlezakhe Hlongwane
1 plot SCC
Crop rotation plot of
sunflowers
22
Khulekani Dladla
2 plots SCC
1 plot Sunflowers, 1 plot
maize intercropped with
millet and sun hemp
23
Cupile Buthelezi
2 plots SCC
Sun hemp, sunflower and
millet
24
Makethi Dladla
2 plots SCC
Sun hemp, sunflower and
millet
25
Bangeni Dlamini
2 plots SCC
Sun hemp, sunflower and
millet
26
Thulani Dlamini
2 plots SCC
Sun hemp, sunflower and
millet
27
Nokwaliwa Hlongwane
2 plots SCC
Sun hemp, sunflower and
millet
28
Xabanisile Mabaso
2 plots SCC
Sun hemp, sunflower and
millet
29
Phasazile Sithebe
2 plots SCC
Sun hemp, sunflower and
millet
30
Kethabahle Miya
1 plot SCC
Intercrop plot with
maize
Below is a summary of yields measured for sunflower. Very few yields were recorded
for sunn hemp and millet nad these were very low.
TABLE 16:SUMMARY OF YIELDS OF SCC–SUNFLOWER.
Area
Name and Surname
Weight
Yield (t/ha
Stulwane
Nelisiwe Msele
14,6kg/100m2
1,1
Nokwaliwa Hlongwane
7,4kg/100m2
0,55
Chupile Buthelezi
5,7kg/100m2
0,43
Dlezakhe Hlongwane
2,4kg/100m2
0,24
Khulekani Dladla
2,7kg/100m2
0,27
Thulani Dlamini
8,2kg/100m2
0,82
Eqeleni
Ntombakhe Zikode
6,7 kg/100m2
0,67
Simpehi Hlatshwayo
6,74kg/144m2
0,46
14,9kg/625m2
0,23
Ezibomvini
Zodwa Zikode
0,18
Phumelele Hlongwane
1,7

49
Mrs Simpehi Hlatshwayo a 4th year
participant from Eqeleni designed her own
trials; she planted sunflower on a control
plot (24mx12m) intercropped with maize
and another trial plot where it was
intercropped with beans (50mx25m) and
millet. Her sunflower that was intercropped
with beans developed very big heads, even
though there was poor germination because
seeds were burnt due to fertilizer mixed
with seedsduring planting.
TABLE 17:SUMMARY OF PARTICIPANTS INVOLVED IN WCC TRIAL PLANTINGS
Name & Surname
Ezibomvini
Status
Planting method
Phumelele Hlongwane
Planted and germinated very well but
eaten by cows
Broadcasted as a mix between maize rows
Cabangani Hlongwane
Planted and germinated very well but
eaten by cows
Planting method
Ntombenhle Hlongwane
Planted and germinated very well but
eaten by cows
Broadcasted as a mix between maize rows
Mantombi Mabizela
Planted and germinated very well but
eaten by cows
Broadcasted as a mix between maize rows
Mthumeni Nkabinde
Planted but seeds planted eaten by
chickens
Broadcasted as a mix between maize rows
Balungile Mkhwanazi
Broadcasted as a mix between maize rows
Gcinekile Zikode
Planted and germination very well but
eaten by cows
Broadcasted as a mix between maize rows
Nombono Dladla
Planted and germinated very well but
eat
Broadcasted as a mix between maize rows
Fikile Zikode
Planted but seeds planted eaten by
chickens
Broadcasted as a mix between maize rows
Tozi Zikode
Planted but seeds planted eaten by
chickens
Broadcasted as a mix between maize rows
Alfred Gumede
Planted and germinated very well and
eaten by cows
Broadcasted as a mix between maize rows
Velephi Zimba
Planted but eaten by chickens
Broadcasted as a mix between maize rows
Simpehi Hlathwayo from Eqeleni shows her sunlfower
harvest.
Neliswe Msele'S (Stulwane) sunflower harvest.

50
Zodwa Zikode
Planted and germinated very well but
eaten by cows
Broadcasted as a mix between maize rows
Name & Surname
Goba
Status
Planting method
Fikile Bhengu
Planted and germinated very well
but ate by cows
Broadcasted as a mix between maize rows
Thembelani Hlongwane
Planted and germinated very well
but ate by cows
Broadcasted as a mix between maize rows
Ntombenhle Hlongwane
Planted but poor germination due to
chicken’s damages ate seeds.
Broadcasted as a mix between maize rows
Sebenzile Hlongwane
Planted but poor germination due to
chicken’s damages ate seeds.
Broadcasted as a mix between maize rows
Mantombi Shabalala
Planted but poor germination due to
chicken’s damages ate seeds.
Broadcasted as a mix between maize rows
Thenjiwe Hlongwane
Planted and germinated very well
but ate by cows
Broadcasted as a mix between maize row
Vimbeni Ndaba
Planted and germinated very well
but ate by cows
Broadcasted as a mix between maize rows
Khangwayini Hlongwane
Planted and germinated very well
but ate by cows
Broadcasted as a mix between maize rows.
Name & Surname
Ndunwana
Status
Planting method
Elizabeth Hlatshwayo
Planted and germinated
Planted between maize as a mix
Noyi Mazibuko
Collected seeds but not planted
Matozo Zondo
Planted and germinated
Planted between maize as a mix
Shiyiwe Zondo
Planted and germinated very well
Planted between maize as a mix
Tholiwe Nkala
Planted and germinated
Planted between maize as rows(2 rows of a
mix between maize)
Boniwe Hlatshwayo
Planted but seed eaten by chickens
Planted between maize as a mix
Makhu Mdluli
Planted
Planted between maize as a mix
Zandile Khumalo
Collected seeds but not planted
Name & Surname Stulwane
Status
Planting method
1-14.
All participants received seed and
planted
Planted between maize as a mix. Germination
was not very good.
Name & Surname
Eqeleni
Status
Planting method
1-16.
All participants received seed and
planted
Planted between maize as a mix. Germination
was not very good.
Above left; Khulekani Dladla in front of his sunflower plot and Above right: His maize and millet &
sun hemp intercropped plot.

51
2
Zodwa Zikode from Eizbomvini standing in front of her scc plot. Sunflowers have been
intercropped (double rows) with millet and sun hemp mixtures.
A particpant in the Ngoba learning group standing in her lab-lab and
maize intercrop plot. Thiswas in May 2017, and the lab-lab has
started to pod.
A participant form Eqeleni who planted her scc mix
in a separate plot, She planted in rows nad mixed
the three varieties provided. Millet seeded well in
this case and sunflowers did not.

52
Farmer Centres
The concept of farmer centres was introduced to all participating groups with the main focus
being the villages in the 2nd to 4th year of programme participation. The general response from
the participating groups was that the procurement of production inputs has been widely limited
to the neighbouring towns of Bergville and Winterton and with this the challenge has always
been around transportation. Although the thinking behind the introduction of such centres is
positive, the greatest threat is that of security in the villages. With most of the programme’s
participants being women and heading households their greatest fear was that should this be
known to the local community they would be subject to robberies. Although this was the case
the villages of Ezibomvini and Mhlwazini were very much willing to give this a try. Mam
Phumelele Hlongwane and Mam Zodwa Zikode opted to run the Ezibomvini Farmer centre as a
pair with Mam Mathula Mdladla solely running the Mhlwazini Farmer Centre.
Ezibomvini Farmer Centre
This farmer centre has exceeded the expectations of the owners as initially they as pair
ventured into something completely new and were uncertain about how successful this new
business would be. However they were amazed by the response the people in the village had
and the way in which they supported the initiative. Production inputs such as seed, fertilizer
and herbicides are the main products available at the farmer centre. Villagers were particularly
drawn by the availability of these in quantities that are small enough and affordable. Seed and
fertilizer available at the farmers centre ranges from 1kg to an entire bag (25-50Kg). Where
members required a whole bag of fertilizer, they were encouraged to put in their orders and
payment beforehand. Villagers buying inputs from the farmers centre are also equipped with
knowledge and skill of how to optimally use these inputs using CA principles, with Mam
Phumelele Hlongwane, the community facilitator in the programme being at the forefront of
this. The customers of the centre range from programme participants who want to use the
inputs in control plots and own fields to general community members that are not part of the
programme who practice CA on their own.
Off season farmer centre operation
During the growing season the farmer centre is very active with sales taking place as often as
possible but this trend has been seen to decline during the off season months. This has led the
pair to start assessing other options because they now feel that it is important for the farmer
centre to be operational throughout the year. The local department of Agriculture Bergville also
works very closely with the farmers of the area and have steered a number of initiatives of
which the programme participants are a part of.
These include the Department’s no till programme which makes use of GMO seed as well as
sweet potato production in the area. The department has been responsible for the sourcing of
sweet potato vines and the provision of trainings regarding the planting and further processing
of the produce. With this the farmer centre owners found an opportunity to broaden the list of
inputs that are now available at the farmer centre now providing different culinary spices. This
was a of good example of creating opportunities from various ideas that are presented to them.

53
Apart from this the farmers
have also identified that there is
a need to include inputs
required in the winter season
such seed potatoes and
seedlings, venturing slightly
away from maize production
during the winter season,
however still speaking to maize
production the duo are looking
to source the preservative pill,
Quickphos and Blue Death to
protect stored grain from grain
moth and weevils.
Right: A view of the available
products at the Ezibomvini farmer Centre in July 2017
Farmer centre model
From the initial capital outlay that was provided by Mahlathini of R 2900.00; this being used to
purchase the initial set of inputs, the loan amount was paid back on the 14th of March 2017.
Cash on hand available is currently R 2 700.00. The sharing of profits made from the farmer
centre has not been tabled as the team still want to focus their energies on the growing of the
farmer centre and injecting any profits made into the further growing of the centre.
Markets
Products are sold to local farmers and other farmers not in the programme but from the area.
Clients are happy about the service they receive from the farmer’s centre. Positive feedback
received based on the quality of seed farmers centre offers. Beans seeds are in high demand. It
goes out of stock faster than anything else.
Management
The farmers centre is managed by two farmers (Zodwa Zikode and Phumelele Hlongwane) who
formed a solid partnership to manage their business. Apart from business partnership, these
farmers are neighbors and they are relatives. Zodwa is a treasurer, she takes care of finances
and she plays a major role in collecting money from people who owe. Phumelele Hlongwane
manages all other business operations such as selling inputs to farmers, weighing and pricing
inputs. She also plays a major role in giving advice to farmers on how to apply or use inputs.
Challenges
Resources are insufficient; they need a scale for weighing inputs to ensure an accurate and
equal amount of inputs sold to individuals. They need a money box to keep the money safe. They
also need a receipt and record book to keep records of their business. The record keeping
system of the farmers still needs an upgrade and a training on this is required.

54
Customers are not always expected to buy products with cash. The challenge is that people buy
on credit and don’t always pay back.
There are emerging competitors within the community who are selling the same products that
are sold in a farmer centre.
In the absence of Mahlathini Development Foundation field workers, transport to deliver bags
of inputs becomes a problem.
The two small tables below summarise the expenditure and income for the centre between
December 2016-April2017.
TABLE18:SUMMARY OF EXPENDITUREFOR EZIBOMVINI FARMERCENTRE FROM13/12/16TO
16/03/17
Date
Inputs bought
Payment by
centre
Potential
profit(@12.5%
Mark up)
13/12/16
2x50kg fert 2:3:2(22)zn
4x50kg UREA(46) GRAN
4x5kg seed drybean 148
3x1L Round up powermax
1x5kg seed PAN 66
R3000
06/01/17
4X50kg UREA(46) GRAN
R1003.20
17/01/17
2X50kg UREA(46) GRAN
R501.60
04/02/17
1X50kg UREA(46) GRAN
R267.50
16/03/17
1X50kg UREA(46) GRAN
R274.70
20/07/17
Cash on hand(R2700)
Total
R5047.00
R630.87
TABLE19:EZIBOMVINI FARMER CENTRE RECORD(SALES) FROM DEC2016 TO APRIL 2017
Date
Fertilizer
Herbicide
Top dresser
Seed
Total
December
2016
R2758
R1400
R480(LAN)
R630(UREA)
R1161(maize)
R80(beans)
R6509
January 2017
R0
R280
R1692(UREA)
R360(beans)
R72(maize)
R2404
February
2017
R24
R0
R336(UREA)
R80(beans)
R440
March 2017
R0
R0
R36(UREA)
R0
R36
April 2017
R0
R0
R0
R0
R0
Total
R9389.00

55
Below are some images of the record keeping sheets for the farmer centre.
Mhlwazini Farmer Centre
The Mhlwazini Farmer centre ran by Mam Mathula Mdladla did not get off the ground; the issue
was primarily around her commitment to other things and in a lack of awareness of how much
time the running of the farmer centre requires. Another issue was around the fact that a number
of people in the village are part of the Grain SA farmers support programme where inputs are
received in bulk. Marketing of the services provided was not on par, and the centre fell under.
Those interested in the services also required product prior to payment and this was not
possible with insufficient capital to stock up on larger orders beforehand. She received a start-
up grant from MDF to the amount of 2x50kg Map and 1x50kg LAN. She has not paid back this
amount.
Socio-economic situation of participant smallholder farmers
A yearly review is conducted with learning groups involved in the farmer experimentation
process. There are a number of objectives in the process including assessing the impact of the
CA implementation on the participants’ livelihoods, their level of understanding, learning and
implementation of CA practices and development of social and organisational capacity within
the groups.
The review consists of focus group discussions and individual interviews. The latter have now
been digitalised for ease of analysis of information.
Socio economic data
Of the 258 participants on the farmer experimentation listings, 35% are male and 65% are
female. There has been an increase in the number of male participants over the last four years.
The average household size in the area is 5 household members. Ages of participants range from
18 to >70 years. Around 60% of participants are between 36-55 years of age. Over time the
average age of participants has been decreasing, meaning more economically active and
younger people have become involved.

56
The main sources of income in the community are social grants (72%), employment (11%) and
farming (10%). See the figure below
This is the first year (in four years of involvement) that participants have started mentioning
farming as a source of income and supports participants’ responses that they are now selling
some of the surplus maize and beans they produce in the community.
Figure 16:Sources of income for CA participants in Bergville, 2017
Overall incomes per household are extremely low, with 75% of households earning between
R0-R2000/month. The remaining 25% earn >R3 000 /month. The average income is
R1875/hh/month – a reduction from last year where the average was around R2450/hh/month
Maize and beans have been used primarily for household food supply; 53% of participants now
have enough for 7-12months food provisioning. This proportion has increased from around
33% the last season. See the figure below
Figure 17: Months of food provisioning for CA participants, 2017
Around 10 VSLAs (village saving and loan associations) have been established across the 17
villages where CA is being implemented; so roughly 59%. Savings are for consumption
smoothing, household expenses and saving for inputs (28%). Overall savings is R100-R500 per
person per month.
Child
support
grant
55%
Pension
17%
Employment
11%
Remittances
7%
Farming
10%
SOURCES OF INCOME
1-3months
8%
4-6months
39%
7-9months
38%
10-12months
15%
HOUSEHOLD FOOD SUPPLY THROUGH CA

57
Notwithstanding the very low incomes participants save for inputs. Generally, these savings
amount to around 10-15% of their income. The two small figures below indicate the percentage
of savings group members who save for inputs and give an indication of the amount saved.
Figure 18: Money saved for buying inputs
Learning and implementation of CA practices
All participants in the farmer level trials start in their
first season by comparing different hand- held planters-
mostly use of hand hoes, compared to the MBLI
(Afritrac) hand planters. The jab planters and wheel
planters (Haraka planters) are not commonly used, but
are introduced for planting of cover crops. Animal
drawn planters are used by a small sub-group of
participants who have access to oxen. The small figure
alongside indicates the participants’ continued use of the implements after their initial learning.
The 69% of participants who use the MBLI planters said that it works better than hand hoes
because it saves time and effort. Some participants felt that they needed to check all the time
whether the seed and fertilizer had been deposited properly and thus did not feel they saved
time. In very high percentage clay soils, or very hard soils the MBLI planters also do not work
too well- thus the combined use of hand hoes and planters.
Regarding soil fertility, 78% of the respondents
shared that they are able to distinguish between
fertile and infertile soils. Criteria for assessing
fertile soil were the following; Increased yields
(53%), weed infestation (17%), increased organic
matter (12%), soil colour (12%) and improved crop
growth (6%). This indicates that a small percentage
of participants are starting to use characteristics
introduced and discussed in learning sessions-
such as organic matter alongside their traditional
assessment criteria
Savings
groups
(inputs)
Yes…
Savings
groups
(inputs)
No
72%
MEMBERS SAVING FOR INPUTS
R0-
R1000
78%
R1001-…
R2001- R
3000
11%
R 3001-over
11%
AMOUNT SAVED FOR INPUTS
Soil color;
12%
Increased
yield 53%
Weed
infestation
; 17%
Increased
organic
matter;
12%
Improved
crop
growth;
6%
Characteristics of fertile soil
Figure 20: Participants understanding of characteristics of
fertile soil
Figure 19: Use of planters by CA participants

58
Participants were asked what the most important
factors were for them to improve crop growth.
Their answers here indicated some of their learning
around inputs. For the most part, respondents have
not yet made the connection that CA practices in
themselves can improve soil quality and soil
fertility. See the figure alongside
In terms of labour requirements, respondents felt that land preparation and planting are easier
in CA then for conventional cropping. They were however divided in their responses regarding
weeding. A significant number feel that labour for weeding is increased, but in fact one may
have expected that more participants would feel that weeding pressure was increased. See the
two small figures below.
Focus group review discussions have been held in the following villages
TABLE20:VILLAGES WHERE FOCUS GROUPREVIEW SESSIONS WERE HELD;JULY-AUGUST 2017
Village
Tot. no. of pp in attendance
Tot. new members
Ezibomvini
17
03
Stulwane
09
01
Ndunwana
17
04
Ngoba
07
01
Thamela
13
03
Okhombe
09
0
Nsuka
08
0
Mhlwazini
13
0
Cornfields
13
0
Total
106
12
Series1;
Fertilizer;
14; 47%
Lime;
10%
Herbicide;
20%
Manure;;
13%
Urea/LAN
; 7% Pesticides
; 3%
Inputs to improve production
Figure 21: Participants’ perception of inputs required to
improve production
More;
33%
Same;
28%
Less;
39%
Weeding CA vs conventional
More ;
5% Same;
17%
Less;
78%
Preparation CA vs conventional
Figure 22: Labour requirements for land preparation and weeding in CA

59
A very brief summary of some of the trends in these discussions is provided below:
-Participants are aware that input costs are very high but did not know the actual costs of
inputs per hectare
-They are also still unsure of the actual size of their fields
-Most participants do some saving, but not many save specifically for inputs. Presently
there are 2 savings groups (Ezibomvini and Ndunwana) set up specifically for saving for
inputs. In the other groups a proportion of their savings would be used. Participants feel
that they cannot belong to two savings groups as the extra burden in saving would be
too much for them
-Participants are comfortable paying for the input subsidies and feel that the cheaper
inputs help them a lot.
-Participants still buy inputs according to habit and what they can afford, rather than
according to the actual inputs that may be required. So, they would buy 1 bag of
fertilizer (or half a bag) and one bag of seed, irrespective of their field size –
notwithstanding the fact that the facilitation team have been working with them on
these calculations
-Participants also still buy whatever seed and fertilizer is suggested to them at the shops,
rather than requesting the seed and fertilizer types promoted through the programme.
This is mostly an issue of confidence, as most participants are now aware of differences
-Many participants still keep traditional seed for re planting, along with buying some
seed from local shops such as Farmsave in Bergville
-Many participants shared that there is a considerable cost saving with conservation
agriculture practice because it negates the use of expensive tractors which charge R 15-
R 20 per metre for ploughing and the same amount for discing.
-In Mhlwazini participants shared that with the practice if conservation agriculture
principles, they no longer make use of tractors and oxen and they have seen the general
condition of their cattle improved ,because their cattle are now not subjected to
intensive labour ploughing and planting fields.
-Participants felt that this season was good, and are satisfied with the yields they have
obtained for maize and beans.
-The quality of bean seed harvested this year was not good in most cases, as late rains
meant seed had water damage. The wetter seed has led to high levels of weevil
infestation.
-The mixed brown cowpea planted grew well, but did not pod or seed well, or at all in
most cases. It appears that podding happens too late in the season, when cattle are
already allowed into the fields for grazing.
-Millet as a cover crop is not working too well as birds eat all the seed
-Sunflower seed has been harvested by most participants who planted these in their
cover crop mixes. Some have even sold some of that seed in their local communities.
-Yields obtained are primarily for household consumption and for the feeding of cattle,
goats and chickens but these normally feed on spoilt maize from the uhlaka storage
structures which the participants reported is very prone to rat invasion and they have
resorted to the keeping of cats for the control of this threat while other participants
reported that the only way to save one’s maize from being damaged is by decobbing,

60
storing the grain in drums and using the preservative pill to prevent weevils from
affecting their stored grain
-Storage is an issue, especially for the older participants who are now producing a lot
more grain than they can easily store in their small storage structures and their huts.
Some of the older participants are now warming to the idea of joint storage structures,
although they still have doubts about trusting others and feel that the transport to and
from these structures would be problematic for the,, So overall, people would still want
something at their own homesteads.
-Some participants reported the occasional sale of produce, mostly dry beans (R100/5l).
Maize is seldom sold unless somebody comes requesting a “ithini”-(R50/20L). The
participants indicated that this year few people in the village did not plant and there is a
lot of maize to go around in the village.
-The local mill at Emmaus is responsible for the milling of maize from Emazimbeni,
Vimbukhalo, Ezibomvini, Eqeleni, Thunzini and Stulwane villages among others. The
pressure on this mill has meant the mill had been broken down quite a number of times
already. Transportation is an issue for those who cannot walk to the mill, local vans
charge anything between R 20-R25 for transportation to the mill.
-The experimentation with cover crops has been to date limited to the villages of
Ezibomvini, Stulwane, Eqeleni, Ngoba and Ndunwana. Participants shared that their
understanding of the purpose of the cover crops was to maintain soil moisture and the
provision of nutrients to the soils. Some participants requested more information.
-For winter cover crop mix; black oats, radish and forage peas, participants shared that
seed sown was affected negatively by scratching chicken. Of those that had germination
in their plots radish and oats were seen to have grown well but they feel these were
planted late because by the time they were growing well, the cattle were released into
the fields.
-There is a large concern with cattle damaging crops and neither the owners, nor the
traditional authority try very hard to keep cattle out of fields. This means that someone
always needs to stay at home to chase cattle when they come. Participants feel that
fencing their fields would be the best option, but feel that they cannot afford this
expense. They also felt that perhaps the department of Agriculture could assist the
community with secure grazing.

61
Learning workshops
This season learning workshops were conducted in some of the newer villages (Ndunwana,
Emabunzini and Thamela). It became apparent
to the facilitation team, during the course of the
growing season when monitoring was
conducted, that the introductory workshops
and then the joint spraying and planting
processes were not enough to help participants
to fully understand and appreciate what CA is
and how the process works.
The workshop agenda is shown in the text box
alongside.
Workshops were well received, but due to time
pressure in harvesting, these sessions could not
be conducted in all the areas.
Implementation per area
Ezibomvini
This season 9 participants from the Ezibmovini learning group separated their yields per plot.
This has allowed a comparison between different treatments for these participants.
Table ?below gives an indication of yields for mono cropped and intercropped maize plots, as
well as bean plantings and some summer cover crop yields
LEARNING WORKSHOP AGENDA
Healthy soils -Characteristics of a healthy soil
Soil texture- Characteristics of a soil texture types, methods of
identifying soil texture- sausage method
Soil structure-Soil profile, different soil structure types, soil erosion
and its effects
Soil sampling and significance- Essential plant nutrients and their
functions (tell -tale signs of deficiency)
Principles of conservation agriculture- Planting systems (inter
cropping, crop rotations), crop diversification, cover crops and their
significance, disease and pest life cycles
Good practice -Integrated weed management
Chemical use- Precautionary measures, protective clothing
Different chemicals and how they work
Seed types -Traditional, open pollinated, hybrid seed, genetically
modified seed. Important pointers to consider when using GMO
Phumzile Ncgobo works with participants in Ndunwana on the soil
type test - making soil sausages
Workshop participants in Emabunzini in discussion with their
facilitator Phumzile Ngcobo

62
TABLE21:PLOTYIELDS PER CROPFOR 9 PARTICIPANTS FROMEZIBOMVINI;2016-2017SEASON.
Note: C=Control, Sf=Sunflower, LL=Lab-Lab, S=sunnhemp, .E=Early, L=Late
From the above table the following comments can be made:
MAIZE: Maize was planted either as an intercrop with beans or cowpeas or as a single crop.
-Overall, the maize yields have been extremely good this season; ranging from 3,6-15,3
tons/ha in the trial plots, and 3,8-9,7tons/ha in the control plots.
-CA trial yields have been significantly higher than the conventionally tilled control plots
(Zodwa Zikode).
-Maize yields in the maize and bean intercropped plots have been higher than in the
maize and cowpea intercropped plots as well as the maize single crop plots, for all
participants where these were measured.
BEANS: Early beans were planted in November, along with the maize. Participants also
requested to do a late season planting, expressing their feeling that late season beans produce
better. This is due to late season rains that damage the early season harvest.
-Bean yields have generally been quite low – with the notable exceptions of Cabangani
and Phumelele Hlongwane. This indicates that the yield potential for beans was good
this season and that they have not been realised due to management practices and
potentially soil acidity issues for most of the participants.
-Single block plantings of beans have not yielded better than intercropped plots- despite
the strong ‘belief’ in the area that this is the case.
-Additionally, the late season plantings have not yielded better than the early season
plantings as participants had hoped.
Name
Surname
year
join
ed
trial
size
trial
descriptio
n
Yields (tons/ha)
Maize
SCC
Beans
C
M+B
M+
C
M
Sf
LL
S
E
L
N ZIkode
2016
400
2(m+b)
2(m+c)
6,10
6,02
0,98
Zodwa
Zikode
2014
1000
4 (m+b) , 4
(m), 1 (B), 1
scc plot
3,83
10,46
7,17
6,1
0,18
0,69
0,93
Landiwe
Dlamini
2015
400
4(m+b)
8,75
0,29
0,46
Cabangani
Hlongwane
2015
800
1(m+b)1(m+
c)1(m)1(b)
10,4
4,33
5,94
2,66
0,15
Mantombi
Mabizela
2016
400
3 ( M+B), 1(
M+C)
3,65
3,2
0,47
Balungile
Mkhwanazi
2016
400
4(M+B)
6,94
0,30
Phumelele
Hlongwane
2014
1000
3 m+b), 1
(m+c), 4( m),
1( Lab Lab),
1 Scc
9,69
11,99
9,79
9,0
1,72
0,02
0,01
2,27
0,92
Nombono
Dladla
2016
400
3(m+b),
1(m+C)
15,34
12,7
0,75
0,39
Khanyisile
Zikode
2016
400
2 (m+b),
2(m+c)
4,53
4,10
0,58
0,15
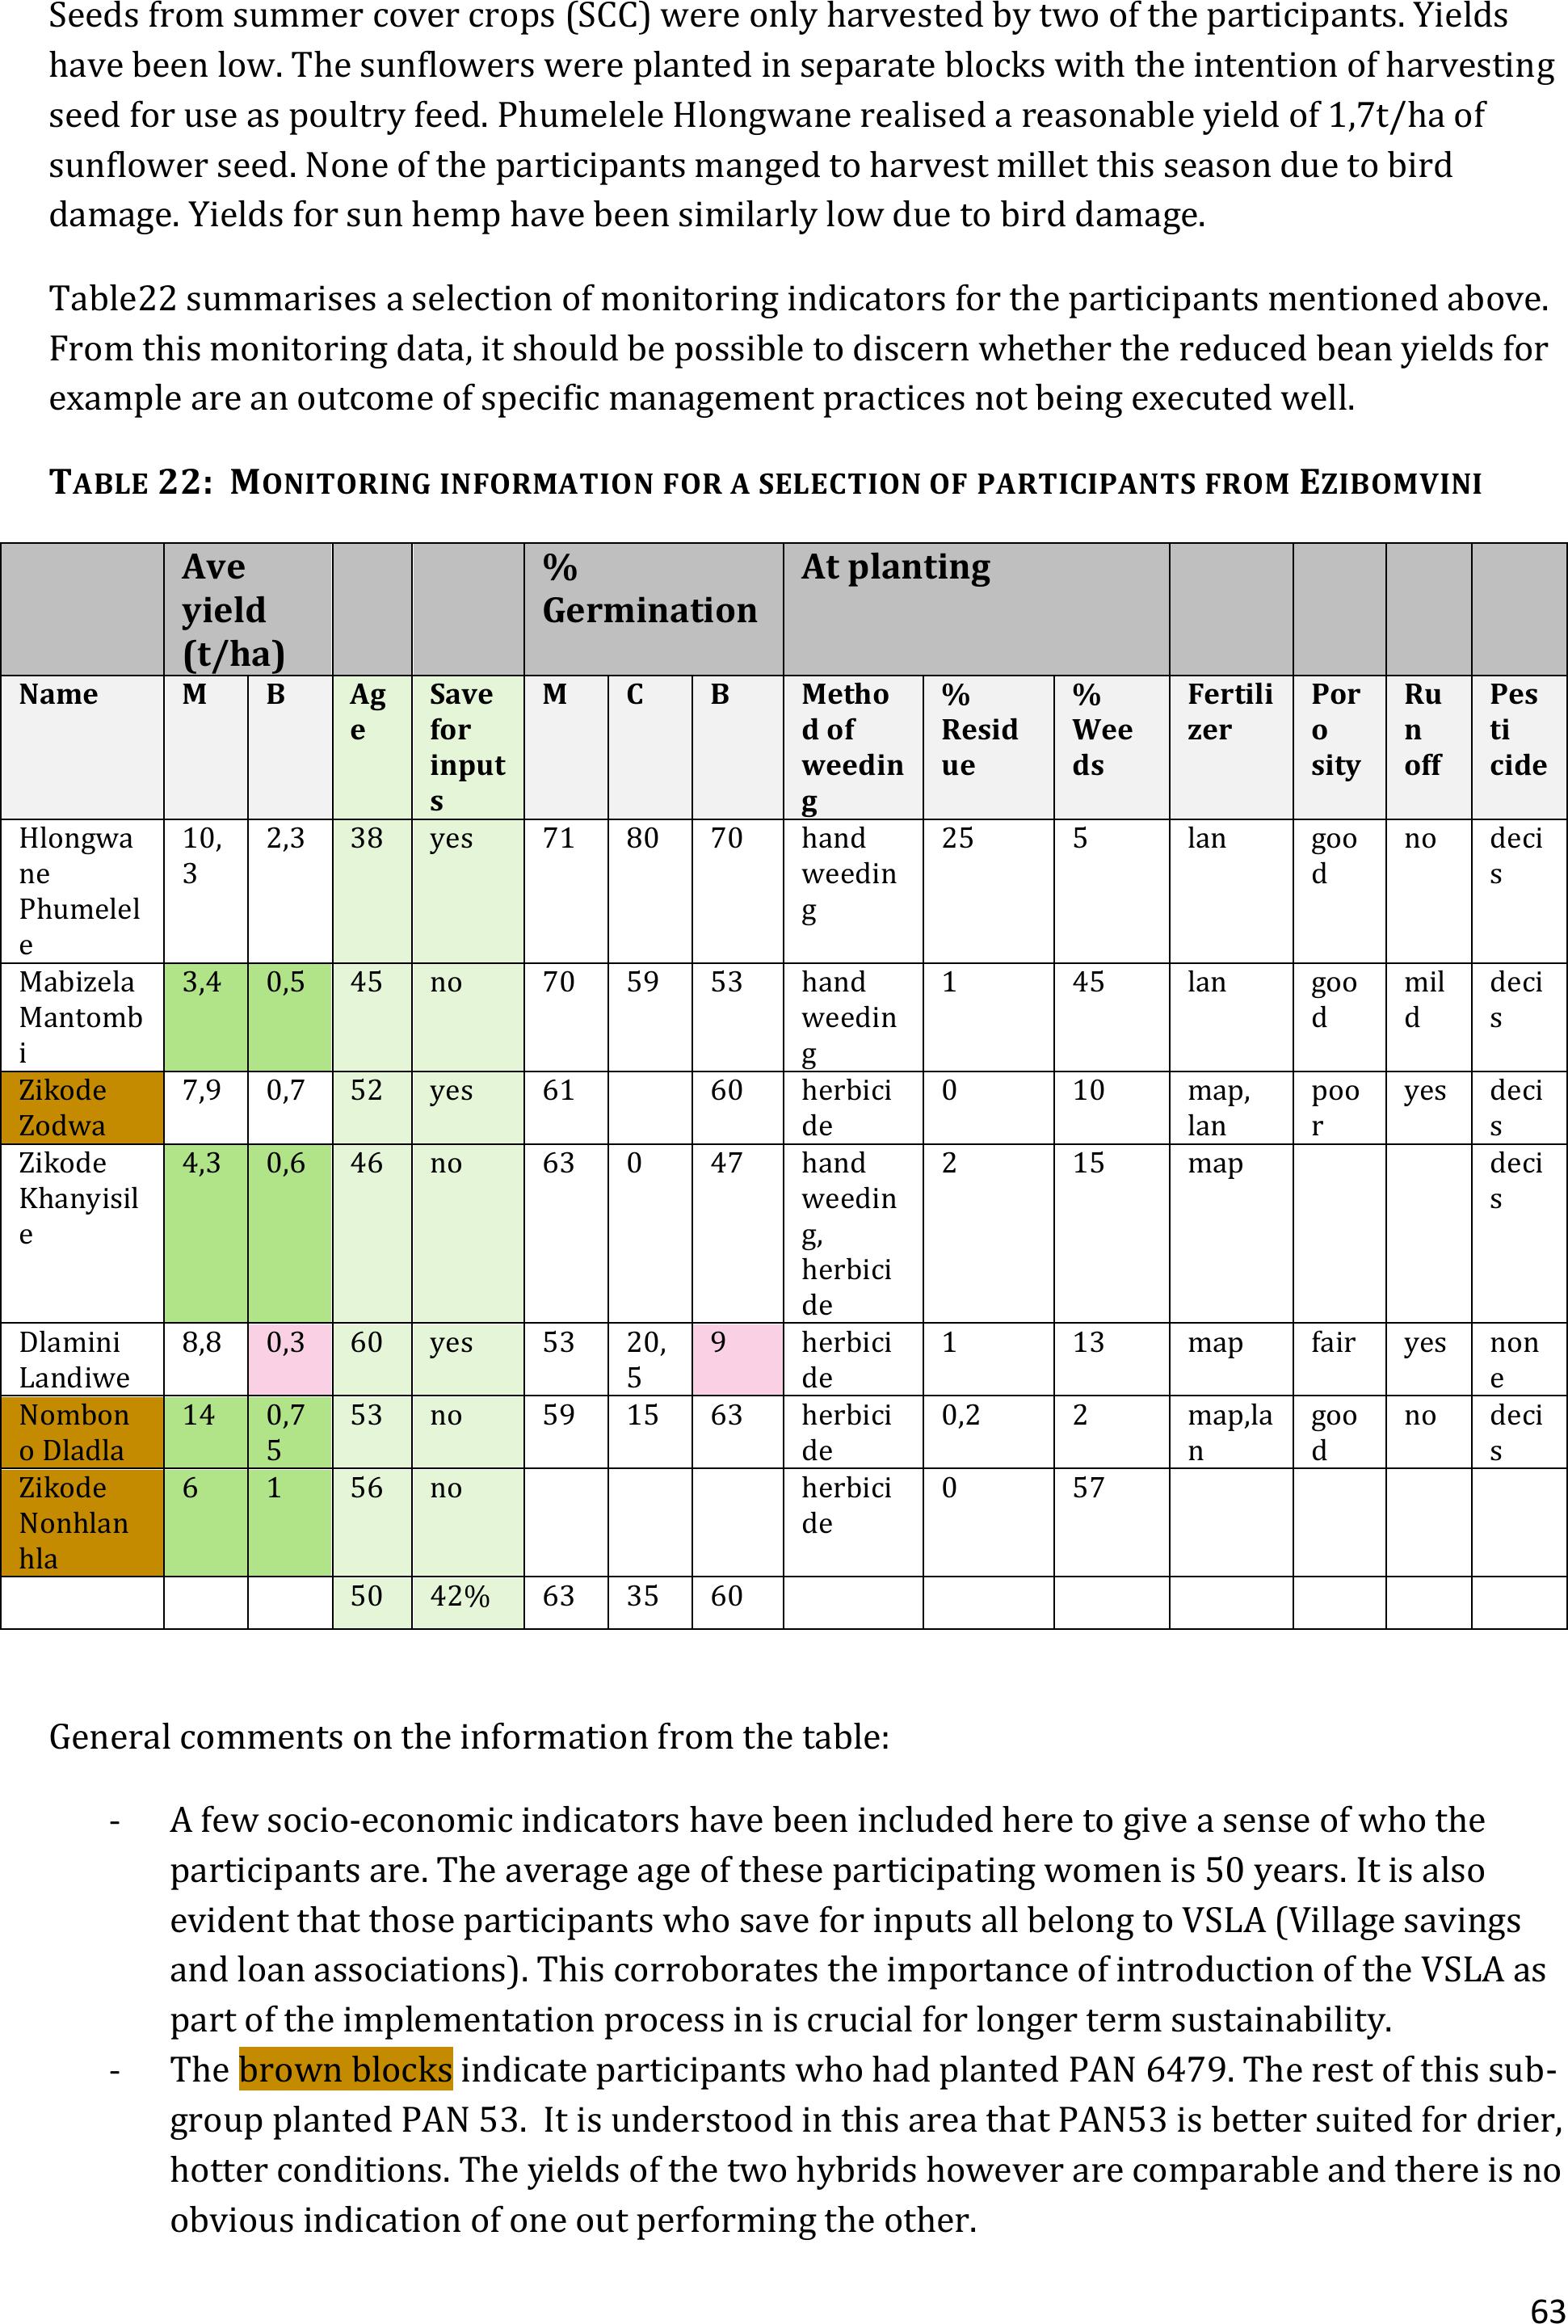
63
Seeds from summer cover crops (SCC) were only harvested by two of the participants. Yields
have been low. The sunflowers were planted in separate blocks with the intention of harvesting
seed for use as poultry feed. Phumelele Hlongwane realised a reasonable yield of 1,7t/ha of
sunflower seed. None of the participants manged to harvest millet this season due to bird
damage. Yields for sun hemp have been similarly low due to bird damage.
Table22 summarises a selection of monitoring indicators for the participants mentioned above.
From this monitoring data, it should be possible to discern whether the reduced bean yields for
example are an outcome of specific management practices not being executed well.
TABLE22:MONITORING INFORMATION FORA SELECTION OFPARTICIPANTS FROMEZIBOMVINI
Ave
yield
(t/ha)
%
Germination
At planting
Name
M
B
Ag
e
Save
for
input
s
M
C
B
Metho
d of
weedin
g
%
Resid
ue
%
Wee
ds
Fertili
zer
Por
o
sity
Ru
n
off
Pes
ti
cide
Hlongwa
ne
Phumelel
e
10,
3
2,3
38
yes
71
80
70
hand
weedin
g
25
5
lan
goo
d
no
deci
s
Mabizela
Mantomb
i
3,4
0,5
45
no
70
59
53
hand
weedin
g
1
45
lan
goo
d
mil
d
deci
s
Zikode
Zodwa
7,9
0,7
52
yes
61
60
herbici
de
0
10
map,
lan
poo
r
yes
deci
s
Zikode
Khanyisil
e
4,3
0,6
46
no
63
0
47
hand
weedin
g,
herbici
de
2
15
map
deci
s
Dlamini
Landiwe
8,8
0,3
60
yes
53
20,
5
9
herbici
de
1
13
map
fair
yes
non
e
Nombon
o Dladla
14
0,7
5
53
no
59
15
63
herbici
de
0,2
2
map,la
n
goo
d
no
deci
s
Zikode
Nonhlan
hla
6
1
56
no
herbici
de
0
57
50
42%
63
35
60
General comments on the information from the table:
-A few socio-economic indicators have been included here to give a sense of who the
participants are. The average age of these participating women is 50 years. It is also
evident that those participants who save for inputs all belong to VSLA (Village savings
and loan associations). This corroborates the importance of introduction of the VSLA as
part of the implementation process in is crucial for longer term sustainability.
-The brown blocks indicate participants who had planted PAN 6479. The rest of this sub-
group planted PAN 53. It is understood in this area that PAN53 is better suited for drier,
hotter conditions. The yields of the two hybrids however are comparable and there is no
obvious indication of one out performing the other.

64
-This season, due to dry conditions early in the season, necessitated the use of
Gramoxone, rather than Round-up as the herbicide of choice. Generally the use of the
herbicide was effective for this group.
-For most of the participants the percentage residue cover at planting is still extremely
low. The only exception to this is Phumelele Hlongwane- who has a fenced plot and is in
her 4thyear of implementation.
-There is little correlation between percentage of weeds present at planting (after
spraying) and bean yields, as may have been expected.
-Percentage germination for maize averaged 63%, for cowpeas -35% and for beans- 60%.
These germination percentages are not very good, but are indicative of the extended dry
conditions at the beginning of the season. The depressed bean germination percentages
however cannot be directly correlated to the low bean yields, except perhaps in the case
of Landiwe Dlamini who only saw 9% germination and a consequent yield of 0,3t/ha.
-There is no trend showing yields increasing proportional to length of participation. The
four participants whose yields are blocked out in green, started implementation this
year. On average their yields are comparable to the participants who have been involved
for longer periods.
-Comments for individual participants:
-Phumelele Hlongwane realised exceptional yields for both maize and beans. She is in her
fourth year of experimentation and opted this year for a reduced amount of external
inputs. She did not spray herbicide (Gramoxone) but did hand weeding -citing that the
use of herbicides to date has reduced her weed load enough to make hand weeding
manageable. She also did not apply any basal fertilizer (MAP), but only did top dressing.
This indicates that her soil fertility and soil health status is definitely a lot better than
that of most of the other participants.
-Nombono Dladla is a new participant, who started this season. She has realised
exceptional maize yields. This is mainly due to her use of a highly fertile plot just below
her homestead, where there used to be a kraal.

65
Nombono Dladla, a new particpant in Ezibomvini
standing in her plot of late planted beans.
Khanyisilei Zikode in Ezibomvinii standing in her
late bean planting plot. She has not kept abreast
of weeding and subsequently realised a low
yield.
Phumelele Hlongwane indicates her
sunflower yields
Phumelele also planted a 10sqm plot of soya
beans and harvested 21,22kg -

66
Emabunzini
This is a new area, an expansion from the Ngoba group. The group consists of 9 participants
who planted the 1st year trial design of 400m2 maize and bean and maize and cowpea
intercropped plots.
Some specific challenges in this area include:
Threat of stray livestock
Over commitment of participants
General poor maintenance of the trials
Livestock were not sent to grazing areas this
season, due to lack of grazing and thus
participants who planted in unfenced plots
spent much of the season trying to stop
livestock from invading their fields. The
initial herbicide spraying did not work
particularly well and thus high weed
pressure results. Some participants did not
weed on time. They mentioned that they
were unaware of the amount of effort
required in maintenance of the CA plots and did not allocate the time.
Ndunwana
This area is in it’s 2nd year of CA trial implementation. The
group consist of 19 members, 5 of whom joined this season.
The group opted to plant the 1st year trial design layout of
400m2 maize and bean and maize and cowpea intercropped
plots. 13 of the14 2nd year participants paid their subsidy
amounts for inputs.
They also planted the late season relay crop of cover crops
into their drying maize plots – after harvesting beans. A mix
of 5 cc’s was used.
For this group, the following yields were obtained
Crop
Yield range
(t/ha)
Average
(t/ha
Beans trial
0,2-1,43
0,7
Maize trial
0,4-7,5
3,2
Maize control
0,3-4,8
1,9
Nomqibelo Hlathwayo's bean harvest being
weighed.
Thenjiwe Hlowane's plot of maize and cowpeas intercropped. Here
the poor maintenance and livestock damage have led to now yields
being recorded.

67
Through the local facilitator, Mrs Boniwe Hlatshwayo, a number of participants collected the
seed. However chickens feeding on the broadcasted seed were a major problem. Four
participants had signs of germination their fields (Nomgqibelo Hlatshwayo, Tholiwe Nkala,
Shiyiwe Mazibuko and Matozo Zondo)
Generally the group is happy about how the season has gone and feel pleased with the yields
obtained for their maize crops. Beans
however did not yield well because of
late rains.
The group had a challenge with weeding,
feeling that the herbicide was inefficient.
As with most groups this year,
Gramoxone was used instead of round
Up, given that there was not much weed
growth yet at planting- as the area was
still dry. This meant that weeds re-
emerged quickly.
Solutions offered were decreasing the
trial plot sizes and workign with
integrated weed management principles.
These include early weeding as a very
important strategy and the late weeding again to ensure that weeds do not set seed. Soil cover
and canpoly cover are critical components of the process.
Tholiwe Nkala shows his wcc planting. he opted to make furrows adn
plant in rows.
Oats, radish and sun hemp visible in the rows planted by Tholiwe
Nkala in Ndunwana
Germination and growth of the wcc mix relay
cropped into maize on Shiyiwe Mazibukko's plot in
Ndunwana. radishes and oats are clearly visible.

68
Stakeholder engagement
In the Bergville area a lot more specific attention has been given to engagement of stakeholders
in the past few months.
This has happened at a number of levels:
-Co-funding and implementation: Working with the KZN LandCare programme. Funding
has been received through this programme for procurement of tools and limited inputs
for the 2017-2018 season. Awareness raising events are to be conducted jointly in2
areas of cooperation; Bergville and Ixopo.
-Links have been made with other NGOs operating in the area; namely Lima RDF and
Pilakahle. In this context introductory team meetings were held to outline the
organisations’ respective programmes. Subsequent introductions were made with
community level learning groups. In Ezibomvini for example the 19 learning group
members have embarked on a training programme with Pilakahle in asset based
community development and business management training – the group is also
interested in the revolving loan fund operated by Lima, where much larger loans can be
procured than in their VSLAs.
For the latter it has been agreed that close cooperation between MDF and Lima would be
required to ensure that this revolving credit does not impact on the functionality of the VSLAs.
Explorations with government and Local Municipality officials to set up a stakeholder forum in
the area around maize production which can pull together all role players. Potential
stakeholders here include the DRDLR, DARD, Okahlamba LED section, DSD, COGTA, Dept of
Health , local agribusiness, grains farmer support programme, NGOs and farmers. See
attachment 1: Multi stakeholder Forum, for an outline of the proposed forum that has been sent
around to prospective stakeholder participants.
Communication with the Okahlamba LED manager regarding collaboration. Here discussions
revolved around Mahlathini’s involvement in one of the LED strategic initiatives funded through
the DRDLR – regarding the development of Agriparks and secondary cooperatives.
Farmers days have been held in Ezibomvini and Ndunwana. These have bene large public
events showcasing the Ca work in these communities and have included many different
stakeholders and role players including DARD extension services, Cedara specialist from their
Soil Sciences section and the Economics section, LandCare representatives and participants
from universities (UKZN, Fort Hare) and NGOs (lima, Pilakahle and FSG). An outline of the
programme for the Ezibomvini farmers day is presented in Attachment 3.
The farmer’s day attracted a lot of attention from stakeholders this year, as in previous years.
The general process was one of presentations being given by various stakeholders and then
small group “walk abouts” to a number of stations including:
-CA trial fields;- Phumlele Holngwane; showcasing intercropping cover crops, crop
rotation, water runoff plots, and soyabenas

69
-A power point presentation on principles nad progress
-A demonstration station run by DARD on LadnCare and
-A beautiful 1st year trial- Nombono Dladla
DVDs have been produced for implementation of CA in smallholder farming systems both as
awareness raising materials for grains and for a television programme
Ezimbovini farmers' day. left: The FarmSave representative helping in distributing prizes for the CA quiz conducted and Right;
Participants of the day listening to a presentation
Above left and middle: the Landcare demonstration site with posters for promotion of CA and a mulching demonstration. Above
right, participants looking at a trial site

70
The promotional DVD has been produced in both English and
isiZulu and has been used extensively in further farmers days
and awareness raising events. It has been very well received
by farmers, given that they know some of the people being
interviewed in the DVD and has done a lot to raise the profile
of CA.
Exploratory meetings have been held with the Dept of
Environmental Affairs to discuss their pilot programmes for
Climate Smart Agriculture and the GrainSA’s CA SFIP
involvement in this process as well as for consideration of
incentive schemes based on payment for ecosystem services.
Building of Social platforms
This process is integral to the entire innovation development process and is built on voluntary
association in learning groups as the first building block at community level. These groups then
undertake a number of activities that build social capital and cohesion including;
Joint working groups; where smaller groups of people undertake to do their farming activities
together to save time and use their combined labour more efficiently
Bulk buying groups; where groups of individuals club together to buy inputs from the farming
activities
Joint learning and review sessions; where groups come together to discuss progress and
observations and plan next steps together
VSLA’s (village savings and loan associations); where individuals set up groups who save
together and take out loans within the group to help them with consumption smoothing,
productive activities and small enterprise development
Selection of Local facilitators; who assist the groups in monitoring and provision of advice as
well as linkages with the programme and other stakeholders and
Development of local farmer centres; designed and run by the learning groups to provide local
input support, as well as management of group owned tools and provision of advice to learning
group members and potential new participants.
In this way a local community of practice is built up around implementation of Conservation
Agriculture that is community based and pays attention to the entire value chain for grain crop
production.
Busy setting up for an interview in Stulwane

71
This year has also seen the introduction of a Social Compact Agreement, wherein the learning
group and Mahlathini undertake an agreement that outlines their roles and responsibilities in
this process. This has become important as the groups mature and start to attract attention
from other stakeholders and relationships need to be managed in a way that is collaborative
and inclusive. See Attachment 4 for an example of the social compact agreement. This
agreement builds on the individual contracts that are signed with each farmer participant when
they join the programme.
General comments and suggestions on the experimentation
-The system being promoted is already a low external input system where pre-planting
spraying of herbicide is promoted, with the use of hand and mechanical weeding options
during the growing season. This strategy is causing some difficulties for participants,
especially now that the onset of rains has been later and the spring and early summer
seasons have mostly been dried than before. This trend has now been experienced for
three consecutive years.
-It means that the fields are still ‘bare’ when spraying should happen (2 weeks prior to
planting) as little to no rain has meant that weeds are still dormant.
-With the planting of scc’s(summer cover crops) growth has been good this season. Very
few participants harvested seed, partly due to seeding being problematic for some of the
cover crops- such as sun hemp and millet (bird damage). The hope that participants
would be able to produce enough seed to continue planting their own cover crops is not
being realised. Those that have harvested sunflower seed are intending to use the seed
as poultry feed.
-In addition, the planting of winter cover crops is still a high-risk activity, given the
potential for soil moisture competition in this relay cropping design, the difficulty of
seeding the cover crops and the high likelihood of consumption of theseed by poultry
and other birds.
-This means that in the foreseeable future the production of cover crops will need to be
an externally supported and funded process. farmers are not producing enough seed
themselves nad are unlikely to buy it, but are starting to appreciate the benefits of the
cover crops. Further experimentation with the relay cropping of the winter cover crops
is important. At the moment cover crops are not produced at a scale that is very useful
for winter fodder production for livestock and experimentation with larger plantings of
cover crops in certain situations could be a significant factor in bringing livestock
owners on board. Only around 30% of the participants also own livestock and some of
the larger livestock owners are not as yet a part of the CA experimentation process. It is
generally the men that own the livestock and the women who grow the maize.
-Bean production is still encountering many challenges; low germination, good growth
but poor podding, reduction of harvests due to late season pest (CMR beetles) and rain.
An added issue is that this season a number of participants have storage pests- bruchids
and do not have specific processes to deal with this. ….
This season a number of participants opted to try out late season bean plantings,
believing that yields would be much higher for these plantings. As the climatic
conditions have been shifting, participants have had some success with late season

72
plantings. This season however these improved yields did not materialise, partly due to
inadequate rain and soil moisture. Late season bean plantings will need to be timed
quite accurately- potentially no later than the first week of February.
-Maize production this year provided bumper crops for a number of participants, as they
had also expanded their production areas, partly by being involved in more than one
maize production support process. They do not have the logistical or infrastructural
requirements to handle these increased volumes. Suggestions for moving into the future
include:
oSetting up a process for harvesting support, contracting small teams of labour to
assist, or working on a process for the joint activity groups in the villages to
support each other.
oA mobile shelling machine needs to be obtained- either bought or hired for the
harvesting season to make this part of the process more efficient.
oStorage options at homestead level need to be upgraded. This has been a need
for a few seasons now. Participants od not easily consider buying storage
containers and some kind of support process here is now urgently required.
-The lack of coherent grazing management systems in the villages is posing a direct
threat to the implementation of CA and to dryland cropping. The traditional authorities
are responsible for setting and enforcing rules around grazing management for each of
the villages. Generally, there is a system for summer grazing in the mountains where
livestock need to be taken to these grazing areas and are herded during this season. In
winter, the cattle are allowed back into the villages. Fines can be levelled at people who
do not follow these broad rules. However, in times of stress and drought the TA’s will
more often than not decide to keep the cattle in and around the villages as there is
generally more water and grazing available. This then makes the planting and
management of dryland crops almost untenable. Individual smallholders do not feel
they have the power to intervene in such processes or ask for change. In some of the
areas, the smallholders have suggested that outside facilitation of a planning and change
management process for grazing management is the only option that they can see that
will work. It may be an idea to embark on such a process in one or two of the villages to
negotiate systems that are beneficial for both livestock owners and smallholders
practicing dryland cropping
-Learning workshops are a central part of the facilitation and implementation process.
Due to working with such a large number of participants across 17 villages, these
workshops were not held in all areas. This is seen to have created a weakness in the
programme, as newer participants are not well informed about the CA process.
A process for ensuring that these learning session are done in each of the new villages is
to be designed- interns can be brought in to assist with the planting and to free up some
time for facilitators to run these sessions with the learning groups.
-Participants generally assess the success of their CA trials in terms of visible differences
in their crops and in their yields. Generally there are noticeable increases in yield in the
CA plots, when compared to conventional plots in the short team (1st year). This is more

73
likely an effect of better management practices for maize production in general
(nutrient and weed management) rather than being a primary effect of the reduction of
tillage or soil health. It will be important to work pro-actively with longer term
participants to start to observe and analyse the more subtle changes wrought through
CA.
These are presently analysed in the yearly reviews and participants are aware of a
number of factors such as increased water infiltration and reduced run off., increased
moisture holding capacity of the soil, a reduction in weed pressure when CA is done
properly, increased value being placed on secondary crops such as beans and cover
crops and the value of intercropping for increasing maize yields.
-A further important motivational factor for participants is a reduction in input costs.
Given that they generally use a very low external input option for their control plots
(buying minimal fertilizer and keeping their own seed for re-planting) the main saving is
in ploughing costs. With the pending introduction of tractor drawn planters for the
participants’ planting larger fields, this particular benefit will be reduced. The other
benefits of the CA system will then come into play more strongly
-Participants have changing how they manage their control plots upon observations of
benefits in their CA plots. Thus a number of participants have now opted to have CA
control plots as well , or use the same fertilizer and weed management practices as for
CA plots. This has meant that the obvious differences between CA and control plots are
slowly eroding as control plot yields catch up with the CA plots.
A conscious strategy will need to be employed in terms of learning and observations for
these participants to ensure that they can unravel the effects of CA on their crop
management system and/or we will need to more consciously include conventionally
tilled plots as control plots going into the future.

74
Attachment 1: Multi-stakeholder Forum; Mahlathini Development
Foundation.
Introduction
Smallholder farmers in South Africa and in KwaZulu-Natal face a wide array of challenges that
constantly pose a threat to their livelihoods. These include limited resources, low economic
returns, low yields, poor infrastructure, and lack of access to information. Many of these farmers
are unemployed and rely on subsistence farming and government grants to sustain a living with
women playing a vital role in agricultural production. These challenges have led to a decline in
agricultural production in rural communities. However, smallholder farmers play an essential
role in livelihoods creation and household food security, therefore efforts need to be
strengthened by government, NGO’s, the private sector and other key role players to ensure that
agricultural production is revitalised in this sector (Ramaila et al, 2011).
In Bergville, KwaZulu Natal, there are a number of organisations working with smallholder
farmers to improve their access to resources and information, sources of income and their
social and economic levels. These organisations include government, NGOs’ and civil society
organisations. Although the challenges external organisations wish to address are similar, there
is limited communication and collaboration between the stakeholders. This could be due to
factors such as clashes in programs and timeframes and conflicting interests amongst others.
The purpose of this document is to propose the formation of a multi-stakeholder forum in
Bergville with the aim to improve stakeholder relations, coordinate programs and actions for
more efficient implementation and gain deeper understanding of the various stakeholder roles.
The establishment of a stakeholder forum entails initiating two-way dialogue seeking
understanding and solutions to issues of mutual concern.
Objectives of the Stakeholder Forum
Create a platform for stakeholders to present their programs and encourage broader
involvement.
Understand the expectations, roles and contributions of the different stakeholders in Bergville
and identify areas for collaboration
Coordinate the implementation of projects by identifying common areas of interest, possible
overlaps between projects and explore how stakeholders can support each other to avoid
duplication and conflict of interest.
Share knowledge and experiences in addressing common challenges
Promote ways of accelerating the implementation of actions
The stakeholder forum will not only focus on coordination on projects but will also assess the
roles of other key players such as input suppliers, commercial farmers and local businesses with
the aim to strengthen relationships between them and other stakeholders such as government

75
and NGOs by sharing information and identifying areas of mutual benefit. The ultimate goal of
the stakeholder farmer is to create partnerships that place the farmer at the centre and increase
efficiency of project implementation.
Stakeholders
The stakeholders identified for the forum include the following:
-Local Government: Department of Agriculture and Rural Development (DARD),
Department of Rural Development and Land Reform (DRLR), Department of Economic
Development and Tourism (DEDT).
-Non-Governmental Organisations (Mahlathini Development Foundation (MDF),
Philakahle, Lima, Farmer Support Group (FSG))
-Private businesses (retailers and local business people)
-Commercial farmers
-Input suppliers (TWK, Farm Save, etc.)
-Local Authorities ( Chief/induna)
Forum Meetings
The stakeholder forum will be held quarterly, i.e. every three months in order to ensure
continuous engagement and allow enough time action plans to be implemented.
Forum Deliverables
The primary deliverable of the forum is an action plan on discussions and agreed actions and
updated reports on progress in implementation.
Attachment 2: farmers’ day programme
Ezibomvini Farmer’s Day
THEME: CONSERVATION AGRICULTURE: SOIL HEALTH AND USE OF
REDUCED INPUTS
Date: 02 March 2017
Time: 10h00
Venue: Emmaus Ezibomvini

76
ITEM
RESPONSIBILITY
Opening prayer
Mr. L Dubazane
Welcoming of guests(isqongo)
Mr. Zimba
TALKS
1. Asset based community driven development
Mrs Nkutha (Philakahle)
2. Cost benefit Analysis No-till vs conventional
agriculture
Agriculture economist Dept. of agric
3. Soil health
Dr Charmaine Mchunu Dept of Agric
4. Soil health and soil fertility the Role of CA
Dr Hendrik Smith (Grain SA)
5. Progress in CA SFIP Programme
Ms Erna Kruger (Mahlathini Dev. Foundation)
6. Correct use and handling of chemicals
Mr Ngcobo (Nulandis)
7. Testimonies
Farmer (Ezibomvini)
Farmer ( Stulwane)
Farmer (Eqeleni)
8. CA/ No till programme local Department of
Agriculture
Mr Khuboni (Local Extension officer)
9. Local Municipal programmes involving small
holder farmers
Mrs Ndaba (Senior LED officer)
9. Field visits to nearby sites
Zikode Zodwa, Dladla Nombono and Hlongwane
Phumelele
10. Open session & Remarks from Visiting
Farmers
11. Closing Remarks
Mr Hadede (ward councillor)
12. Closing Prayer
Mr Dubazane
LUNCH
END THANK YOU
GUEST LIST EZIBOMVINI FARMERS DAY
GUEST
ORGANIZATION
EMAIL ADDRESS
Mr Ngcobo
Nulandis (chemical suppliers)
chemiseed@futurenet.co.za &
neethling@megawifi.co.za

77
Mrs Ndaba
Okhahlamba Local
Municipality
hlengiwe.ndaba@okhahlamba.gov.za
TWK
representative
TWK agri boffins
(Winterton)
wrmuller@twkagri.com &
Winterton@twkagri.com
Farmsave
representative
Farm save (Bergville)
Lydia@farmsave.co.za
Mrs Nkutha
Philakahle
Nnyadi.nkutha@gmail.com
Ms Zodwa
Mazibuko
Department of Agriculture
(Cedara)
Zodwa.mazibuko@kzndard.gov.za
Dr Charmaine
Mchunu
Department of Agriculture
(Cedara)
Charmaine.mchunu@kzndard.gov.za
Mr Rob
Grain SA (farmers support
programme)
iron@futurenet.co.za
Ms Nonhlanhla
Mthembu
Farmers Support Group
(UKZN)
mthembuno@ukzn.ac.za
Mr Nkosi / Mr
Khuboni
Local Department of
Agriculture
Zamokwakhe.nkosi@kzndard.gov.za
Attachment 3: Social Compact Agreement.
GRAIN-SA SMALLHOLDER FARMER INNOVATION
PROGRAMME
PROGRAMME IMPLEMENTATION AGREEMENT
Entered into and between:
MAHLATHINI DEVELOPMENT FOUNDATION
Represented by:
and
FARMER LEARNING GROUP
In the community of Nokweja
Represented by:
78
Name of the Programme
The name of this programme is: Grain-SA Smallholder Farmer Innovation Programme. This
programme is funded by Grain-South Africa.
The Parties to this Programme Implementation Agreement (PIA)
The parties to this PIA are:
Mahlathini Development Foundation as the Programme Implementing Agent and herein
referred to as MDF; and
Farmer Learning Group as a collective of participating smallholder farmers in the said
community of Nokweja, and herein referred to as FLG.
PIA and Acceptance
MDF hereby confirms its commitment to support FLG as per terms and conditions contained in
this PIA.
FLG hereby confirms its acceptance in participation in this programme as per terms and
conditions contained in this PIA.
The duration of the programme shall be aligned to contractual dates of the Grain-SA as the
programme funder.
In the event of any conflicts with regard to the interpretation and understanding of this PIA, the
provisions contained in Section 7 of this document shall prevail.
Background
MDF has pioneered a model for value chain development and support at a local level for rural
smallholder agricultural commodities with few partners in KwaZulu-Natal and the Eastern Cape
provinces. The main commodities have been maize, and beans, poultry production (broilers and
layers), vegetables and potatoes.
The model is based on a farmer innovation approach linked to Village Saving and Loan
Associations (VSLAs) popular referred to as village level savings and credit groups, where
smallholder farmers in previously disadvantaged communities organise themselves into
commodity interest groups.
These interest groups work together within the whole value chain from input supply, through
production to marketing to learn together and create local economic opportunities within the
system.
These interest groups form bulk buying groups, set up local supply systems and local
microenterprises, participate in farmer level learning and experimentation and forge local
market linkages. They are supported to forge relationships with agribusiness and institutional
partners and receive support and training in small business development.
79
Over the last 5 years, this model has proven extremely successful in stimulating local production
and marketing and provides coherent support to smallholders to develop their farming
enterprises. Linking the smallholder into the wider economy and ensuring ongoing profitability
under their difficult conditions can be tackled as a challenge with appropriate industry and
government support.
Purpose of the Programme
The main purpose of this programme is to optimise Conservation Agriculture (CA) system for
non and semi-commercial smallholder farmers.
In other words, this programme aims to empower smallholder farmers to participate actively in
local value chains, transform their production into profitable enterprises and consequently
maximise their yields and their incomes.
Main Role of Mahlathini Development Foundation
MDF will facilitate the establishment of Farmer Learning Groups for the purpose of
experimentation in conservation agriculture so that smallholder farmers can learn together and
work as teams to increase their yields and income streams. MDF therefore commits to;
Promote the establishment of Farmer Learning Groups as the main community-based
institution that will implement conservation agriculture in a community;
Promote crop diversification and introduction of fodder and other food crops for food security
and income generation;
Promote innovation platforms open up options for local economic activities such as growing
and milling yellow maize for animal feed;
Facilitate innovation platforms build relationships with agribusiness stakeholders including
input suppliers, trainers, milling companies, marketing operations and buyers of produce;
Facilitate the establishment of Village Saving and Loan Associations (VSLAs) to support
participating smallholder farmers to create a savings and credit facility that members will use it
to procure inputs through bulk buying mechanisms; hire or buy no till implements and planters;
Train and supervise chairmen, secretaries and treasurers of VSLAs to operate and efficient VSLA
that is able to provide most appropriate financial products and services its members, mainly
savings and short-term credit;
Promote the establishment of a farmer-led support centre in a community;
Provide capacity building workshops, supervision session and operational guidelines to a well-
functioning FLG to establish and operate a farmer-led support centre; and
Advise the FLG of potential programme supporters and potential programme donors. MDF shall
do its best to invite relevant public and private sector stakeholders to participate in the
programme.

80
Main Role of Farmer Learning Group
Farmer Learning Groups are established by local producers that are currently involved in food
production whether for subsistence or commercial objectives. A FLG shall agree to participate in
this programme if as a collective farmers are willing to;
Treat and maintain this programme as independent from all other development projects and
programmes in the community,
Self-select members of a FLG from practising or active local small producers;
Work and learn together as a collective;
Establish, adopt and sign rules of engagement that are aligned to this PIA; which includes
qualifications for participation, acceptance and termination of participants, and beneficiation
rules;
Develop a database or list of participating smallholder farmers and provide it to MDF;
Elect an executive committee of Farmer Learning Group with a chairman, secretary and a
treasurer;
Appoint a chairman as primary contact person and secretary as a secondary contact person of a
FLG;
Operate a Village Saving and Loan Association (VSLA) which will be established to mobilise a
loan fund that will be used to finance individual member farming operations;
Collect annual and/or joining fees from members of FLG to procure things like stationary and to
pay for operating costs;
Encourage members of FLG to buy production inputs at the most appropriate time for a planting
season;
Participate fully in regular programme meetings and programme activities such as training
workshops, experimentation activities, harvesting, marketing and selling of produce, recording
of lessons, etc.
Participate in all research activities and knowledge sharing activities as expected by the
programme funder and MDF; and;
Take a lead in the establishment and operation of smallholder farmer-led support centre.
Dispute Resolution
In the event of a dispute arising between the parties in respect of any cause whatsoever, the
following may happen;
A meeting will be called to identify and declare a dispute and to indentify the causes of a
dispute;

81
A meeting will be called resolve a dispute; and
An independent arbitrator may be invited if the two parties fail to resolve the dispute on their
own.
Confidentiality
The parties undertake, both during the existence of and after the end/and or termination of this
PIA, not to disclose in any manner whatsoever any information gathered or obtained by virtue
of the services performed in terms of this PIA, except in fulfilment of a party's obligations under
this PIA.
All information gathered, obtained or known by virtue of involvement in services performed
under this PIA shall be deemed to be of commercial value and the parties and persons under
their control shall exercise due care and diligence in managing such information.
The parties accept that the information may be disclosed if a party is obliged to do so by
operation of law.
Termination
This PIA shall remain valid and in full force and effect for the duration of the project, unless it
has been terminated in terms of the provisions contained in this document.
General
This PIA constitutes the whole PIA between the parties and any amendment, addition or
alteration to the provisions hereof shall only be of force and effect if such amendment, addition
or alteration has been reduced to writing and signed by the parties.
No contract of employment
Nothing in this PIA must be construed as constituting a contract of employment offered by MDF
to participants in a FLG who by appending their signatures acknowledge that no such
relationship exists.
Signature
The following persons, hereunder, sign this Programme Implementation Agreement on behalf of
the members (participants) of the FLG.
Dated at ______________________________ on this ______ day of _______________ 20____
In the presence of the witnesses stated hereunder.