Conservation Agriculture: Quantitative research support to the Smallholder Farmer Innovation
Programme in KZN: 2019-2023
4 YrAdaptive research process (3rdyr)
KrugerE, DlaminiM, Mathebula T, Madondo T, Malinga M and Smith H.
Interns: Buthelezi L, Mbokazi N, Mbhele S, Sibiya N and Hlongwane H.
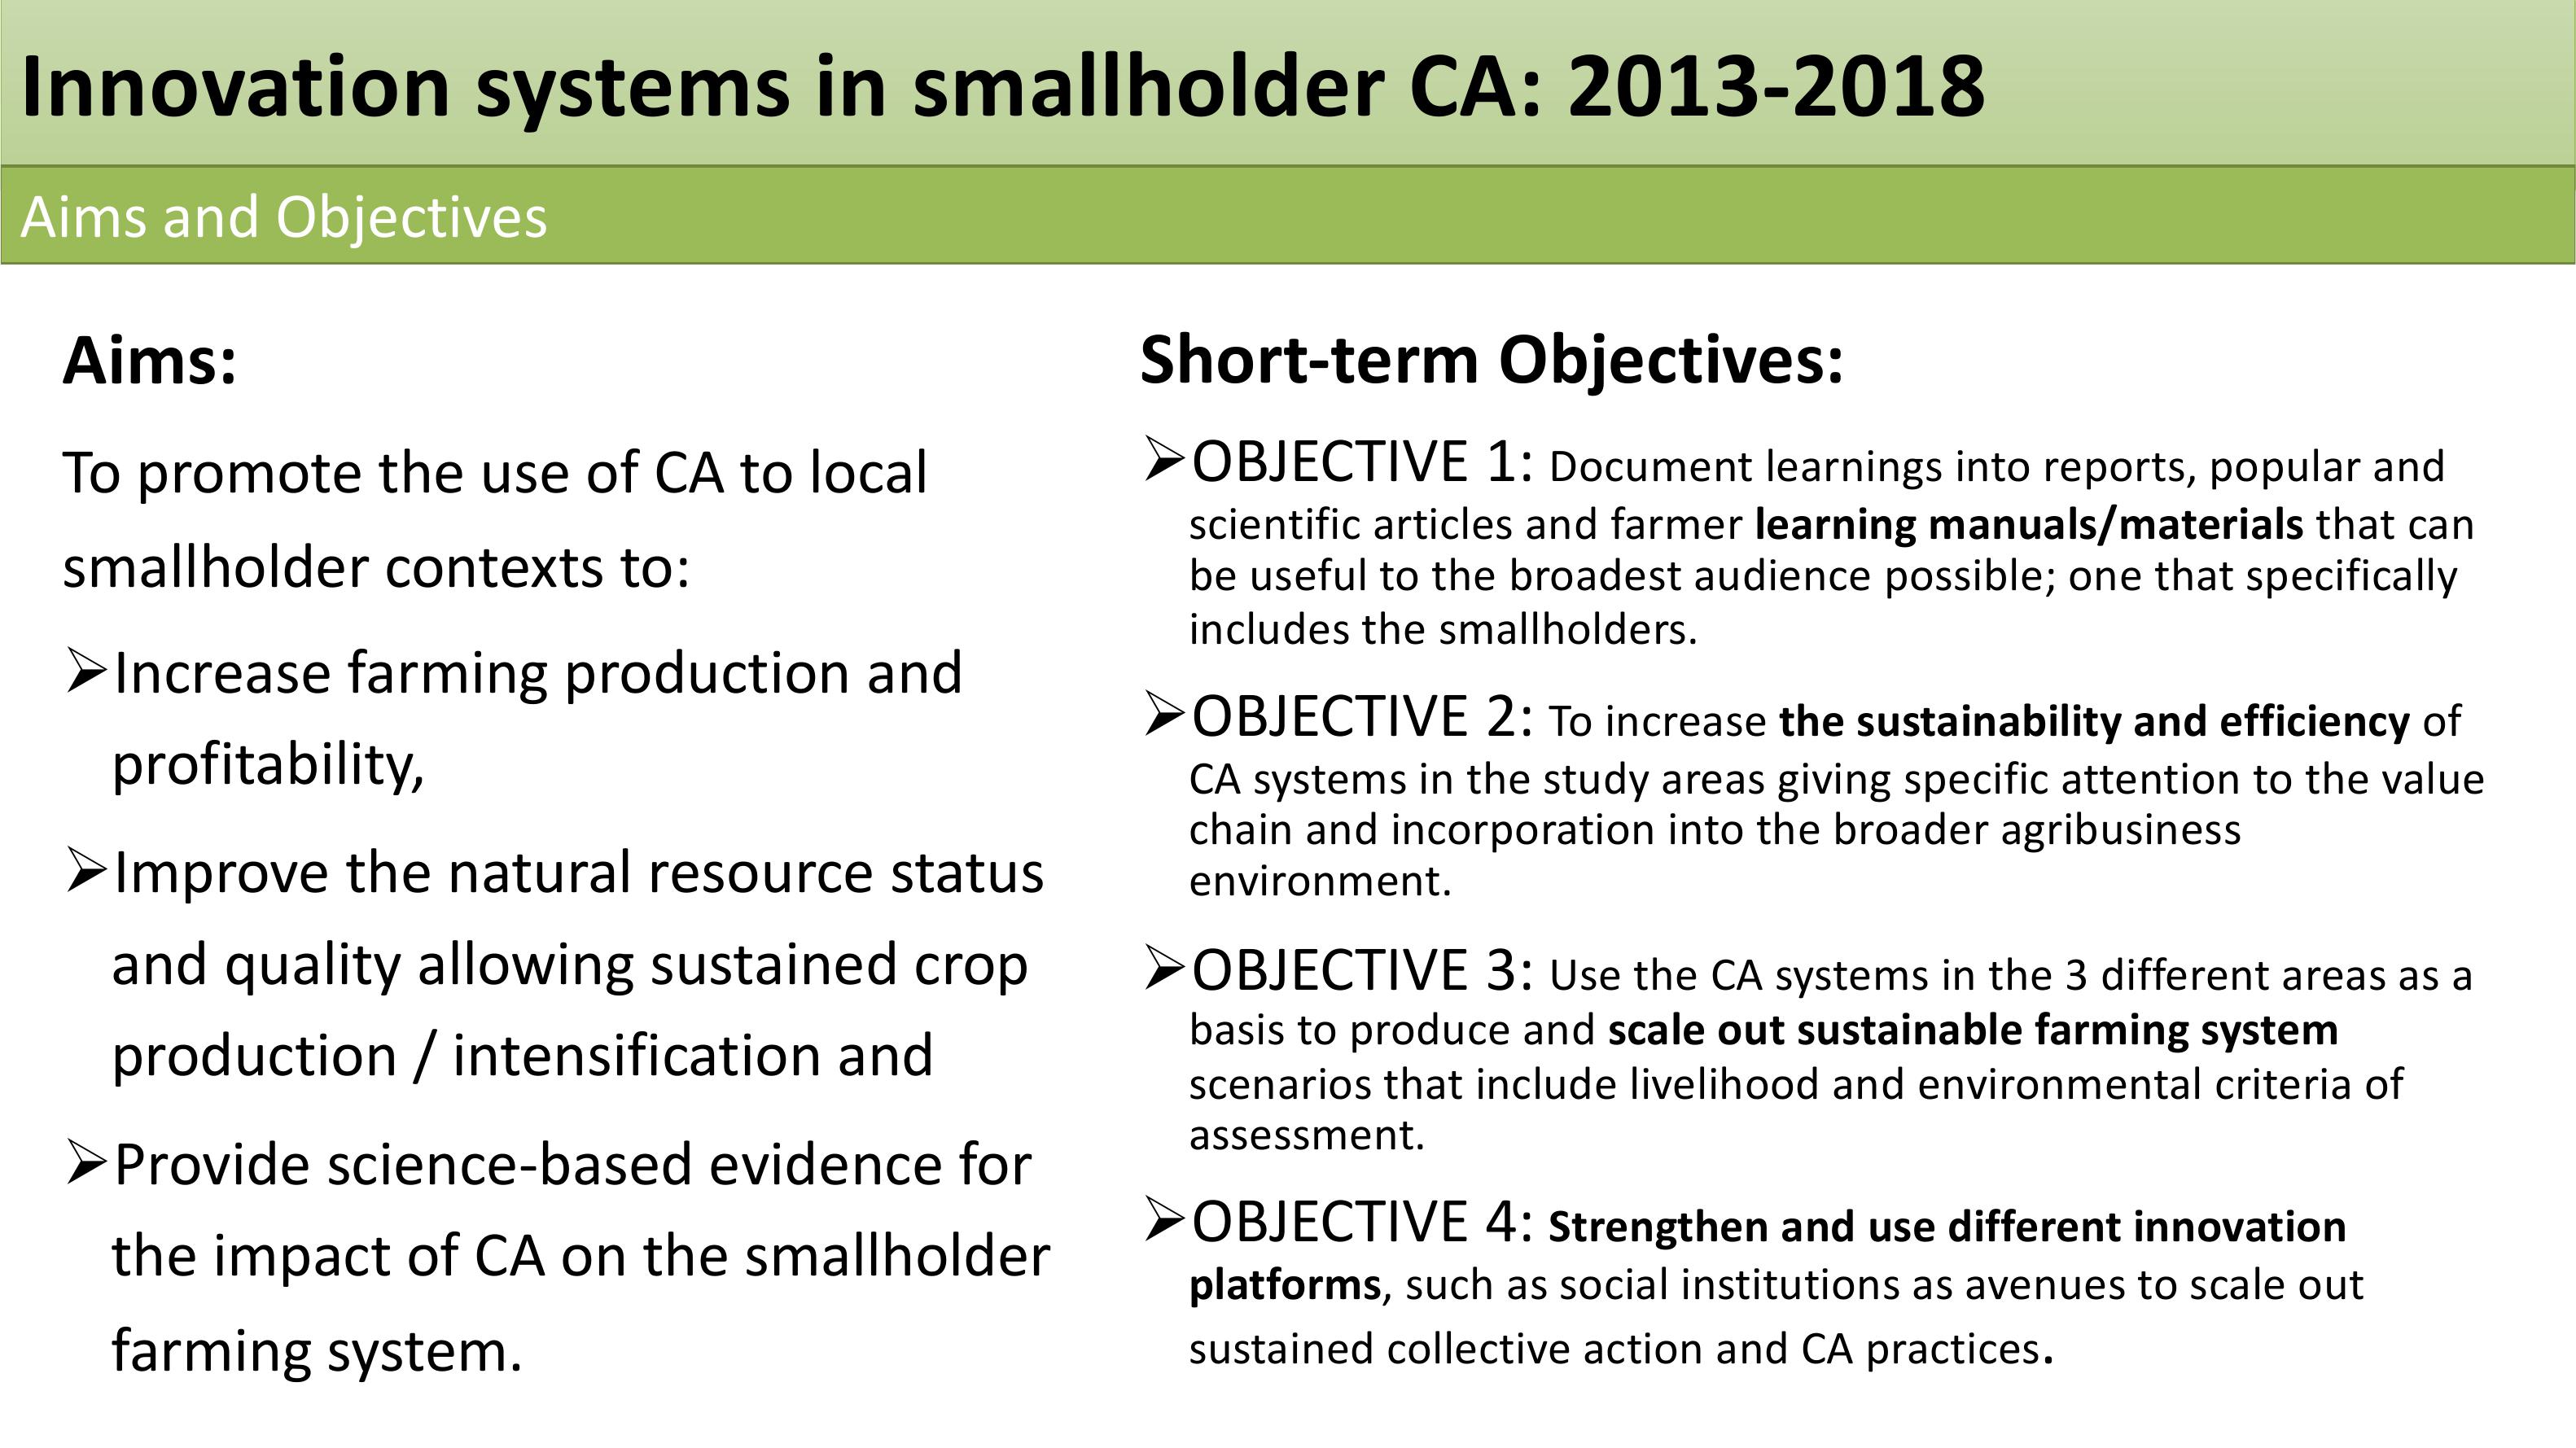
Innovation systems in smallholder CA: 2013-2018
Aims:
TopromotetheuseofCAtolocal
smallholder contexts to:
ØIncrease farming production and
profitability,
ØImprove the natural resource status
and quality allowing sustained crop
production / intensification and
ØProvide science-based evidence for
the impact of CA on the smallholder
farmingsystem.
Aims and Objectives
Short-termObjectives:
ØOBJECTIVE 1: Document learnings into reports, popular and
scientific articles and farmer learning manuals/materials that can
be useful to the broadest audience possible; one that specifically
includes the smallholders.
ØOBJECTIVE 2: Toincreasethe sustainability and efficiency of
CA systems in the study areas giving specific attention to the value
chain and incorporation into the broader agribusiness
environment.
ØOBJECTIVE 3: Use the CA systems in the 3 different areas as a
basis to produce and scale out sustainable farming system
scenarios that include livelihood and environmental criteria of
assessment.
ØOBJECTIVE 4: Strengthen and use different innovation
platforms, such as social institutions as avenues to scale out
sustained collective action and CA practices.
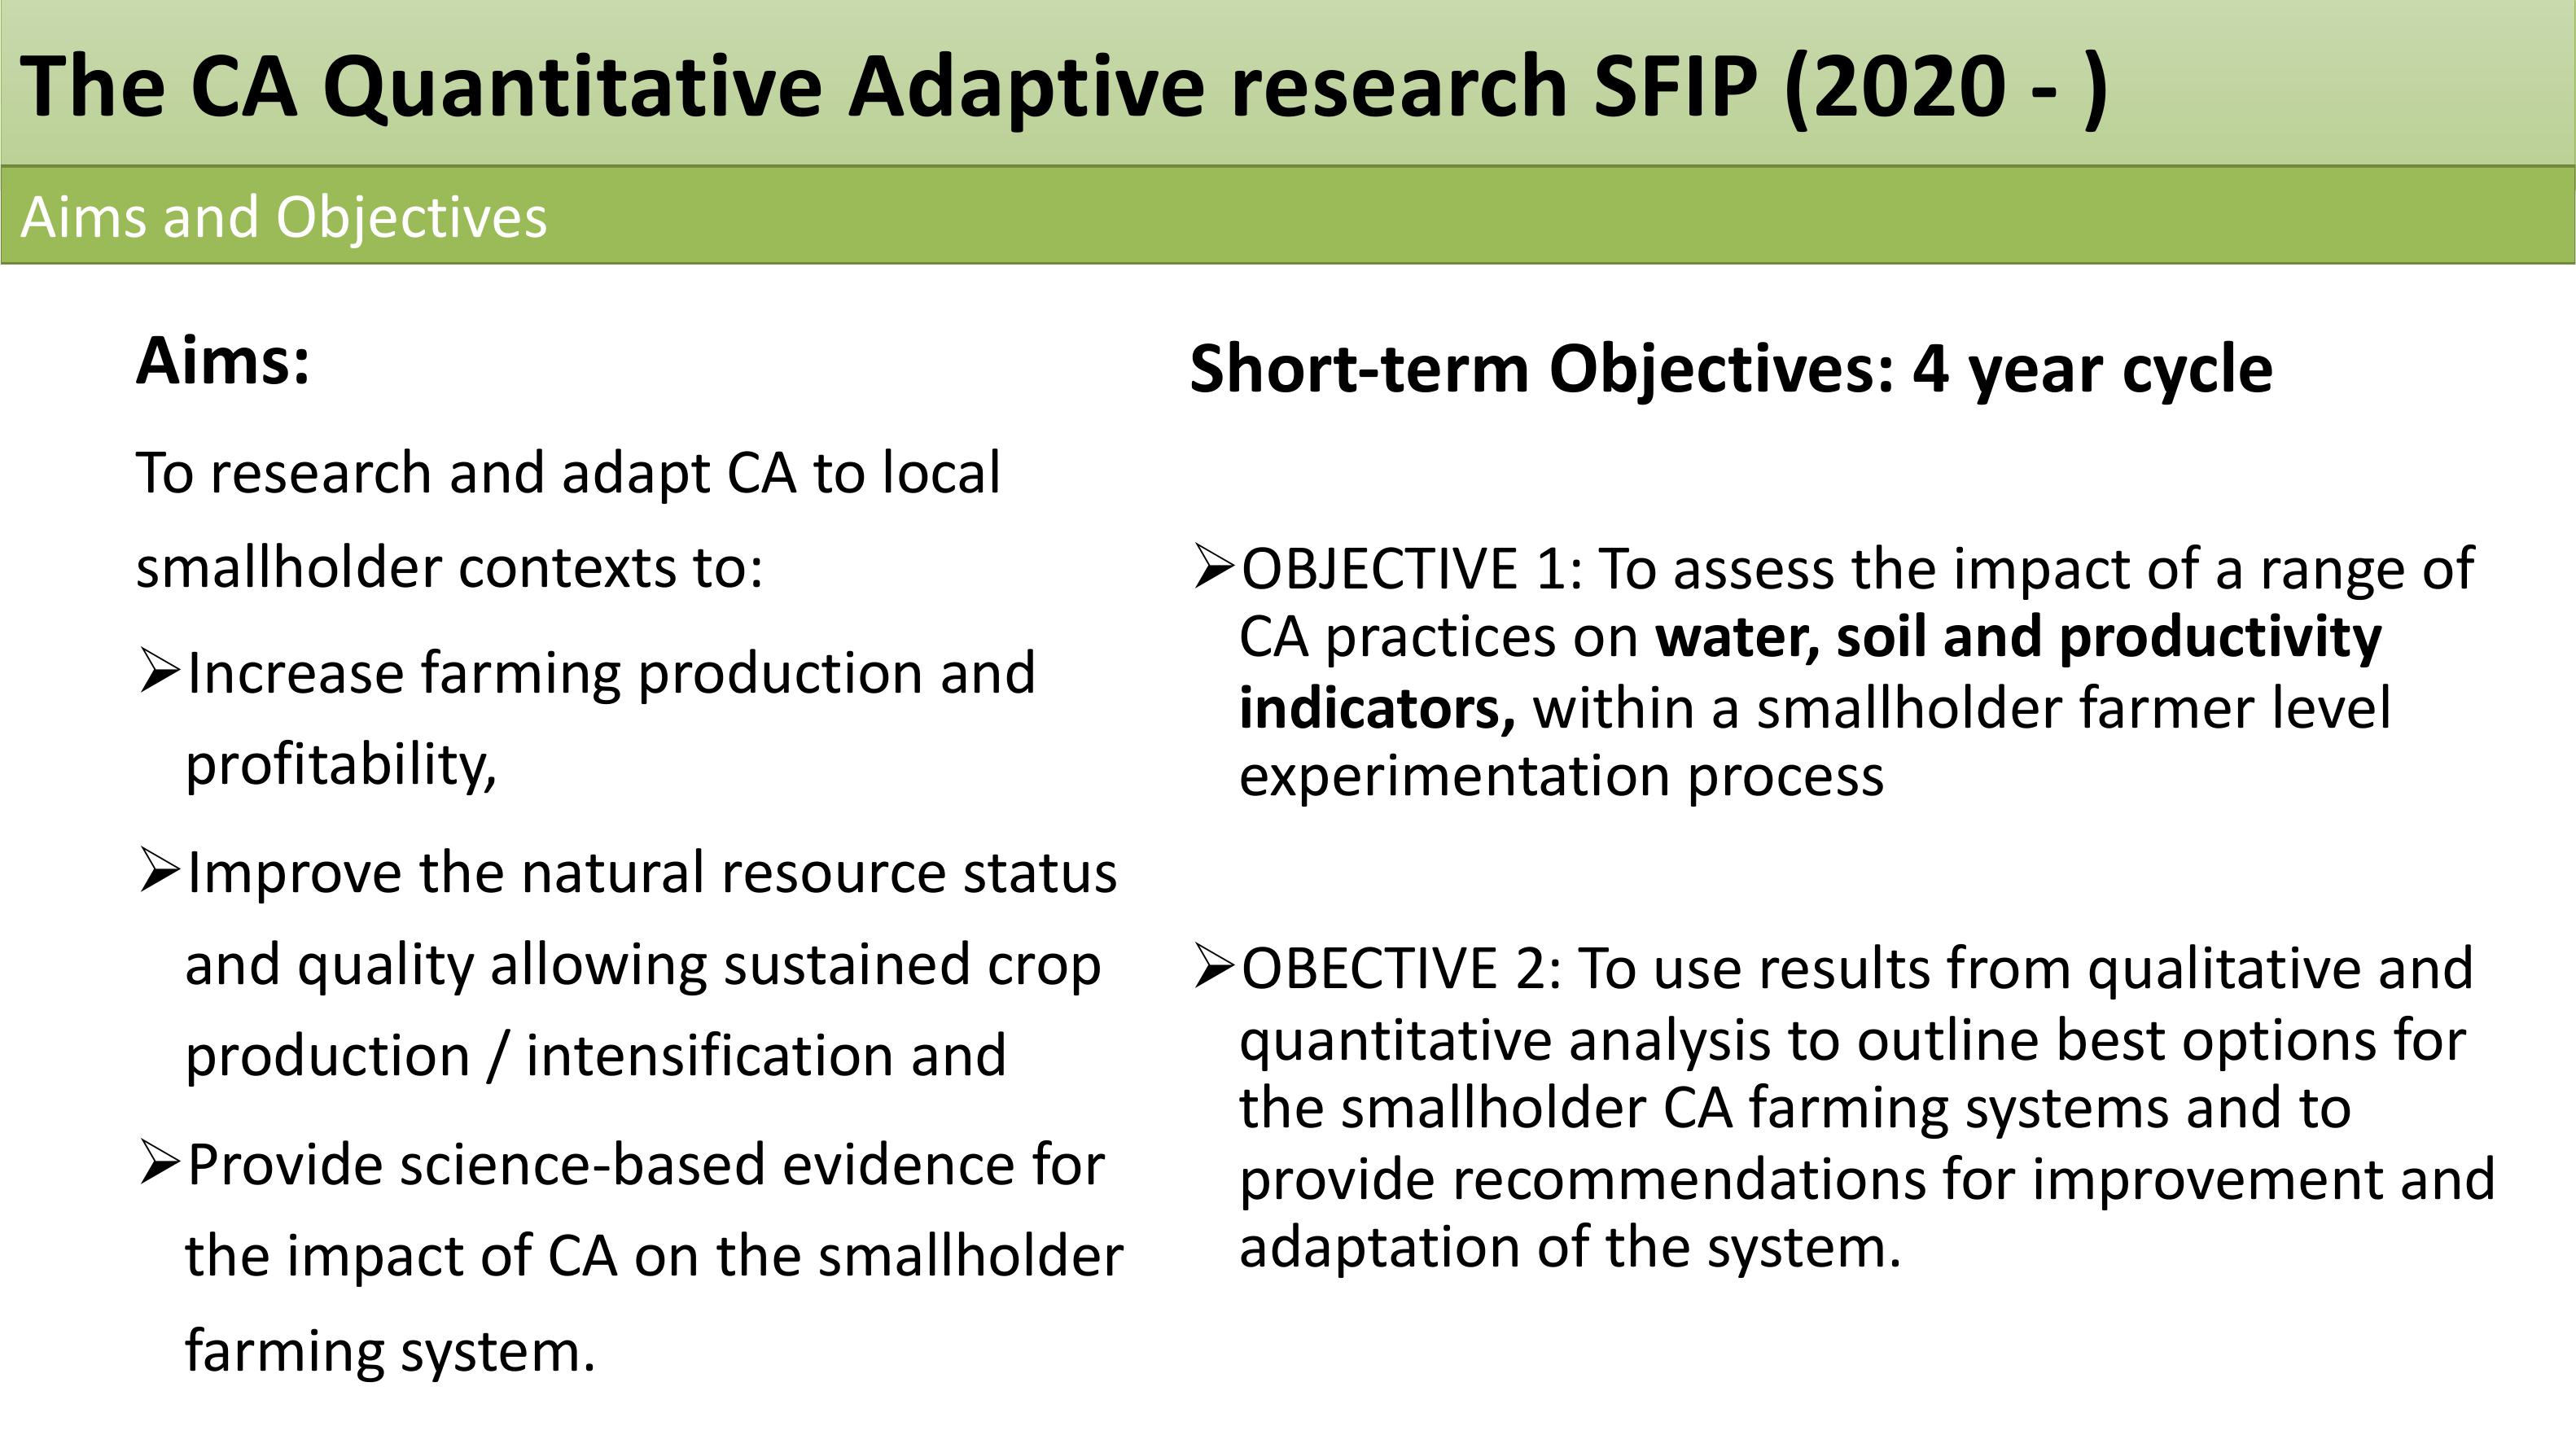
The CA Quantitative Adaptive research SFIP (2020 - )
Aims:
ToresearchandadaptCAtolocal
smallholder contexts to:
ØIncrease farming production and
profitability,
ØImprove the natural resource status
and quality allowing sustained crop
production / intensification and
ØProvide science-based evidence for
the impact of CA on the smallholder
farmingsystem.
Aims and Objectives
Short-termObjectives:4year cycle
ØOBJECTIVE 1: To assess the impact of a range of
CA practices on water,soil andproductivity
indicators,within a smallholder farmer level
experimentationprocess
ØOBECTIVE 2: To use results from qualitative and
quantitative analysis to outline best options for
the smallholder CA farming systems and to
provide recommendations for improvement and
adaptation of the system.
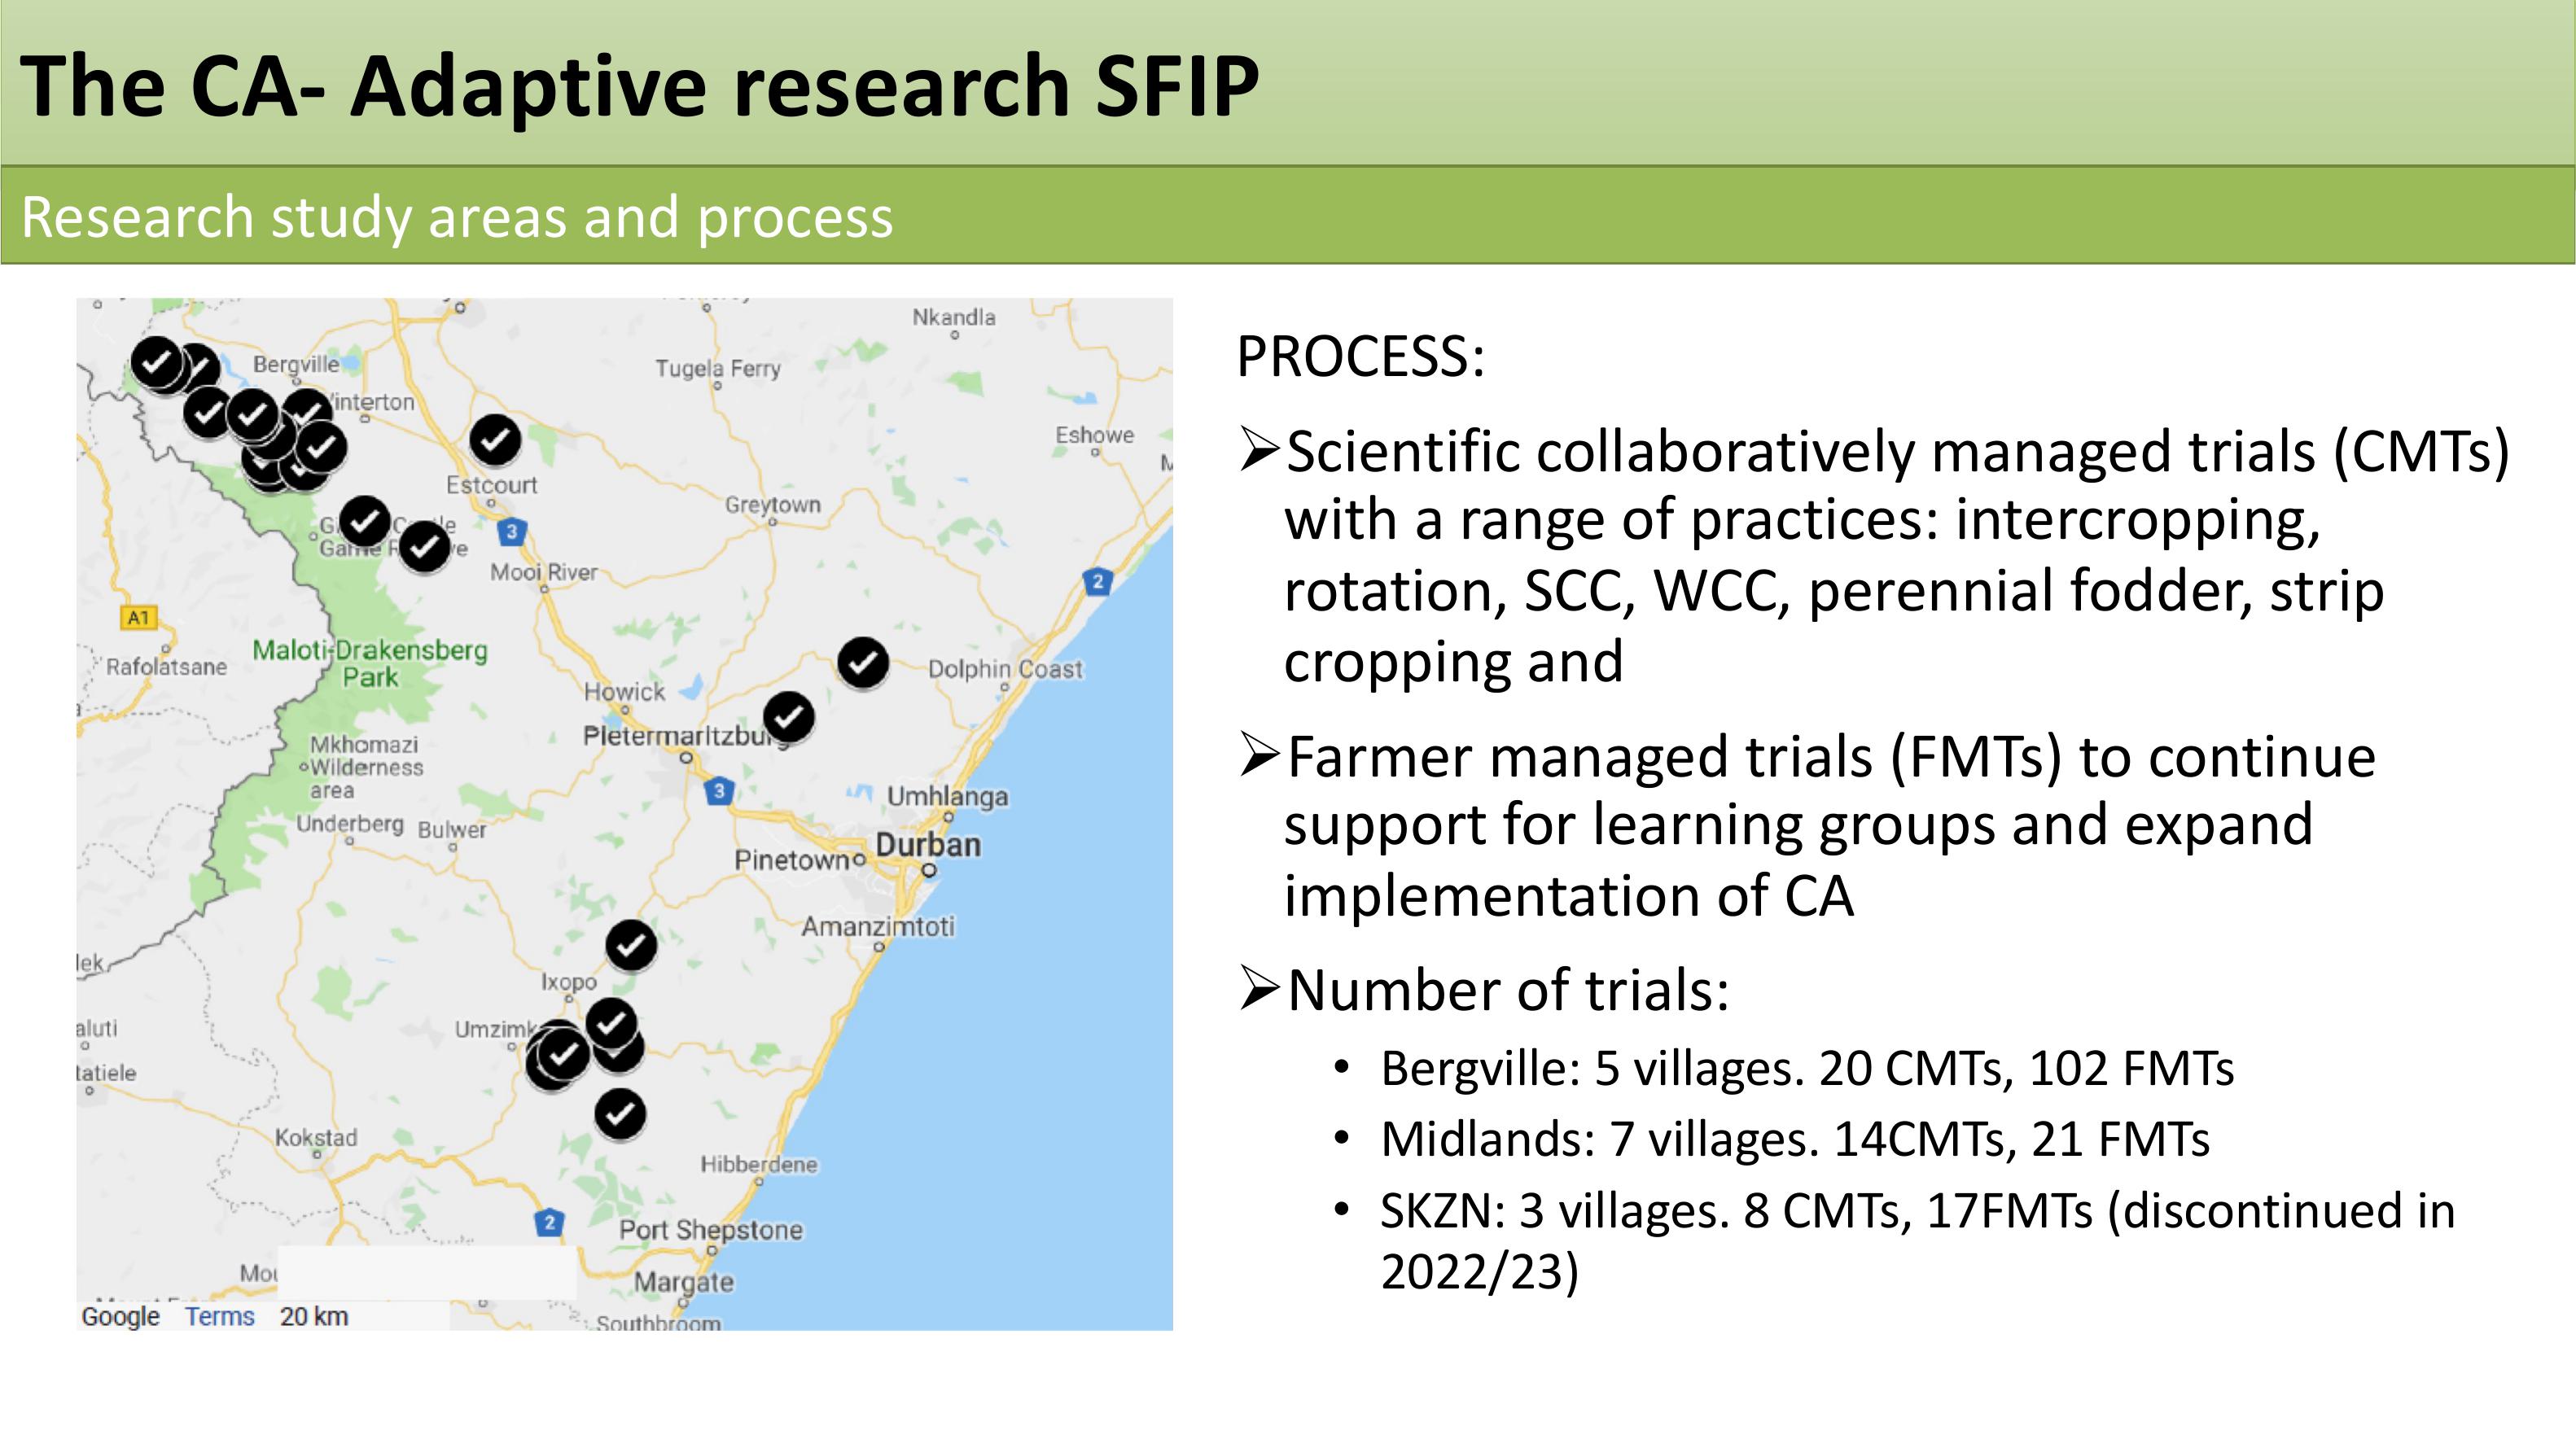
The CA- Adaptive research SFIP
Researchstudyareasandprocess
PROCESS:
ØScientific collaboratively managed trials (CMTs)
with a range of practices: intercropping,
rotation, SCC,WCC, perennialfodder, strip
cropping and
ØFarmermanagedtrials(FMTs)tocontinue
support for learning groups and expand
implementation of CA
ØNumber of trials:
•Bergville: 5 villages. 20 CMTs, 102 FMTs
•Midlands: 7 villages. 14CMTs, 21 FMTs
•SKZN: 3 villages. 8 CMTs, 17FMTs (discontinued in
2022/23)
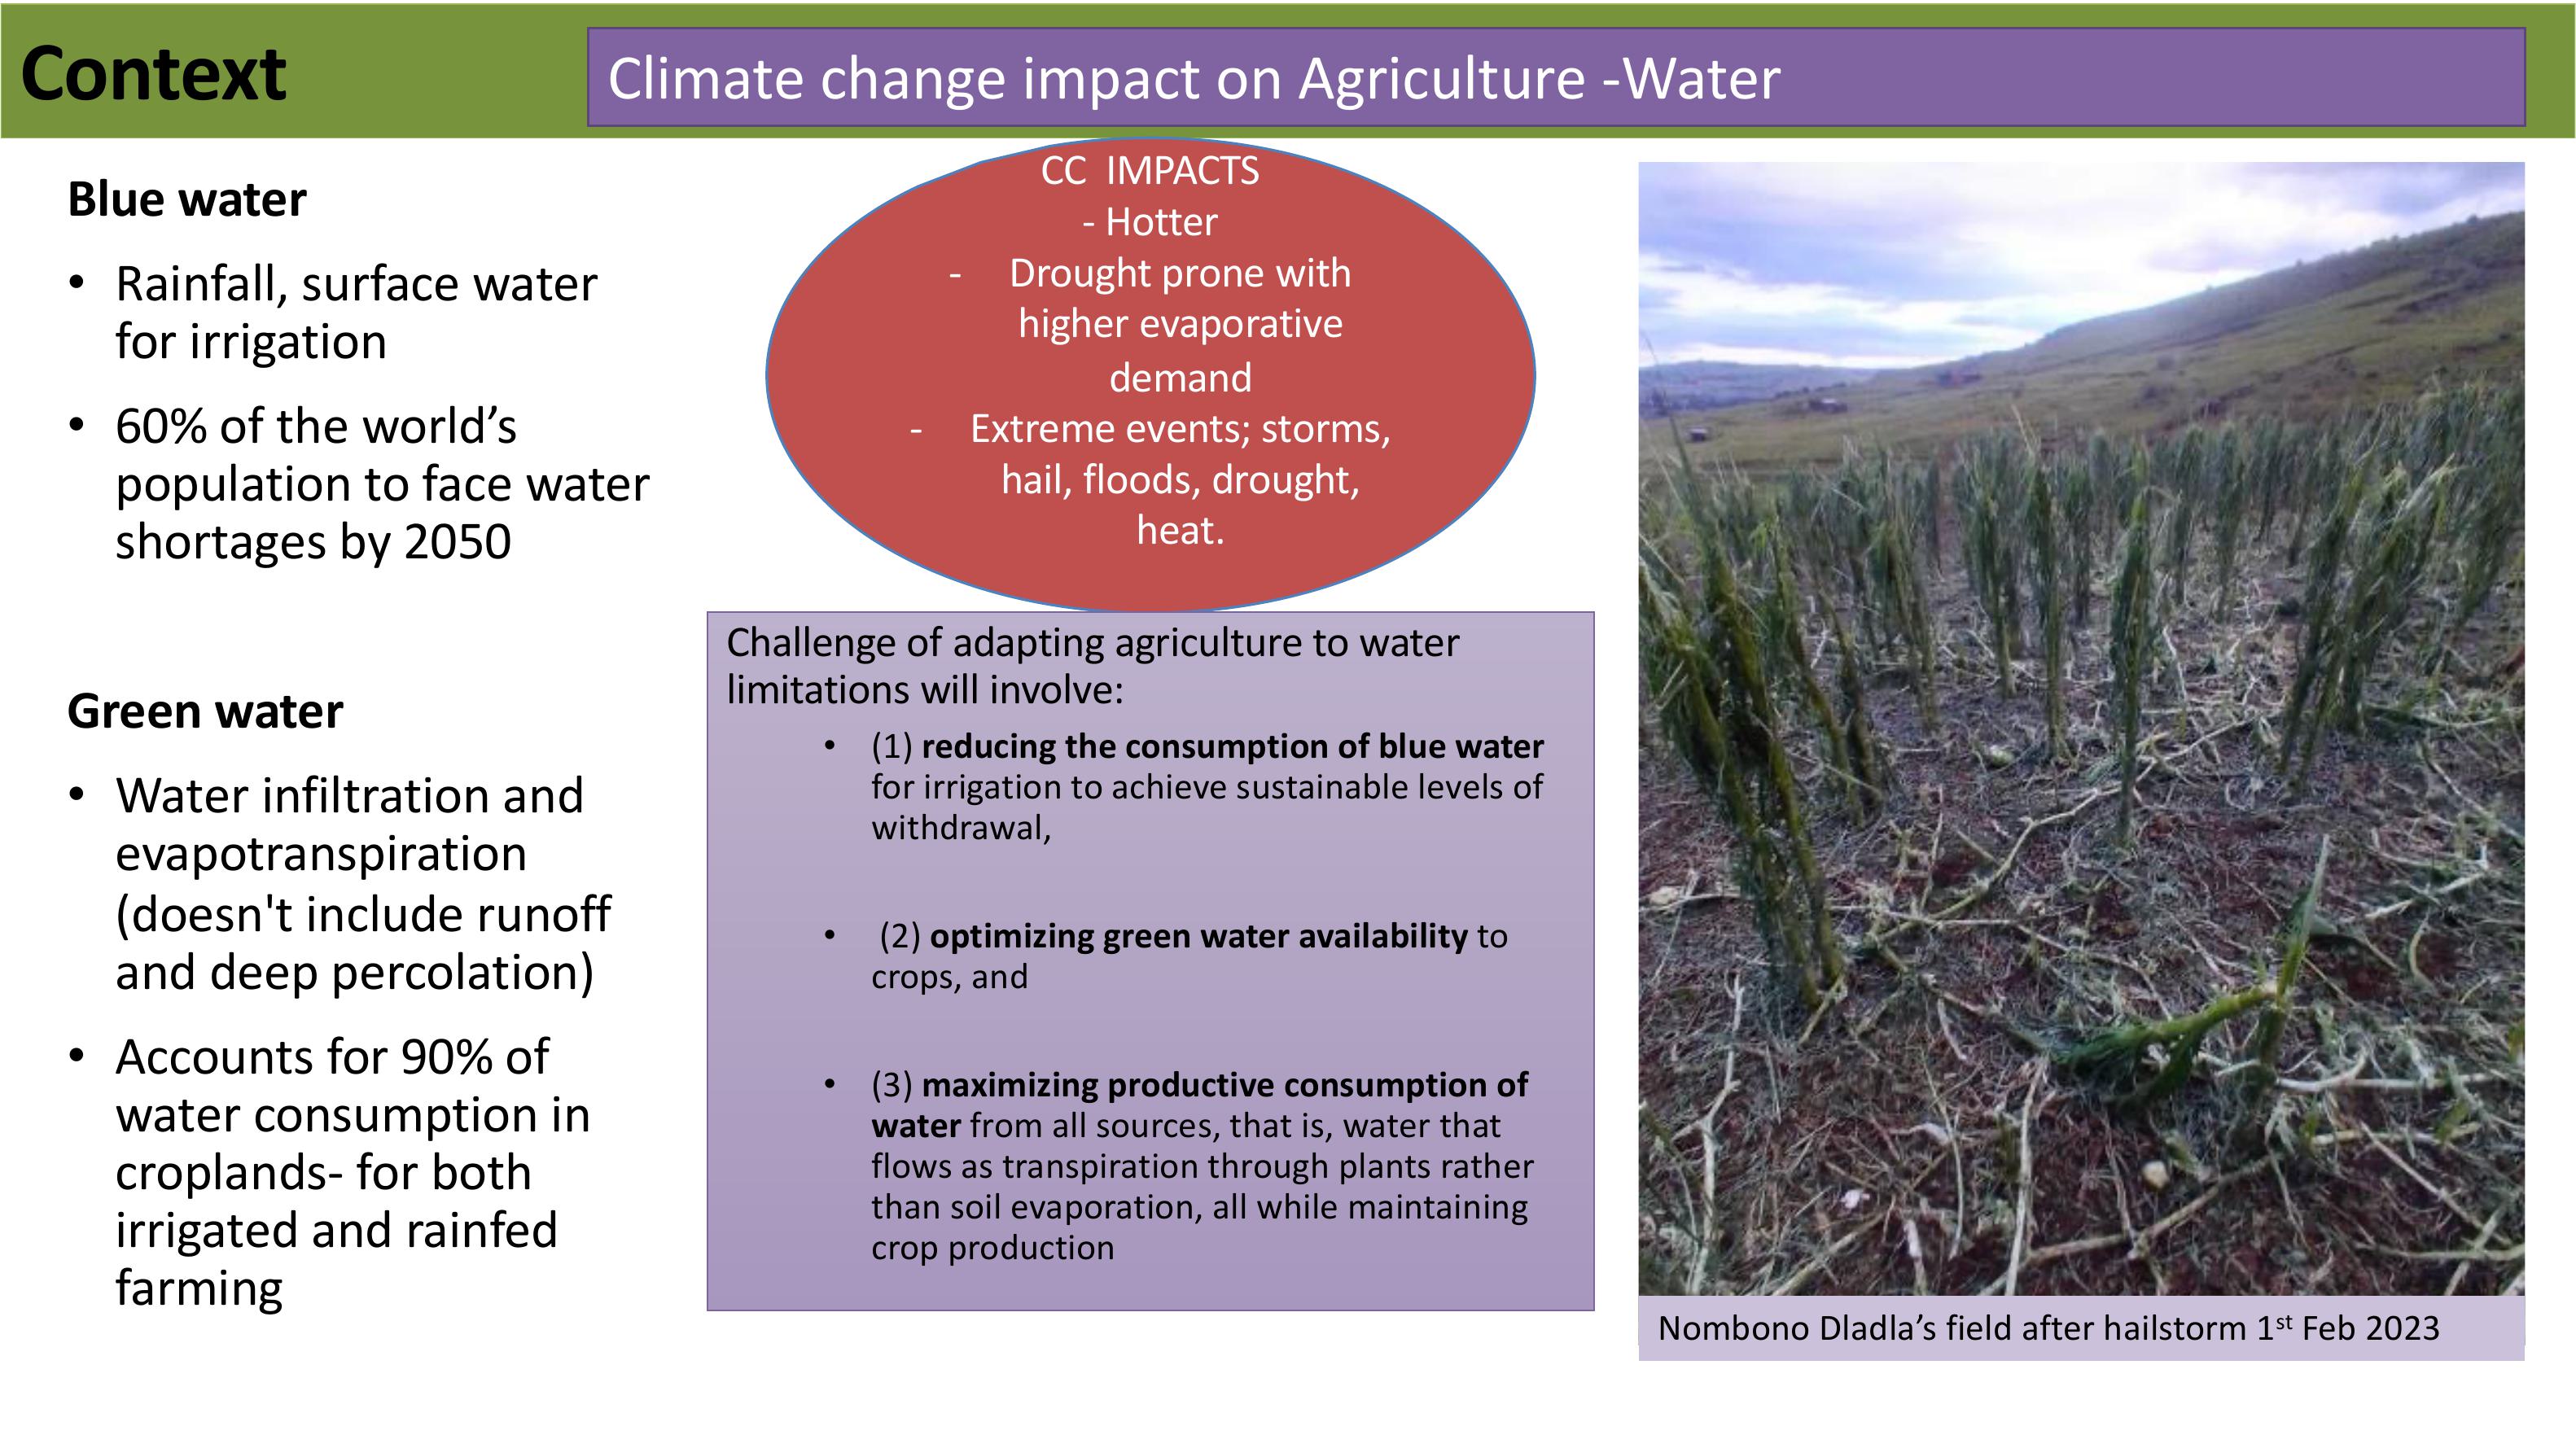
Context Climate change impact on Agriculture -Water
CC IMPACTS
- Hotter
-Drought prone with
higher evaporative
demand
-Extreme events; storms,
hail, floods, drought,
heat.
Blue water
•Rainfall, surface water
forirrigation
•60% of the world’s
population to face water
shortages by 2050
Green water
•Waterinfiltrationand
evapotranspiration
(doesn't include runoff
and deep percolation)
•Accounts for 90% of
waterconsumptionin
croplands- forboth
irrigated and rainfed
farming
Challenge of adapting agriculture to water
limitations will involve:
•(1) reducing the consumption of blue water
for irrigation toachieve sustainablelevelsof
withdrawal,
•(2) optimizing green water availability to
crops, and
•(3) maximizing productive consumption of
waterfrom all sources, that is, water that
flows as transpiration through plants rather
than soil evaporation, all while maintaining
crop production
NombonoDladla’sfield after hailstorm 1stFeb 2023
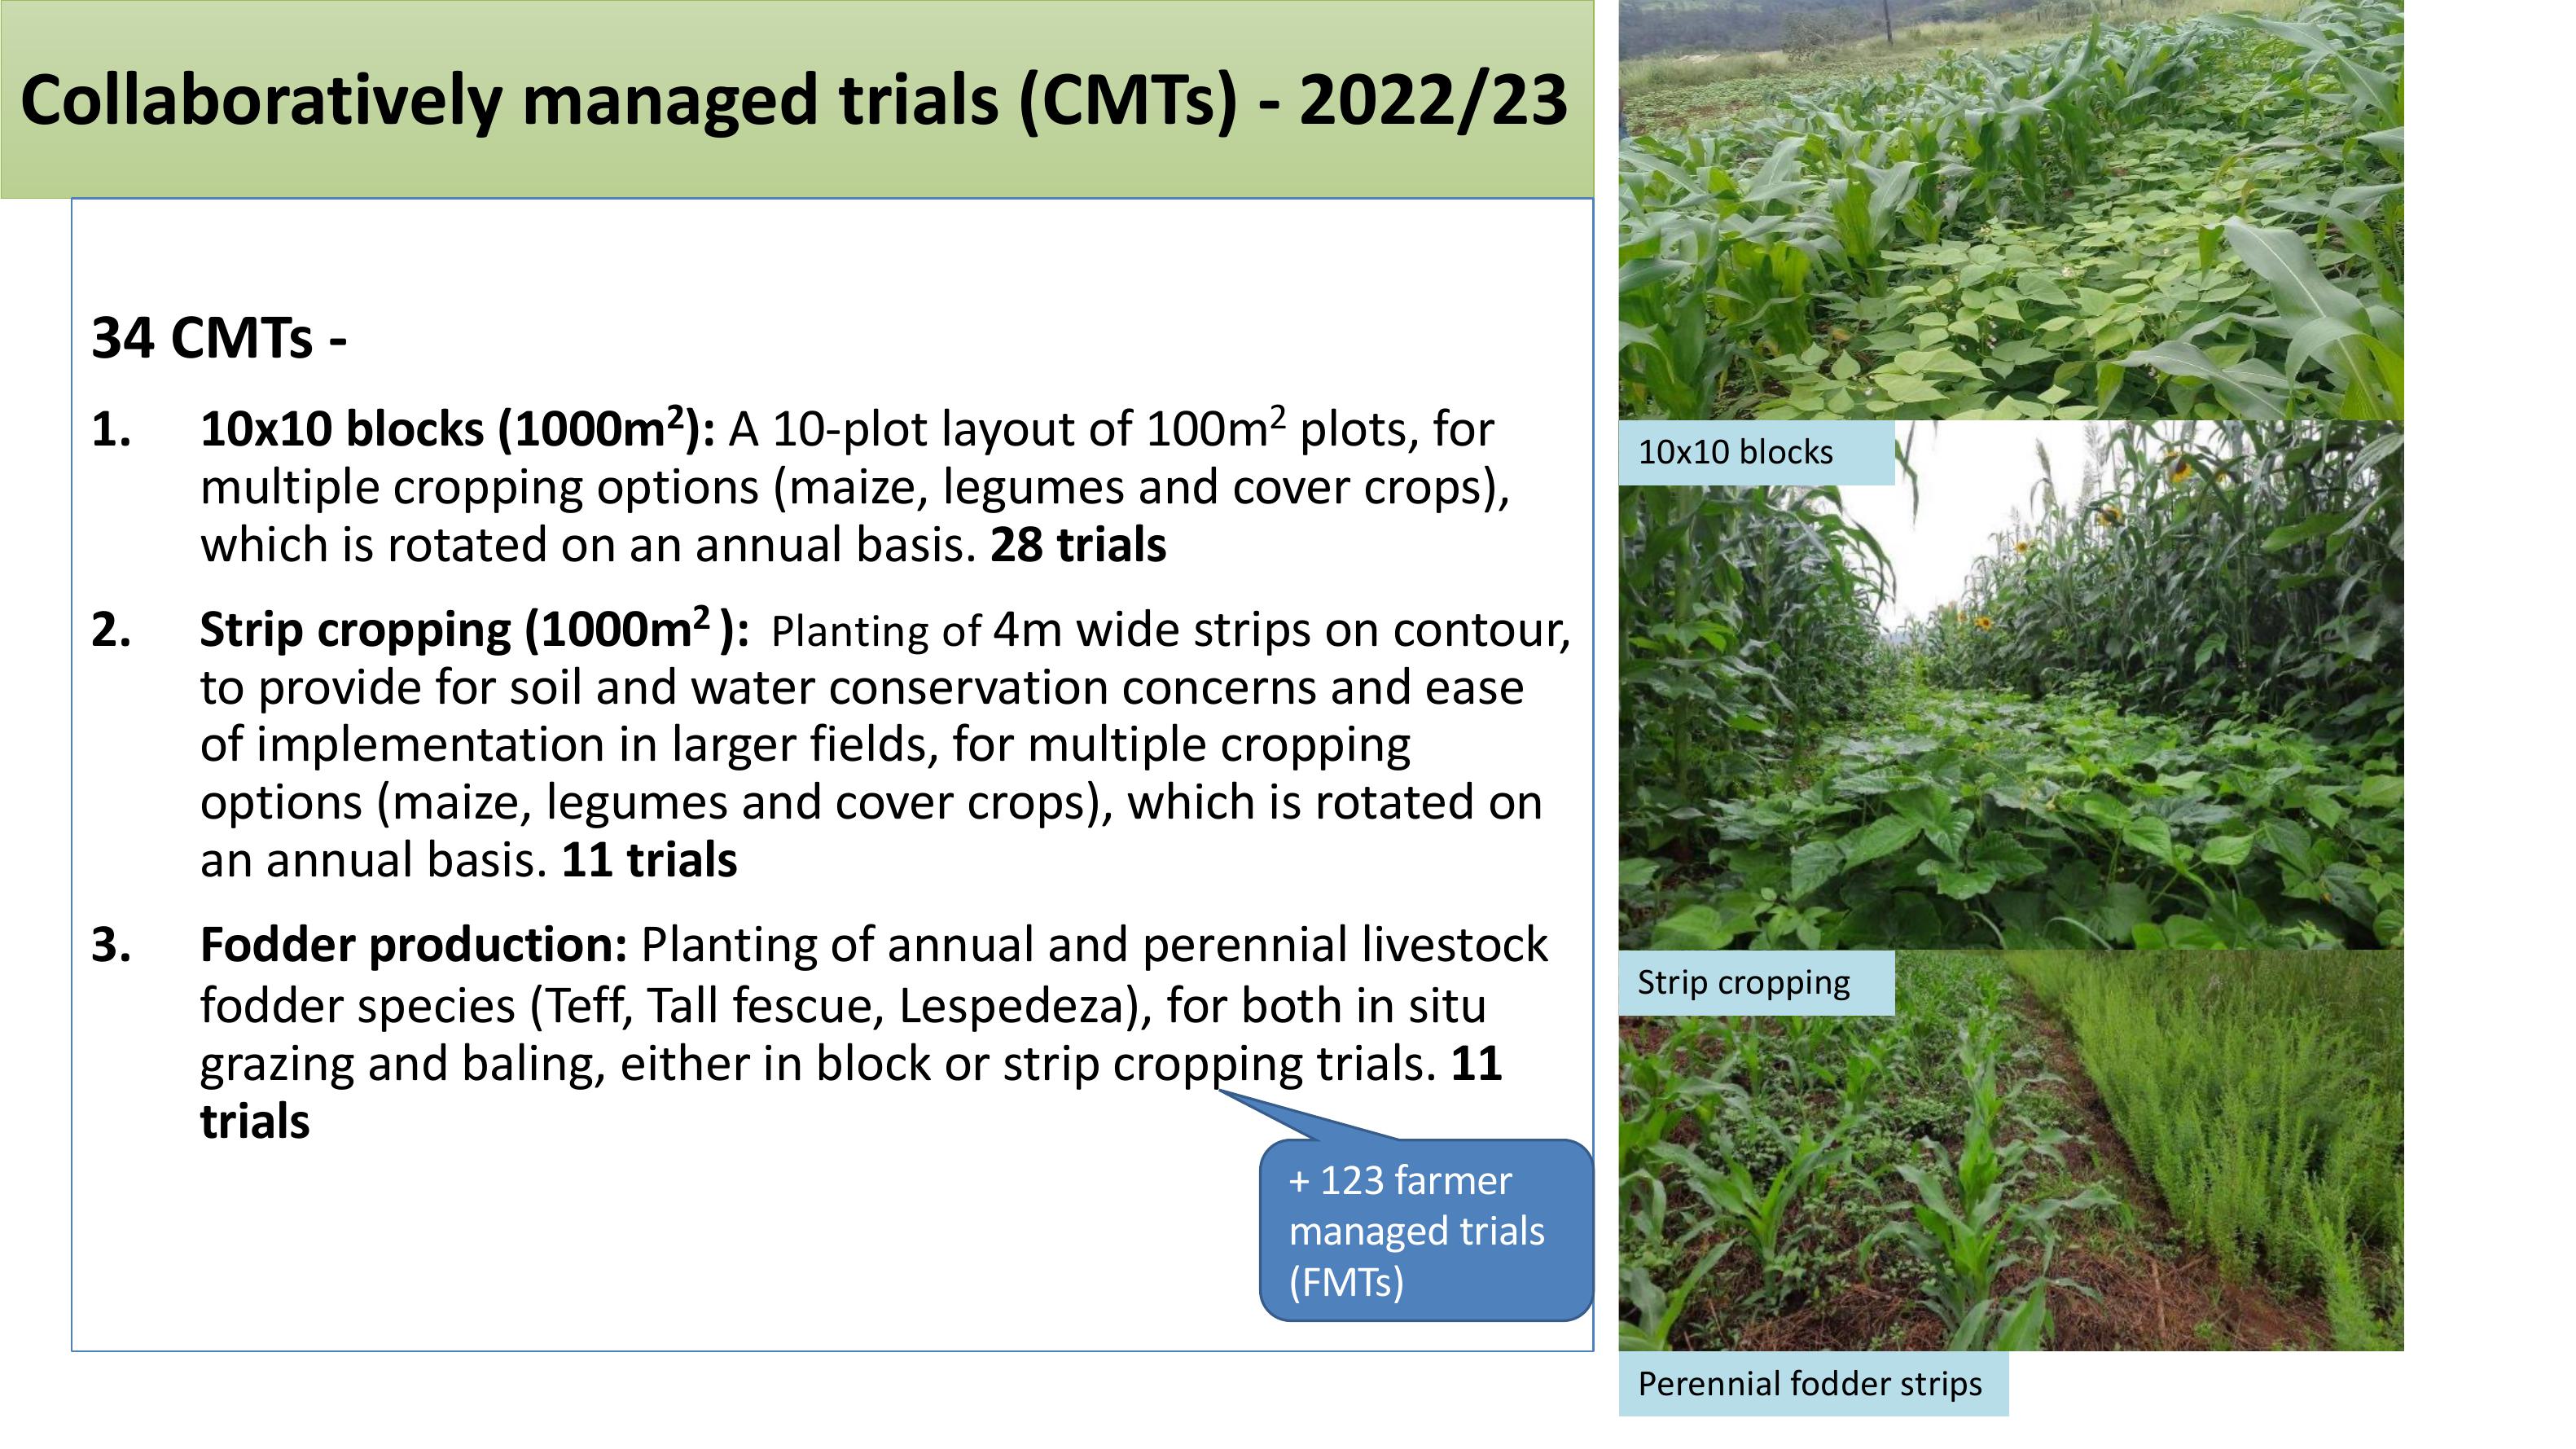
Collaboratively managed trials (CMTs) - 2022/23
34 CMTs-
1.10x10 blocks (1000m2): A 10-plot layout of 100m2plots, for
multiple cropping options (maize, legumes and cover crops),
which is rotated on an annual basis.28 trials
2. Strip cropping (1000m2 ): Plantingof 4m wide strips on contour,
to provide for soil and water conservation concerns and ease
of implementation in larger fields, for multiple cropping
options (maize, legumes and cover crops), which is rotated on
an annual basis. 11 trials
3. Fodderproduction:Planting of annual and perennial livestock
fodderspecies(Teff,Tallfescue,Lespedeza), forbothinsitu
grazing and baling, either in block or strip cropping trials. 11
trials
+ 123 farmer
managedtrials
(FMTs)
10x10 blocks
Strip cropping
Perennial fodder strips
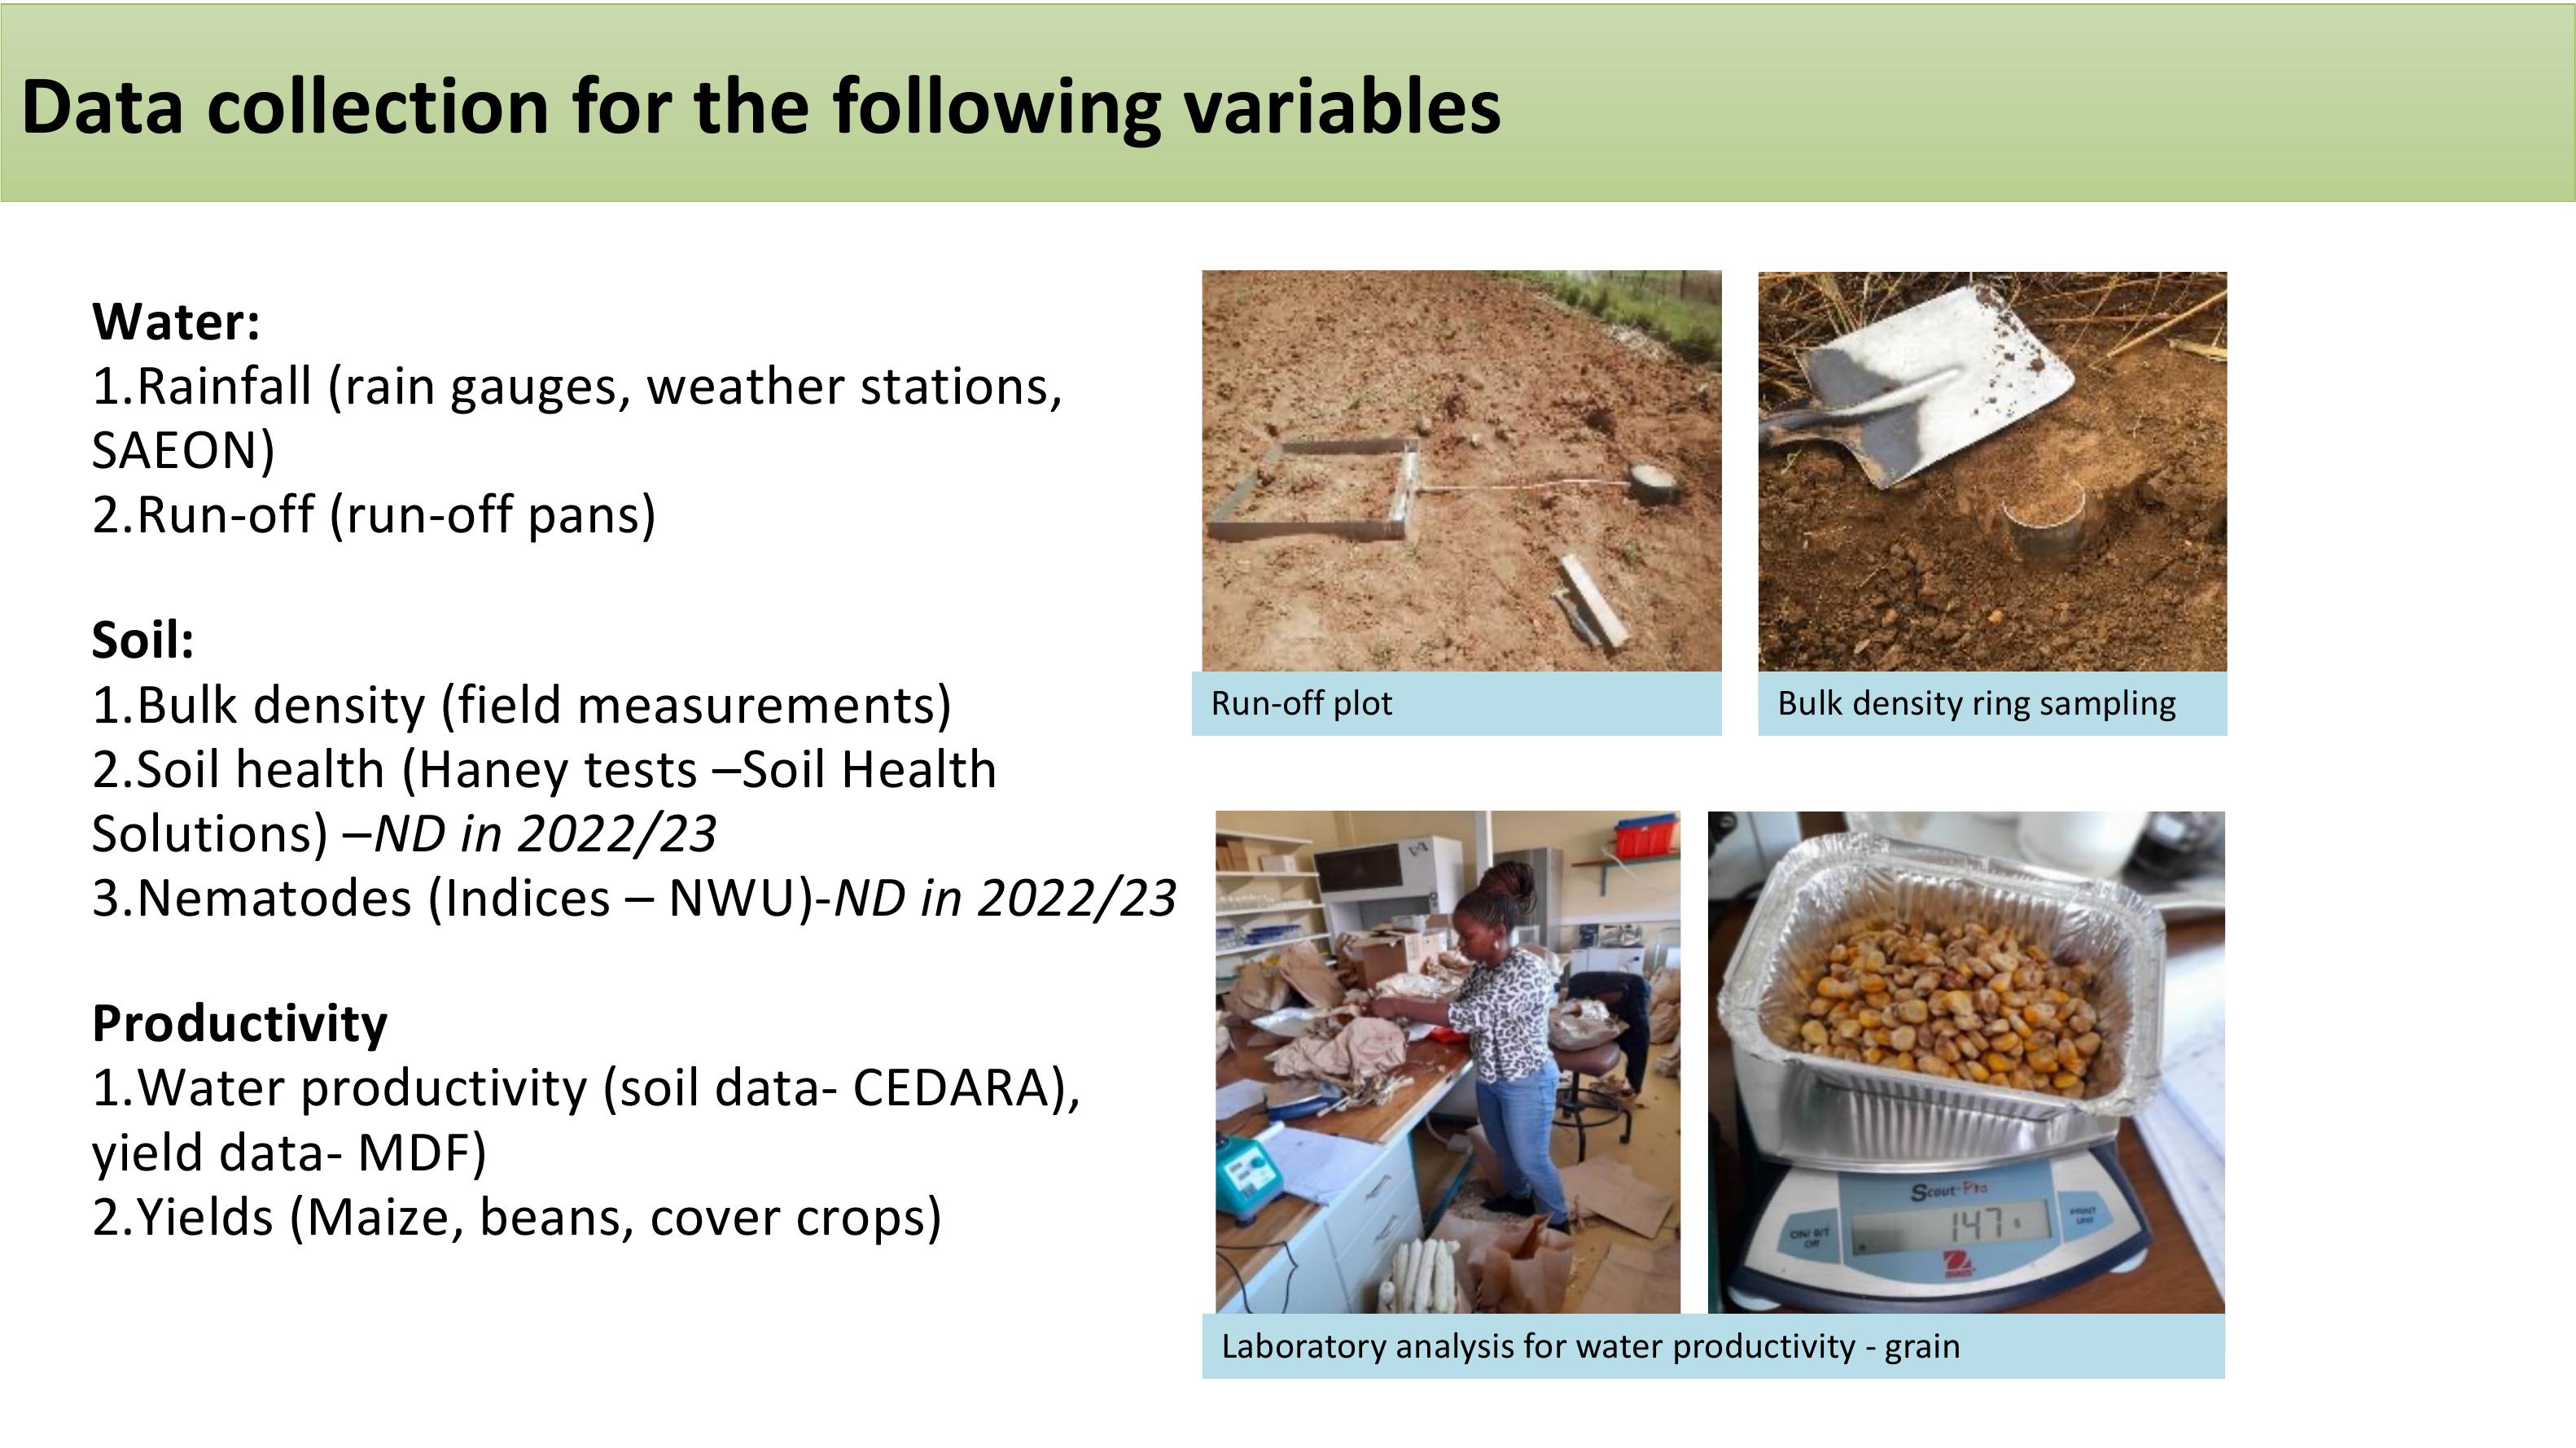
Data collection for the following variables
Water:
1.Rainfall (rain gauges, weather stations,
SAEON)
2.Run-off (run-off pans)
Soil:
1.Bulk density (field measurements)
2.Soil health (Haney tests –Soil Health
Solutions) –ND in 2022/23
3.Nematodes (Indices – NWU)-ND in 2022/23
Productivity
1.Water productivity (soildata- CEDARA),
yield data- MDF)
2.Yields (Maize, beans, cover crops)
Laboratory analysis for water productivity - grain
Bulk density ring samplingRun-off plot
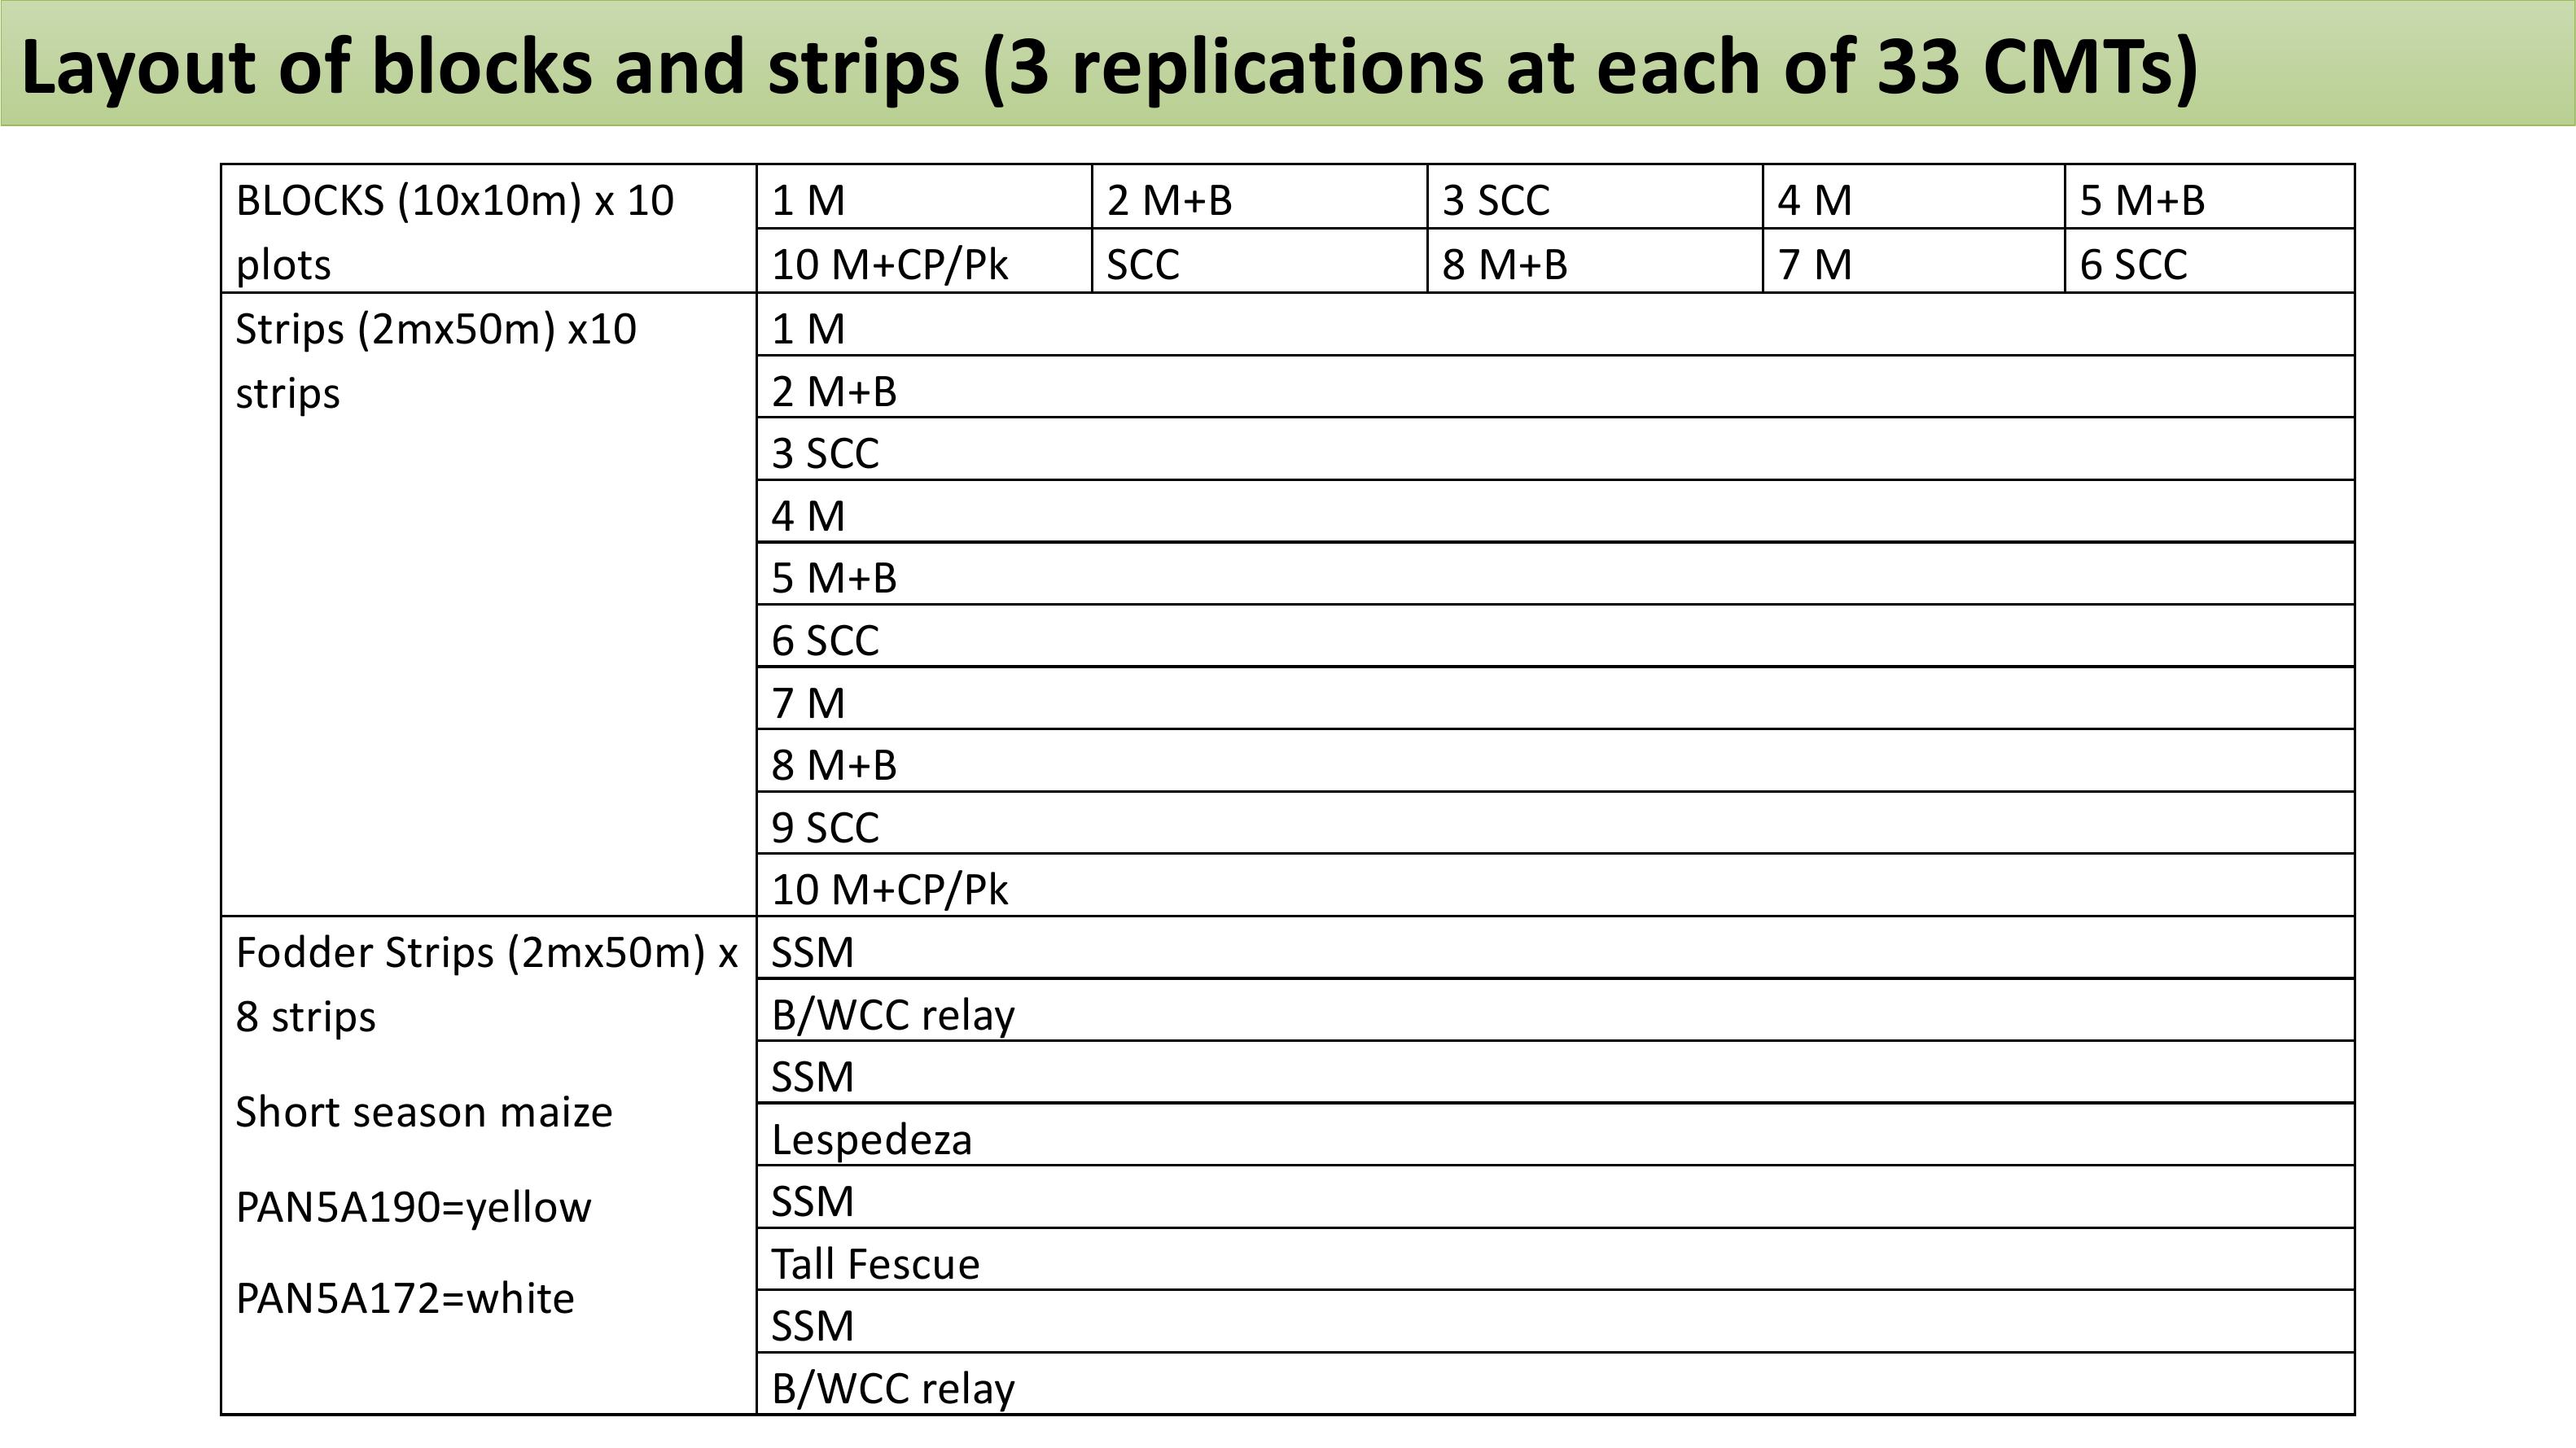
Layout of blocks and strips (3 replications at each of 33 CMTs)
BLOCKS (10x10m) x 10
plots
1
M
2
M+B
3
SCC
4
M
5
M+B
10
M+CP/Pk
SCC
8
M+B
7
M
6
SCC
Strips (2mx50m) x10
strips
1
M
2
M+B
3
SCC
4
M
5
M+B
6
SCC
7
M
8
M+B
9
SCC
10
M+CP/Pk
FodderStrips (2mx50m) x
8 strips
Short season maize
PAN5A190=yellow
PAN5A172=white
SSM
B/WCC
relay
SSM
Lespedeza
SSM
Tall
Fescue
SSM
B/WCC
relay
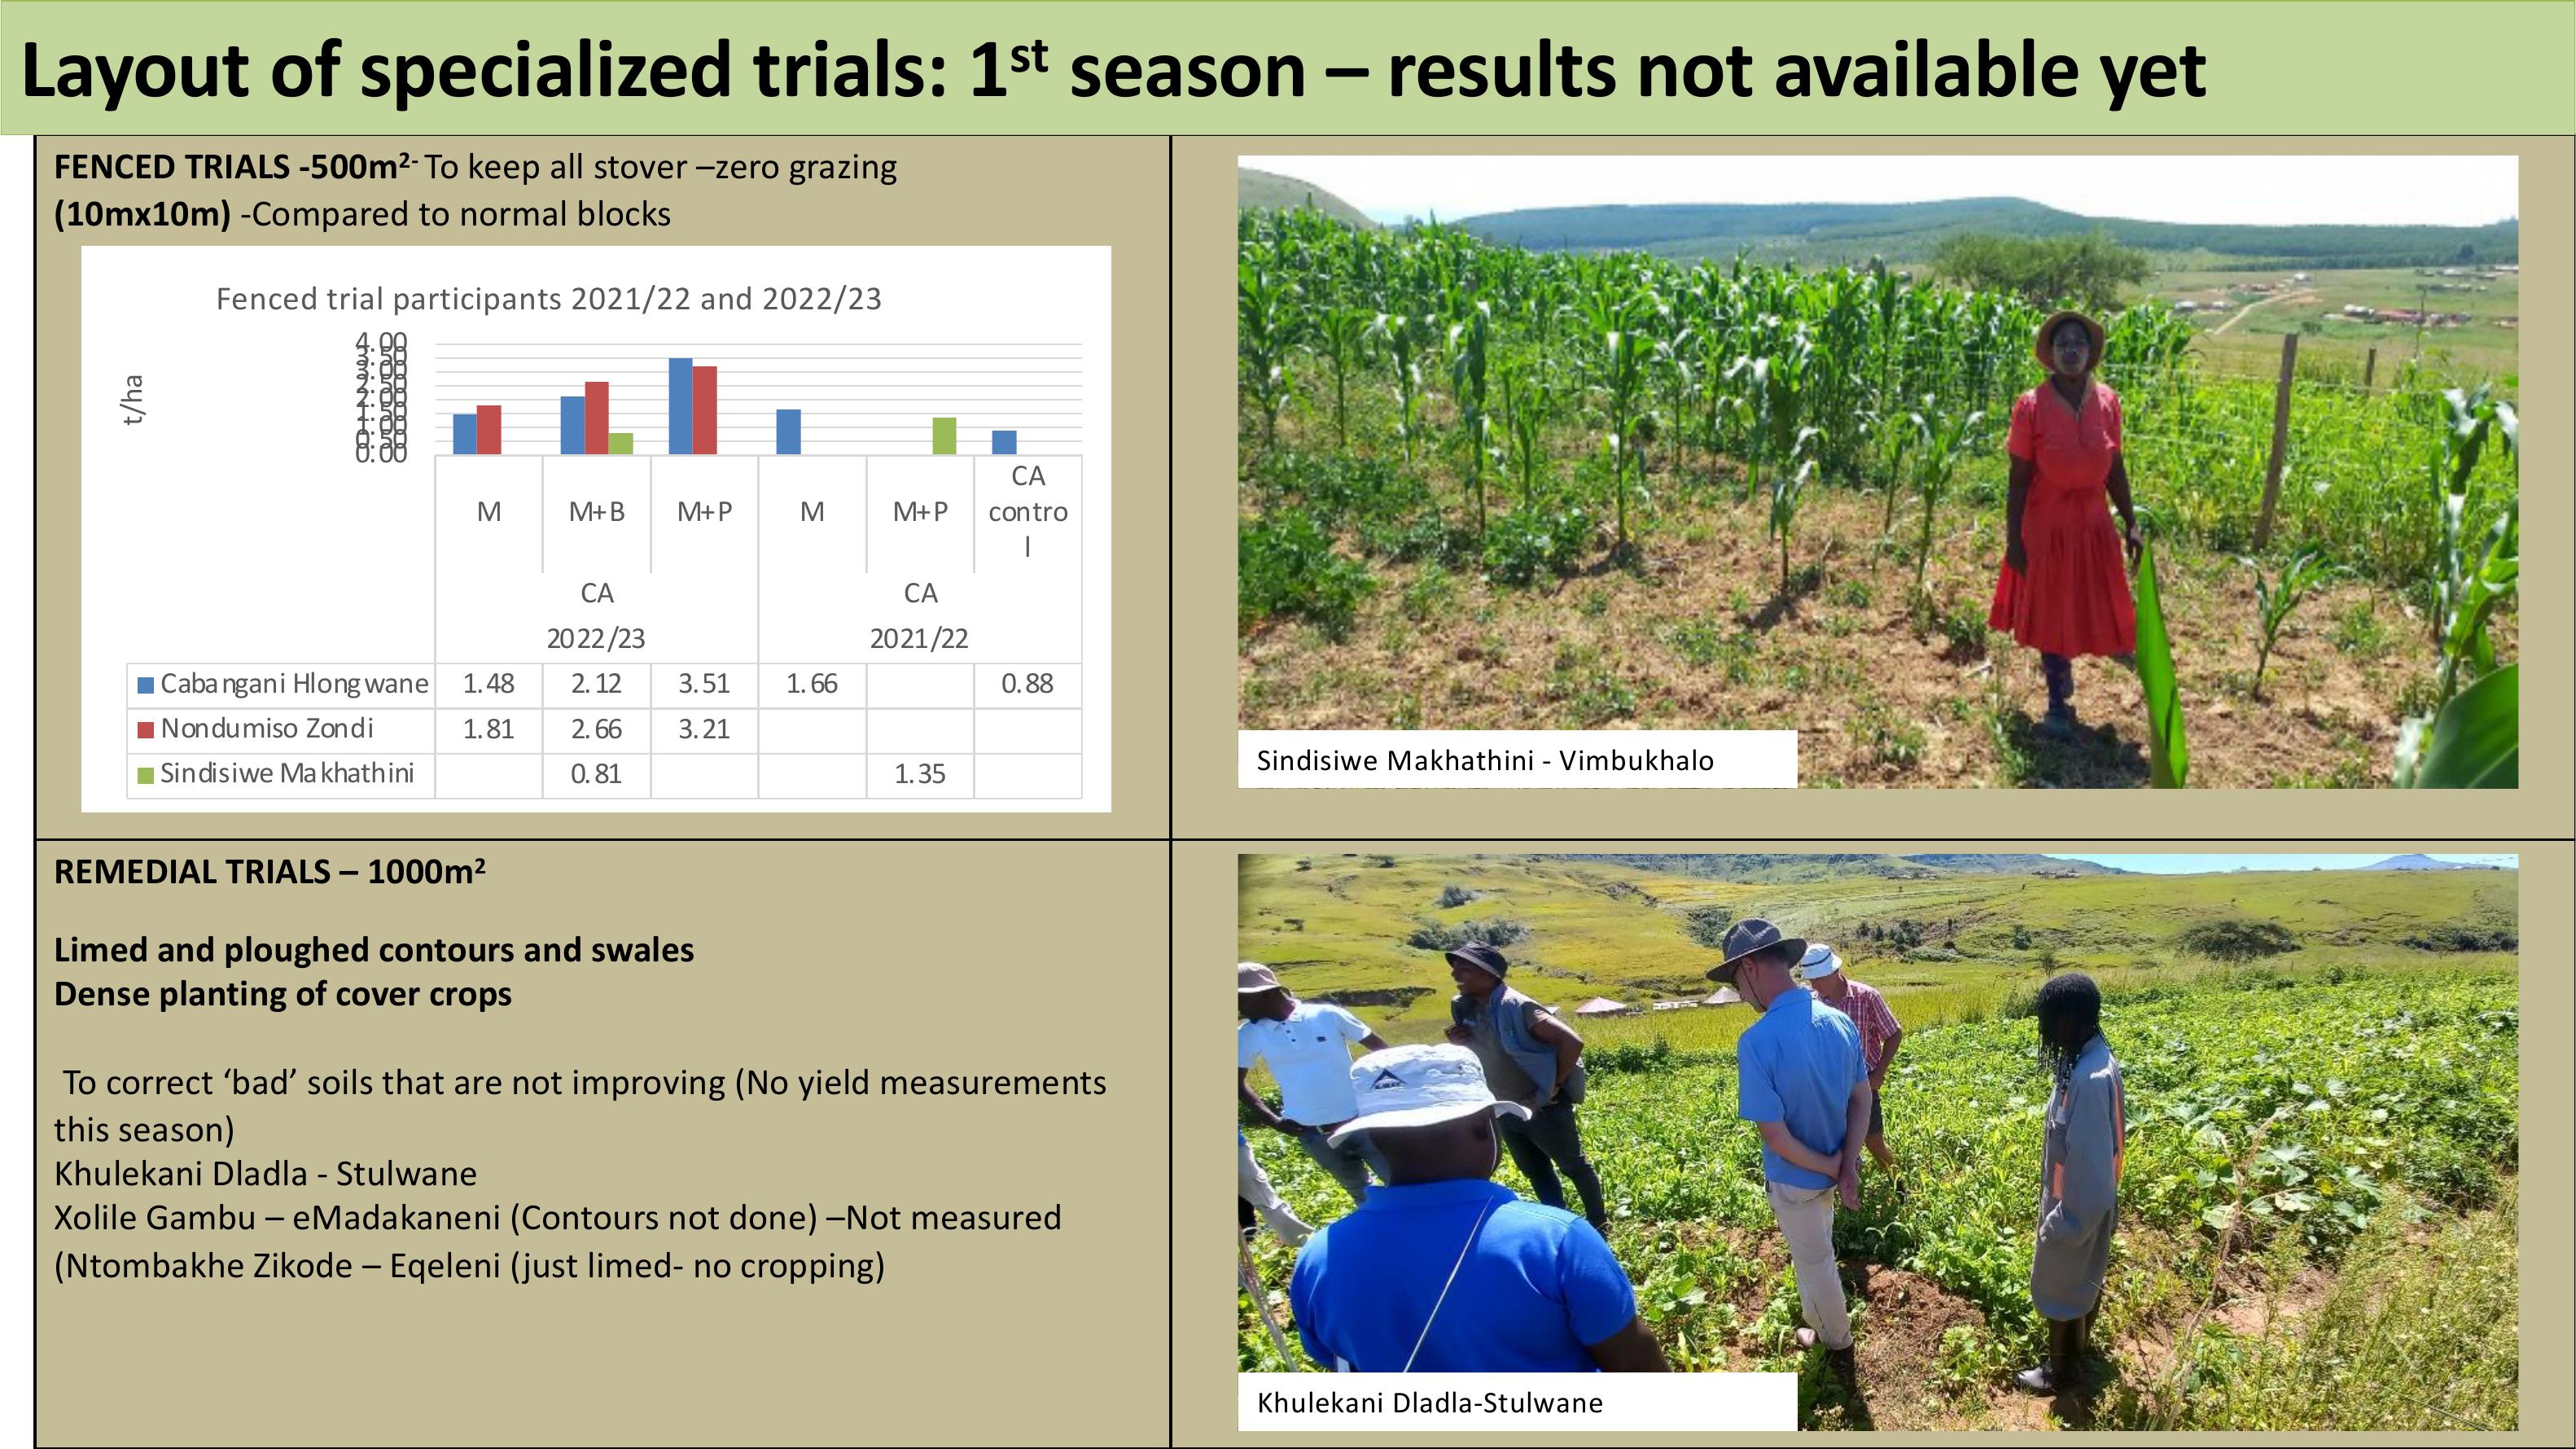
FENCED TRIALS
-500m2-Tokeepallstover–zerograzing
(10mx10m)
-Compared to normal blocks
REMEDIAL TRIALS
– 1000m2
Limed and ploughed contours and swales
Dense planting of cover crops
Tocorrect‘bad’soilsthatarenotimproving(Noyieldmeasurements
this season)
Khulekani
Dladla - Stulwane
Xolile
Gambu – eMadakaneni(Contours not done) –Not measured
(
NtombakheZikode – Eqeleni(just limed- no cropping)
Layout of specialized trials: 1stseason –resultsnotavailable yet
MM+ BM+ PMM+ P
CA
contro
l
CA CA
2022/23 2021/22
Cabangani Hlongwane1. 482. 123. 511. 660. 88
Nondumiso Zondi1. 812. 663. 21
Sindisiwe Makhathini0. 811. 35
0. 00
0. 50
1. 00
1. 50
2. 00
2. 50
3. 00
3. 50
4. 00
t/ha
Fenced trial participants 2021/22 and 2022/23
SindisiweMakhathini - Vimbukhalo
KhulekaniDladla-Stulwane
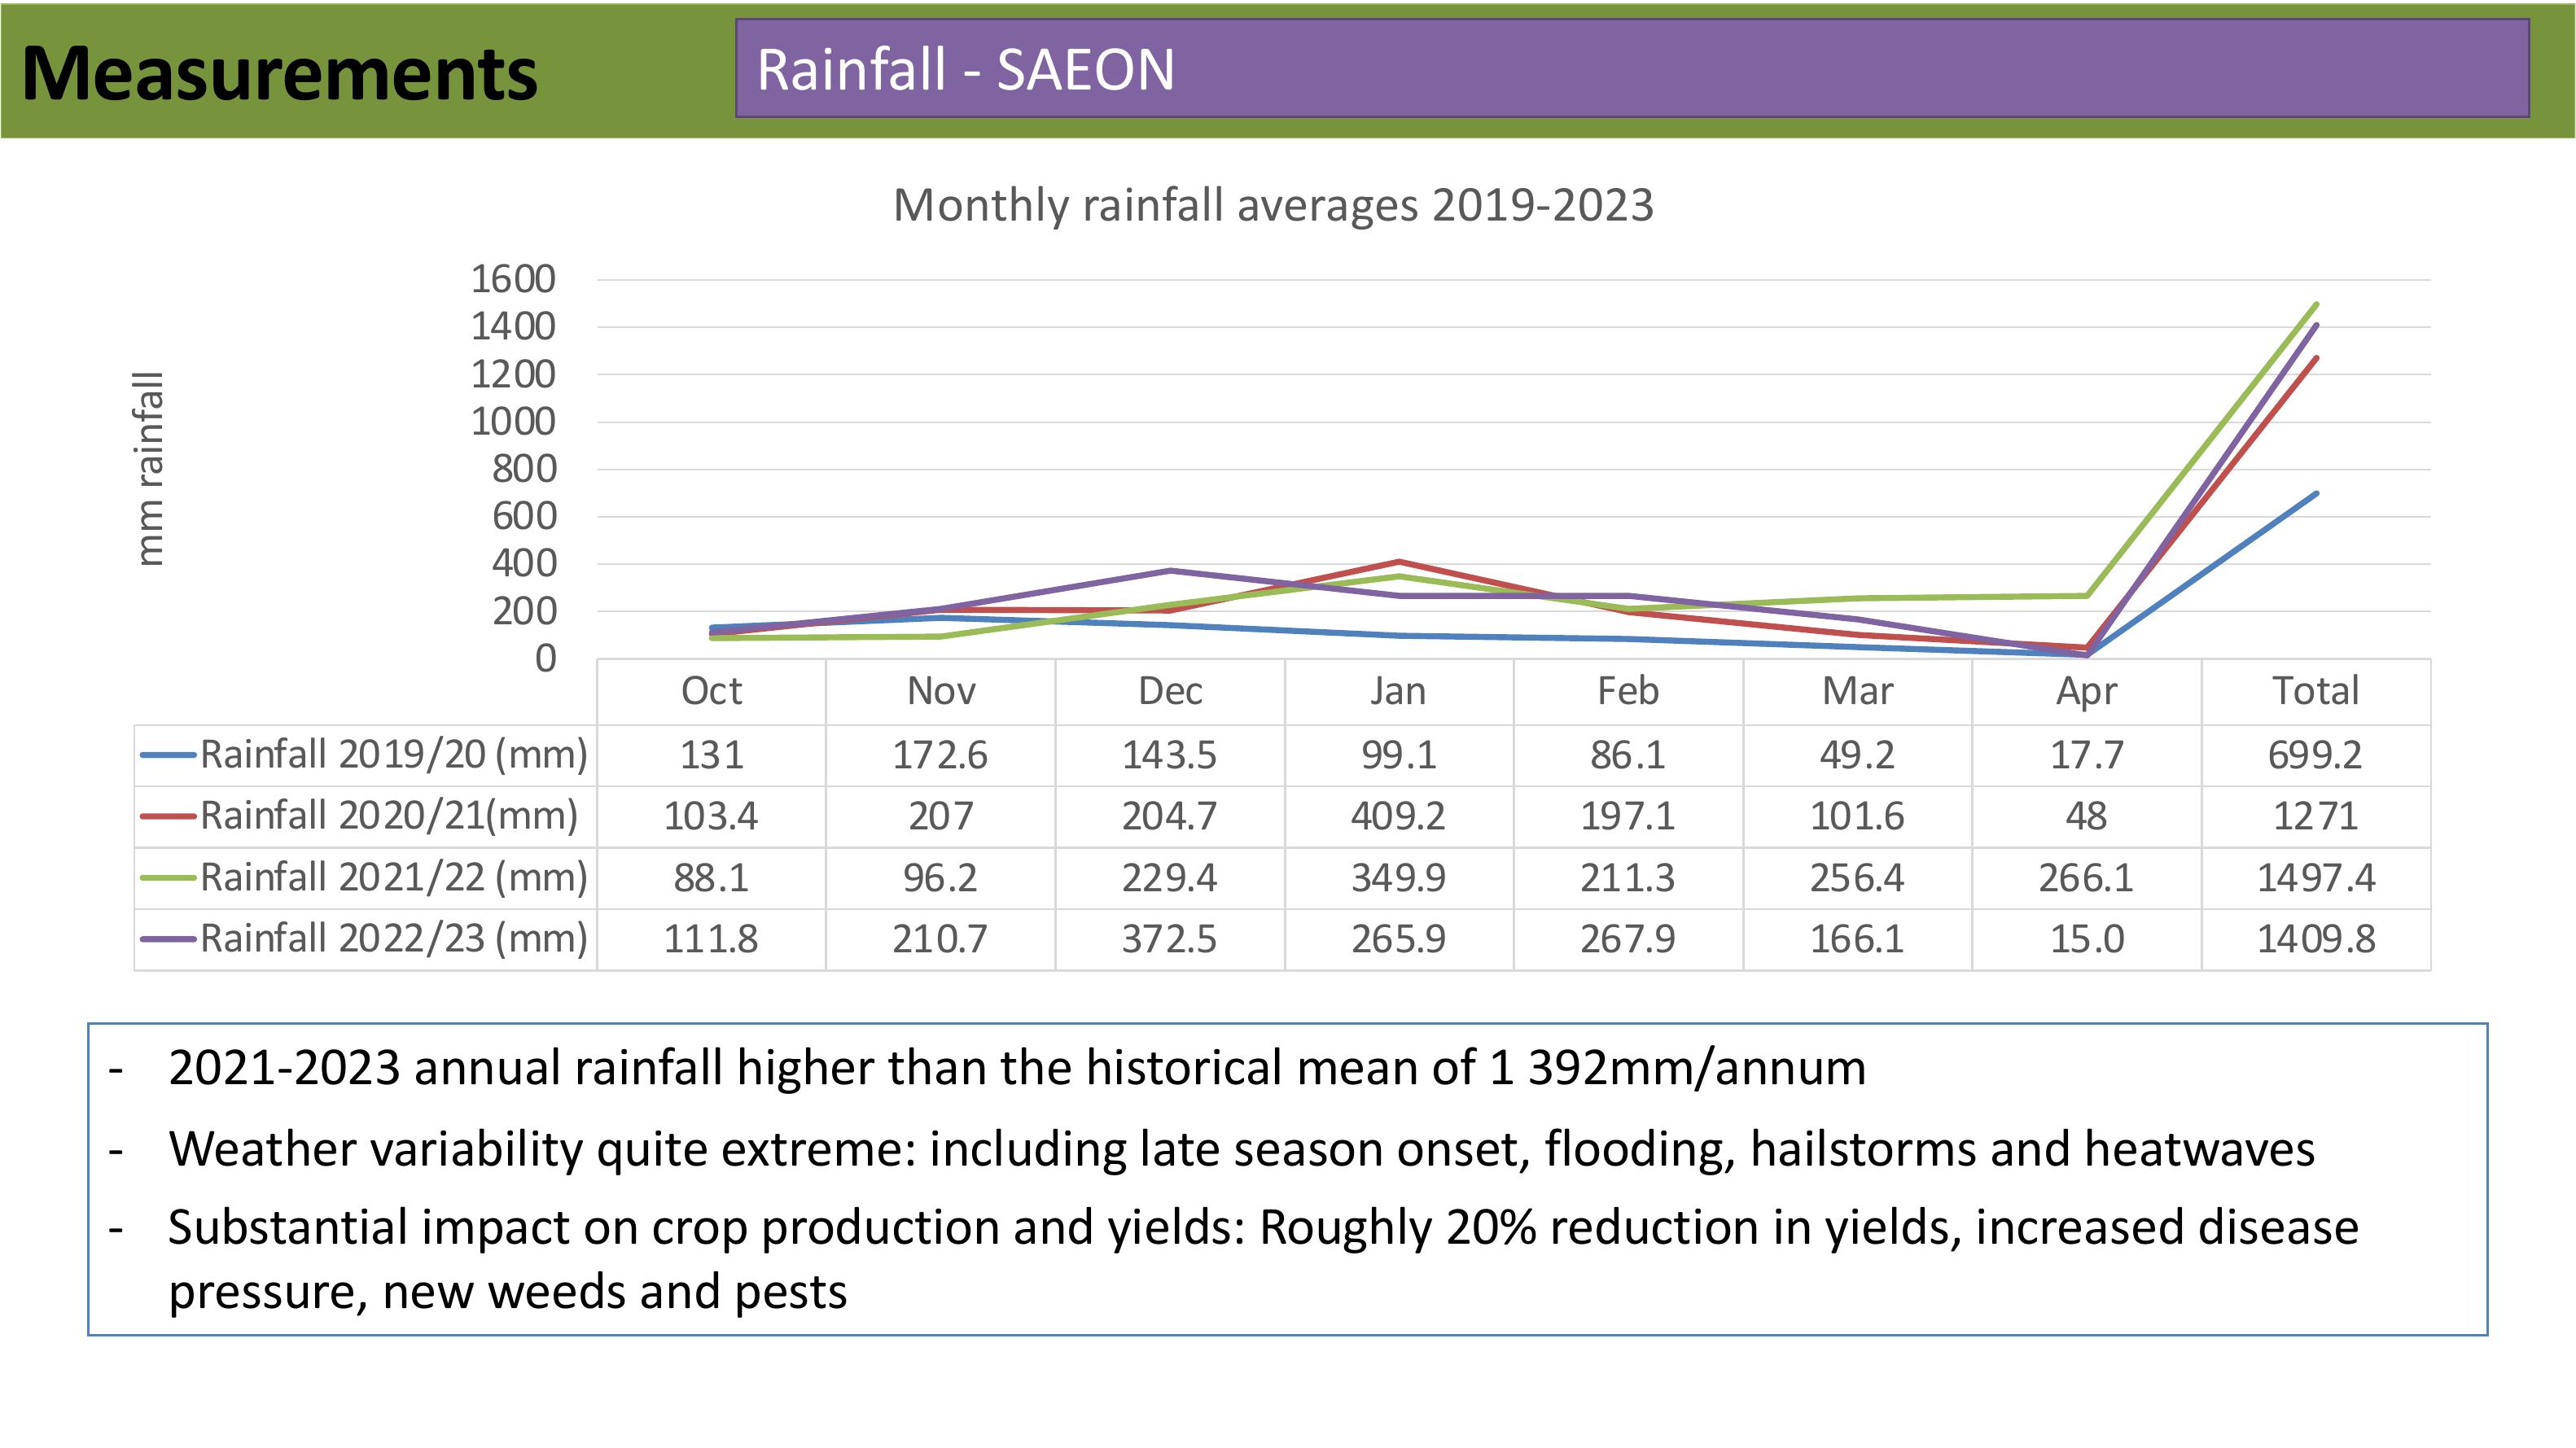
Measurements
-2021-2023 annual rainfall higher than the historical mean of 1 392mm/annum
-Weathervariabilityquiteextreme:includinglateseasononset,flooding,hailstormsandheatwaves
-Substantial impact on crop production and yields: Roughly 20% reduction in yields, increased disease
pressure, new weeds and pests
Rainfall - SAEON
Oct Nov Dec Jan Feb Mar Apr Total
Rainfall 2019/20 (mm)131172.6143.599.1 86.1 49.2 17.7699.2
Rainfall 2020/21(mm)103.4207204.7 409.2 197.1 101.6481271
Rainfall 2021/22 (mm)88.196.2229.4 349.9 211.3 256.4 266.11497.4
Rainfall 2022/23 (mm)111.8 210.7 372.5 265.9 267.9 166.115.01409.8
0
200
400
600
800
1000
1200
1400
1600
mm rainfall
Monthly rainfall averages 2019-2023
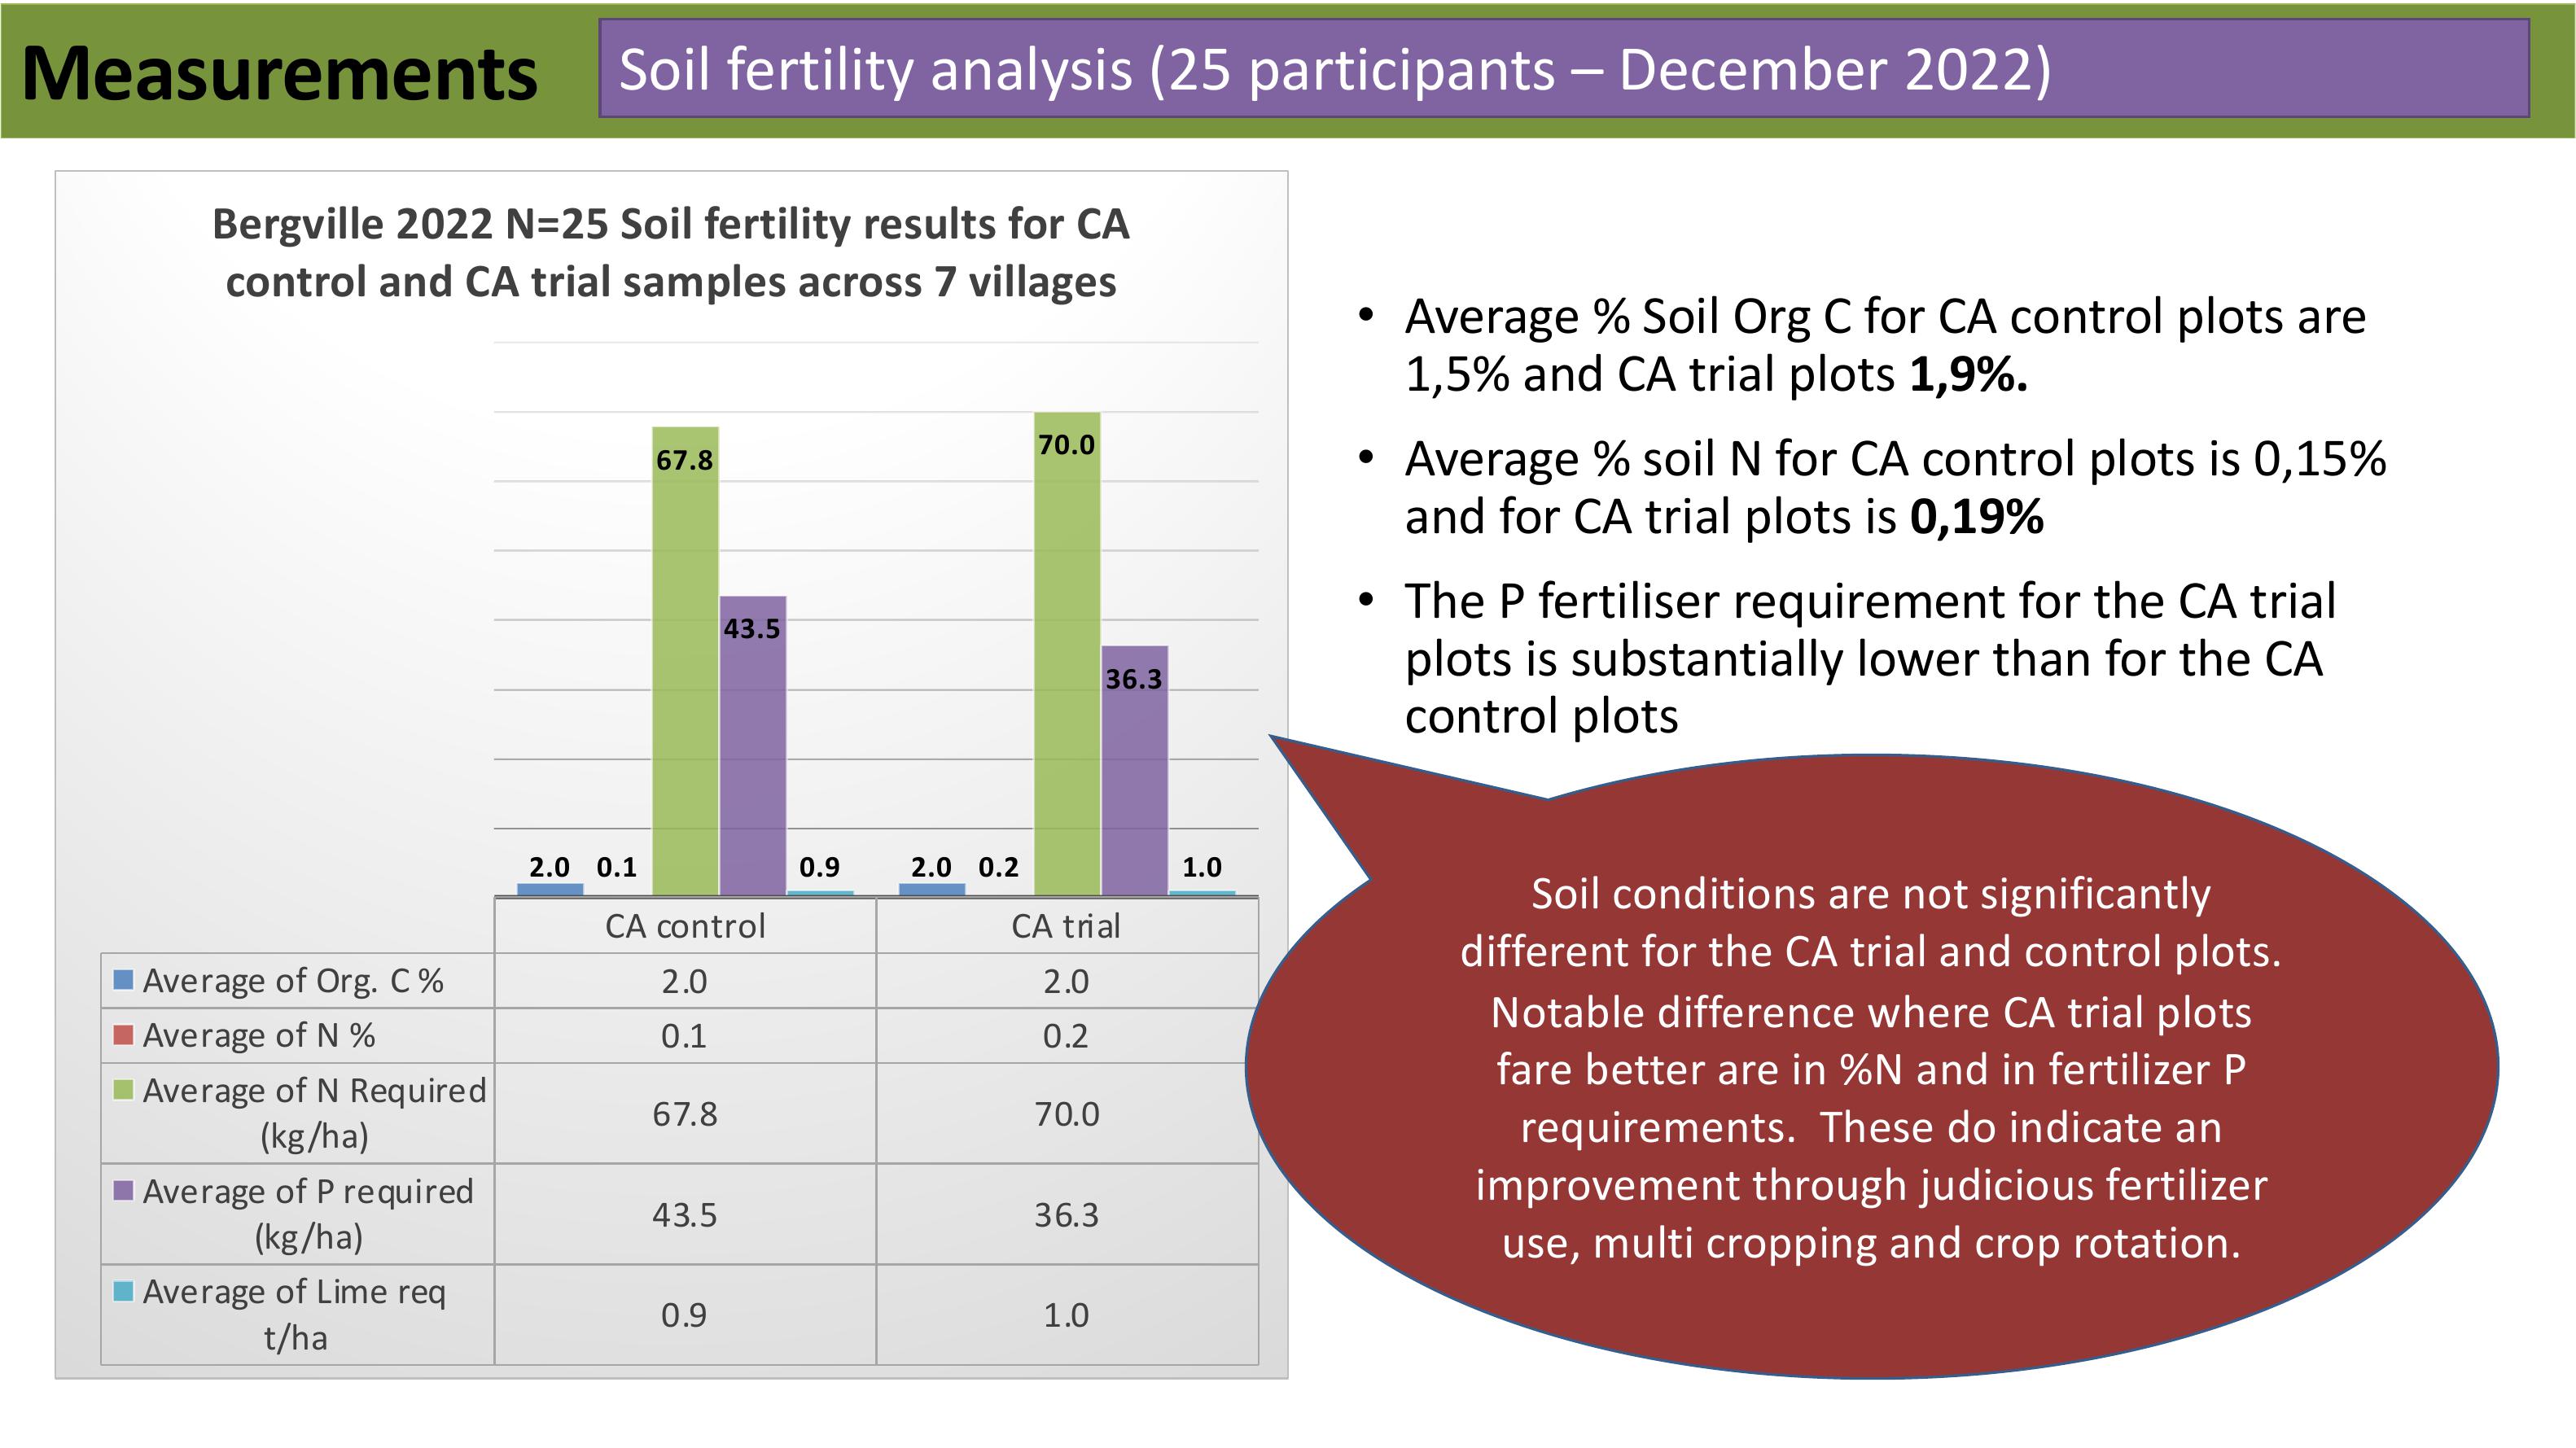
•Average%SoilOrgCforCA control plotsare
1,5% and CA trial plots 1,9%.
•Average%soilNforCAcontrol plotsis0,15%
and for CA trial plots is 0,19%
•The P fertiliser requirement for the CA trial
plots is substantially lower than for the CA
control plots
CAcontrolCAtrial
Average of Org.C %2.0 2.0
Average of N %0.1 0.2
Average of N Required
(kg/ha) 67.8 70.0
Average of P required
(kg/ha) 43.5 36.3
Average of Lime req
t/ha 0.9 1.0
2.0 2.00.1 0.2
67.8 70.0
43.5
36.3
0.9 1.0
Bergville 2022 N=25 Soil fertility results for CA
control and CA trial samples across 7 villages
Measurements Soil fertility analysis (25 participants – December 2022)
Soil conditions are not significantly
different for the CA trial and control plots.
Notable difference where CA trial plots
farebetter arein %NandinfertilizerP
requirements.Thesedoindicatean
improvement through judicious fertilizer
use, multi cropping and crop rotation.
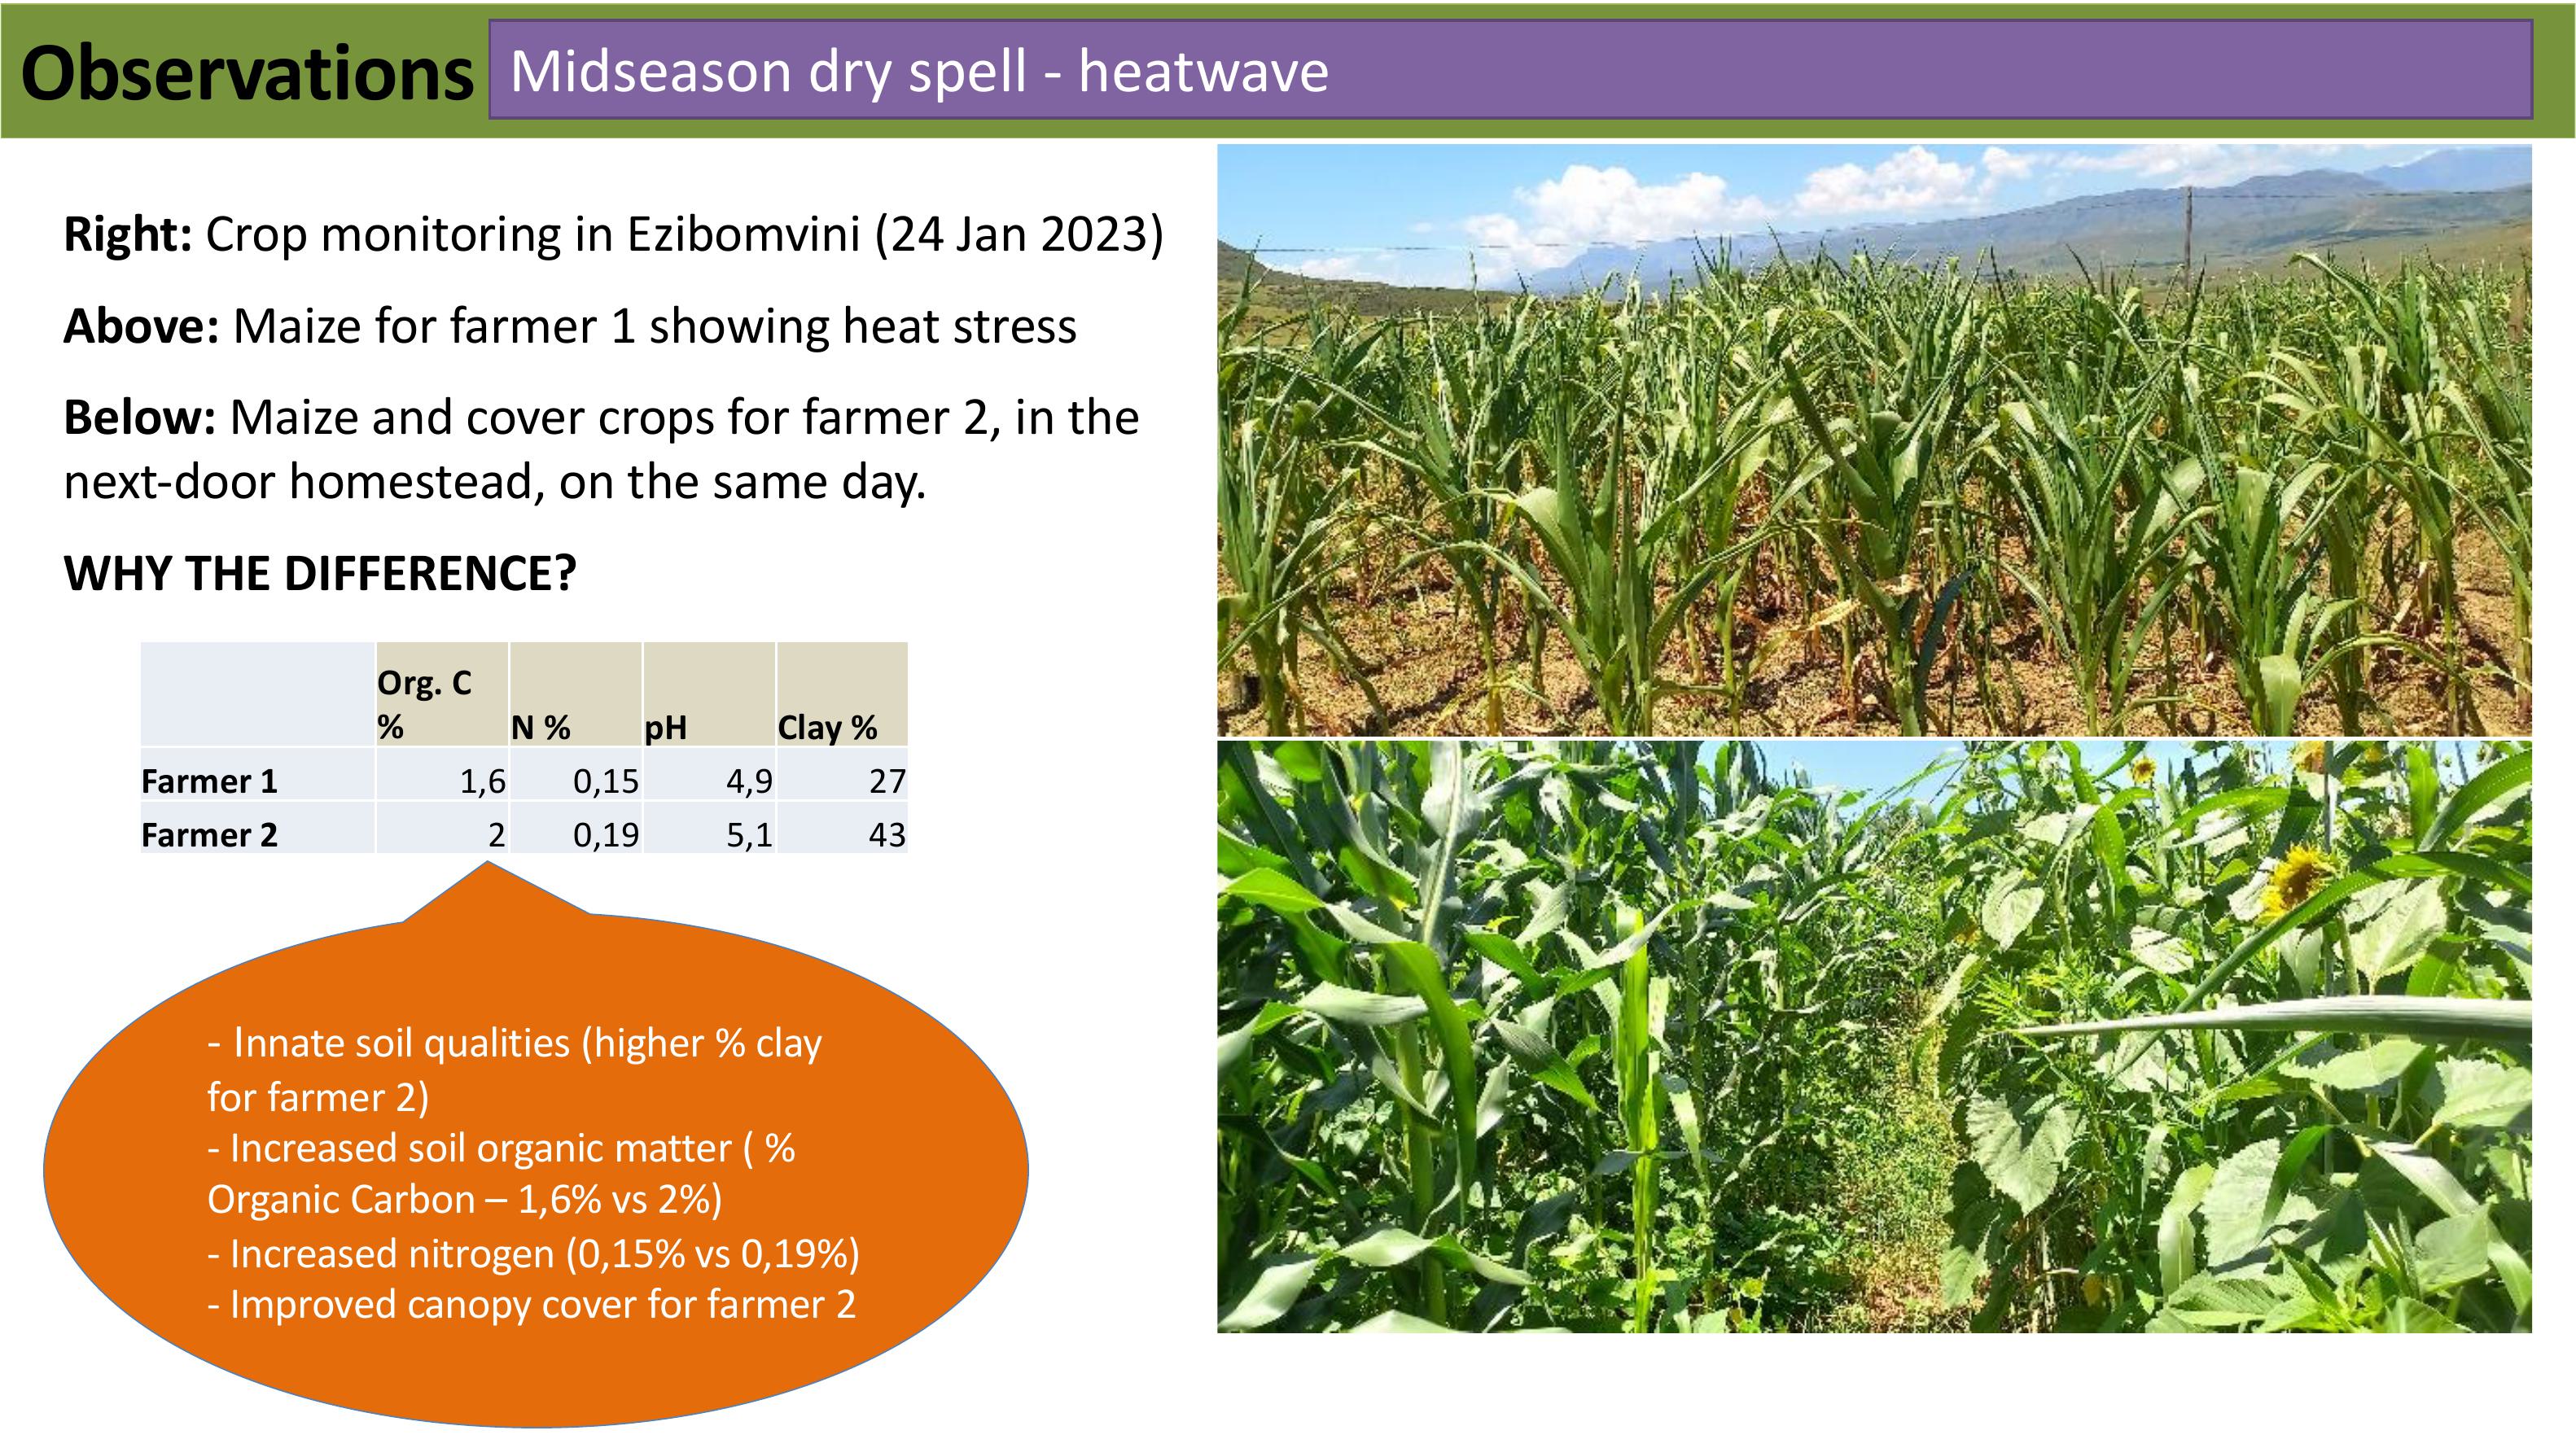
Right: Crop monitoring in Ezibomvini(24 Jan 2023)
Above: Maize for farmer 1 showing heat stress
Below: Maize and cover crops for farmer 2, in the
next-door homestead, on the same day.
WHY THE DIFFERENCE?
Observations Midseason dry spell - heatwave
- Innate soil qualities (higher % clay
for farmer 2)
- Increased soil organic matter ( %
Organic Carbon – 1,6% vs 2%)
- Increased nitrogen (0,15% vs 0,19%)
- Improved canopy cover for farmer 2
Org. C
%
N %
pH
Clay %
Farmer 1
1,6
0,15
4,9
27
Farmer 2
2
0,19
5,1
43
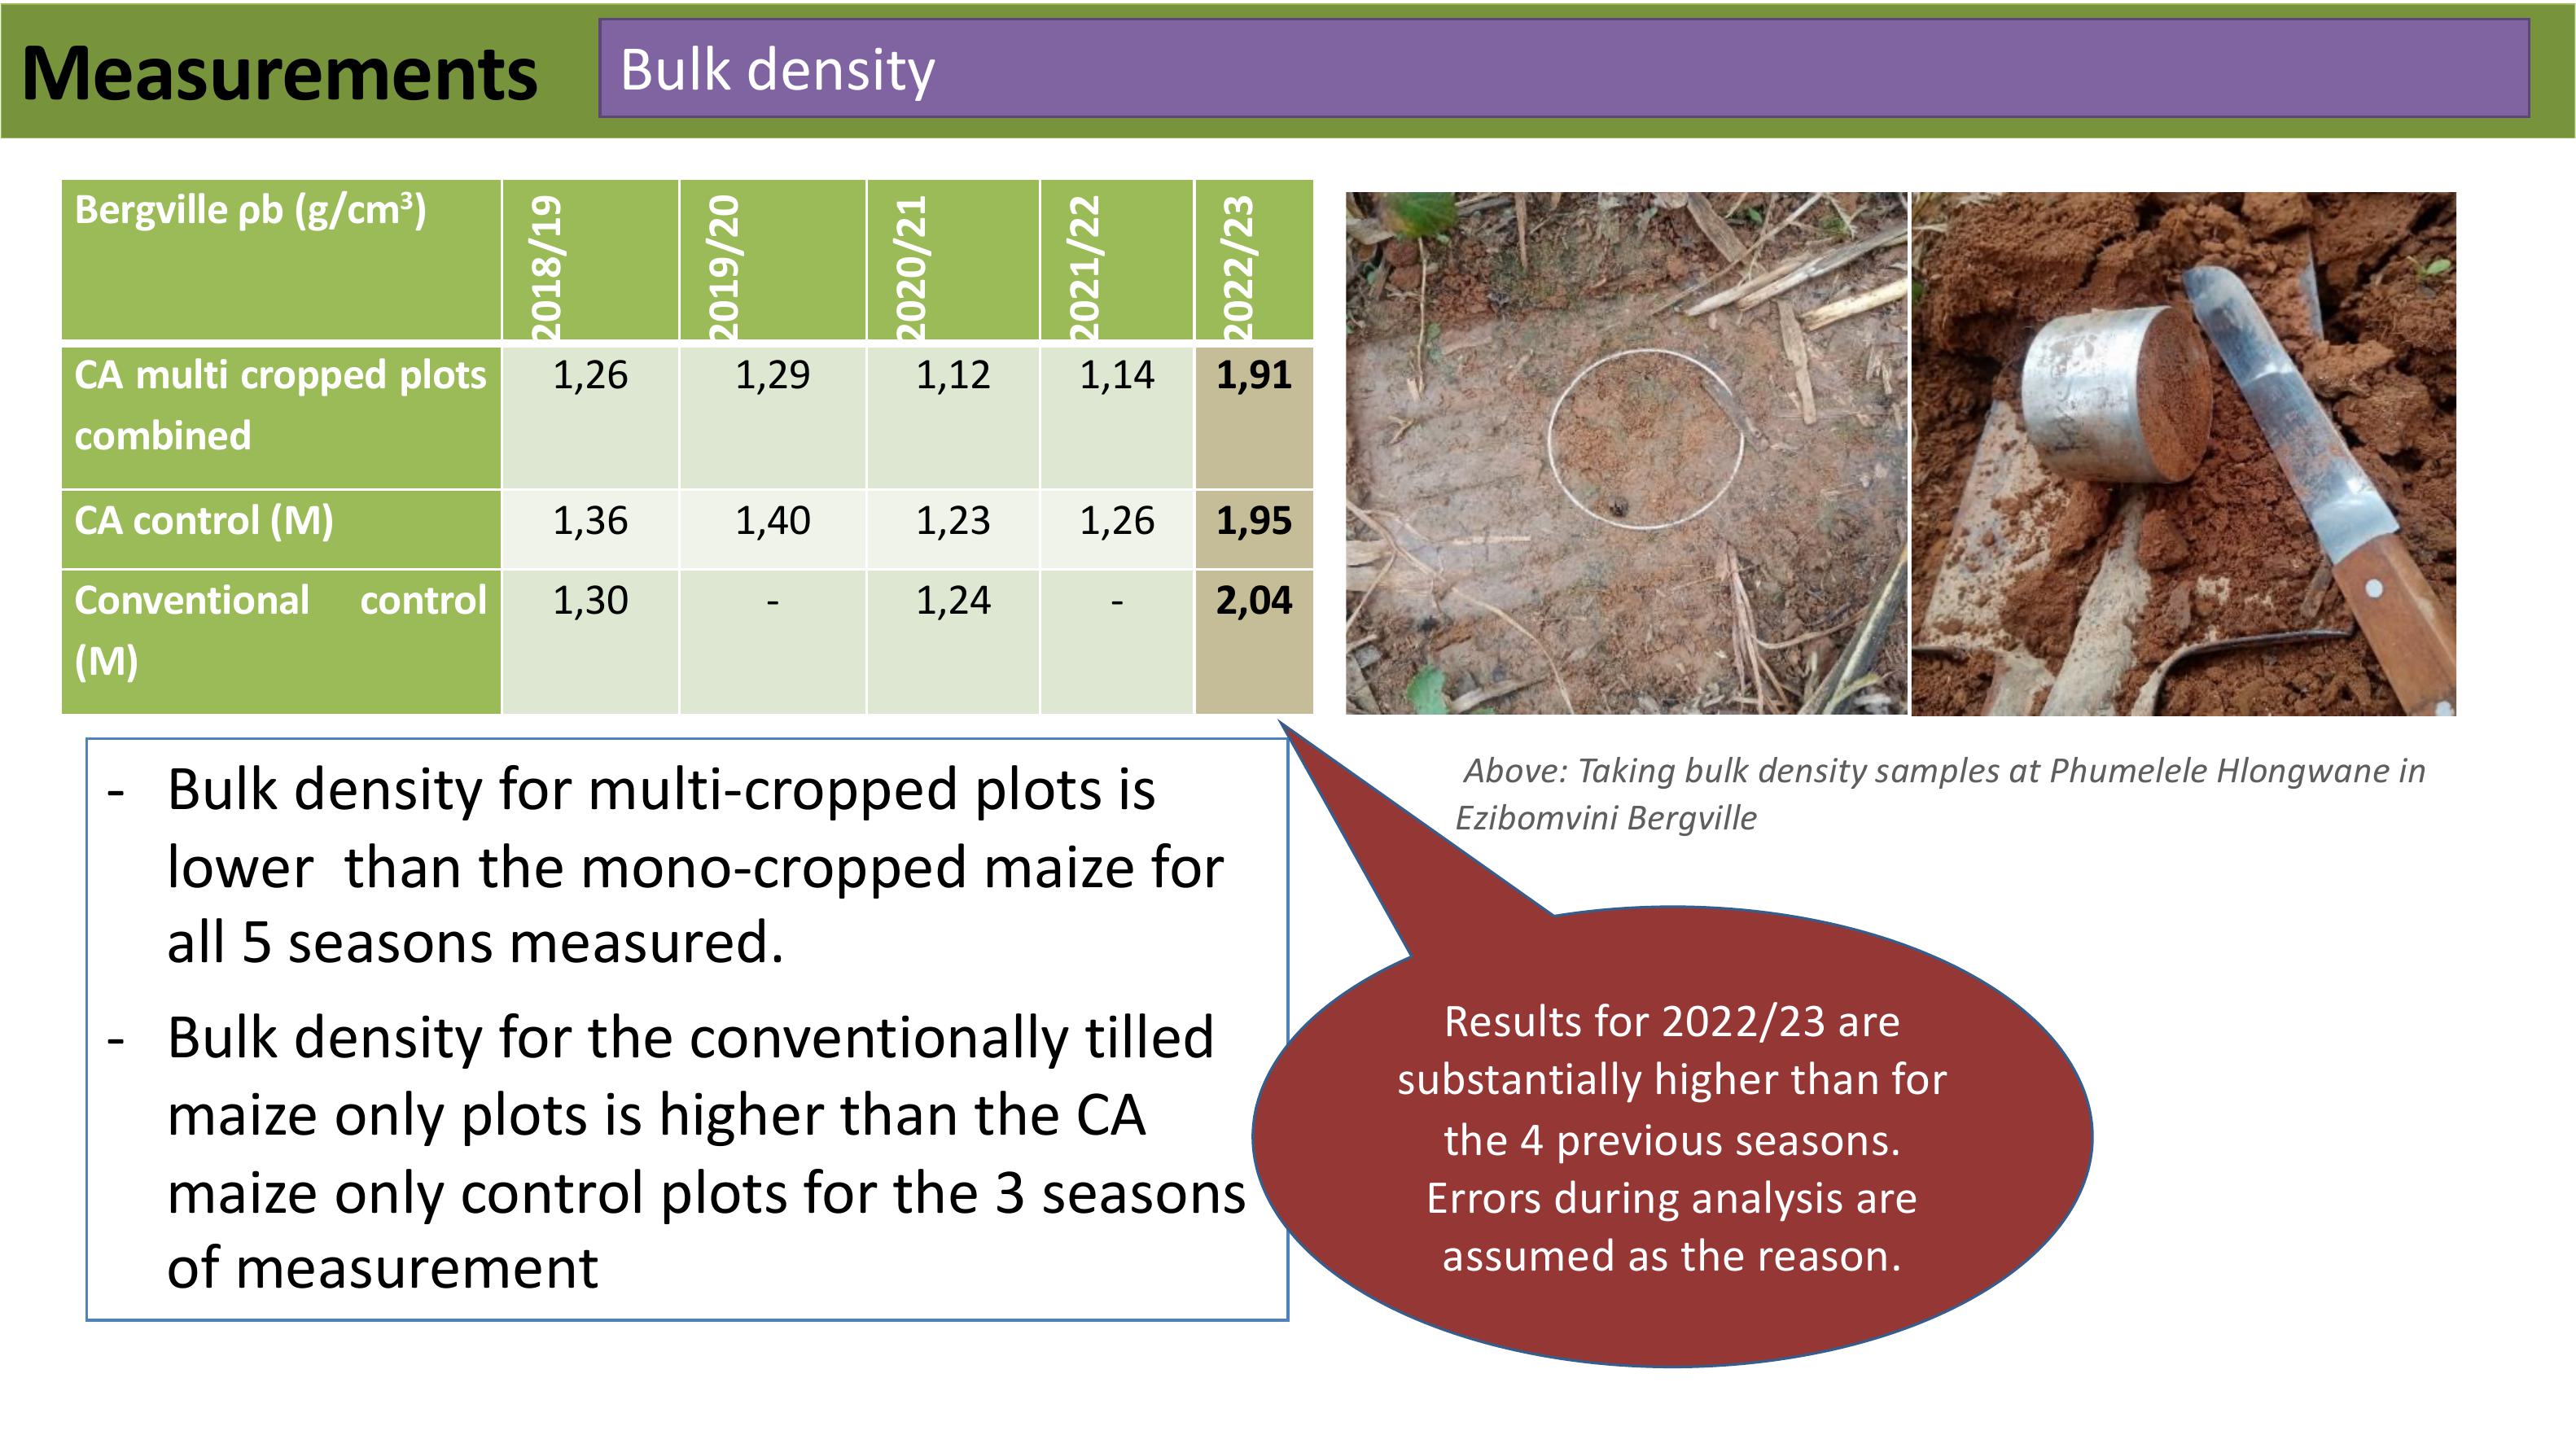
-Bulk density for multi-cropped plots is
lower than the mono-cropped maize for
all 5 seasons measured.
-Bulk density for the conventionally tilled
maize only plots is higher than the CA
maize only control plots for the 3 seasons
of measurement
Above: Taking bulk density samples at PhumeleleHlongwane in
EzibomviniBergville
Measurements Bulk density
Resultsfor2022/23are
substantially higher than for
the 4 previous seasons.
Errors during analysis are
assumed as the reason.
Bergville
ρb(g/cm3)
2018
/
19
2019
/
20
2020
/
21
2021
/
22
2022
/
23
CA
multicropped
plots
combined
1,261,291,12 1,14
1,91
CA
control(M) 1,361,401,23 1,26
1,95
Conventional
control
(M)
1,30 -1,24 -
2,04
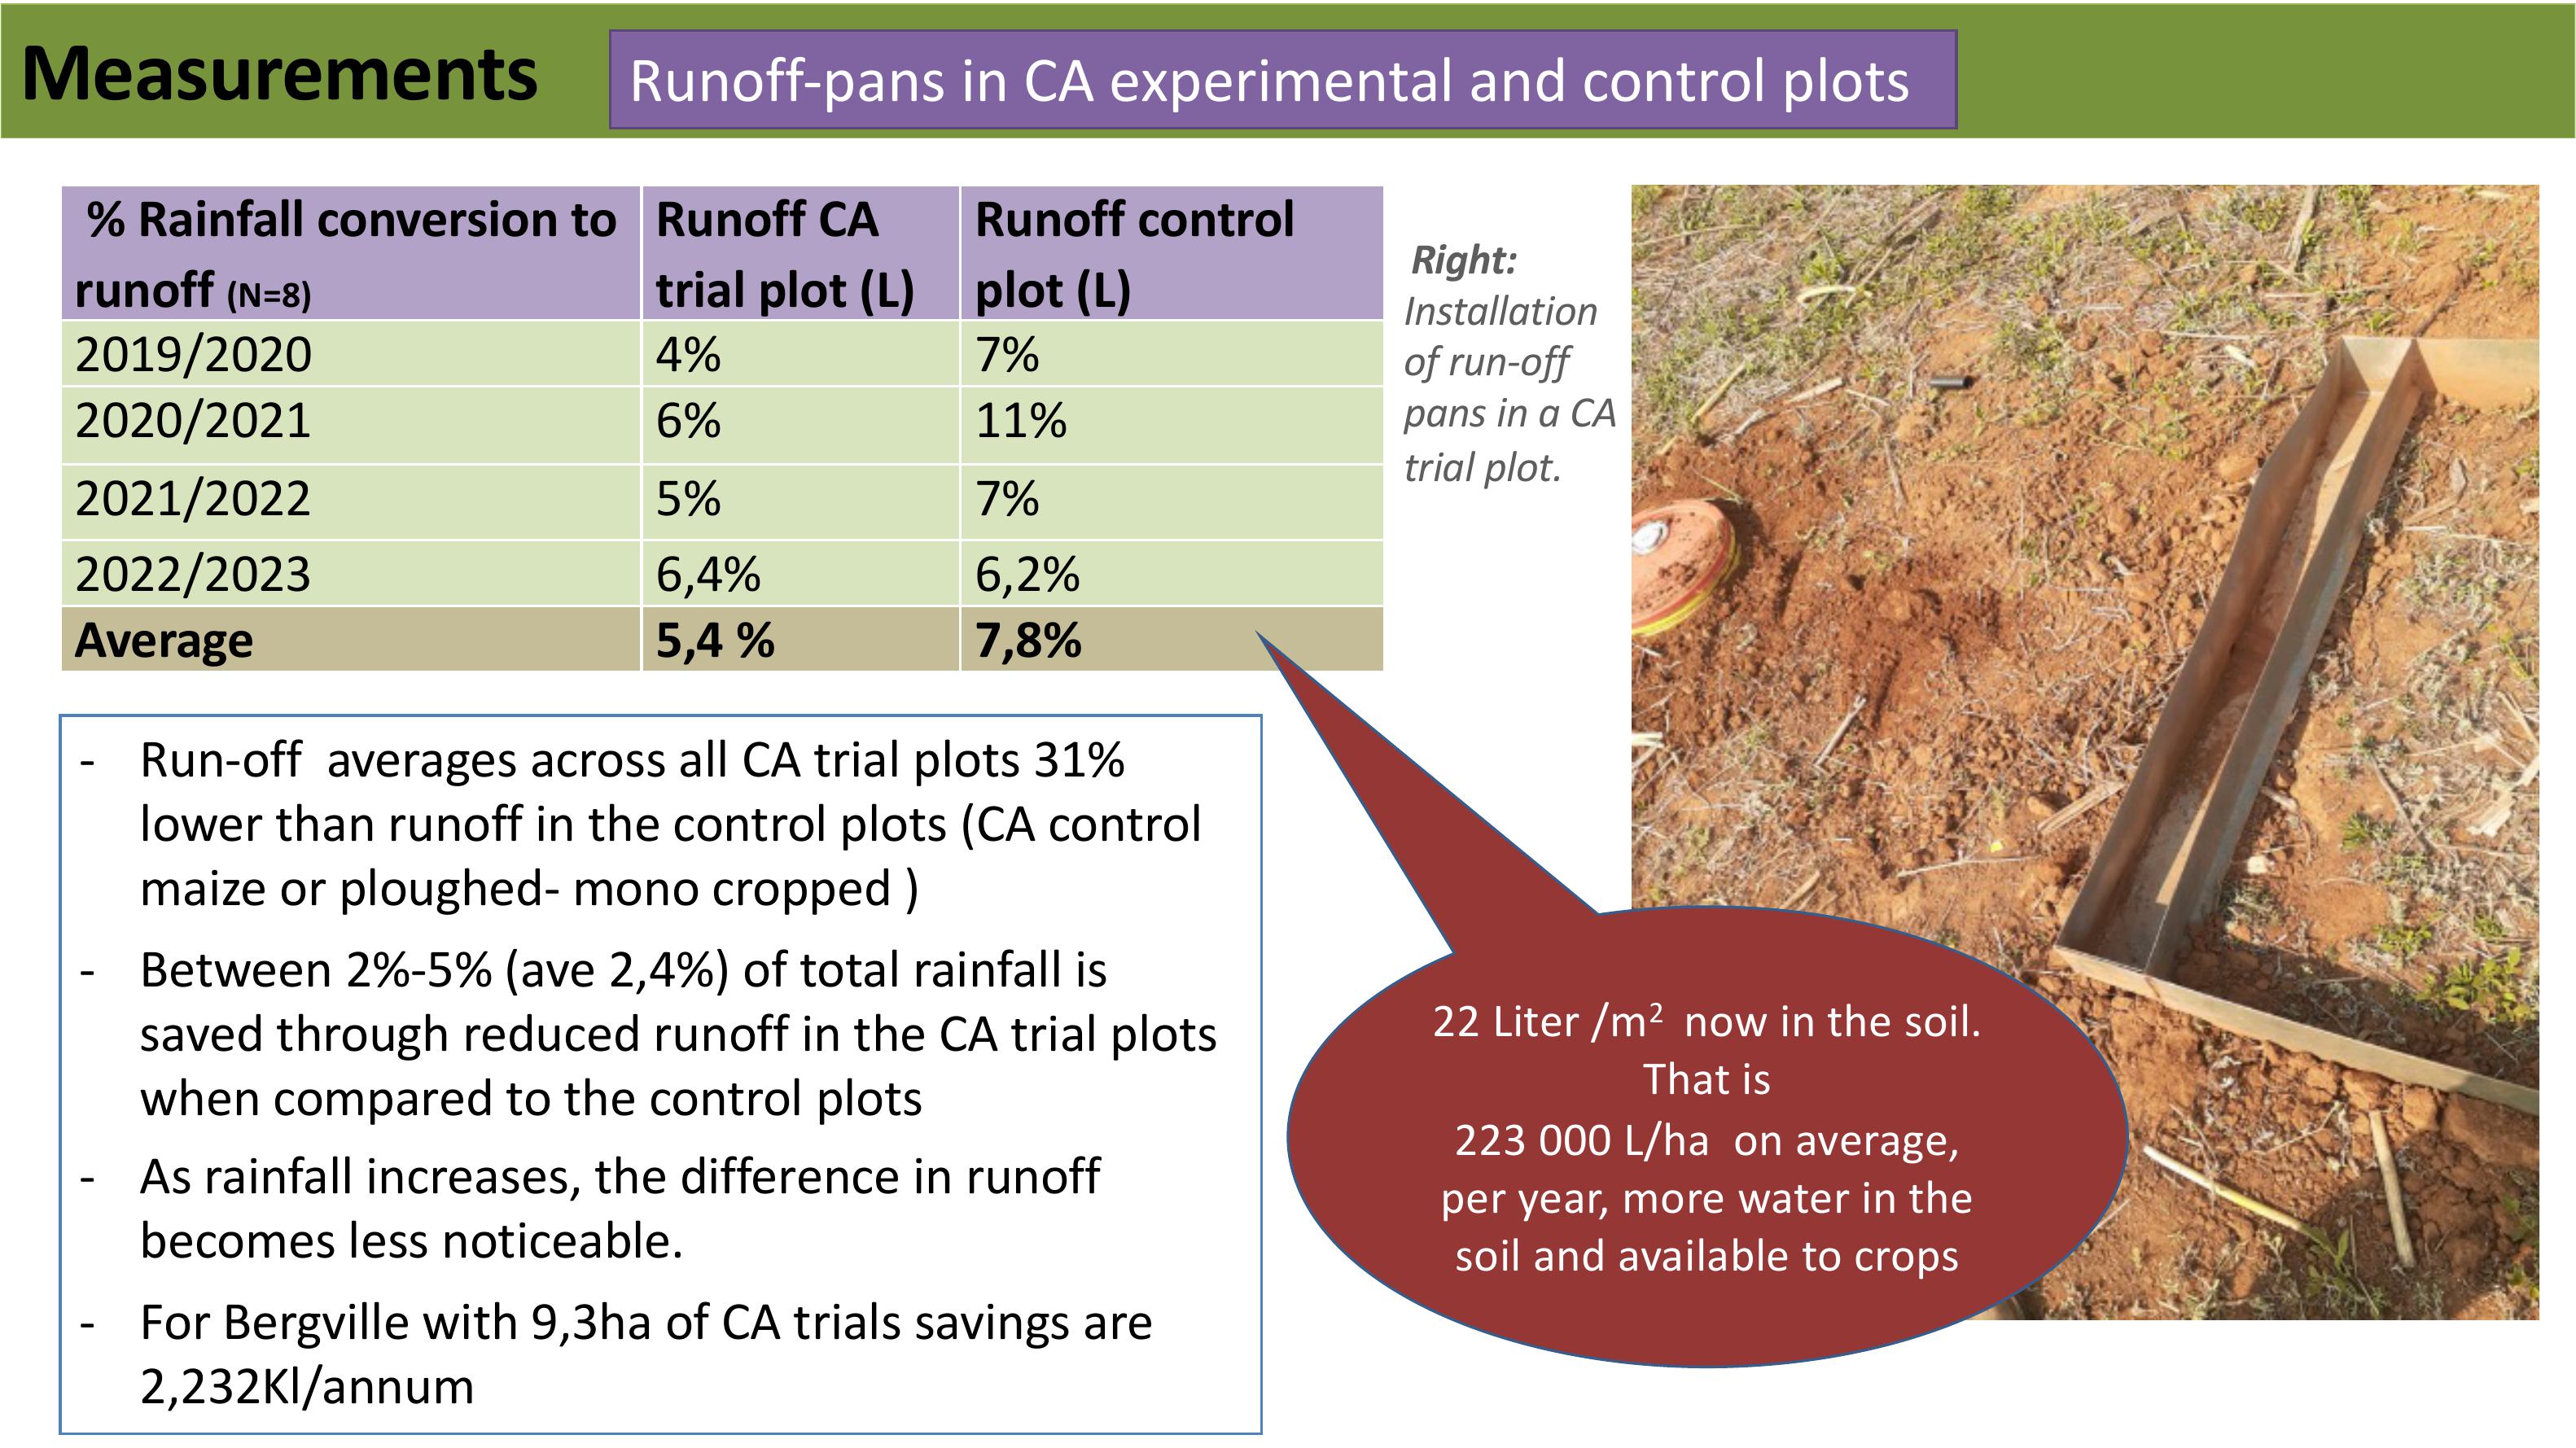
-Run-off averages across all CA trial plots 31%
lower than runoff in the control plots (CA control
maize or ploughed- mono cropped )
-Between 2%-5% (ave2,4%) of total rainfall is
saved through reduced runoff in the CA trial plots
when compared to the control plots
-As rainfall increases, the difference in runoff
becomes less noticeable.
-For Bergville with 9,3ha of CA trials savingsare
2,232Kl/annum
Right:
Installation
of run-off
pans in a CA
trial plot.
Measurements Runoff-pans in CA experimental and control plots
% Rainfall conversion to
runoff
(N=8)
Runoff CA
trial plot (L)
Runoff control
plot (L)
2019
/2020
4
%
7
%
2020
/2021
6
%
11
%
2021
/2022
5
%
7
%
2022
/2023
6
,4%
6
,2%
Average
5
,4 %
7
,8%
22 Liter /m2 now in the soil.
That is
223 000 L/ha on average,
per year, more water in the
soil and available to crops
Measurements and results
Waterproductivityfieldcropping
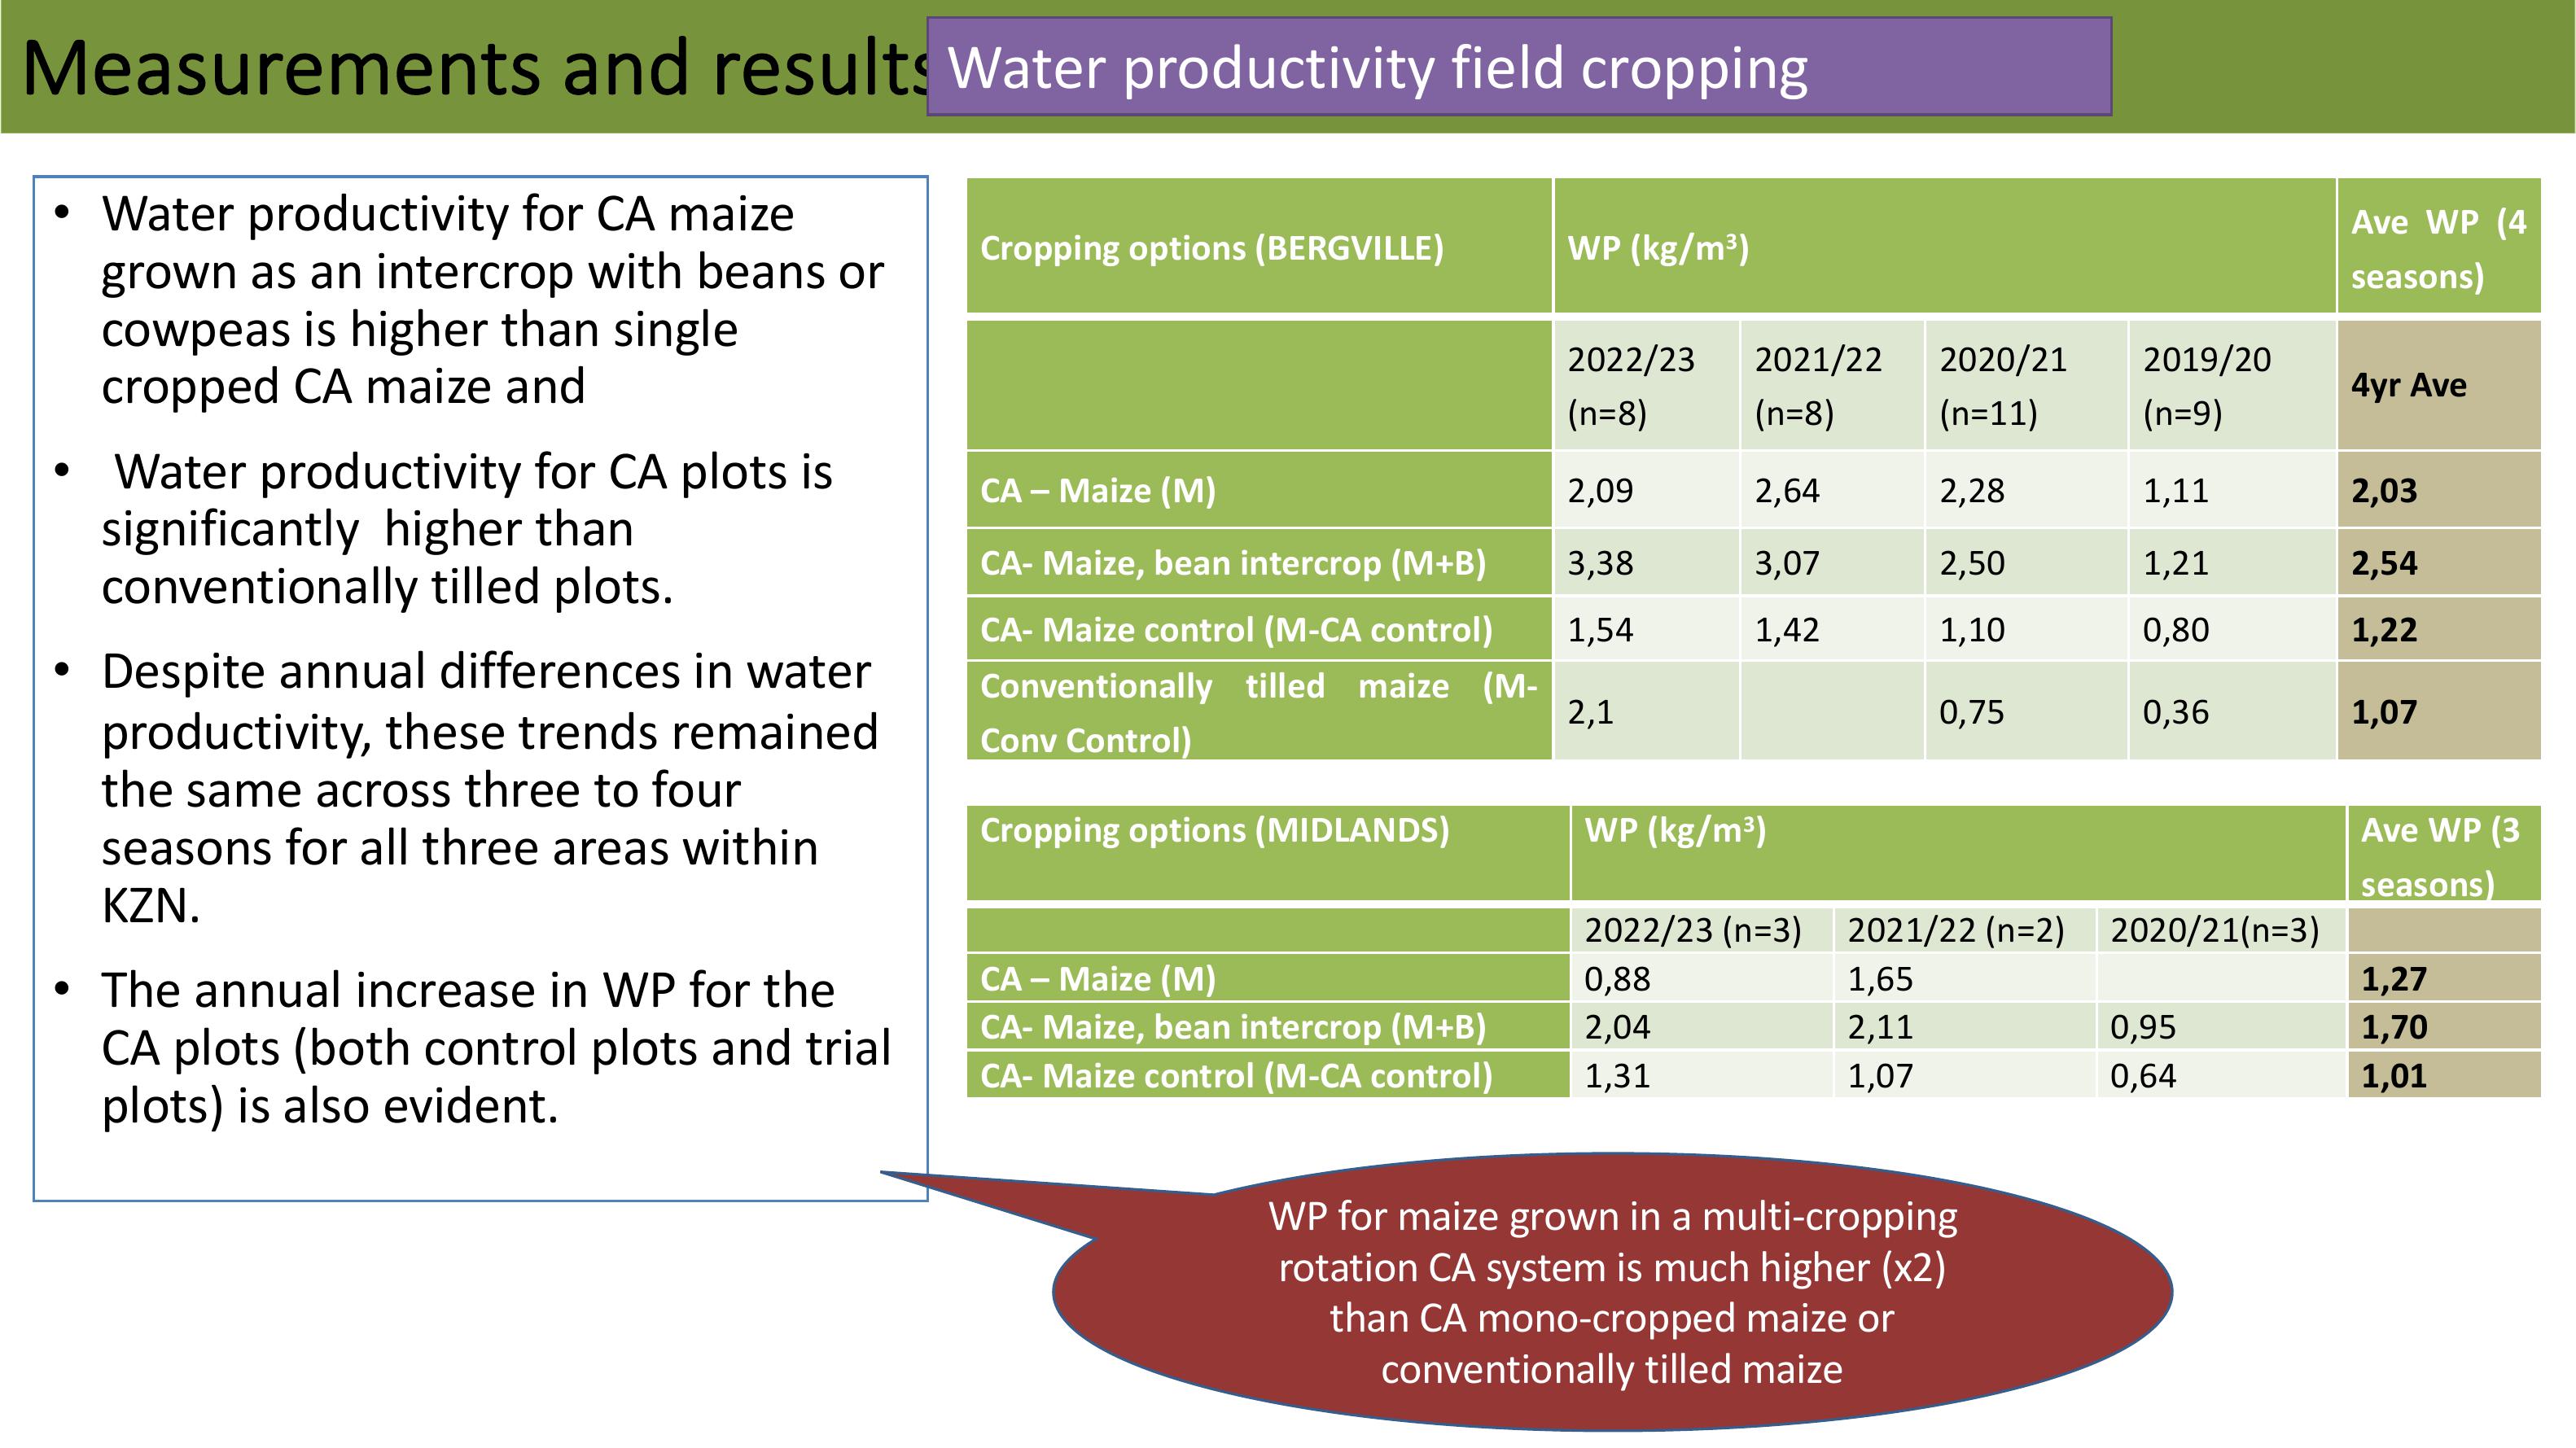
•WaterproductivityforCAmaize
grown as an intercrop with beans or
cowpeas ishigher than single
cropped CA maize and
•WaterproductivityforCAplotsis
significantly higher than
conventionally tilled plots.
•Despite annual differences in water
productivity, these trends remained
the same across three to four
seasons for all three areas within
KZN.
•The annual increase in WP for the
CA plots (both control plots and trial
plots) is also evident.
WP formaize grown in a multi-cropping
rotationCA system ismuch higher(x2)
than CA mono-cropped maize or
conventionallytilledmaize
Cropping
options(BERGVILLE)
WP
(kg/m3)
Ave
WP (
4
seasons)
2022
/23
(n=
8)
2021
/22
(n=
8)
2020
/21
(n=
11)
2019
/20
(n=
9)
4
yrAve
CA
– Maize(M)
2
,09
2
,64
2
,28
1
,11
2
,03
CA
- Maize,beanintercrop(M+B)
3
,38
3
,07
2
,50
1
,21
2
,54
CA
- Maizecontrol(M-CAcontrol)
1
,54
1
,42
1
,10
0
,80
1
,22
Conventionally
tilledmaize(M
-
Conv
Control)
2
,1
0
,75
0
,36
1
,07
Cropping options (MIDLANDS)
WP (kg/m
3)
AveWP(3
seasons)
2022/23 (n=3)
2021/22 (n=2)
2020/21(n=3)
CA
– Maize (M)
0,88
1,65
1,27
CA
- Maize, bean intercrop (M+B)
2,04
2,11
0,95
1,70
CA
- Maize control (M-CA control)
1,31
1,07
0,64
1,01
Measurements and results
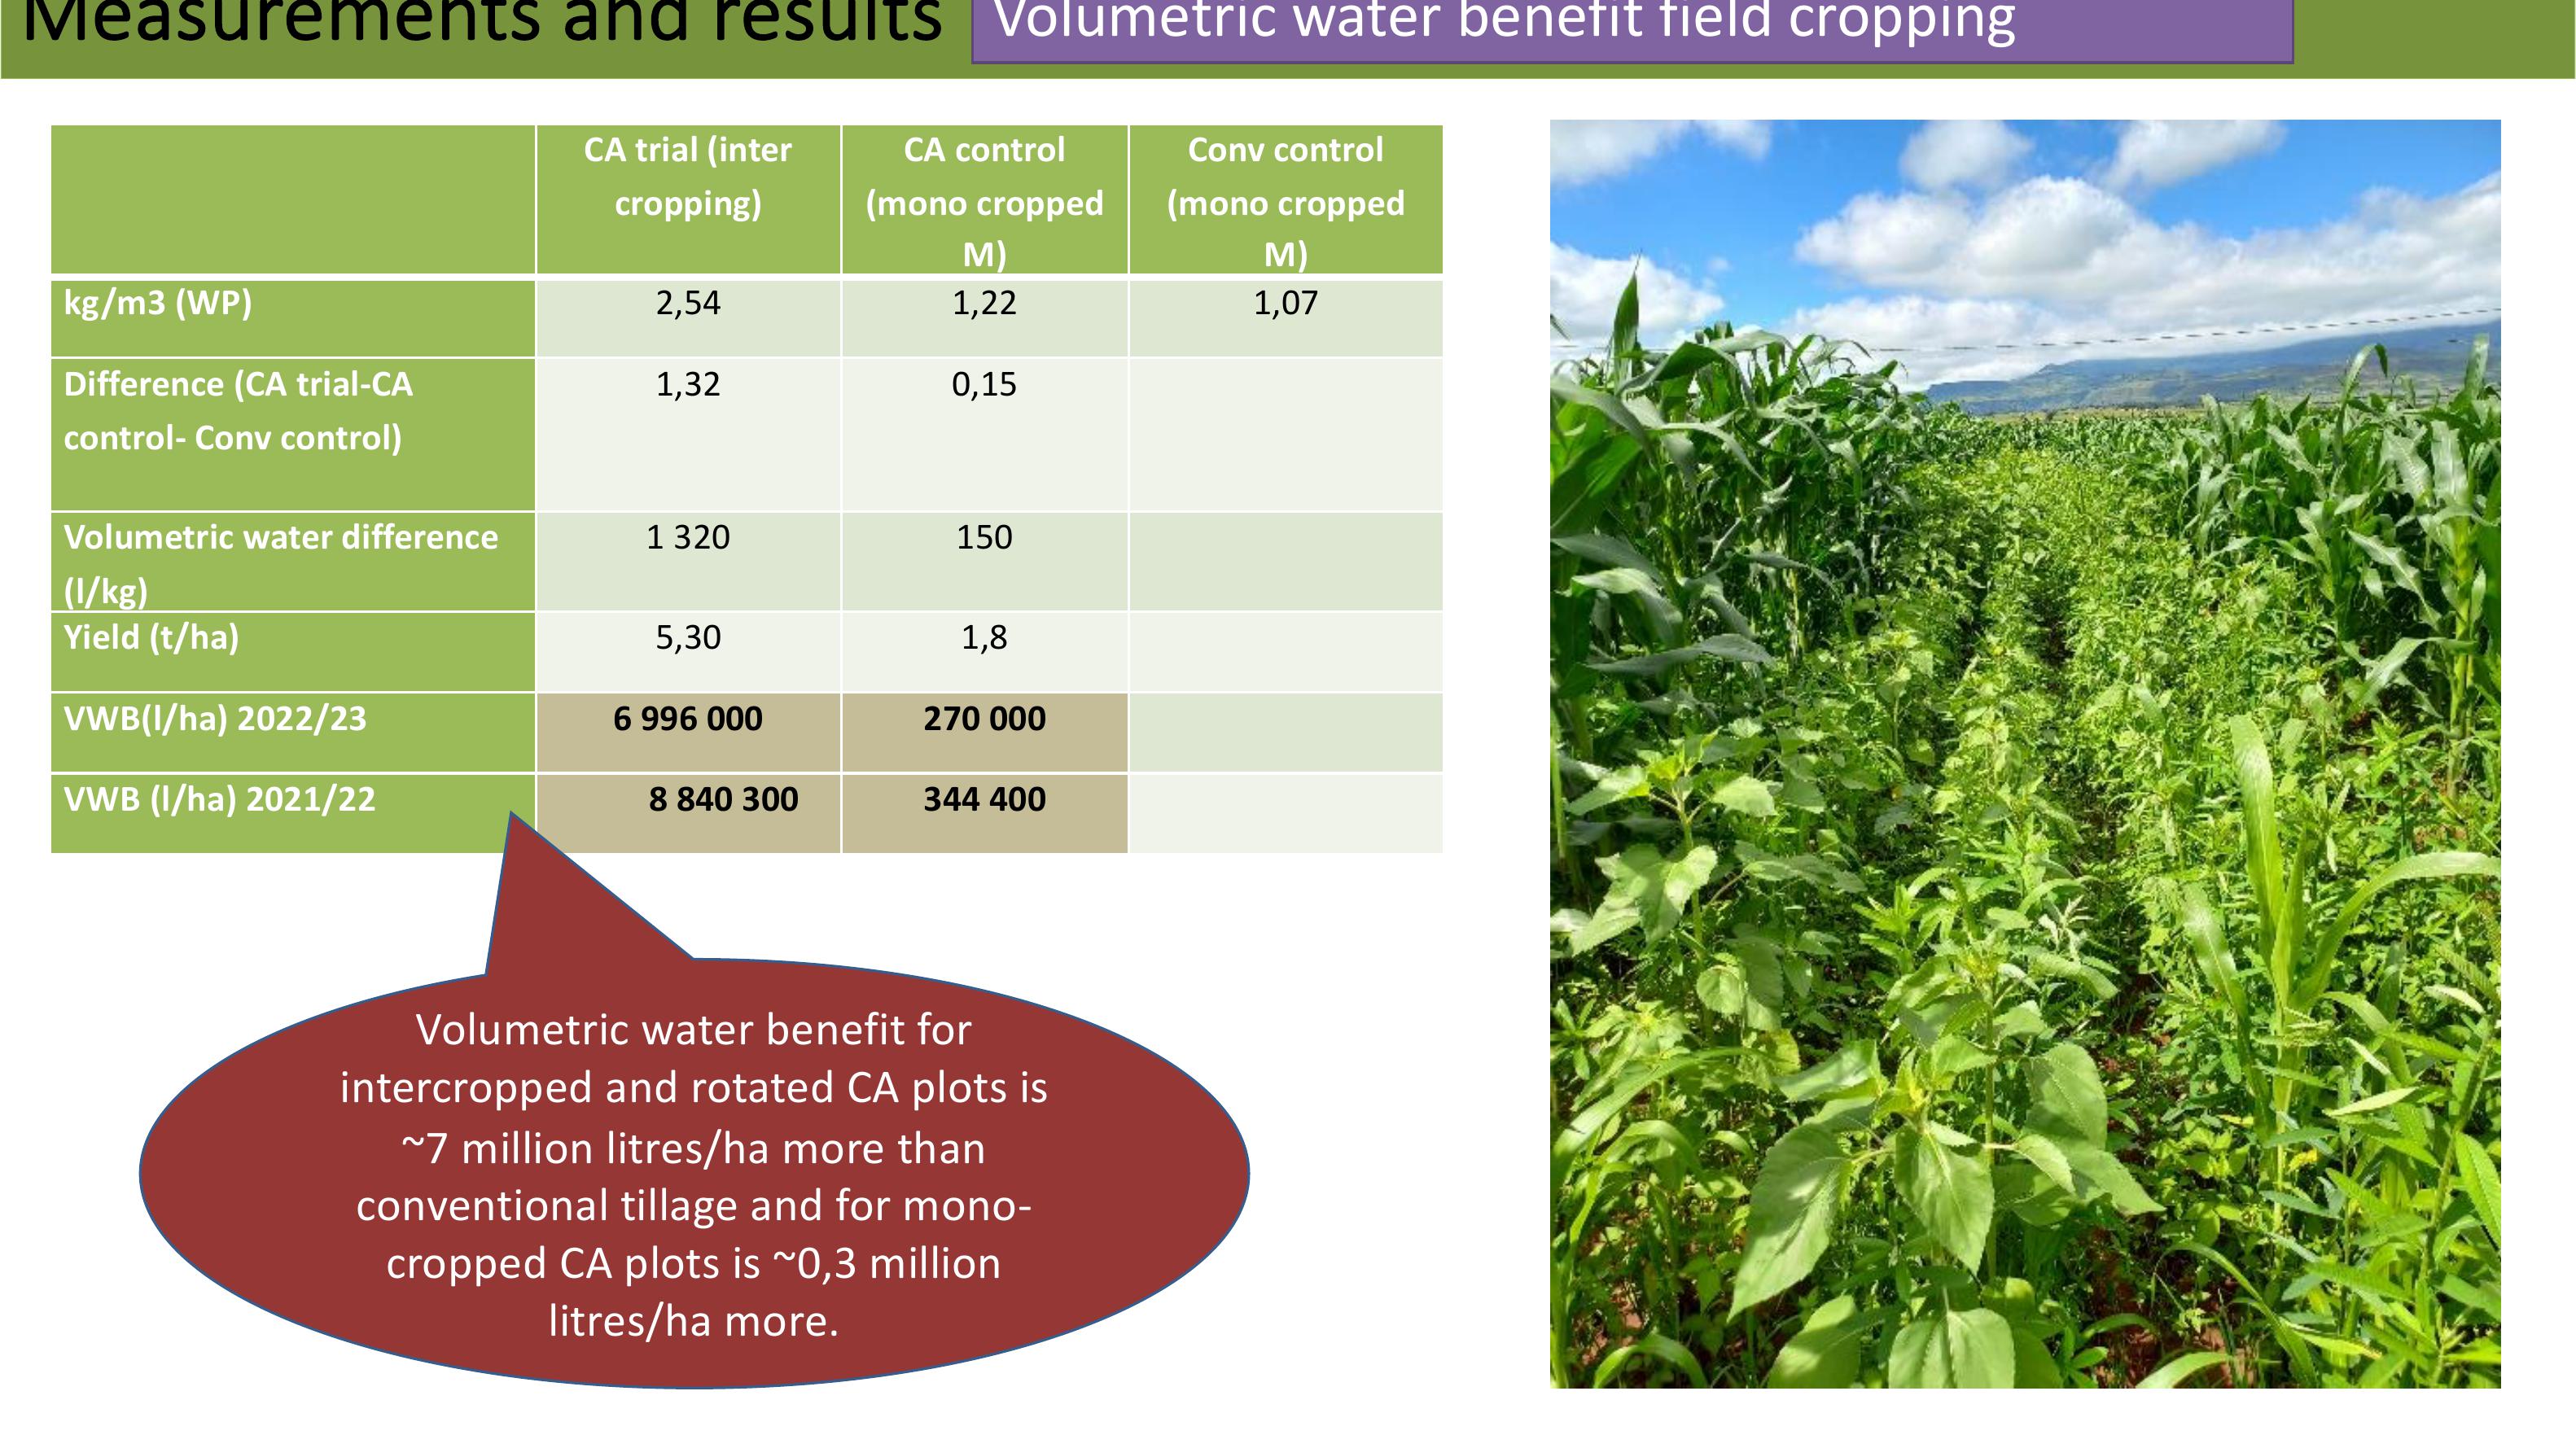
Volumetricwaterbenefitfieldcropping
CA trial (inter
cropping)
CA control
(mono cropped
M)
Conv control
(mono cropped
M)
kg/m3 (WP)
2,54 1,221,07
Difference (CA trial
-CA
control
- Conv control)
1,32 0,15
Volumetricwaterdifference
(l/kg)
1 320150
Yield (t/ha)
5,30 1,8
VWB(l/ha) 2022/23
6996 000270 000
VWB (l/ha) 2021/22
8840 300344 400
Volumetricwaterbenefitfor
intercropped and rotated CA plots is
~7 million litres/ha more than
conventional tillage and for mono-
cropped CA plots is ~0,3 million
litres/ha more.
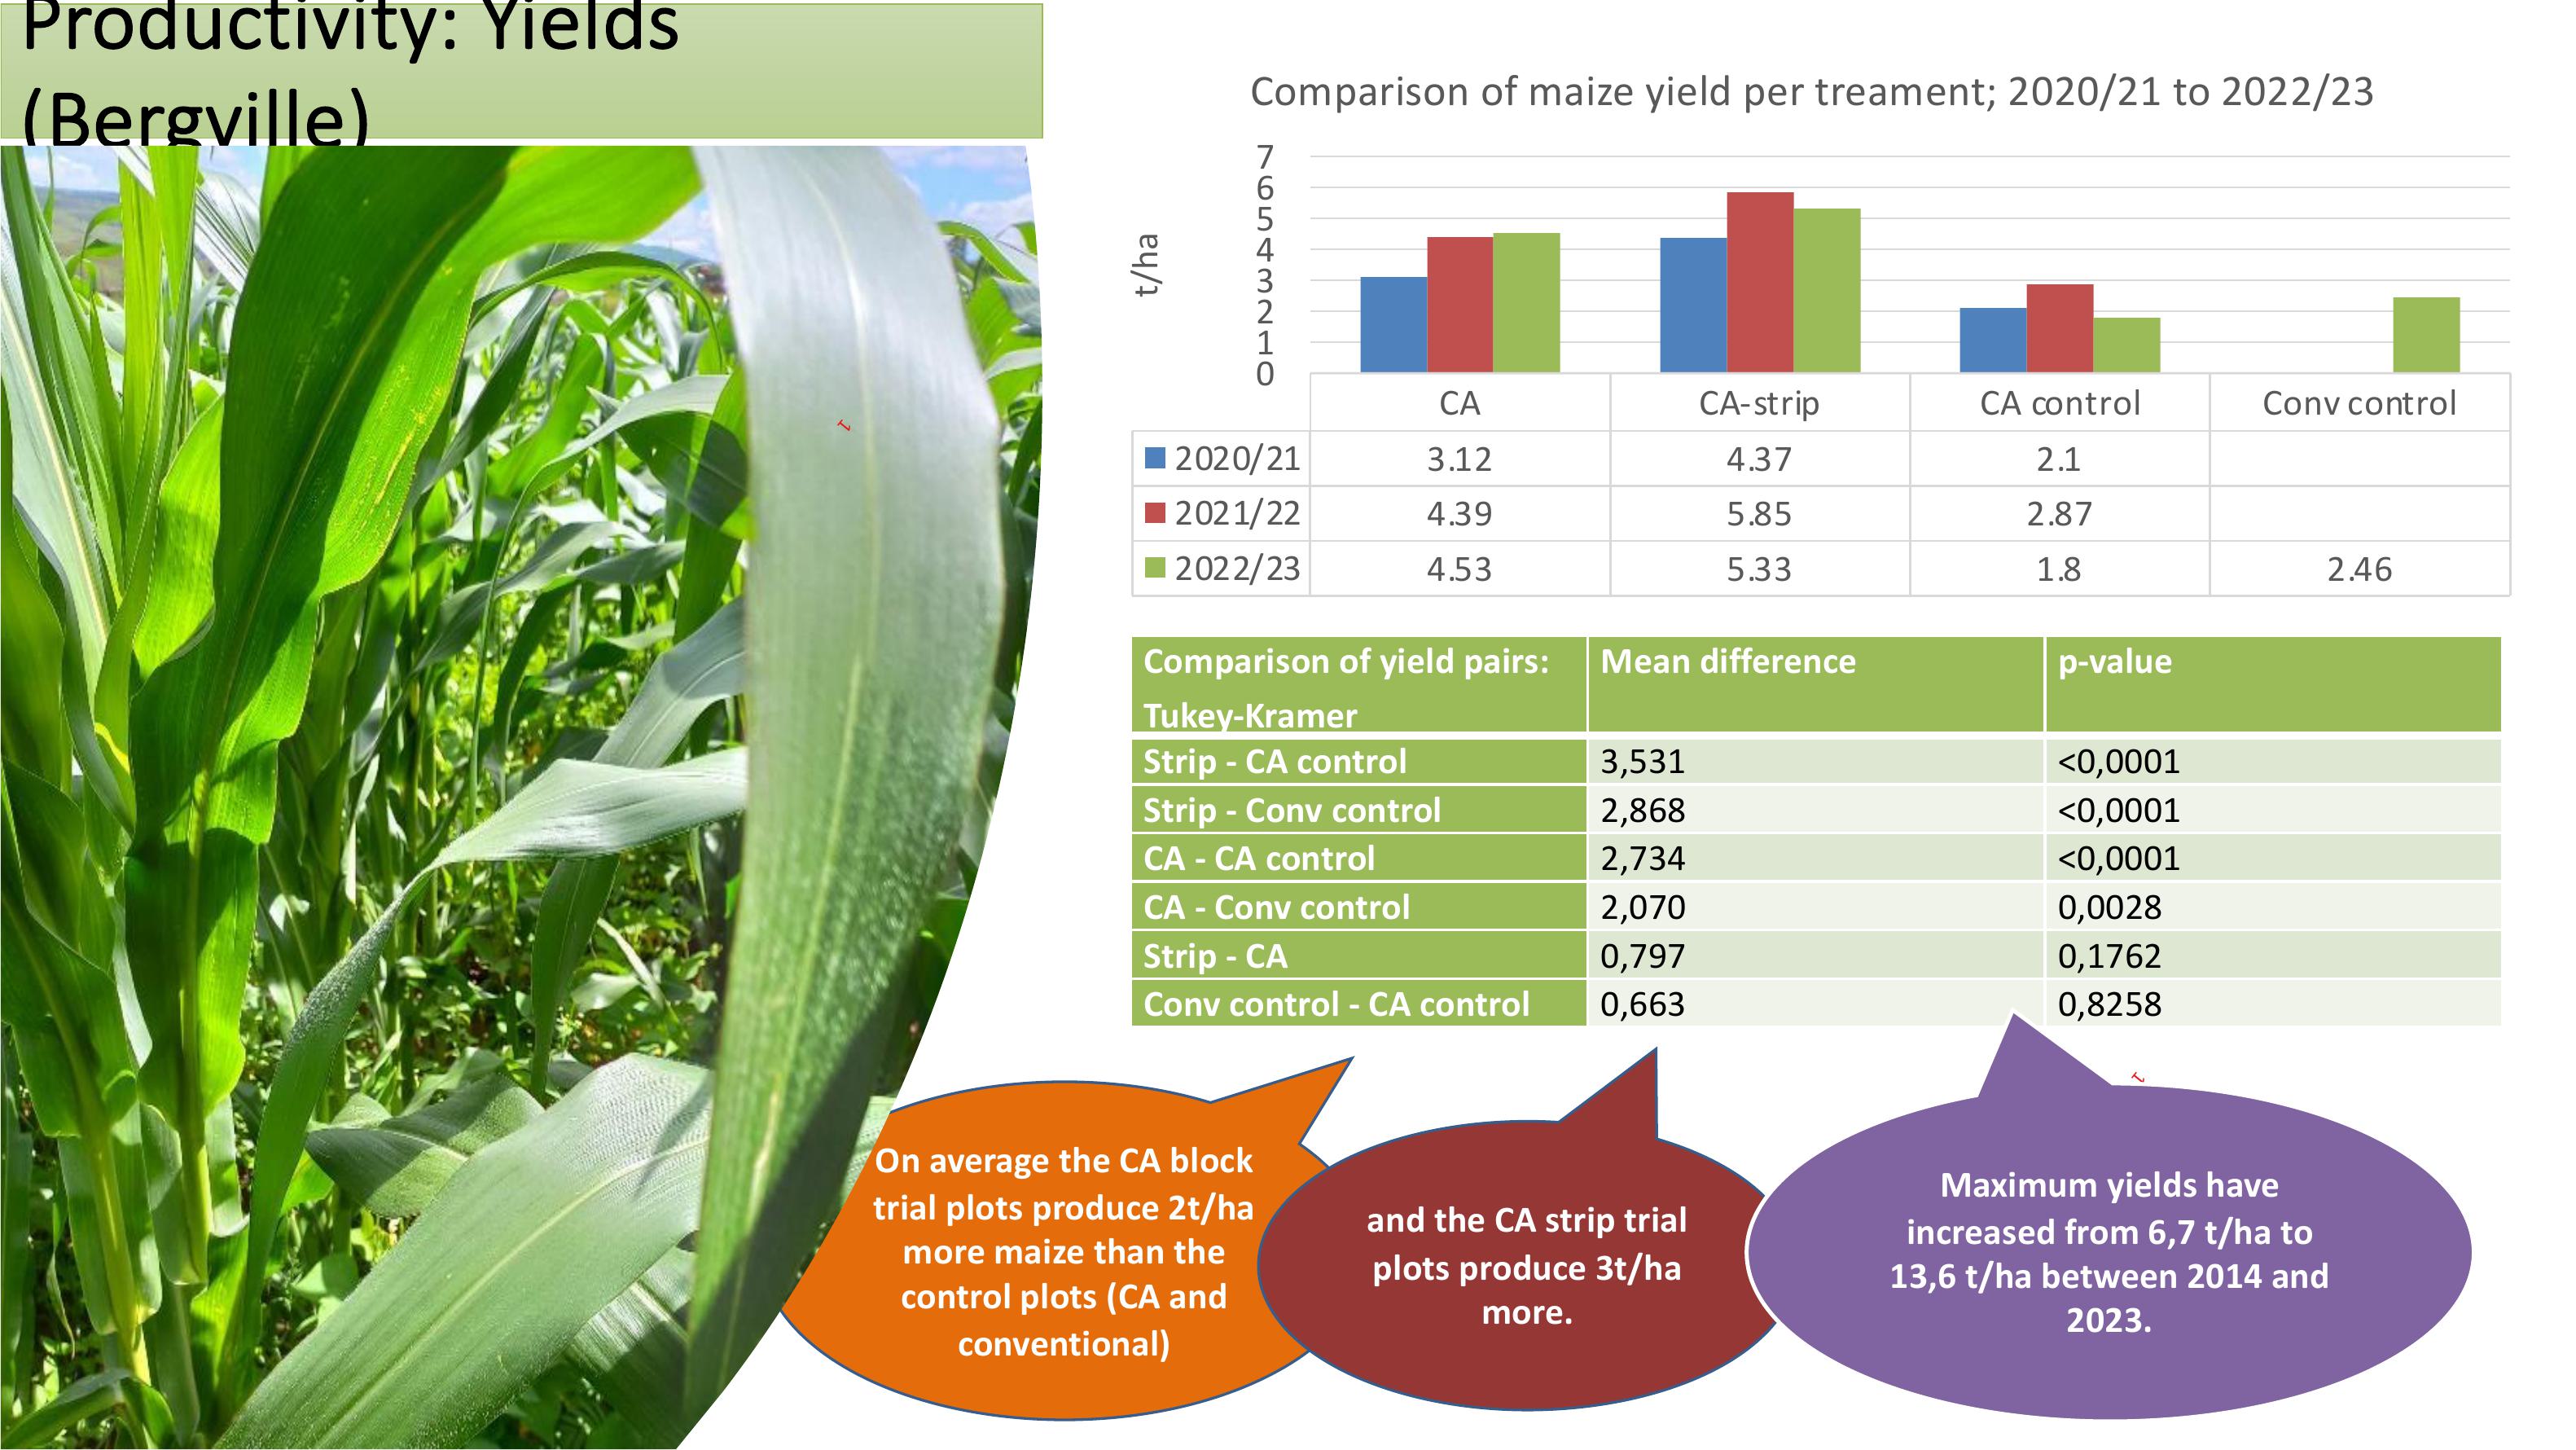
Productivity: Yields
(Bergville)
On average the CA block
trial plots produce 2t/ha
more maize than the
control plots (CA and
conventional)
and the CA strip trial
plots produce 3t/ha
more.
CACA-stripCAcontrolConv control
2020/21 3.12 4.372.1
2021/22 4.39 5.85 2.87
2022/23 4.53 5.331.82.46
0
1
2
3
4
5
6
7
t/ha
Comparison of maize yield per treament; 2020/21 to 2022/23
1
1
1
1
2
2
Comparison of yield pairs:
Tukey
-Kramer
Mean difference
p
-value
Strip
- CA control
3,531
<0,0001
Strip
- Conv control
2,868
<0,0001
CA
- CA control
2,734
<0,0001
CA
- Conv control
2,070
0,0028
Strip
- CA
0,797
0,1762
Conv control
- CA control
0,663
0,8258
Maximum yields have
increased from 6,7 t/ha to
13,6 t/ha between 2014 and
2023.
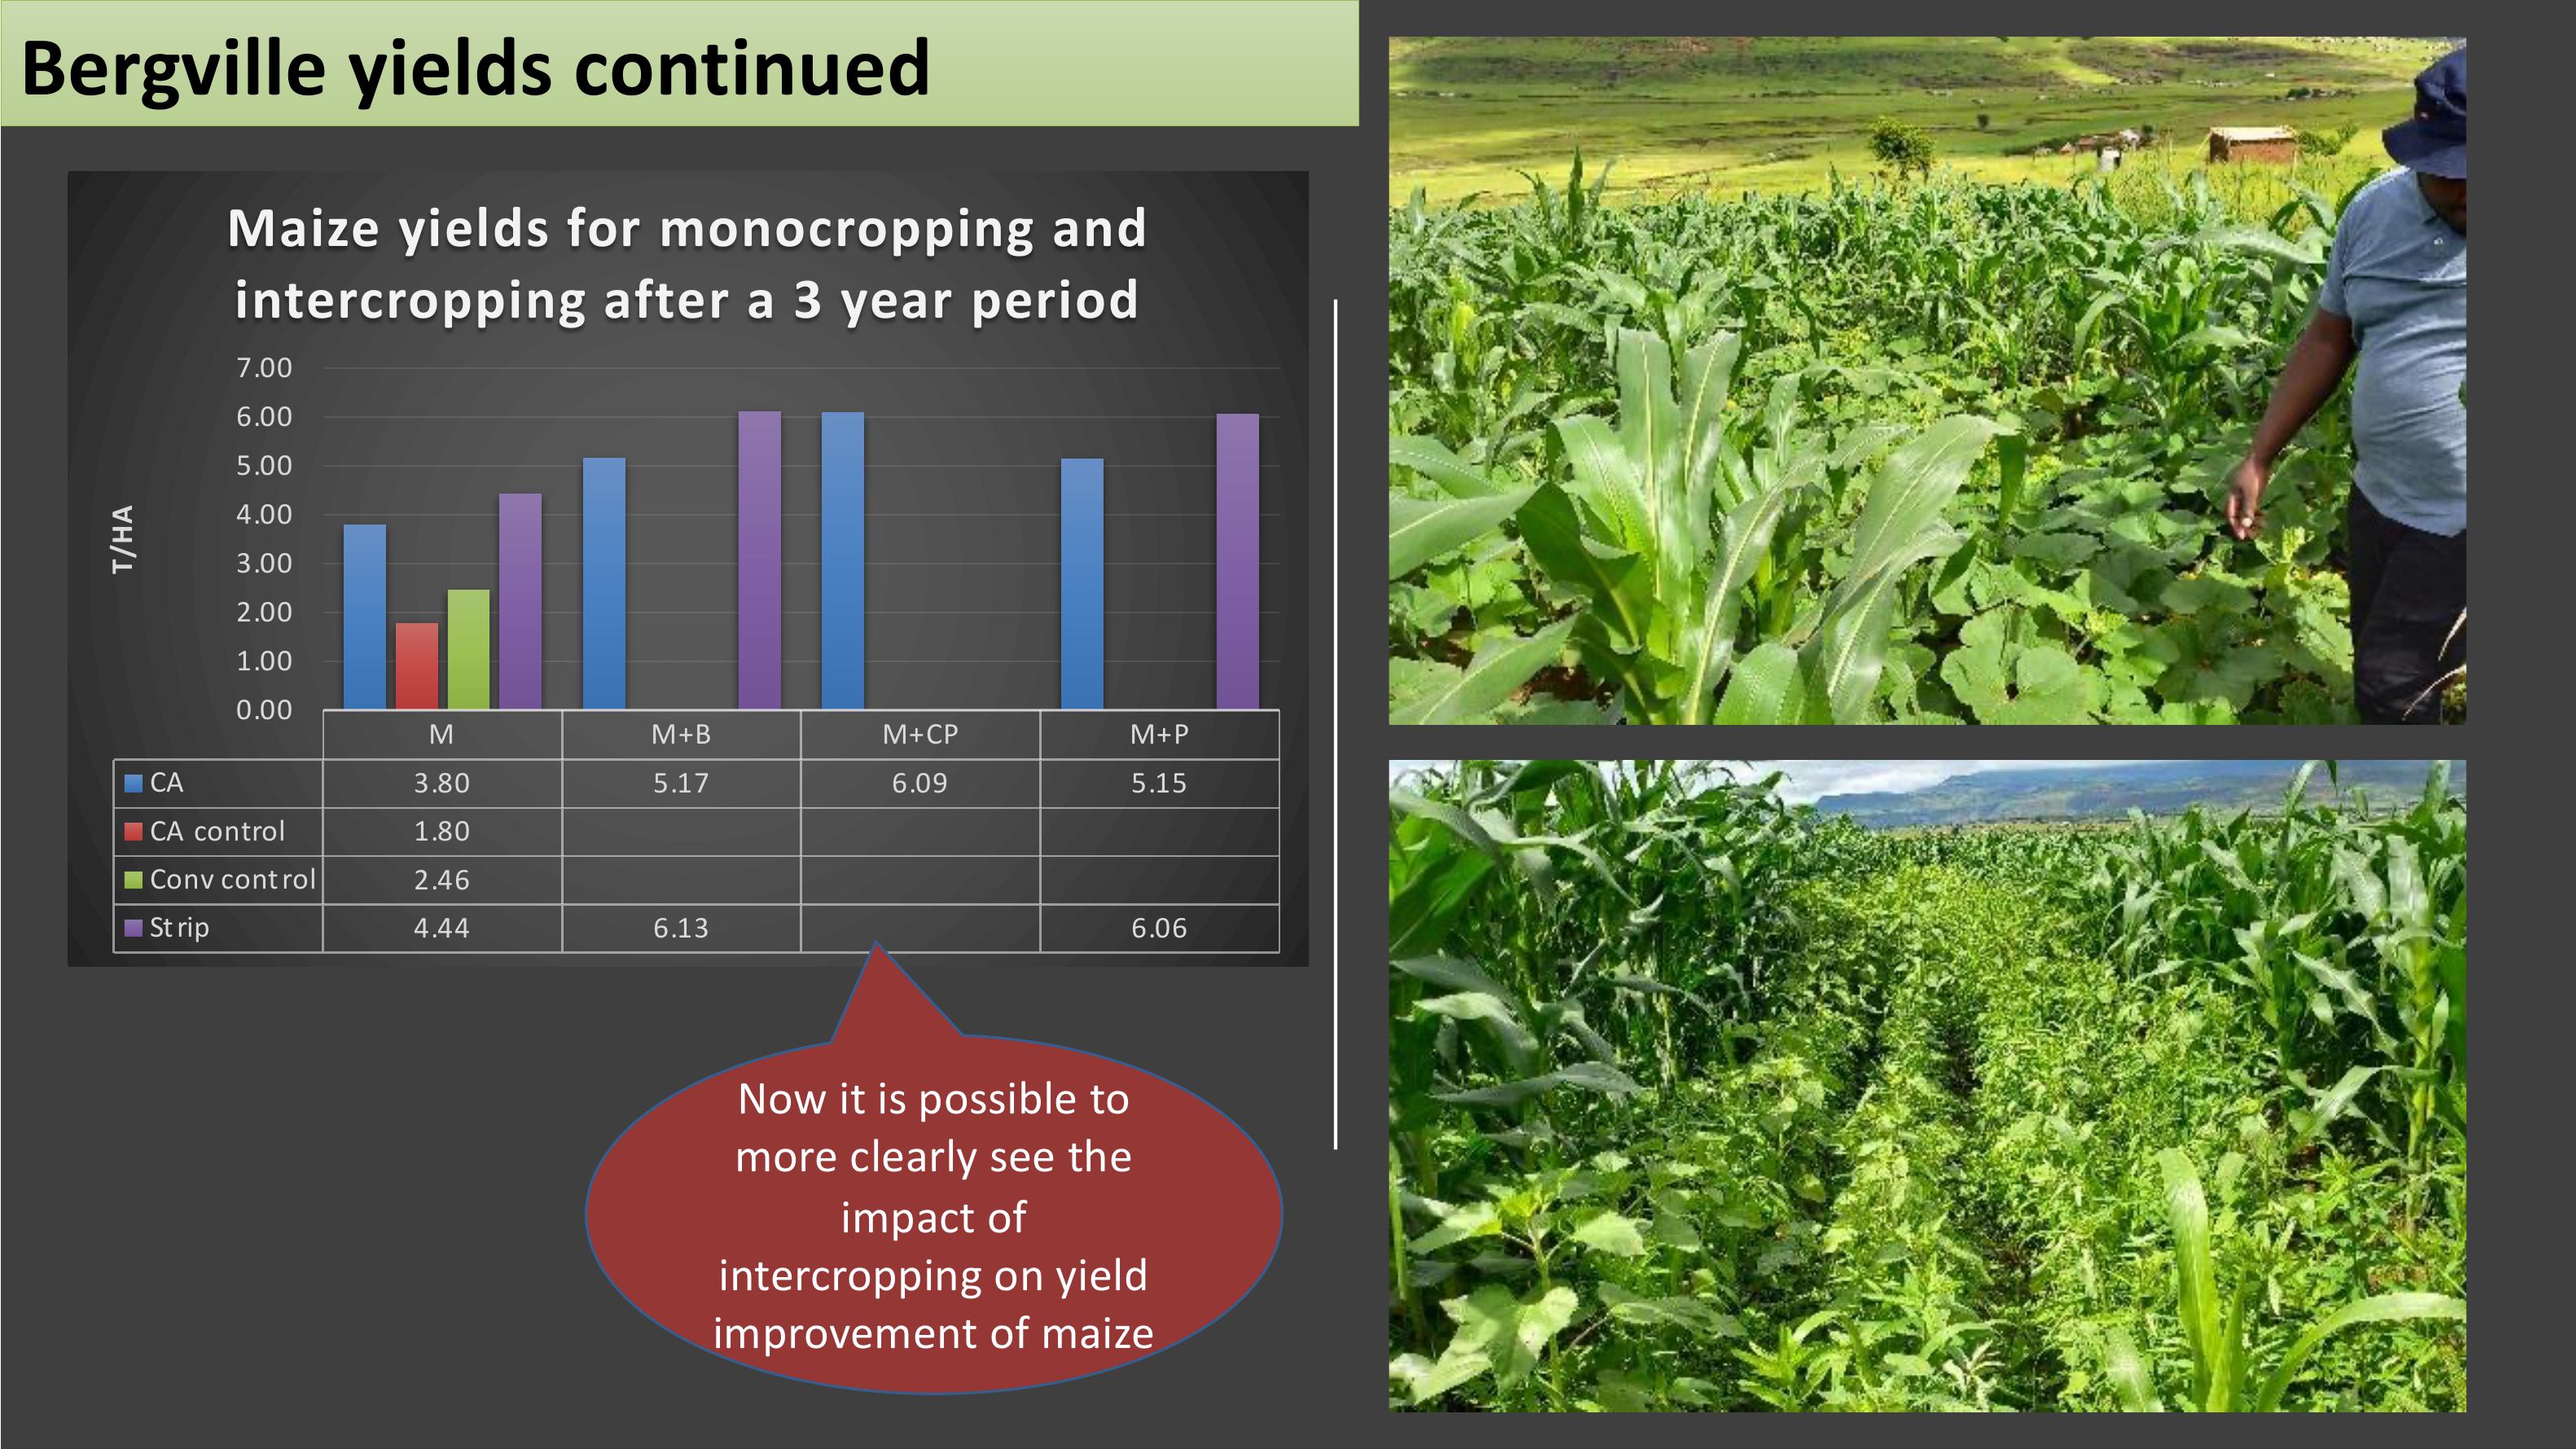
Bergville yields continued
MM+B M+CP M+P
CA 3.80 5.17 6.09 5.15
CA control1.80
Conv control2.46
St rip4.44 6.136.06
0.00
1.00
2.00
3.00
4.00
5.00
6.00
7.00
T/HA
Maize yields for monocropping and
intercropping after a 3 year period
Now it is possible to
more clearly see the
impact of
intercropping on yield
improvement of maize
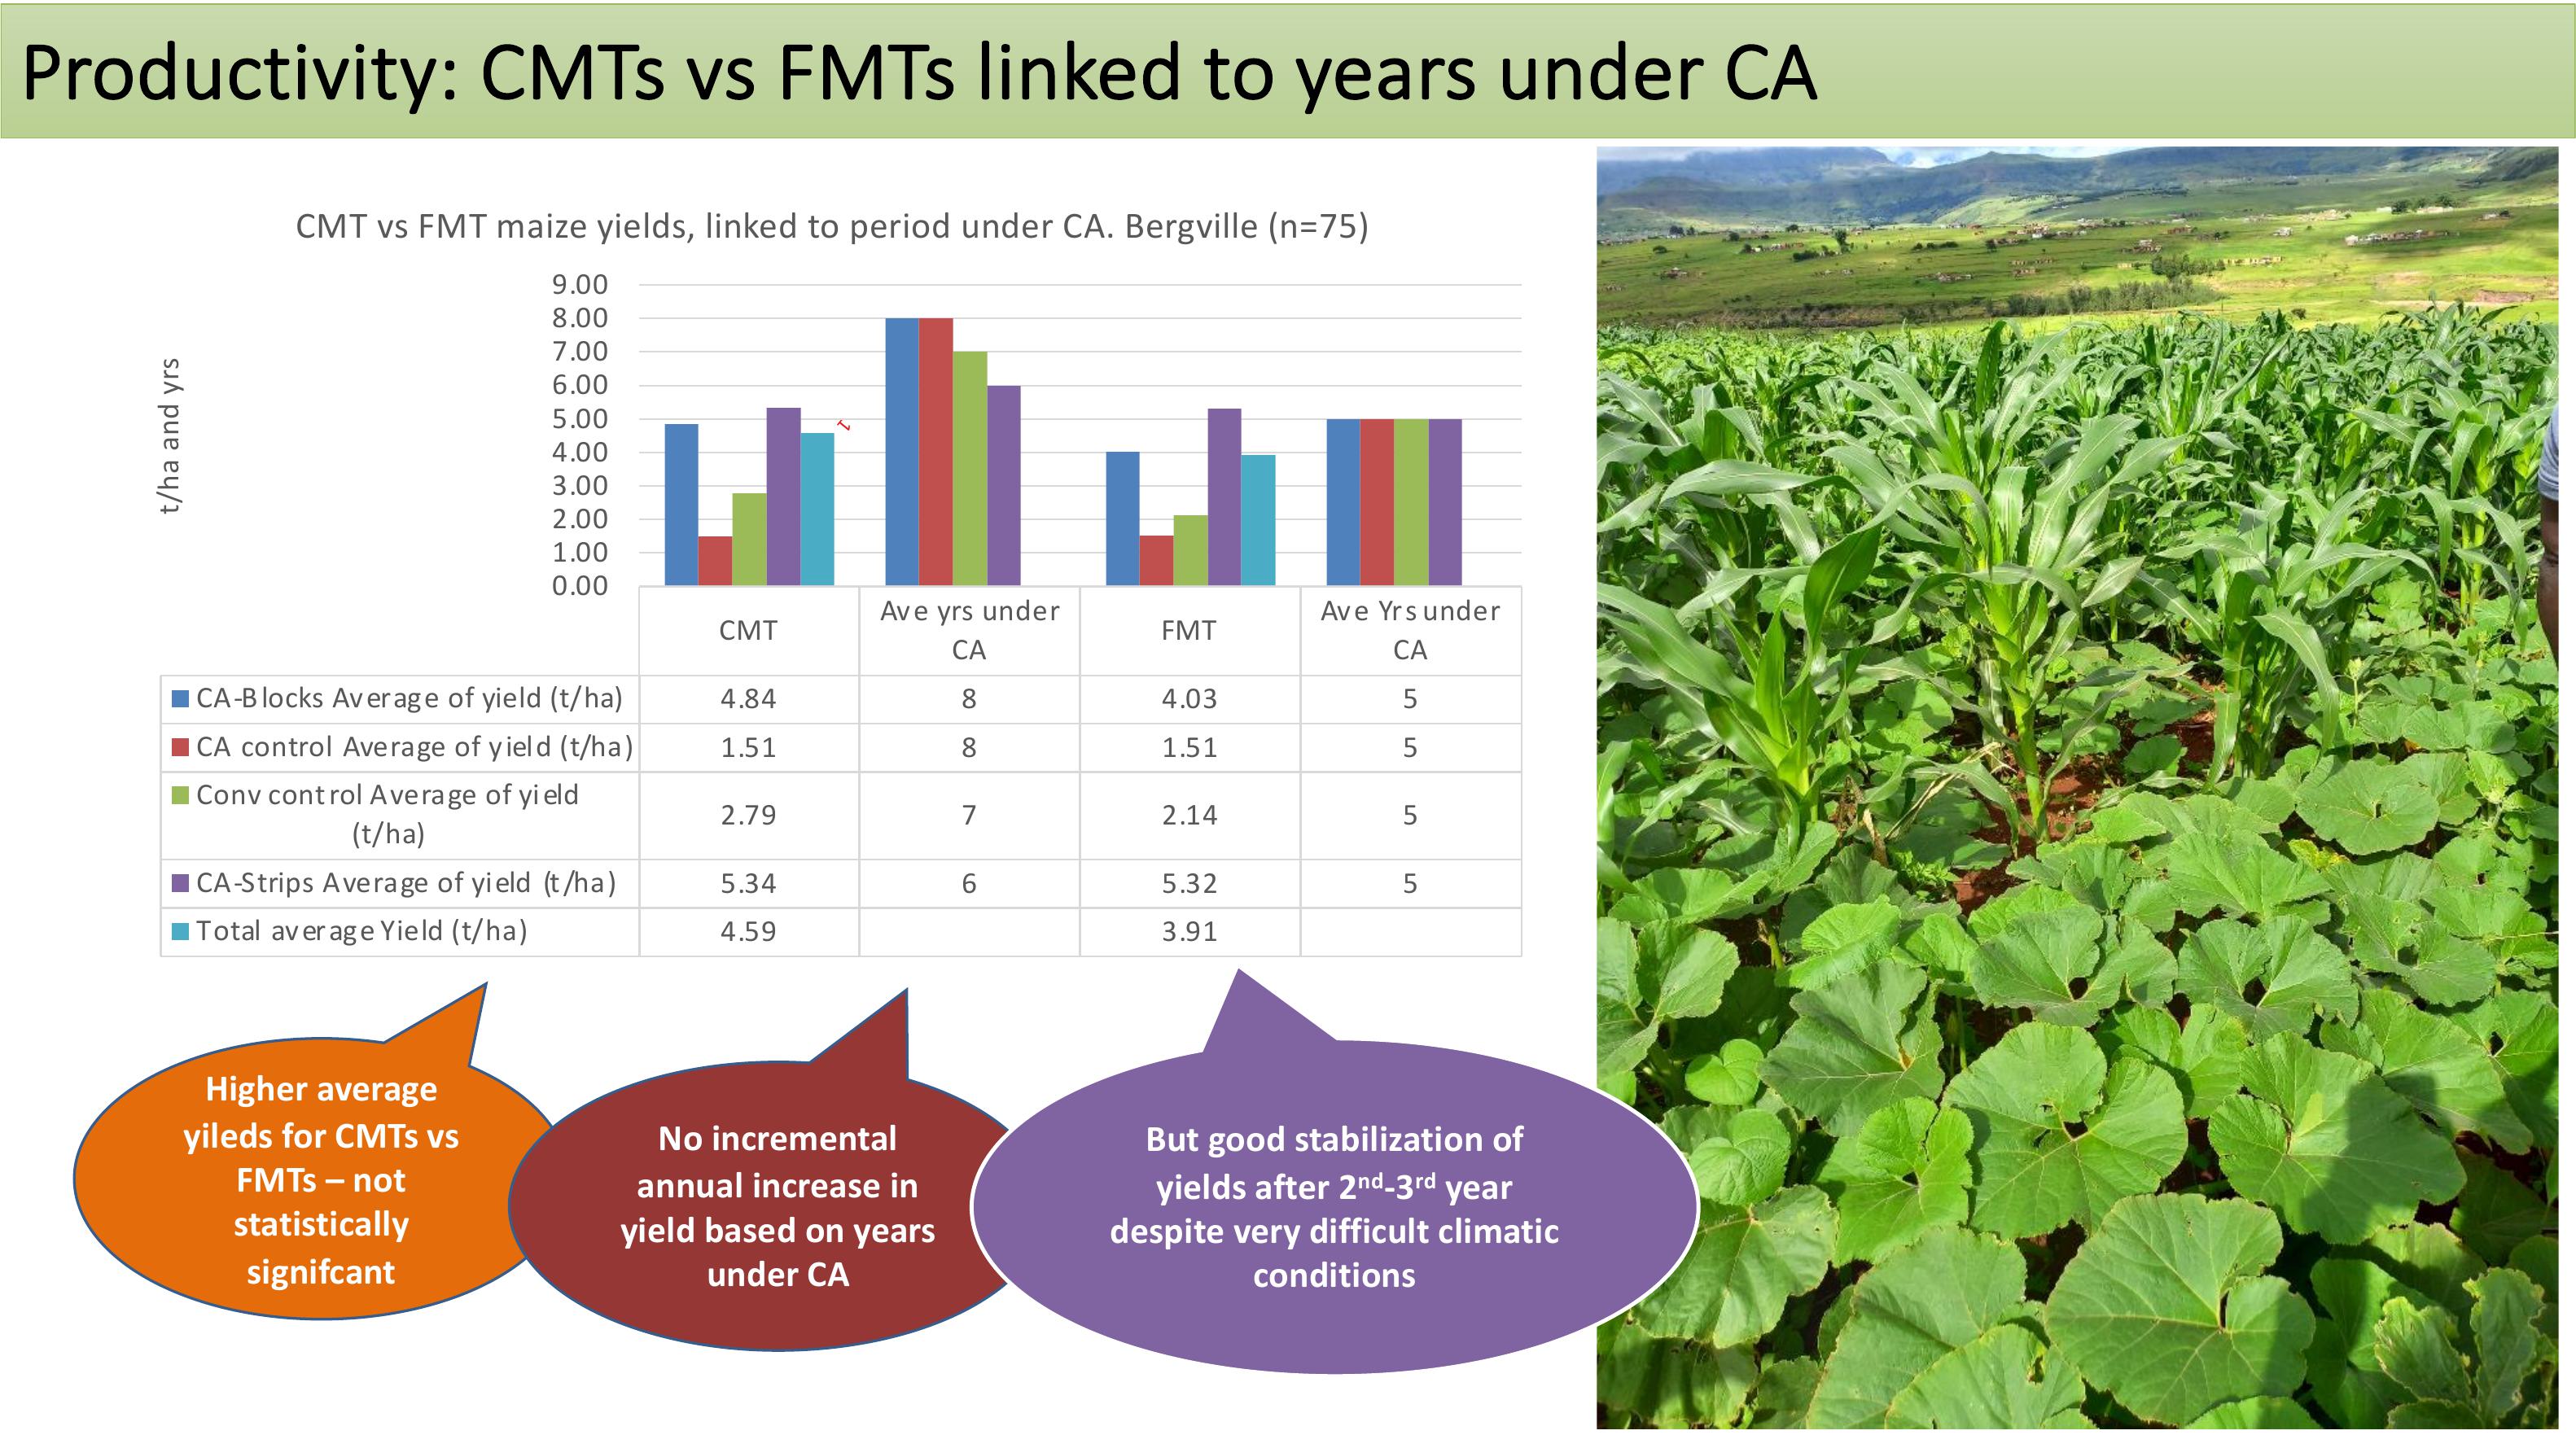
Productivity: CMTs vs FMTs linked to years under CA
Higher average
yiledsfor CMTsvs
FMTs – not
statistically
signifcant
No incremental
annual increase in
yield based on years
under CA
1
1
1
1
2
2
CMT Aveyrsunder
CA FMT AveYrs under
CA
CA-Blocks Average of yield (t/ha)4.84 84.03 5
CA control Average of yield (t/ha)1.51 81.51 5
Conv control Average of yield
(t/ha) 2.79 72.14 5
CA-Strips Average of yield (t/ha)5.34 65.32 5
TotalaverageYield(t/ha)4.59 3.91
0.00
1.00
2.00
3.00
4.00
5.00
6.00
7.00
8.00
9.00
t/ha and yrs
CMT vs FMT maize yields, linked to period under CA. Bergville (n=75)
But good stabilization of
yields after 2nd-3rdyear
despite very difficult climatic
conditions
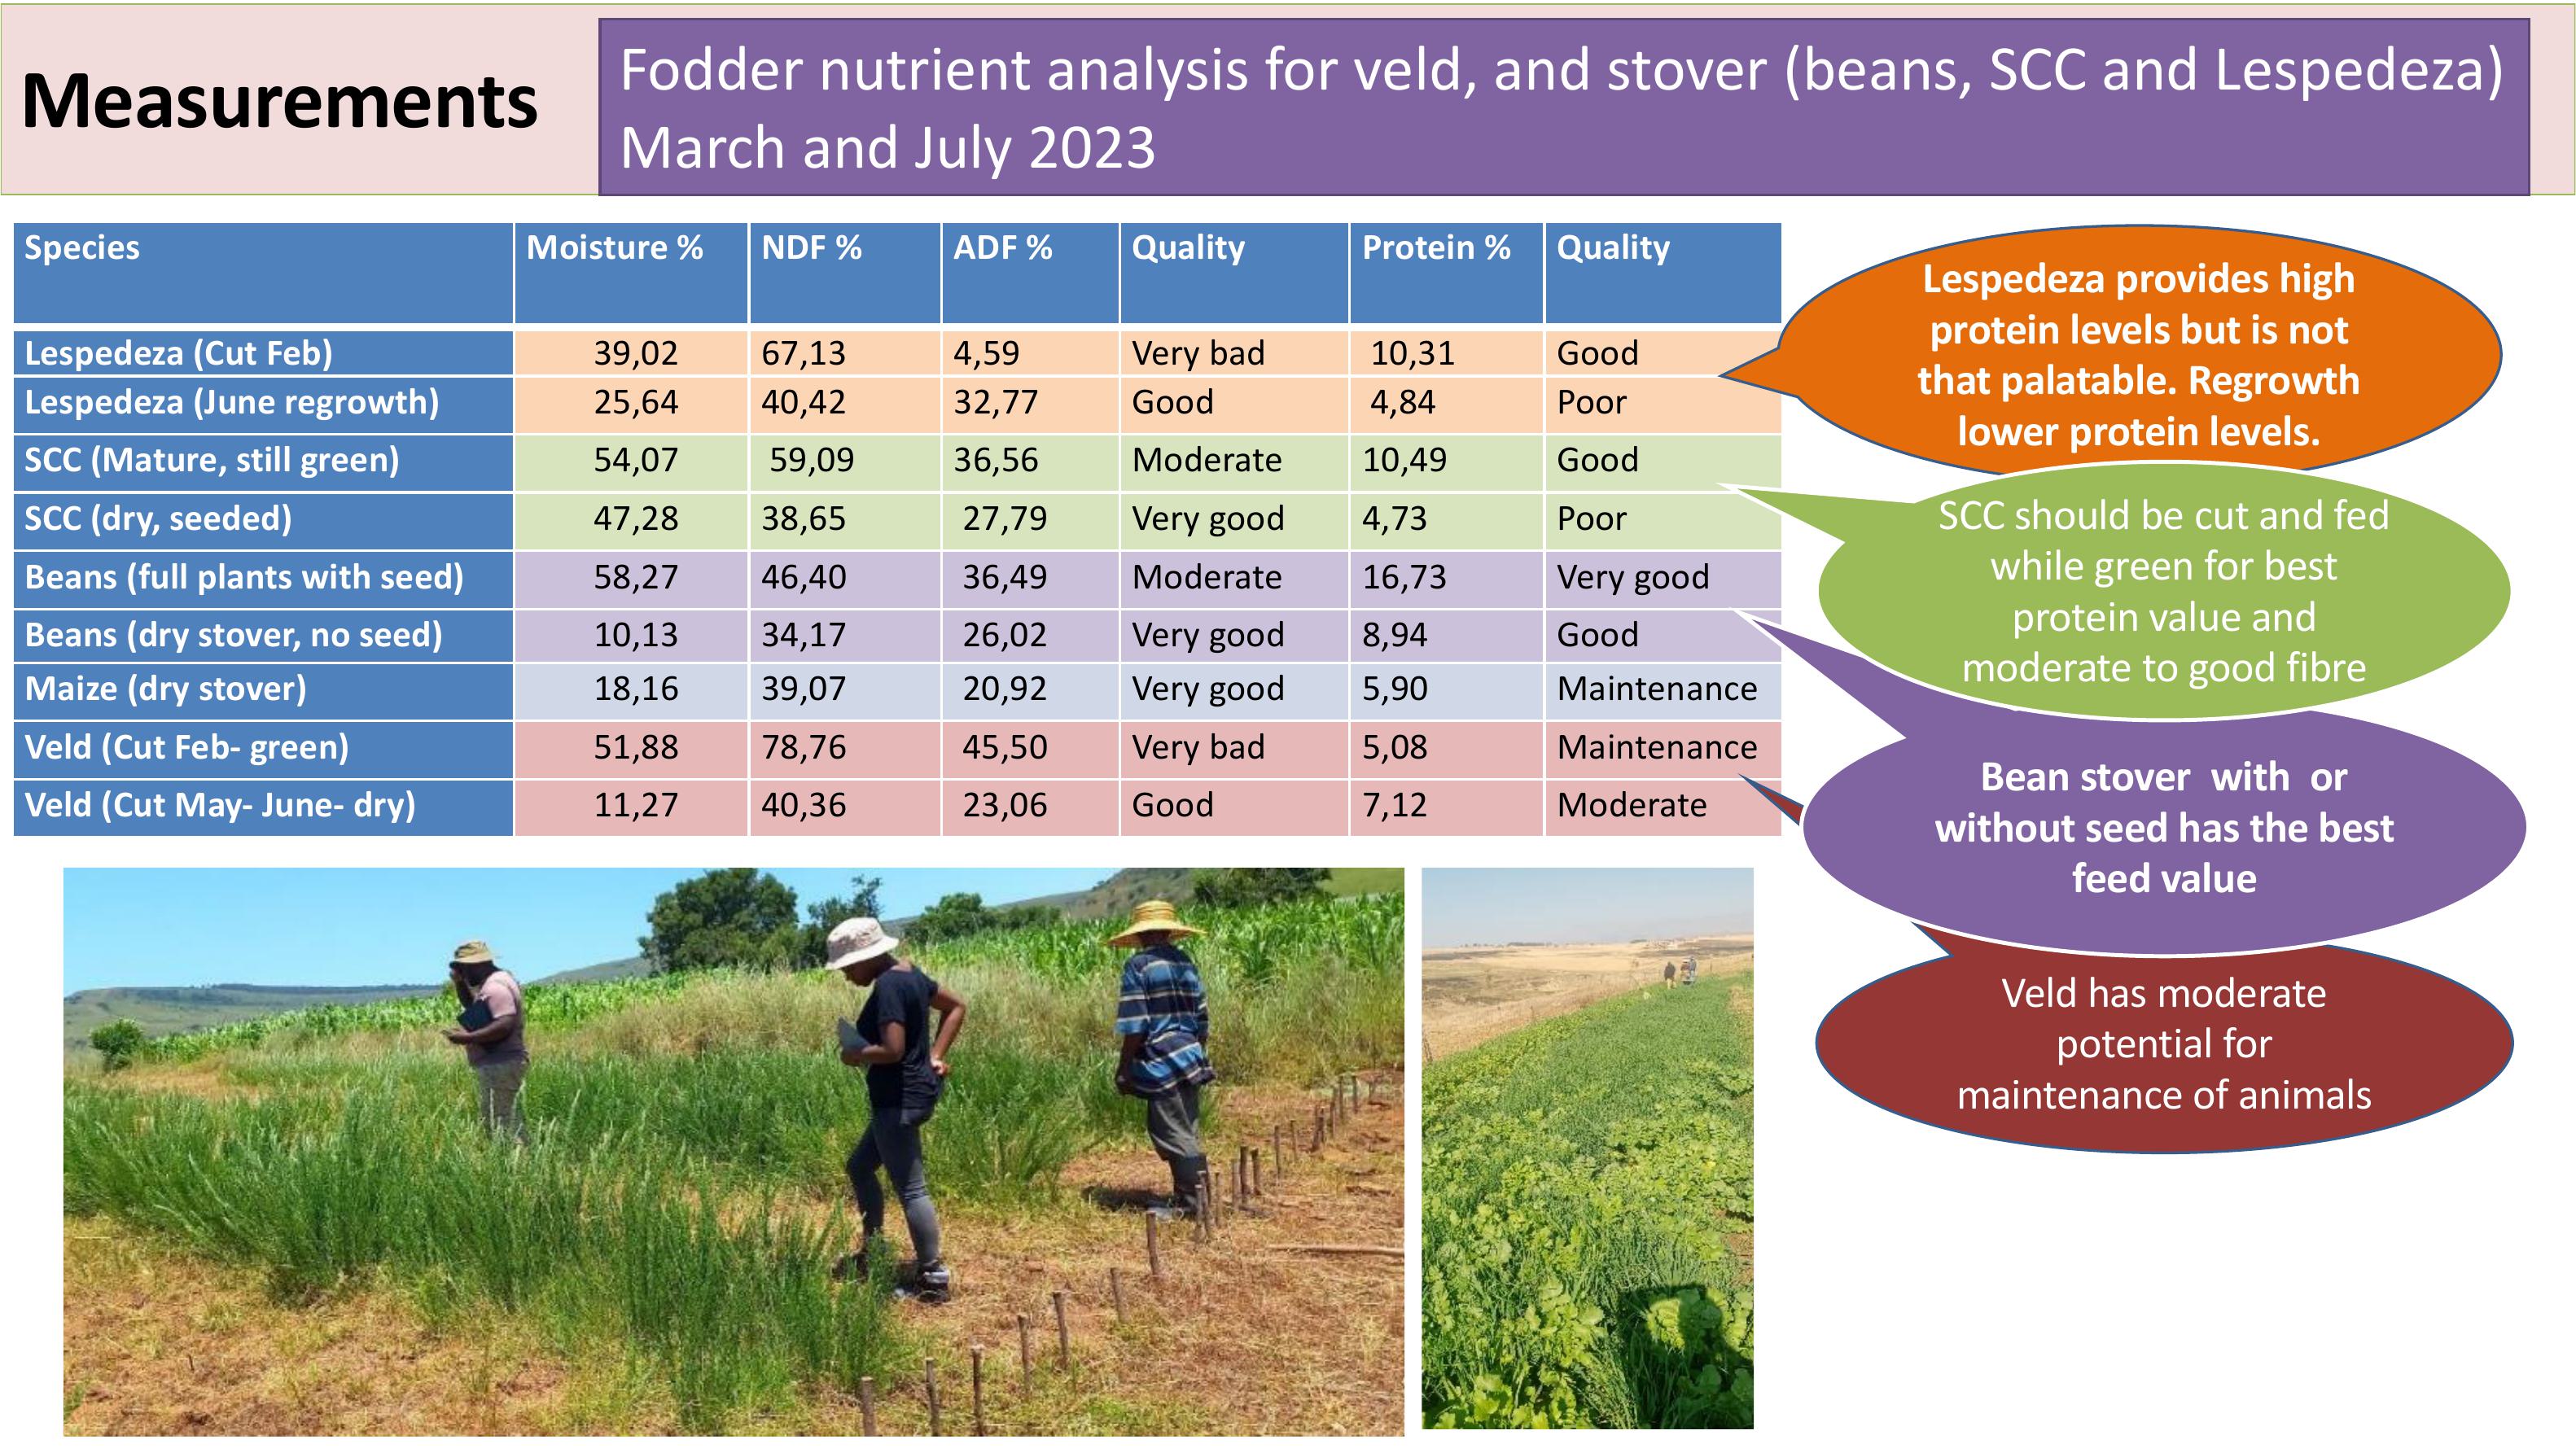
Measurements Foddernutrientanalysisforveld,andstover(beans, SCCandLespedeza)
March and July 2023
Species
Moisture %
NDF %
ADF %
Quality
Protein %
Quality
Lespedeza (Cut Feb)
39,02
67,13
4,59
Verybad
10,31
Good
Lespedeza (June regrowth)
25,64
40,42
32,77
Good
4,84
Poor
SCC (Mature, still green)
54,07
59,09
36,56
Moderate
10,49
Good
SCC (dry, seeded)
47,28
38,65
27,79
Verygood
4,73
Poor
Beans (full plants with seed)
58,27
46,40
36,49
Moderate
16,73
Verygood
Beans (dry stover, no seed)
10,13
34,17
26,02
Verygood
8,94
Good
Maize (dry stover)
18,16
39,07
20,92
Verygood
5,90
Maintenance
Veld(CutFeb
- green) 51,88
78,76
45,50
Verybad
5,08
Maintenance
Veld(CutMay
- June- dry) 11,27
40,36
23,06
Good
7,12
Moderate
Veldhasmoderate
potential for
maintenanceof animals
Lespedeza provides high
protein levels but is not
that palatable. Regrowth
lower protein levels.
Bean stover with or
withoutseed hasthe best
feed value
SCC should be cut and fed
while green for best
protein value and
moderatetogoodfibre
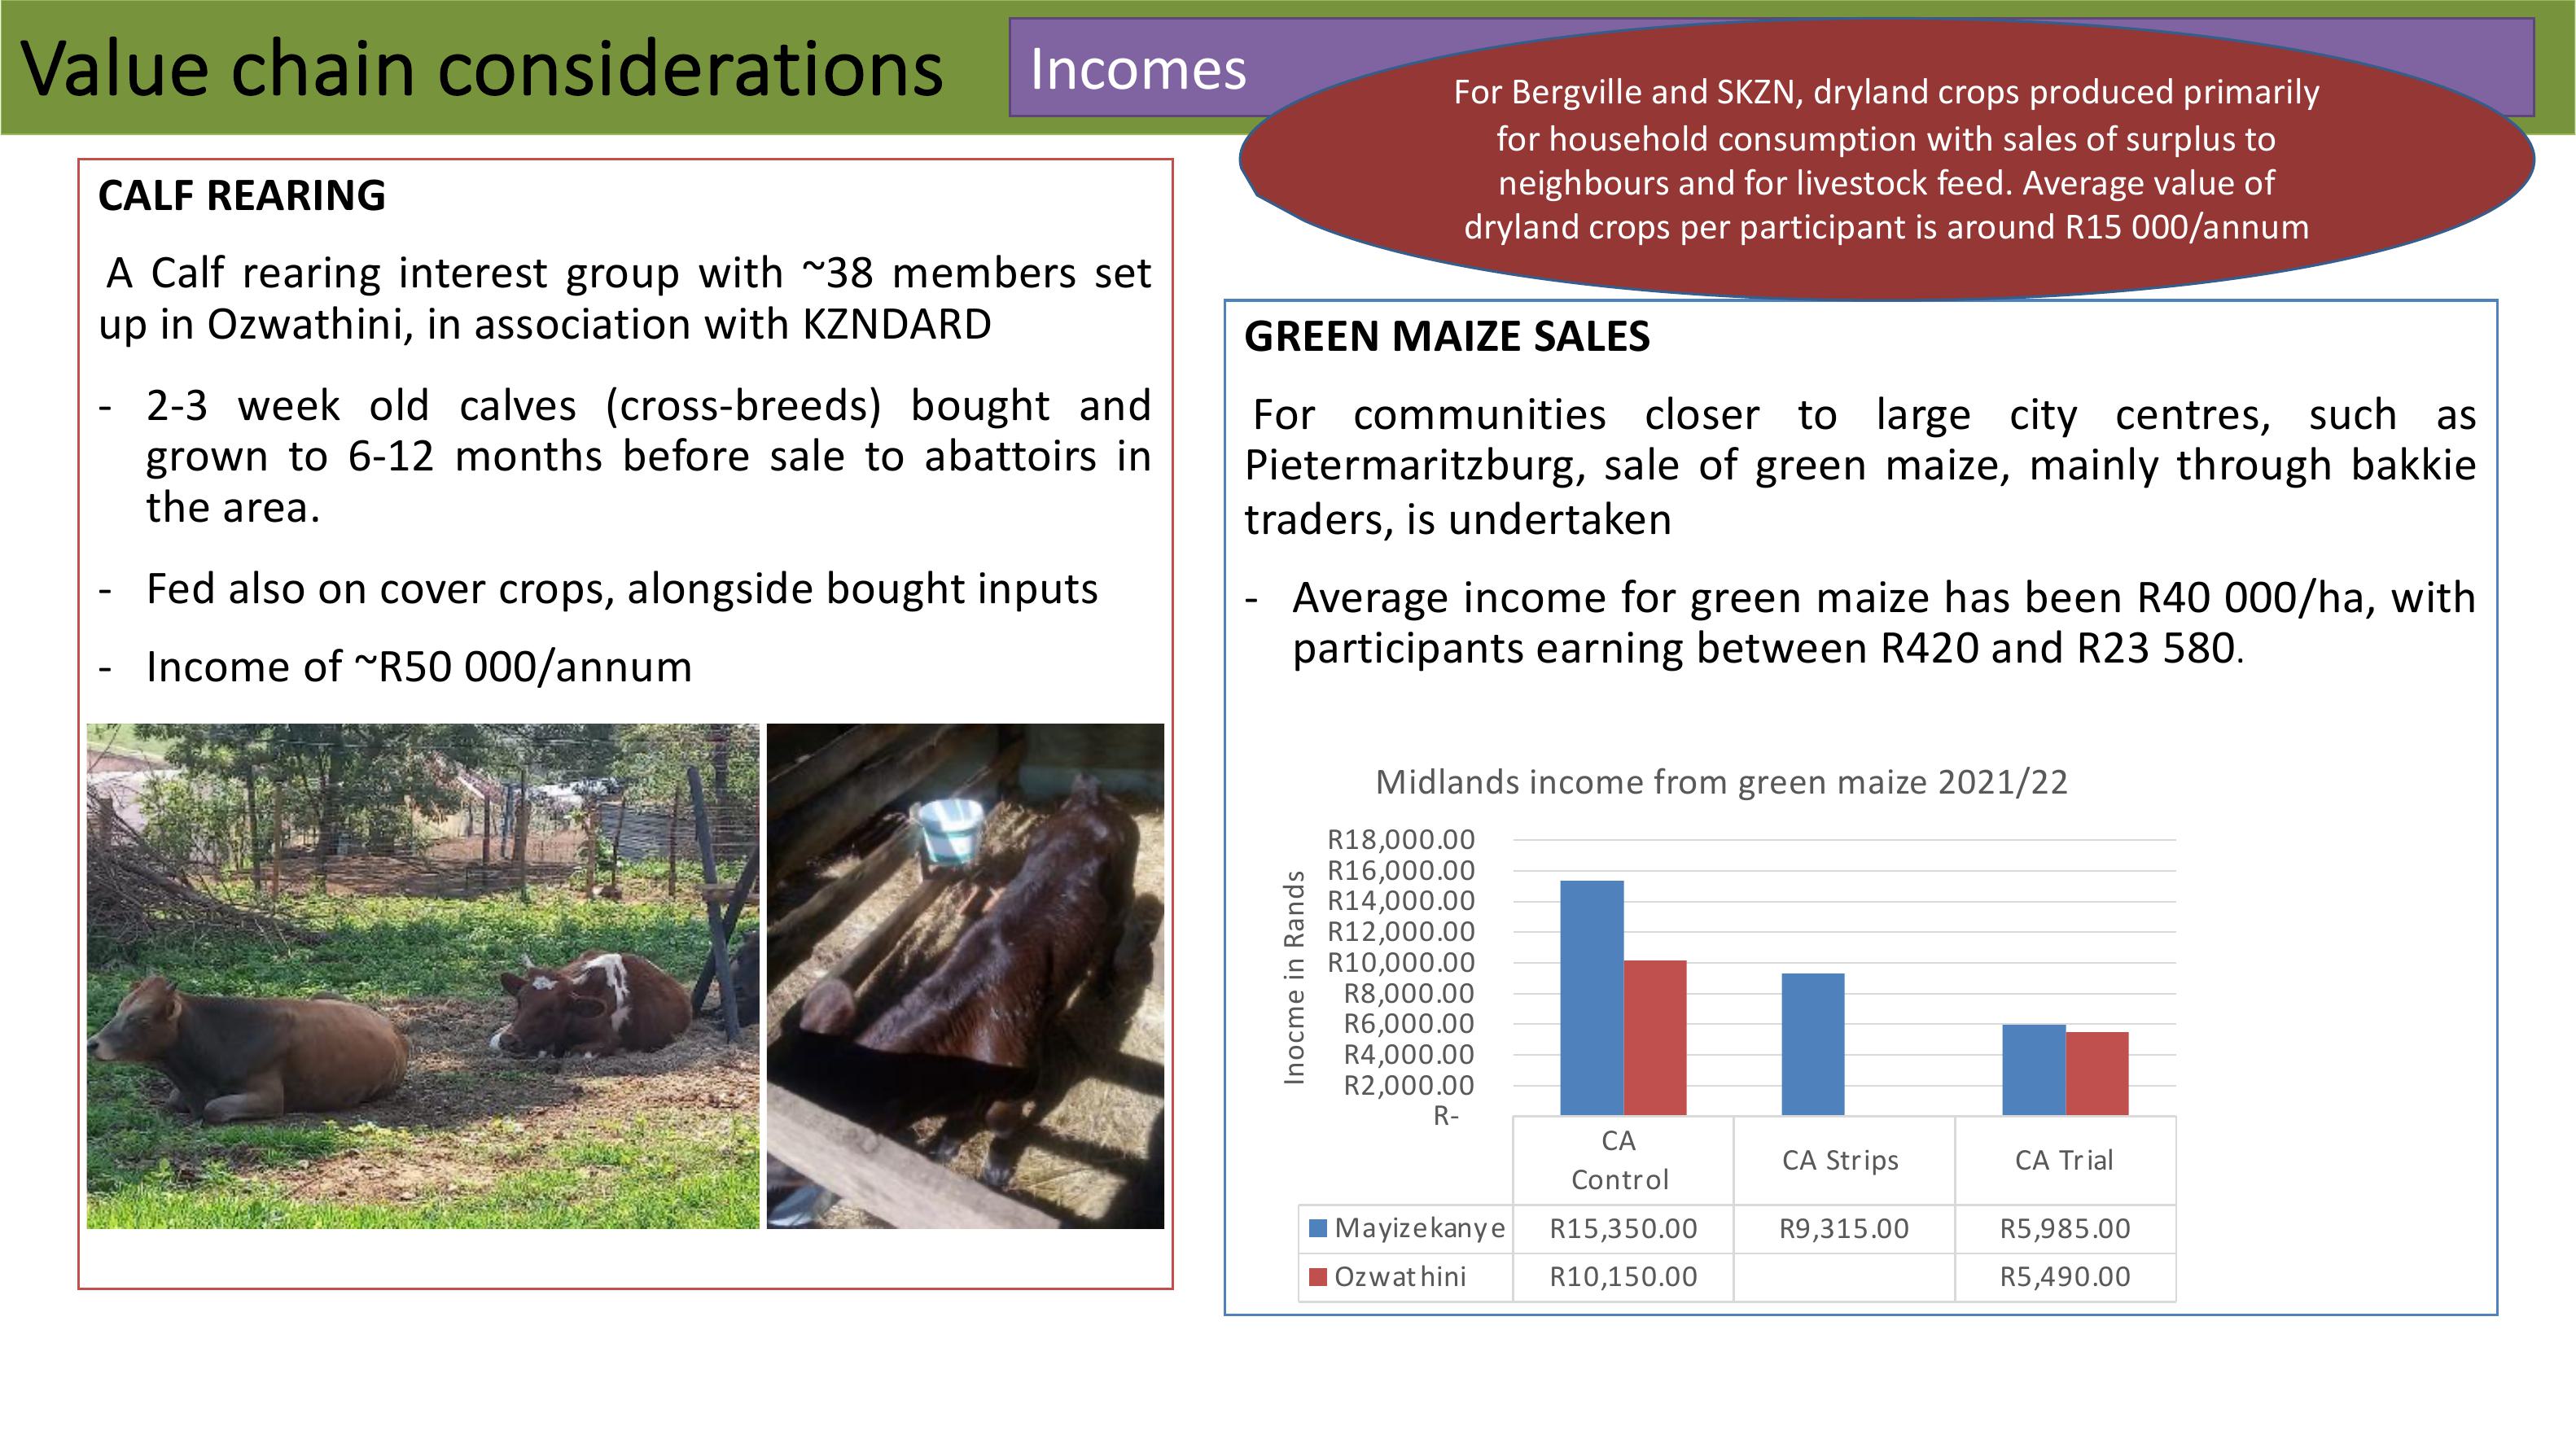
CALFREARING
A Calfrearinginterestgroupwith~38membersset
upinOzwathini, inassociationwithKZNDARD
-2-3weekoldcalves(cross-breeds)boughtand
grownto6-12monthsbeforesaletoabattoirsin
thearea.
-Fedalso oncovercrops,alongsideboughtinputs
-Incomeof~R50000/annum
Valuechainconsiderations
Incomes
GREENMAIZESALES
Forcommunitiesclosertolargecitycentres,suchas
Pietermaritzburg,saleofgreenmaize,mainlythroughbakkie
traders,isundertaken
-AverageincomeforgreenmaizehasbeenR40000/ha,with
participantsearningbetween R420and R23580.
CA
Control CA StripsCA Trial
Mayizekanye R15,350.00 R9,315.00R5,985.00
Ozwathini R10,150.00 R5,490.00
R-
R2,000.00
R4,000.00
R6,000.00
R8,000.00
R10,000.00
R12,000.00
R14,000.00
R16,000.00
R18,000.00
Inocme in Rands
Midlands income from green maize 2021/22
For Bergville and SKZN, dryland crops produced primarily
for householdconsumptionwith sales ofsurplusto
neighboursand for livestock feed. Average value of
dryland crops per participant is around R15 000/annum
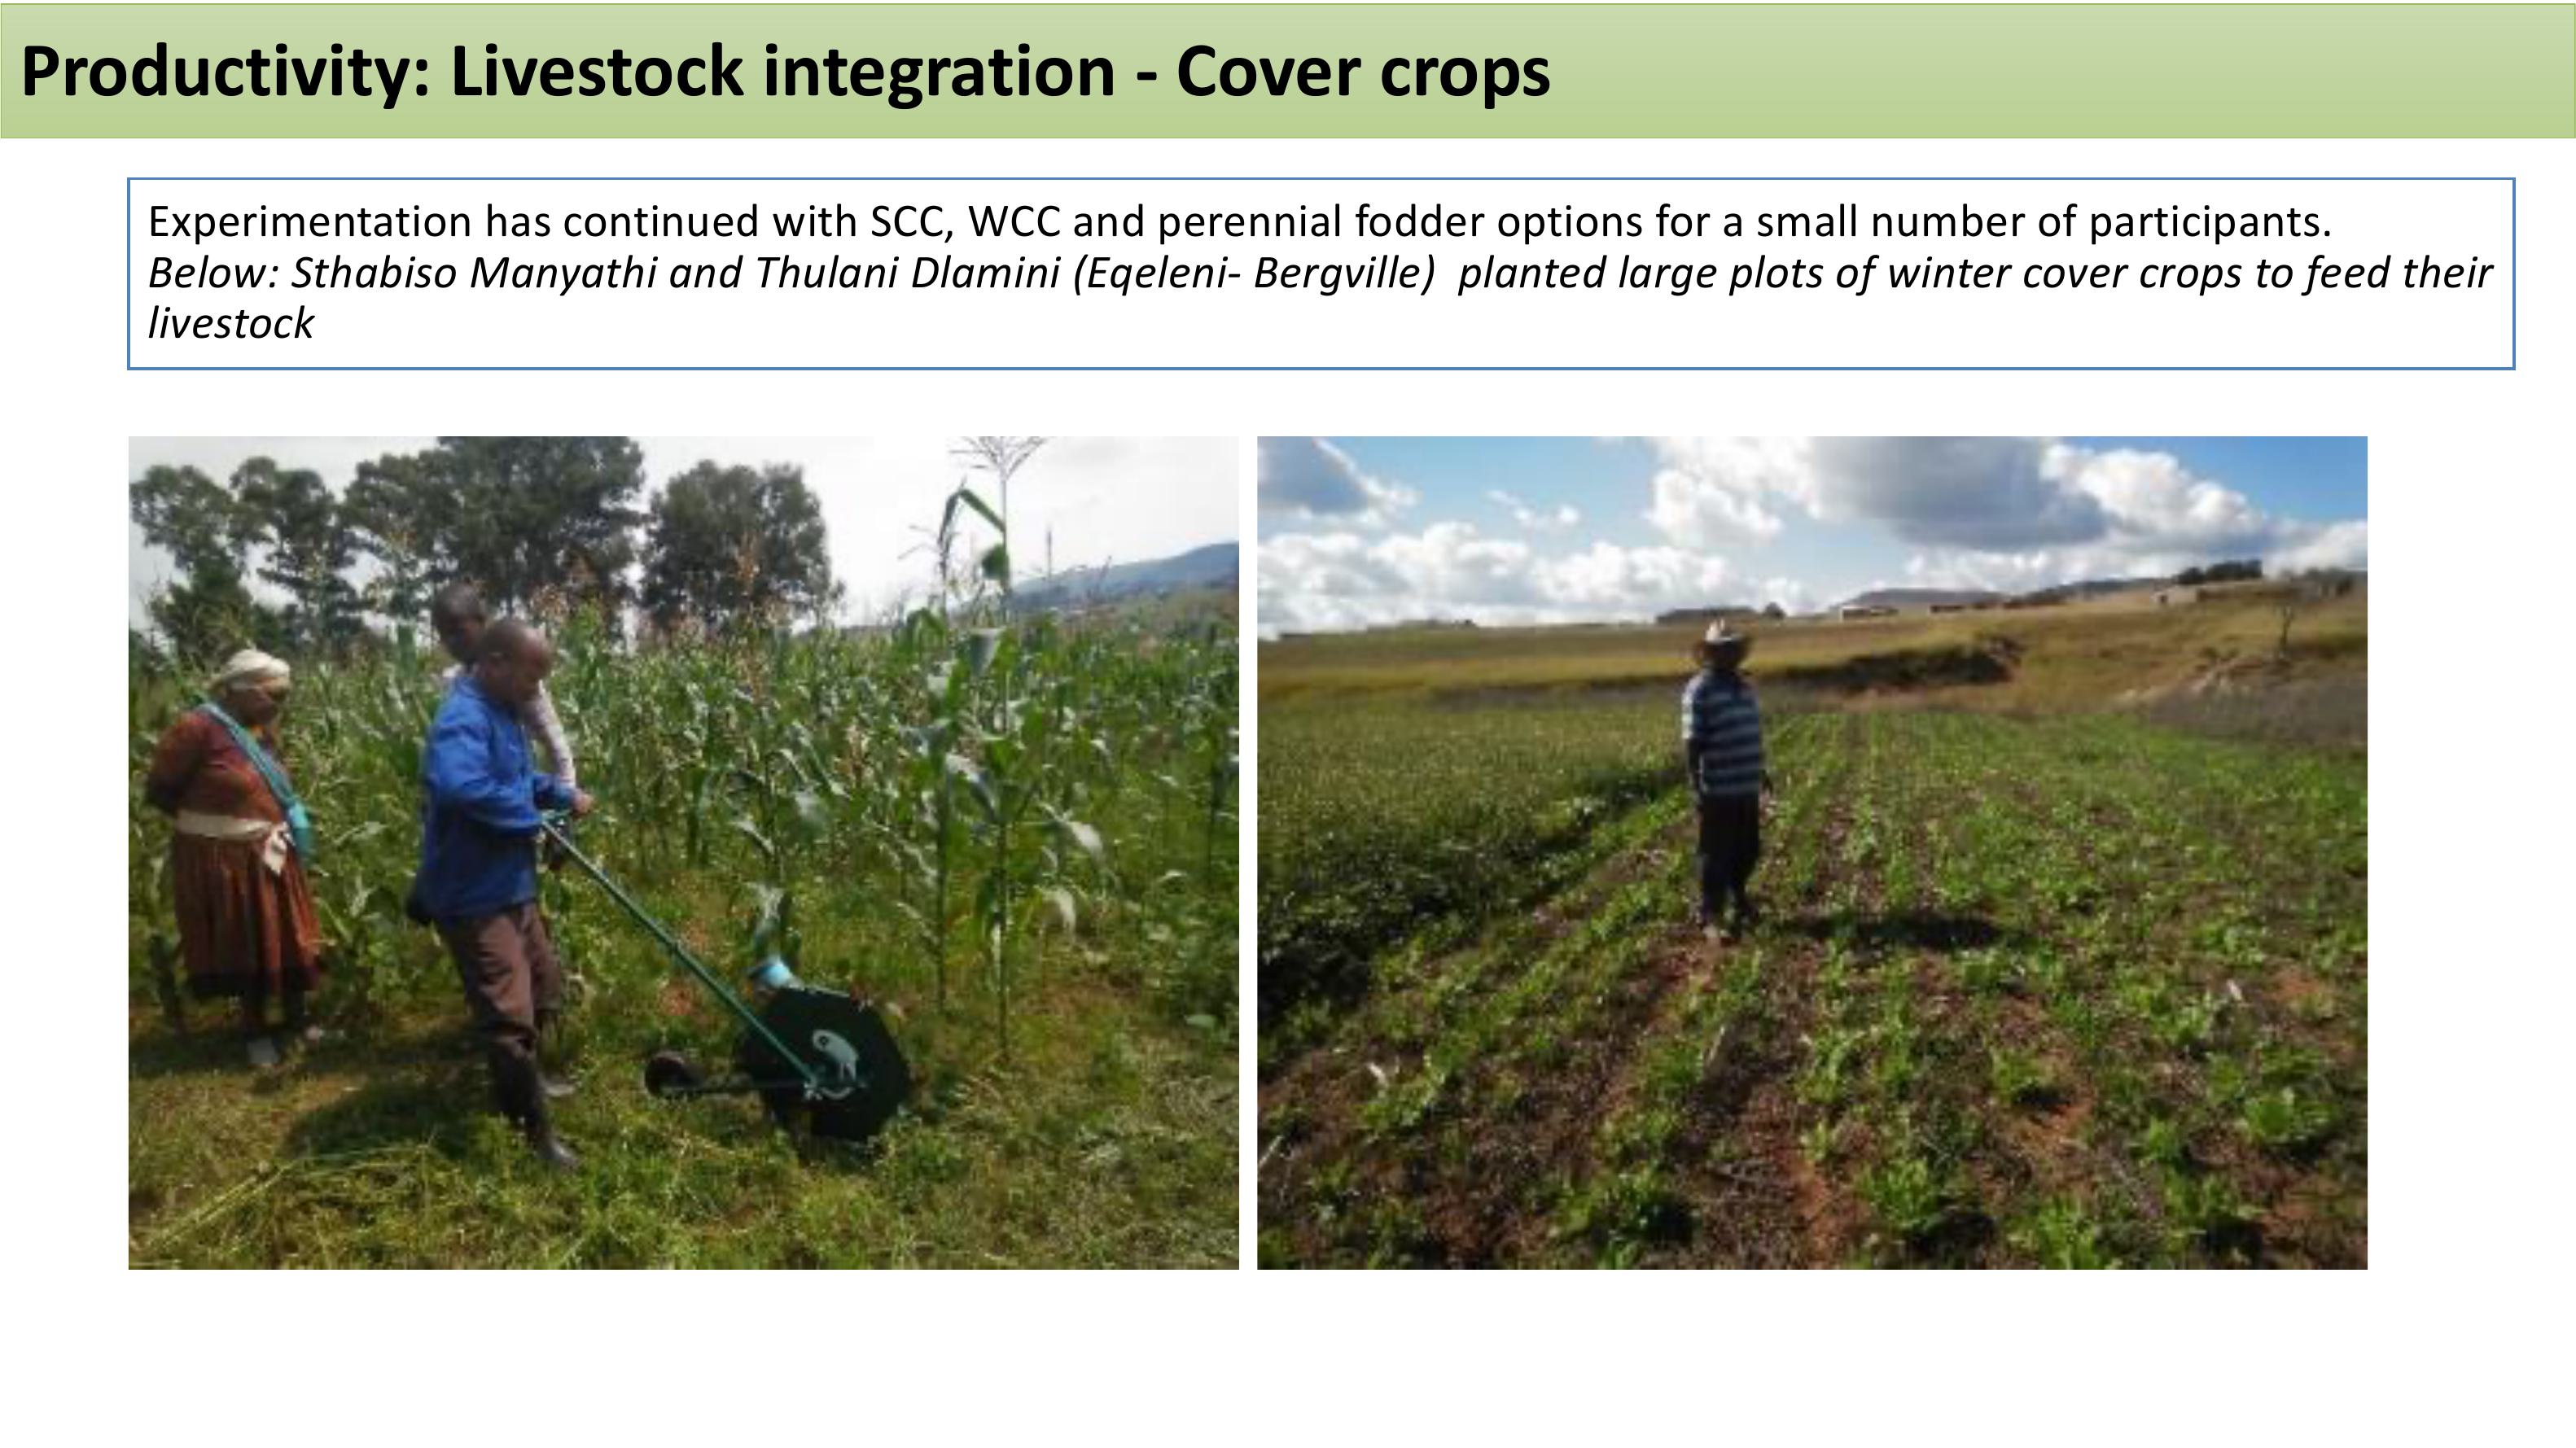
Experimentation has continued with SCC, WCC and perennial fodder options for a small number of participants.
Below: SthabisoManyathiand Thulani Dlamini (Eqeleni- Bergville) planted large plots of winter cover crops to feed their
livestock
Productivity: Livestock integration - Cover crops
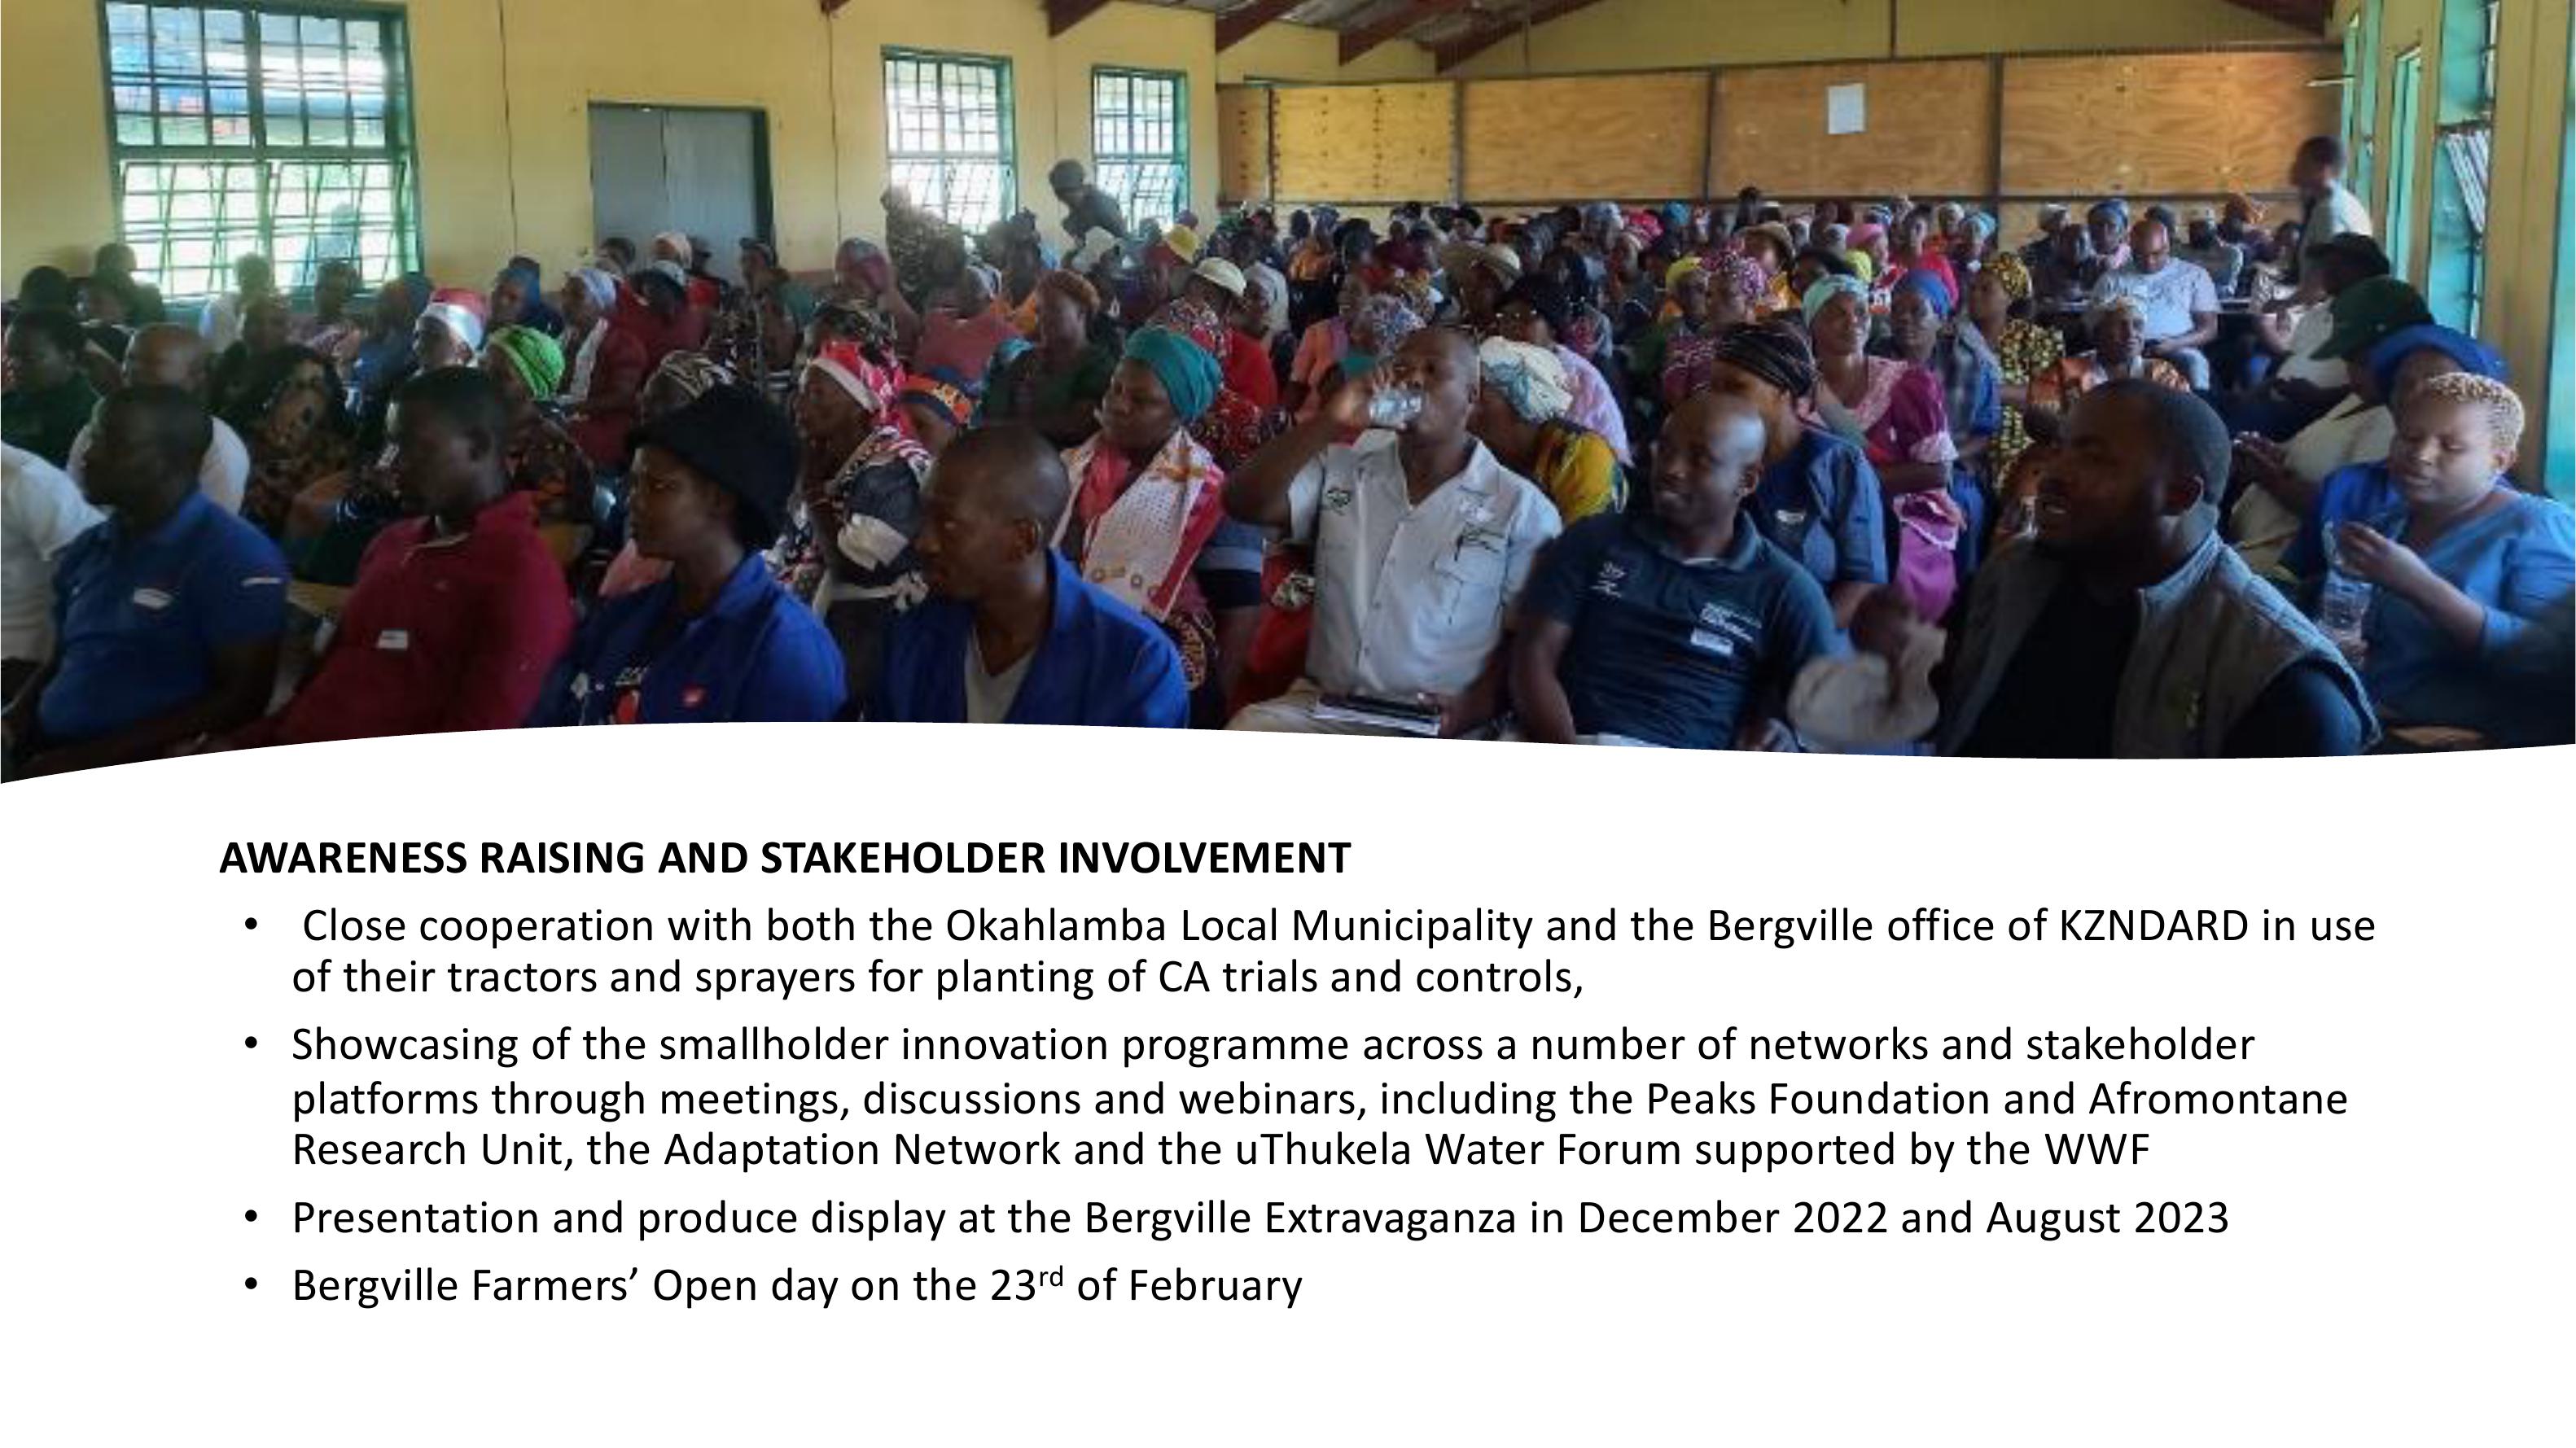
AWARENESSRAISINGANDSTAKEHOLDERINVOLVEMENT
•Close cooperation with both the OkahlambaLocal Municipality and the Bergville office of KZNDARD in use
of their tractors and sprayers for planting of CA trials and controls,
•Showcasing of the smallholder innovation programmeacross a number of networks and stakeholder
platforms through meetings, discussions and webinars, including the Peaks Foundation and Afromontane
ResearchUnit, the Adaptation Network and theuThukelaWaterForum supported bytheWWF
•Presentation and produce display at the Bergville Extravaganza in December 2022 and August 2023
•Bergville Farmers’ Open day on the 23rdof February
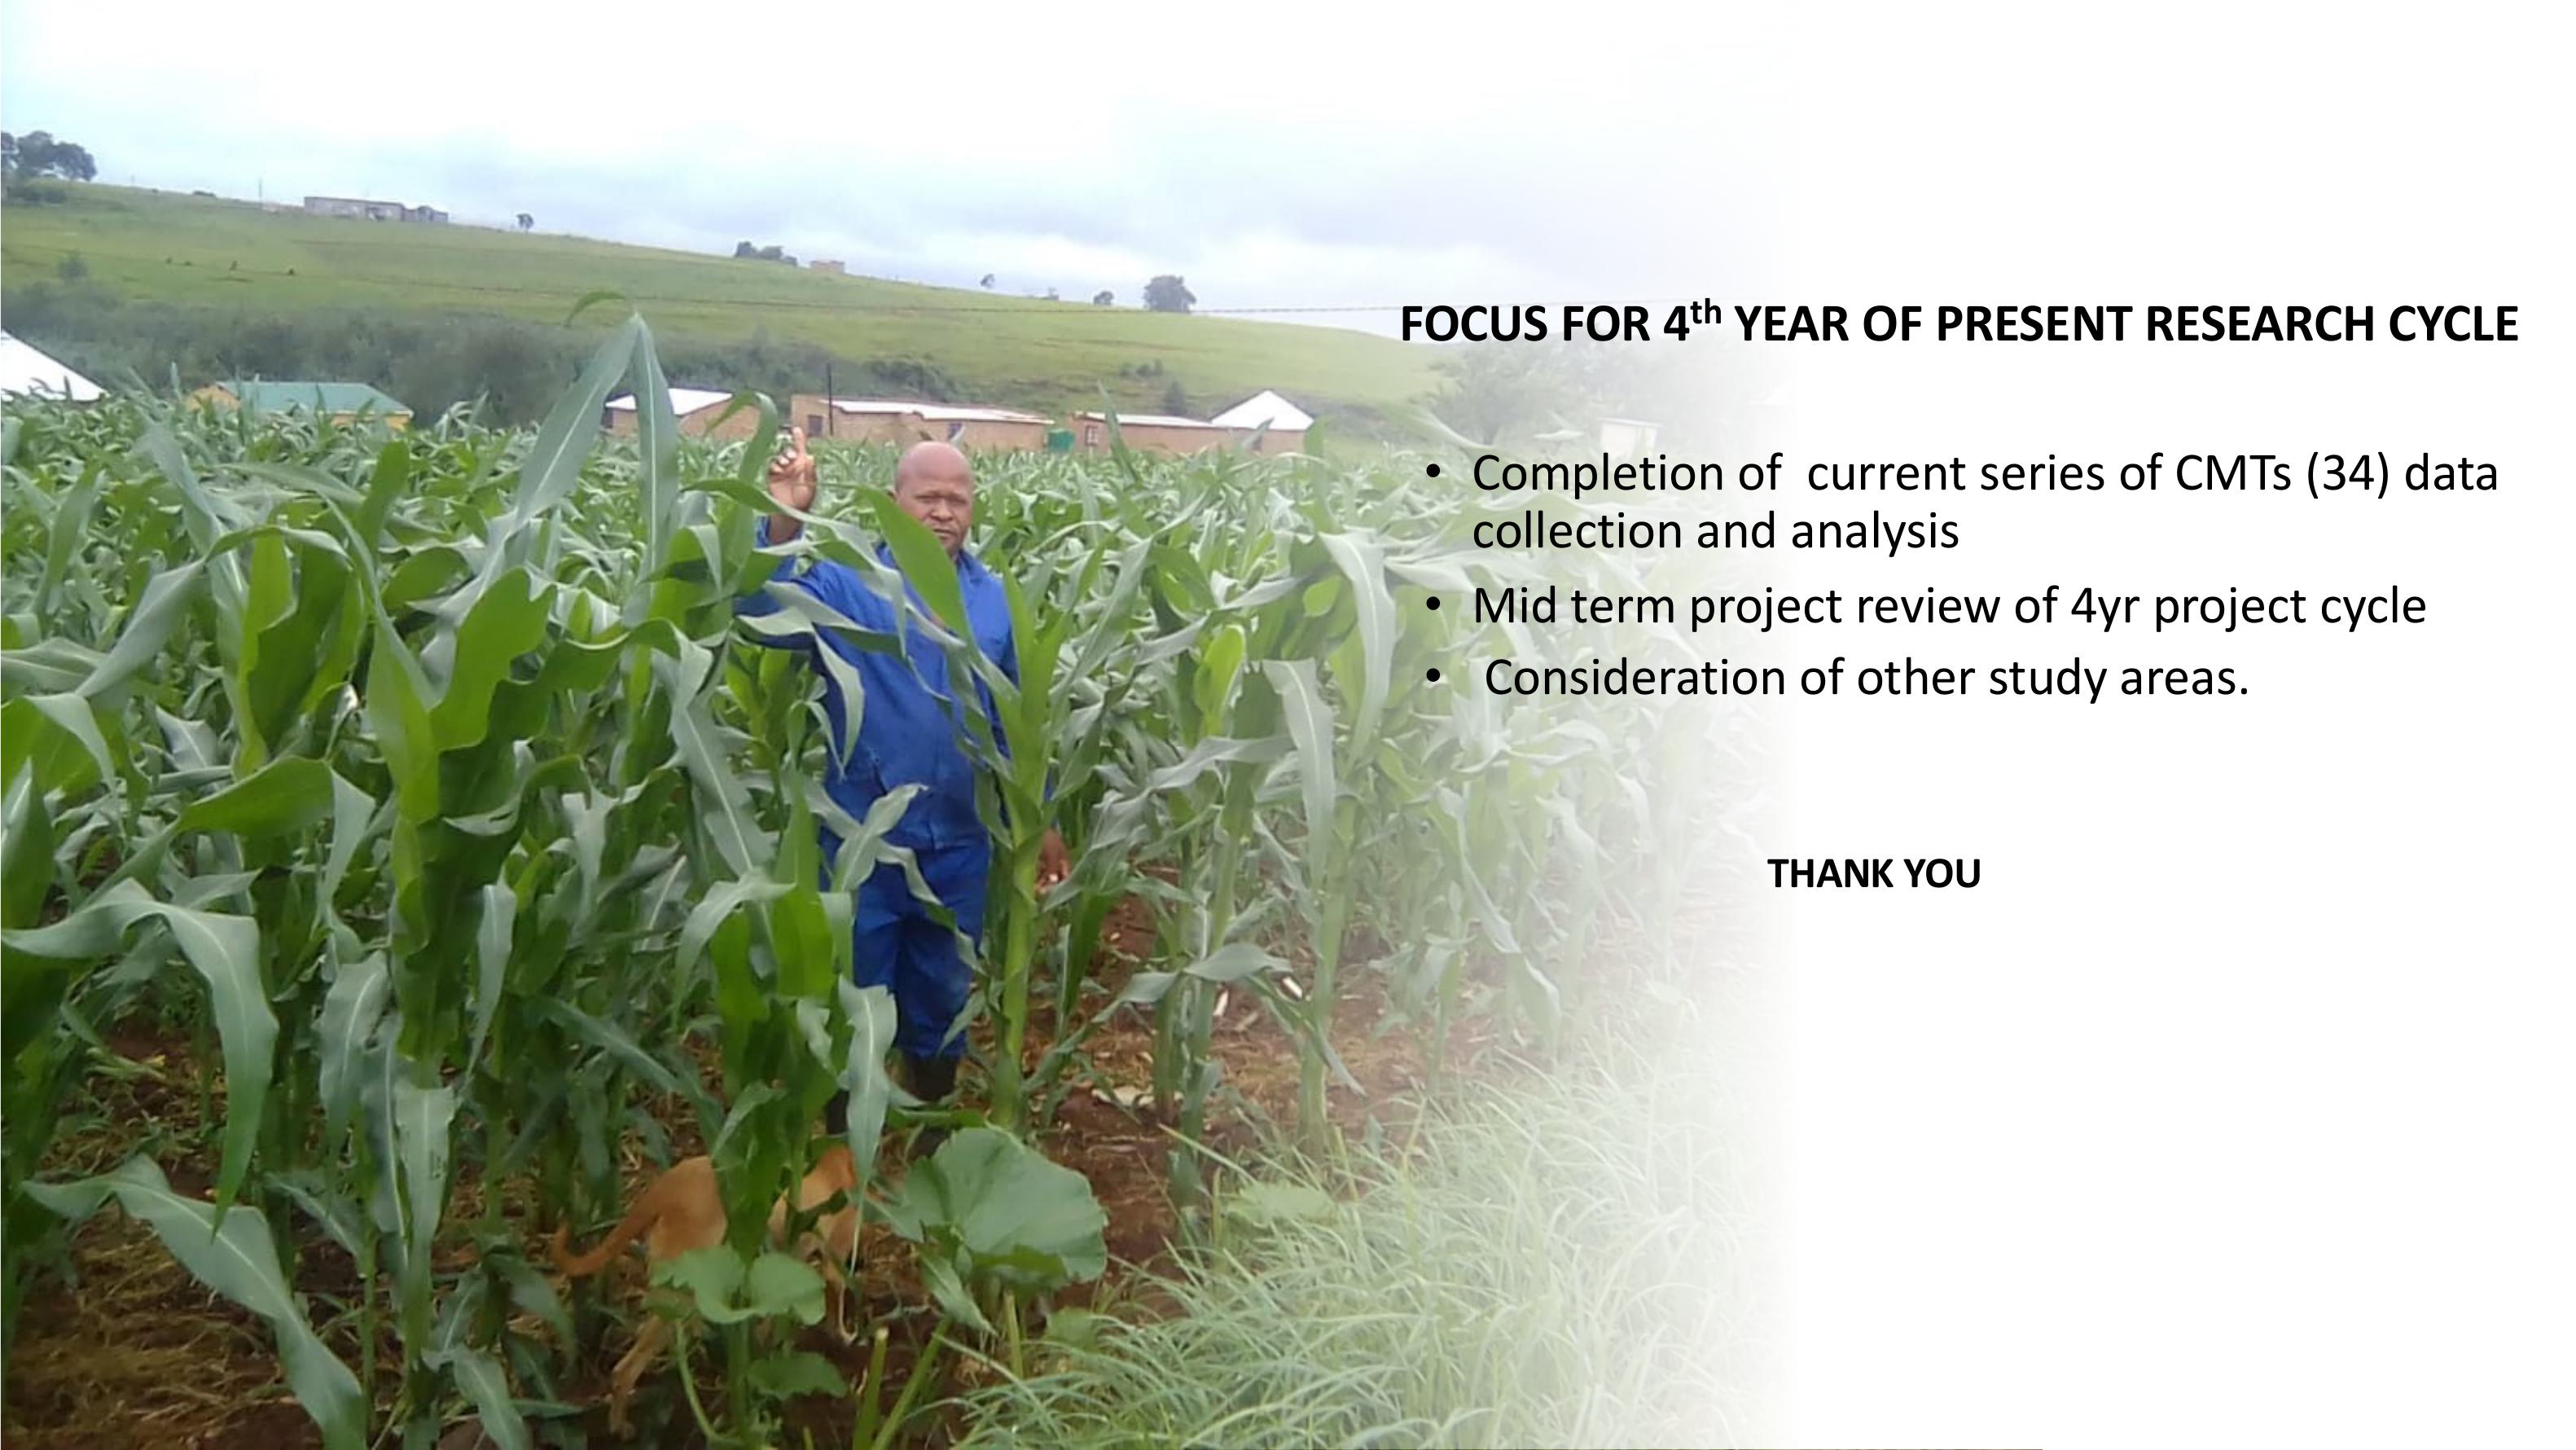
FOCUS FOR 4thYEAR OF PRESENT RESEARCH CYCLE
•Completion of current series of CMTs (34) data
collection and analysis
•Mid term project review of 4yr project cycle
•Consideration of other study areas.
THANK YOU