Climatesmartagriculture
Appropriate, well facilitated, site specific basket of options for water
management and climate change adaptation

Community
based
monitoring-
usingtraffic
lights!
SEDAWA,
Mmetja,
Oliphant's
Basin,
Limpopo, April
2017

Mulching,
mixed
cropping,
drip
irrigation
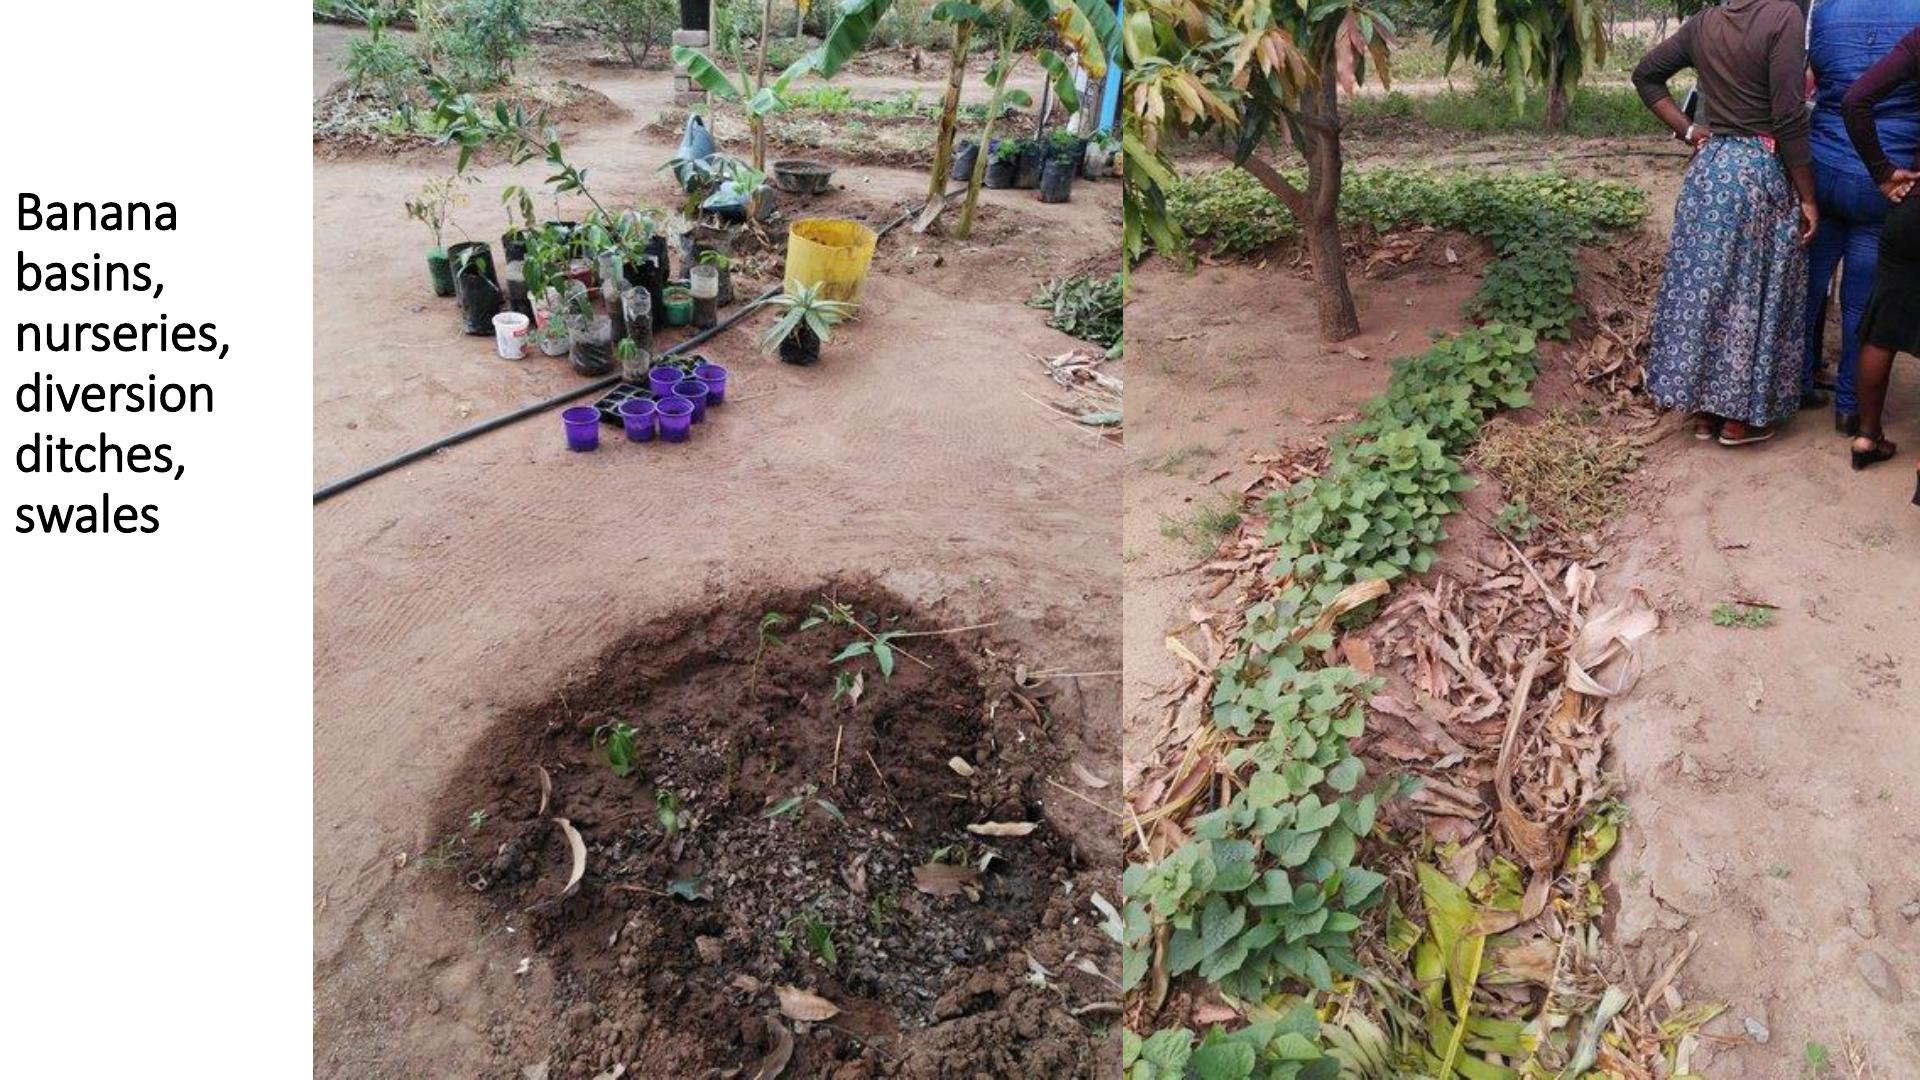
Banana
basins,
nurseries,
diversion
ditches,
swales

Local water
management
systems,
greywater
management
and use

Rainwater
harvestingand
storage options

Erosioncontrol –soil andwater
conservation techniques

Small livestock
integration-
fodder
production,
cut andcarry
systems,hay,
bedding….

Custombuilt
tunnelsfor
increased
productivity
–Climate
control,
water
productivity
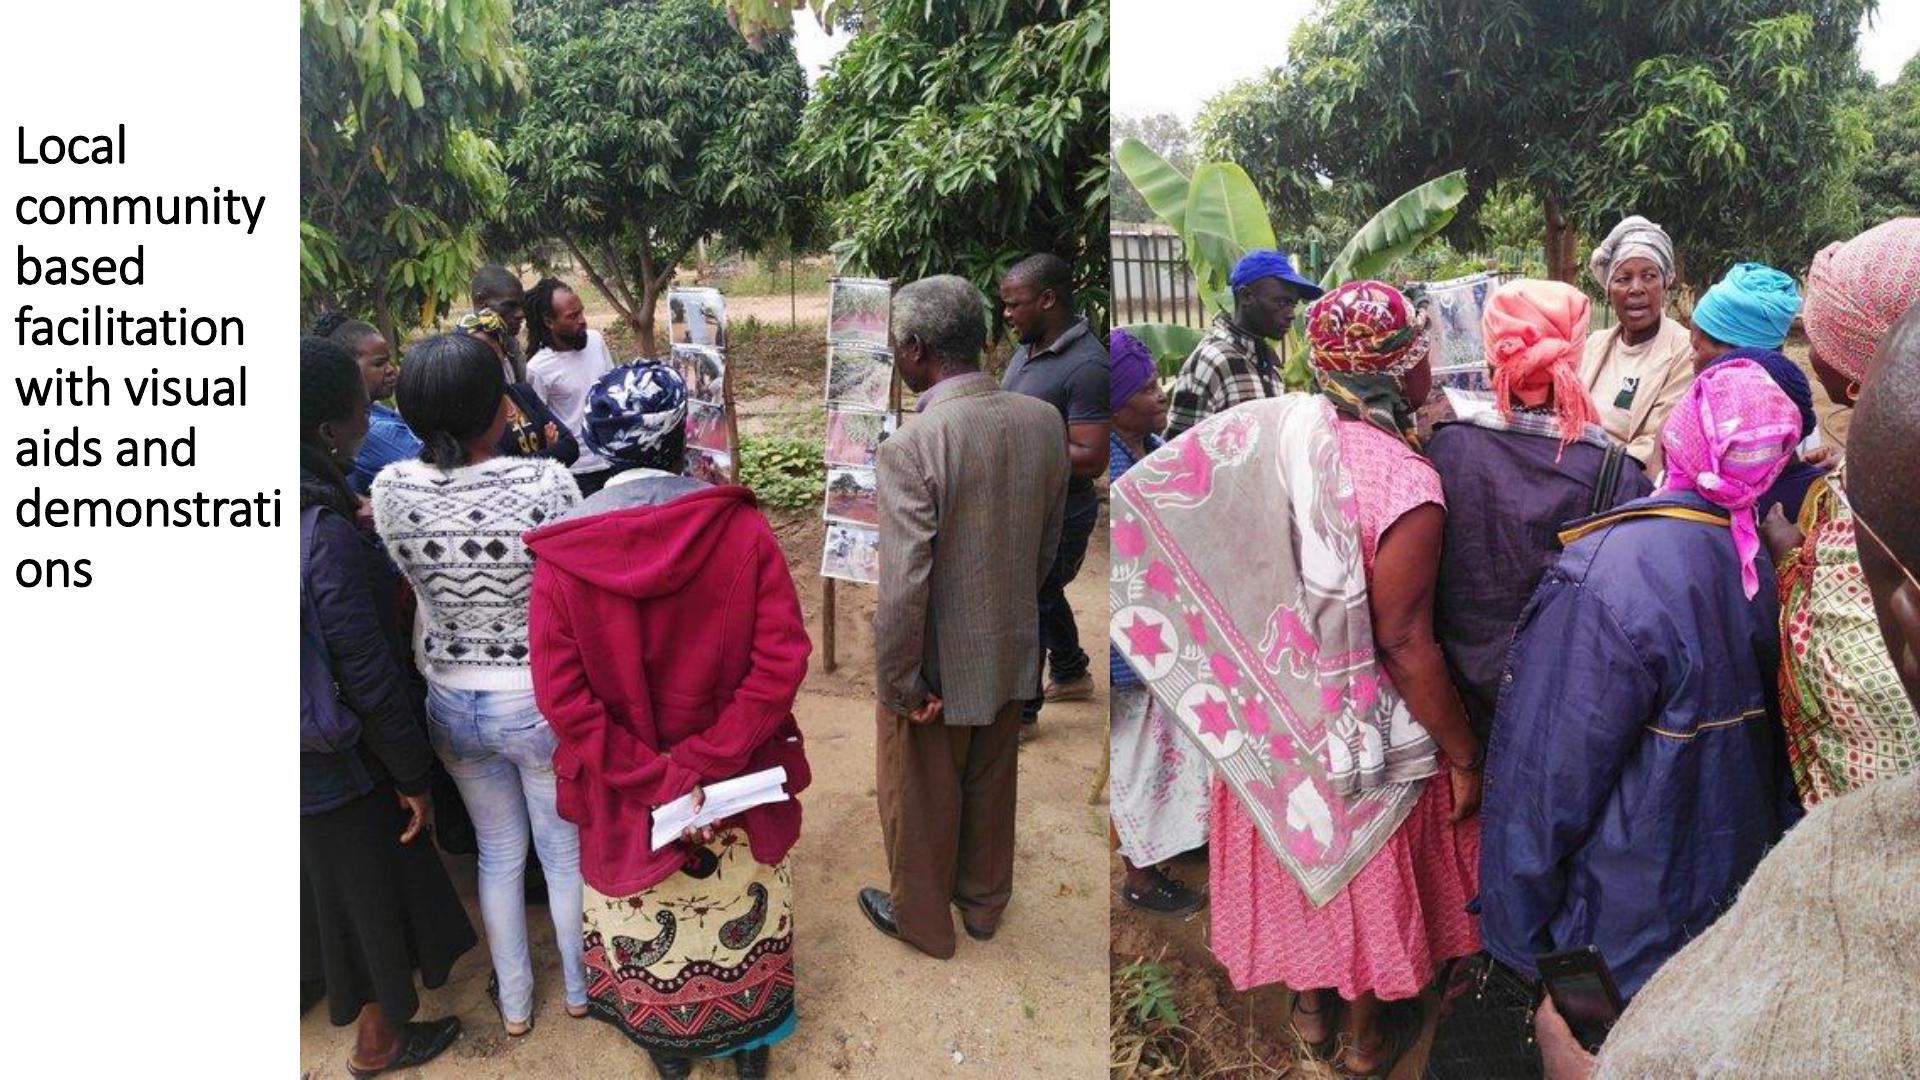
Local
community
based
facilitation
withvisual
aids and
demonstrati
ons

Stakeholderinvolvement, planning,
dissemination, research agendas

Conservation
agriculture-
dryland
cropping;
grain-legume
intercropping,
rotations,
cover crops
CA optimisation
and awarenss
raising. SFIP
GrainSA; KZ, EC,
Limpopo 2013-..

•Partnership: MDF, KZN DARD, Lima RDF, Siyazisiza Trust,KwaNalu, StratAct,
Ubuhlebezweand Mtshezi Municipality
•Villages savings and loans assocations and organised farmers
organisations and cooperatives to work within the whole value chain;
inputs- production- storage- marketing.
•Horizontal scaling model starting with a nodal village in each area and
expanding within and between villages:
•2013: 3 Villages EC and 3 in Bergville (total trial participants: 50)
•2014: 7 villages EC, 9 villages Bergville (Total trial participants: 100)
•2015: 8 villages EC, 10 Bergville, 2 Nkandla (total trial participants: 210)
•2016: 8 Villages EC; 2 Midlands, 17 Bergville
•Local capacity - Farmer volunteers, local facilitators, farmer centres (for each
node surrounded by 3-5 villagesclose by for equipment and input provision
awa production advice)
Description of Model and Process
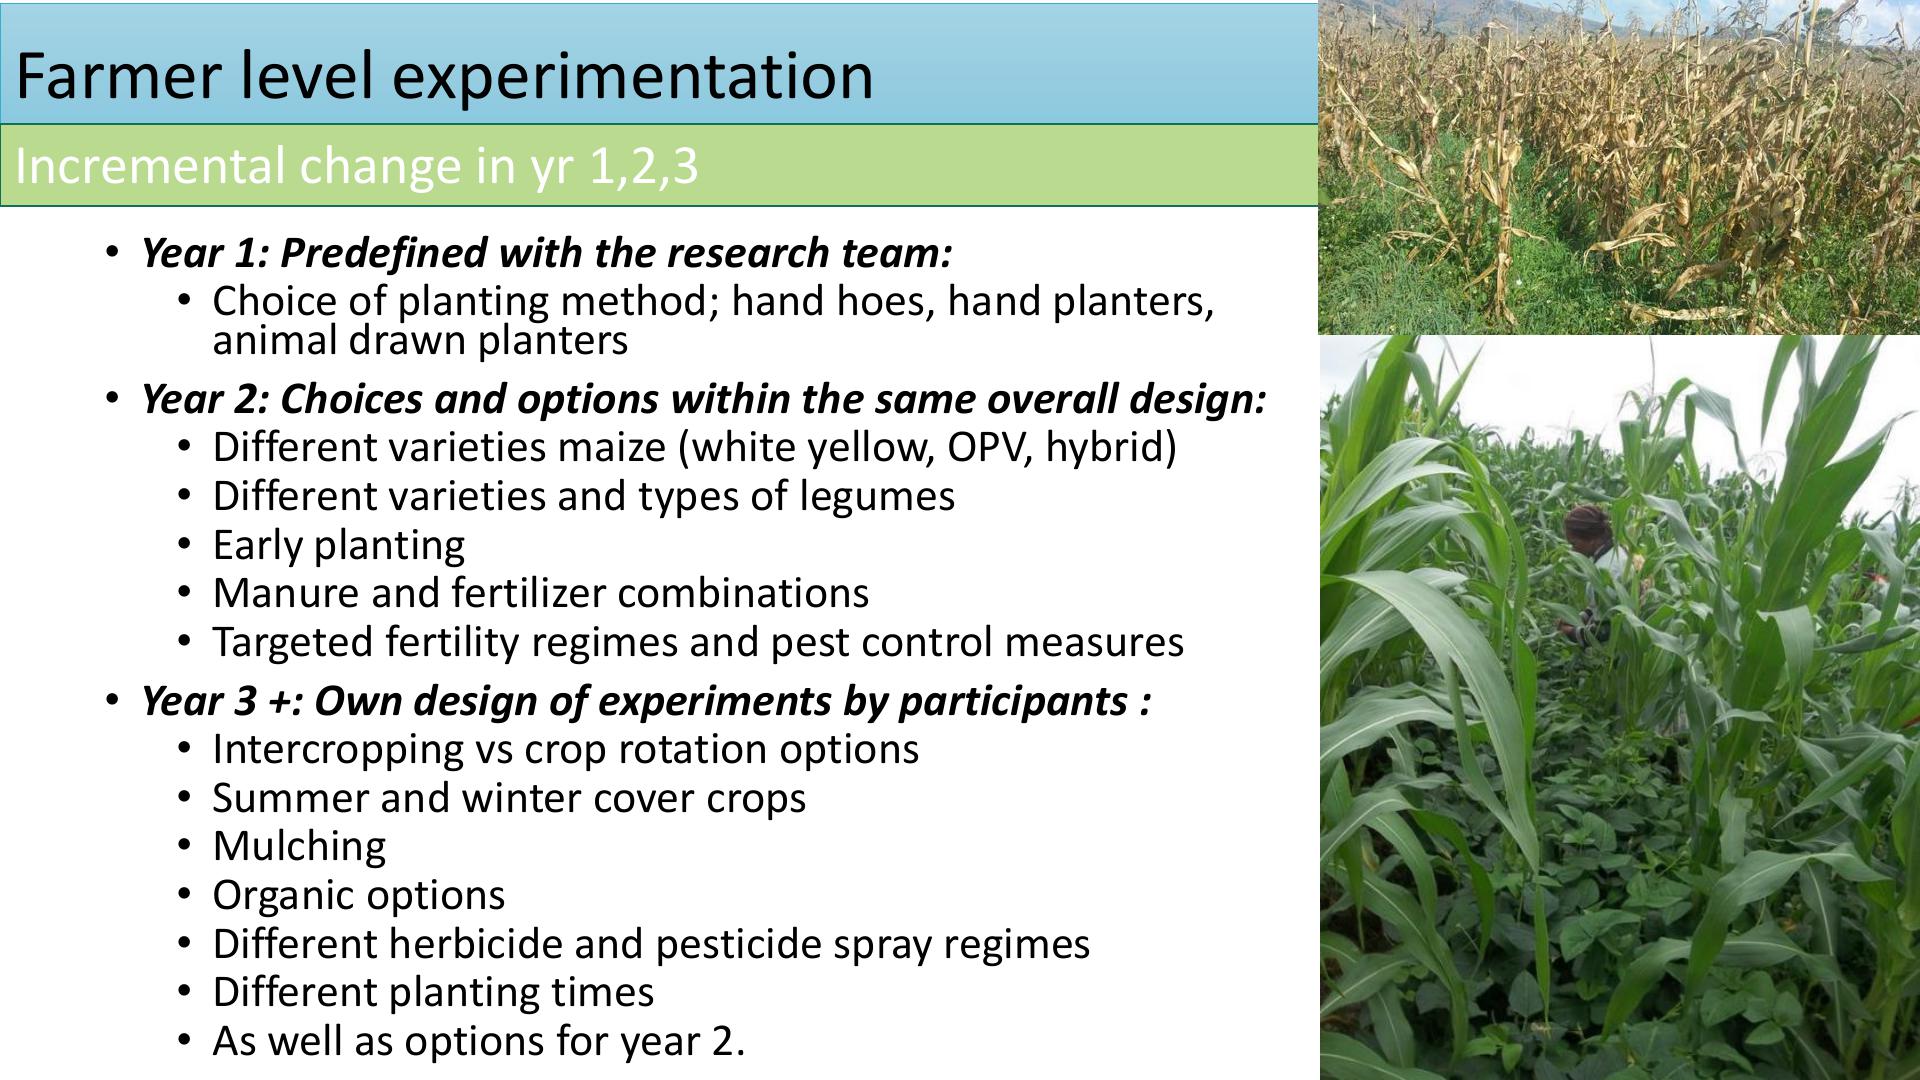
Farmer level experimentation
•Year 1: Predefined with the research team:
•Choice of planting method; hand hoes, hand planters,
animal drawn planters
•Year 2: Choices and options within the same overall design:
•Different varieties maize (white yellow, OPV, hybrid)
•Different varieties and types of legumes
•Early planting
•Manure and fertilizer combinations
•Targeted fertility regimes and pest control measures
•Year 3 +: Own design of experiments by participants :
•Intercropping vs crop rotation options
•Summer and winter cover crops
•Mulching
•Organic options
•Different herbicide and pesticide spray regimes
•Different planting times
•As well as options for year 2.
Incremental change in yr 1,2,3

•Minimal soil disturbance
•Soil cover
•Diversity
•Clockwise: Animal drawn no
till planter. ‘Weeding
wheel’.Matracca jab planter,
MBLI planter
•Below: Planters
Conservation Agriculture: All three principles
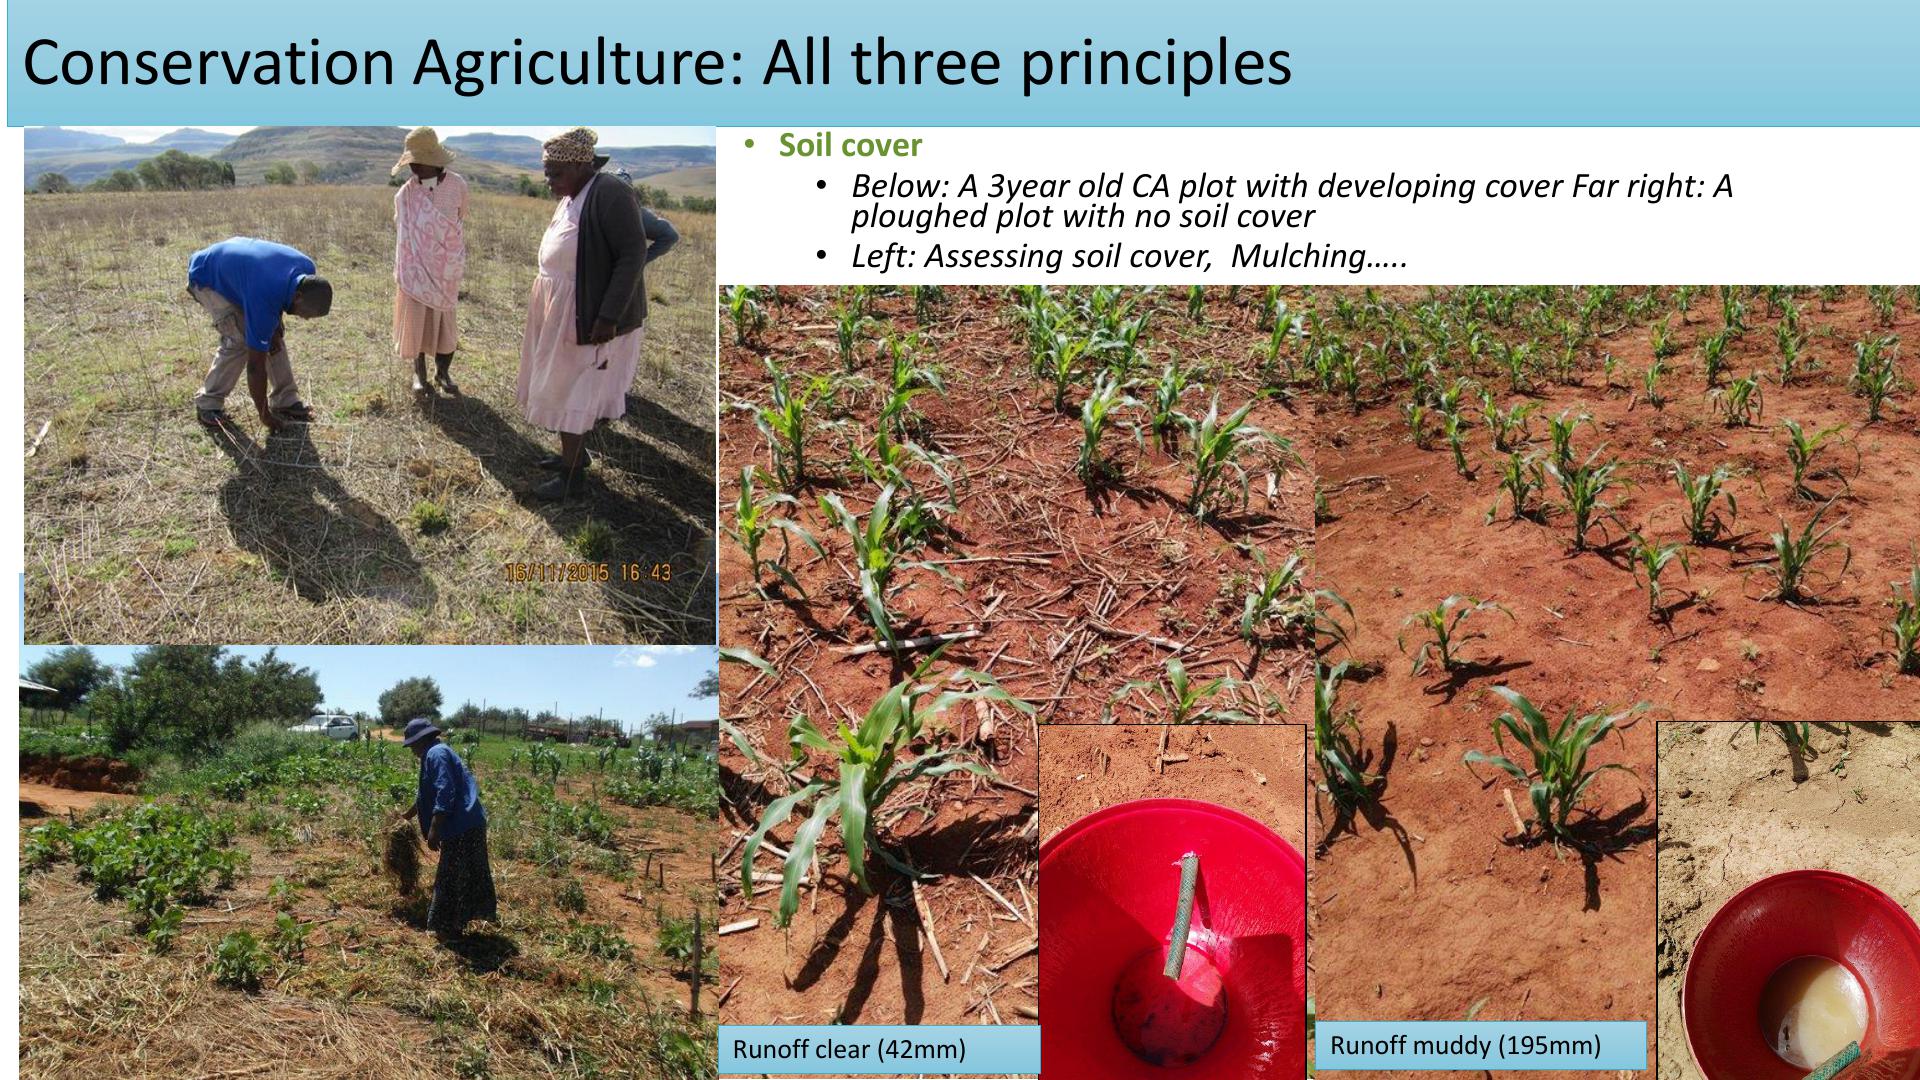
•Soil cover
•Below: A 3year old CA plot with developing cover Far right: A
ploughed plot with no soilcover
•Left: Assessing soil cover, Mulching…..
Conservation Agriculture: All three principles
Runoff muddy (195mm)
Runoff clear (42mm)

•Minimal soil disturbance
•Soil cover
•Diversity
•- Intercropping –close
spacing for canopy and
weed control
•- Cover crops; summer
and winter –relay
cropping and single block
plantings
•Right: Maize (PAN 6479)
and bean (Dolichos)
intercrop –Smephi
Hlatshwayo - Eqeleni
Conservation Agriculture: All three principles

•3-4 years: Reduced need for herbicide no spraying on
trial plots this season
•Increased organic matter, reduced fertilizer requirements
- No basal fertilizer applied- only top dressing
•Reduced runoff
•Increased yields and diversity
Bergville_Case studyMphumelele Hlongwane- Ezibomvini

t/ha
2016
2017
Maize (Control)
-CA
7,8
9,7
Maize Trial CA
- combined
6,93
8,3
Beans
0,25
1,81
Sunflower
0,3
0,8
•EXPERIMENTS: Inter- cropping, crop
rotation, legumes, scc, wcc
•Runoff plots: CA (1,1mm/event) vs
Conventional control (3,1mm/event)
•Infiltration: Ca (247mm/hr) vs
Control (50mm/hr)
•Soil health:
•SOLVITA; CA (68ppmC) vs CA Control
(63ppmC) moderate to high, limited need
for N, Ideal state of biological activity and
adequate organic matter
•AGGREGATE STABILITY: CA (55) CA Control
(33) -higher aggregate stability for the
plots with crop diversification-highest for
inclusion of scc mixes and Lab-Lab
•% OM: CA average (3 ,47%), Veld
Baseline (2,5%) –accumulation of organic
matter in CA plots-now higher than veld
baseline benchmark
•9-30kg/ha of immediate release N in the
soil in CA plots –valued at a saving of
R320-R530/ha of N now supplied through
cropping practices that build soil health.
(10)
M + B
(5)
LL
Control plot
(8)
M + B
(6)
M +LL
(3) M + SCC
+WCC
Contro
l plot
(9)
M + CP
(7)
M + CP
(4)
M + B
(2)Sunn
hemp,
millet and
sunflower
(1)
M + B
Legend: M –Maize; B –Beans; CP –Cowpea; LL –Lab Lab; SCC –summer cover crop WCC –
winter cover crop
Bergville_Case study_cont

MEASURABLE CHANGES
PRACTICES:
•-Reduced tillage (linked to time.. 1yr,2yrs, 3yrs etc),
•-Increased soil cover (5-10%, 10-15%, 15-25%)
•Increased diversity (1crop, 2 crops, 3 crops, >3 crops -intercropping or
crop rotation),
•Improved social organisation (learning groups y/n, collective work
groups y/n, , Cooperative y/n)
•Increased access to finances (savings groups y/n, savings and loans for
inputs y/n)
LEADING TO:
•Increased production/yield (compared to controls)
•Improved livelihoods (increased food supply y/n, increased income
y/n)
•Increased carbon (tricky to prove; tests variable depending on
weather, timing, depth of tests- …)
•Reduced erosion/run-off/increased infiltration (Quite a mission to test
but benchmarks possible)
•Improved soilstructure (also not easy to measure or show –but
definitely positive over time)
•Improved soil health (overallshowing positive trends but a lot of
variability between years)……
PES options
Use opportunity costs
to determine level of
payment,
Funding period; long
term funding instruments
–avoid R&D and pilot
project design
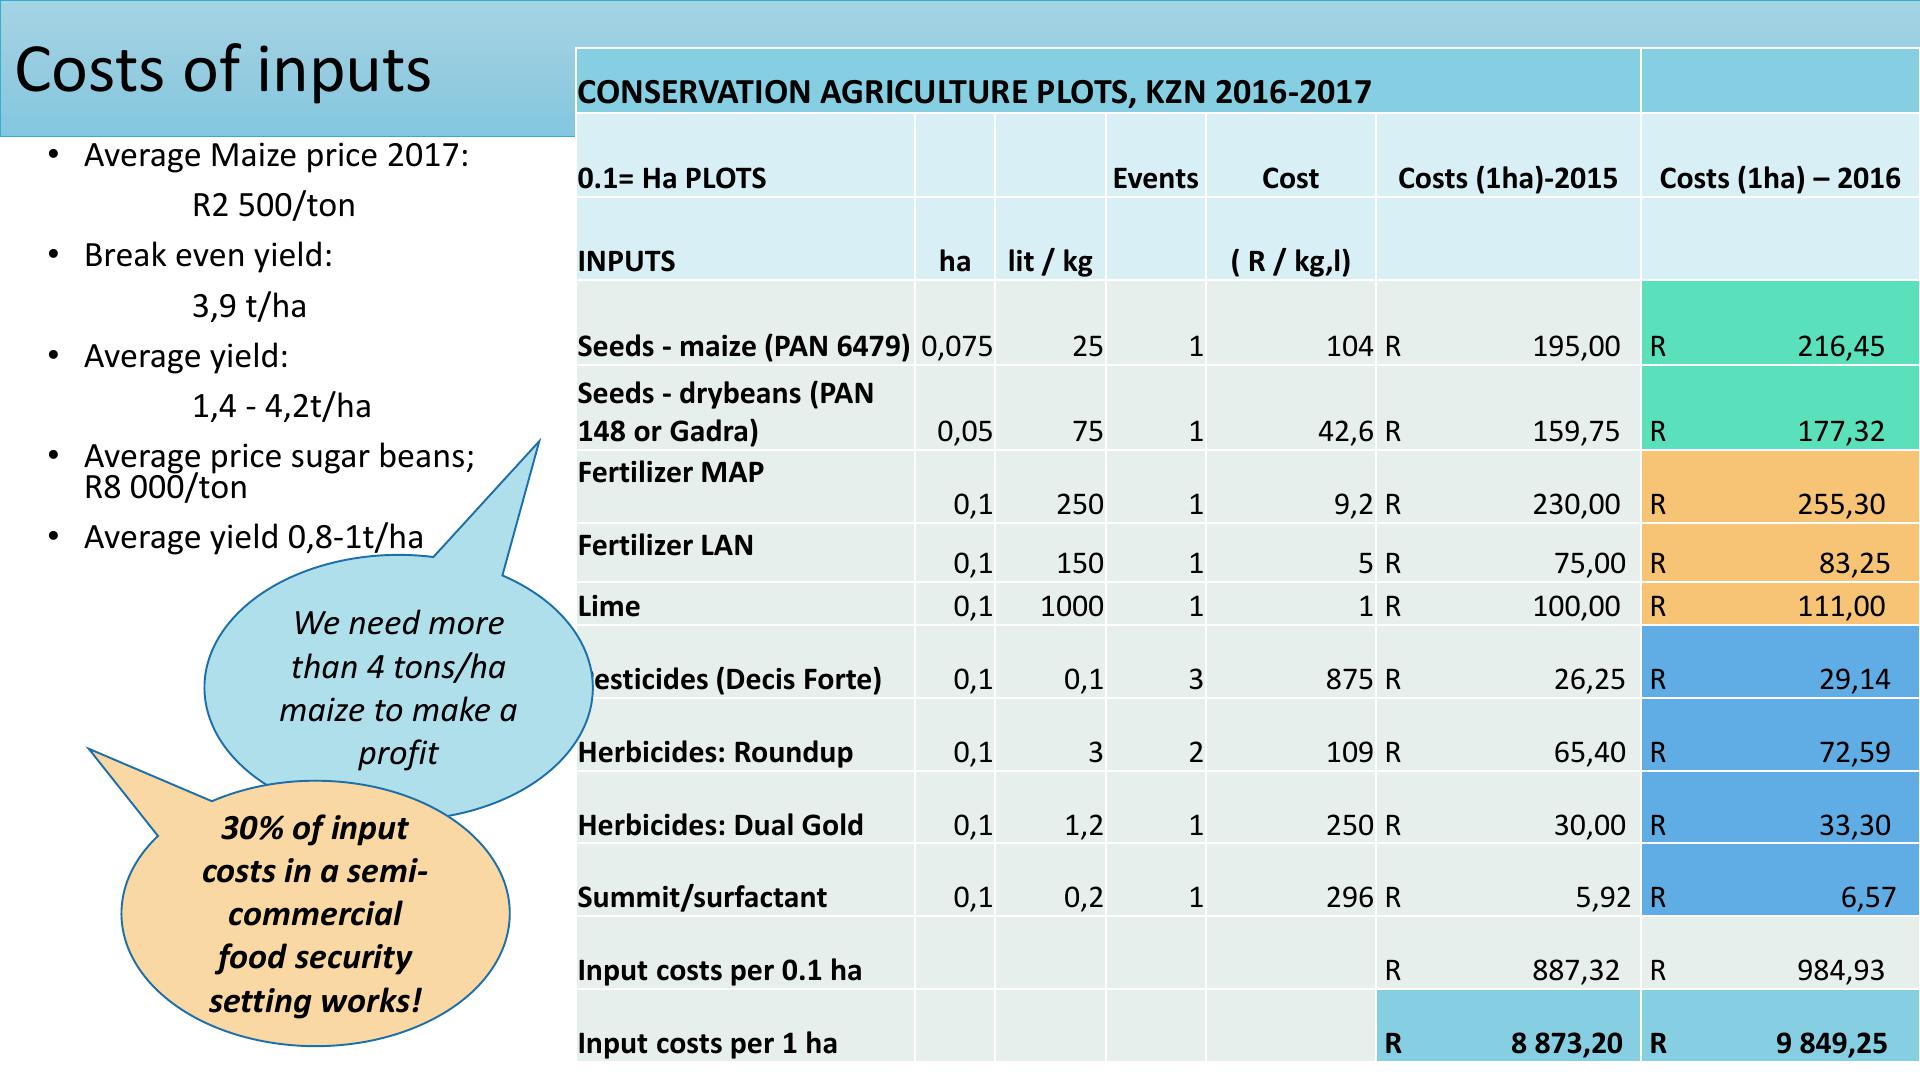
•Average Maize price 2017:
R2 500/ton
•Break even yield:
3,9 t/ha
•Average yield:
1,4 - 4,2t/ha
•Average price sugar beans;
R8 000/ton
•Average yield 0,8-1t/ha
Costs of inputs
CONSERVATION AGRICULTURE PLOTS, KZN 2016
-2017
0.1= Ha PLOTS
Events
CostCosts (1ha)-2015
Costs (1ha)
–
2016
INPUTS
ha
lit / kg
( R / kg,l)
Seeds
-
maize (PAN 6479)
0,075
25
1
104
R 195,00
R 216,45
Seeds
- drybeans (PAN
148 or
Gadra)
0,05
75
1
42,6
R 159,75
R 177,32
Fertilizer MAP
0,1
250
1
9,2
R 230,00
R 255,30
Fertilizer LAN
0,1
150
1
5
R 75,00
R 83,25
Lime
0,1
1000
1
1
R 100,00
R 111,00
Pesticides (
Decis Forte)
0,1
0,1
3
875
R 26,25
R 29,14
Herbicides: Roundup
0,1
3
2
109
R 65,40
R 72,59
Herbicides: Dual Gold
0,1
1,2
1
250
R 30,00
R 33,30
Summit/surfactant
0,1
0,2
1
296
R 5,92
R 6,57
Input costs per 0.1 ha
R 887,32
R 984,93
Input costs per 1 ha
R 8 873,20
R 9 849,25
We need more
than 4 tons/ha
maize to make a
profit
30% of input
costs in a semi-
commercial
foodsecurity
setting works!